

The Bland and Altman (BA) method( Reference Bland and Altman 1 ) has been routinely used for assessing relative agreement between two dietary methods. The rationale for doing this, typically, is that, although the reference method – or gold standard – is deemed to be more accurate, it also has substantial participant burden to complete and resources to analyse. Often, the FFQ method is compared against food records, either weighed or unweighed, or against repeated 24-h dietary recalls. FFQ are easier to implement, less burdensome for participants to complete and less costly to analyse( Reference Willett 2 ). It is necessary to demonstrate that FFQ results are equivalent to a reference method before it can be used with confidence. Interpretation of the results of the BA method is straightforward when it is clear that the methods do not agree. In practice, this is defined by a large and statistically significant bias using a dependent samples test (paired t test or Wilcoxon’s matched pairs test). However, difficulty arises in determining equivalence of two dietary methods when they are shown by the BA method to be in agreement. For example, a bias of 837 kJ with a limits of agreement (LOA) of −5192 to 6865 kJ was defined as ‘reasonably acceptable’ agreement in a study( Reference Fernández-Ballart, Piñol and Zazpe 3 ) comparing a FFQ with an estimated food diary. Likewise, compared with a 24 h recall (24HR), a FFQ was reported to have a bias of 1091 kJ with a limit of agreement of −2792 to 4974 kJ( Reference Hjartaker, Andersen and Lund 4 ). This was described as ‘performing well’ and was considered to have ‘fair’ or ‘adequate’ agreement despite the large and statistically significant bias and wide LOA. These two examples demonstrate a lack of consideration on what constitutes a clinically acceptable difference between dietary methods. The LOA in these studies encompass a range of intake between 7766 and 12 056 kJ, which is the magnitude of intake that represents the entire recommended daily intake for an adult (i.e. 8400–11 700 kJ( 5 , 6 )). This is clearly undesirable, yet appears to be the current practice in the published nutrition literature. As Bland and Altman( Reference Bland and Altman 7 ) themselves stated, ‘How far apart measurements can be without leading to problems will depend on the use to which the result is put, and is a question of clinical judgement. Statistical methods cannot answer such a question’.
The aim of this study was to consider how two methods can be demonstrated as being equivalent when the BA indicates agreement. In this study, we make a case for combining formal testing of equivalence with the BA method for assessing agreement between methods. Performing a test of equivalence requires an a priori assessment of what constitutes a clinically acceptable difference between two methods. Therefore, we first considered how agreement is described in the nutrition literature for validation of FFQ using the BA method. Second, we compared the use of equivalence testing with the BA method for assessing agreement between two methods using an original data set. The emphasis of this study was to demonstrate the need to be able to accurately define what constitutes clinical agreement – before being able to interpret the level of agreement between these methods – and to encourage the use of both methods in validation studies.
Methods
To identify a sample of FFQ validation literature describing agreement using the BA method, a search of the database Web of Science (accessed 20 March 2015) was conducted. This search returned 24 847 citations for the initial Bland and Altman paper, of which 250 were identified under the sub-search for FFQ. We then selected the ten papers with the highest number of citations, available through our institutional subscriptions, which aimed to validate an FFQ using the BA method.
To demonstrate equivalence testing and compare this with the BA method, a data set consisting of a random sample of eighty participants was simulated based on a previously published analysis using the means of I intake assessed, using the average of three repeated 24-HR and a FFQ (3×24HR 118·88 (sd 48·95) µg, FFQ 120·19 (sd 55·98) µg and correlation 0·614; P<0·001)( Reference Tan, Charlton and Tan 8 ). The data set was simulated using the matrix and drawnorm commands in STATA (version 12, STATA Inc.). Simulated data were chosen, instead of the actual data, in this example, to allow data sharing without any ethical considerations. In addition, the initial data set was right-skewed and transformed for analysis, and the simulated data were normally distributed to assist with interpretation.
The agreement of methods was interpreted using both a BA LOA and an equivalence approach. Both methods advocate acceptance on the basis of a clinical decision; however, in the case of the equivalence approach, this must be explicitly stated a priori ( Reference Wellek 9 ).
The BA method( Reference Bland and Altman 1 ) involves plotting the difference between the two methods against the average of the two methods and examining the mean bias, determining the 95 % CI of the bias and any trend in the bias. The precision of the limits is rarely considered in interpreting the BA plot. Interpreting the precision of the limits involves calculating and interpreting the 95 % CI of the upper and lower limits and is detailed with an example in the initial Bland and Altman paper( Reference Bland and Altman 1 ). Further reference to this on Martin Bland’s website (https://www-users.york.ac.uk/~mb55/meas/sizemeth.htm, accessed 28 August 2015) demonstrates clearly the effect of sample size on these estimates, and emphasises that it is important not only to consider the width of the LOA but also the precision with which these have been estimated.
Equivalence testing was performed using the two one-sided test (TOST) procedures( Reference Schuirmann 10 ) and also by using the CI approach( Reference Westlake 11 ). Both are valid approaches, and the use of one or the other depends on whether there is a preference for the use of a P value or CI. Equivalence testing is widely used in the pharmaceutical industry where a new drug, which may have fewer side-effects or be less costly to produce, is compared with the standard drug to determine whether the therapeutic effect is equivalent within a pre-defined range( Reference Midha and McKay 12 ). If differences in means (d) are considered using a paired t test, as in the traditional framework, the intention is to demonstrate that a new drug or method is different (generally with the aim of showing superiority). In this case, the null hypothesis states that there is no difference between the treatments, whereas the alternate hypothesis states that there is a difference. On the basis of this paradigm, established by Neyman and Pearson( Reference Neyman and Pearson 13 ), it can only be demonstrated that d≠0, or that there is insufficient evidence to demonstrate that d≠0. What cannot be demonstrated is that d=0 – that is, the null hypothesis cannot be proven. With a small sample size, it is difficult to show that d≠0 and an erroneous conclusion that there is no difference (type 2 error) may be made, particularly if the difference is small and the variance is large( Reference Altman and Bland 14 ). In this situation, we may conclude that the two methods agree as we do not have adequate power to demonstrate that the difference is statistically significant. Alternatively, for every d, there is a sample size where it can be demonstrated that d≠0, regardless of whether this difference has any practical meaning. In this situation, we may conclude that the methods do not agree when the difference between them is actually too small to have any clinical meaning. Thus, the statistical significance is unrelated to the practical or clinical significance. When demonstrating equivalence, these hypotheses are reversed such that the null states that there is a difference (H0:|d|≥∆, where d is the difference between the methods and ∆ is the pre-specified equivalence interval) and the alternative hypothesis is that of no difference (Ha:|d|<∆)( Reference Hoenig and Heisey 15 ). Equivalence trials require an a priori specification of an acceptable equivalence range. Determination of this range needs to be guided by clinical acceptability of the range of measures. Wellek( Reference Wellek 9 ) discusses arbitrary ranges when the equivalence range is unknown, and other arbitrary decisions such as ±10 % of the reference mean have been used in the literature on physical activity( Reference Kim, Crouter and Lee 16 ). In general, this equivalence region is poorly defined. A review of 332 non-inferiority and equivalence pharmaceutical trials found that half of these considered 0·5 sd or less of the difference between treatments to be an ‘irrelevant’ difference( Reference Lange and Freitag 17 ). Although TOST is not the most powerful equivalence test( Reference Wellek 9 , Reference Berger and Hsu 18 ), its relative ease of use and interpretation( Reference Hoenig and Heisey 15 ) make it the preferred approach for nutritional applications.
Both the BA and equivalence approaches are most easily interpreted visually. In our analysis, we present the traditional BA plots with the equivalence intervals incorporated. The figures contain the equivalence interval, as well as the 90 % CI of the difference and the LOA. These figures can be plotted easily in most statistical packages or in Microsoft Excel. This approach is adapted from the one proposed in the SAS macro ‘Concord’, which presents a BA style plot, incorporating the equivalence interval and 90 % CI instead of the LOA( Reference Groeneveld 19 ), and we also present the results as confidence interval plots and in tabular form to show different options of presentation.
Given that we wished to provide practical guidelines on the conduct of equivalence tests, we considered their use in STATA (version 12, StataCorp LP), SAS (version 9.3 SAS Inc.), SPSS (version 21, IBM Corporation) and R (version 3.2.1, www.cran.r-project.org ( 20 )), and instructions on the use of each of these are considered in online Supplementary Appendix S1. In this example, we considered four regions of equivalence to demonstrate the proposed methodology and the differences between equivalence and non-equivalence. The four equivalence regions chosen for this example demonstrate how to interpret clear equivalence, non-equivalence and an intuitively ambiguous result.
Results
A summary of the ten validation studies identified from the literature review is provided in Table 1. Only three of the ten papers considered a priori what an acceptable difference between the methods would be, whereas none of the authors discussed what was considered an acceptable LOA. All the papers reported and discussed the correlation coefficient as a method of establishing validity, although two discussed the limitations of this approach. In most cases, the results were compared only with other literature and no clinically defined or practical implications of the LOA were discussed. Seven of the ten studies performed hypothesis testing (Wilcoxon, paired t test) to determine whether the mean difference between the methods was statistically significant.
Summary of a highly cited sample of the literature assessing agreement of a FFQ with a reference method using the Bland and Altman (BA) method

24HR, 24 h recall; LOA, limits of agreement; EFD, estimated food diary; WFD, weighed food diary; DH, diet history; AFR, assisted food record.
* Number of citations on Web of Science on 28 August 2015.
Table 2 presents the results of the BA comparisons and the equivalence tests for the simulated data in tabular form. Fig. 1 presents the BA plots with the equivalence intervals and 90 % CI of the difference. Fig. 2 presents the CI plot. Fig. 2(a) shows a CI plot with the x-axis showing the difference between the two means, as is the traditional approach used for pharmaceutical trials. Fig. 2(b) shows a CI plot expressed relative to the mean intake of I using the 3×24HR; the two plots (Fig. 2(a) and (b)) are identical in interpretation, and in this case the methods are equivalent if the 90 % CI is contained within the pre-specified equivalence region. All equivalence methods show that the FFQ is only considered to be equivalent to the 3×24HR when the equivalence margin is set at 10 % of the mean of the 3×24HR (12·24 µg), or alternatively at 15 µg. These methods are not equivalent when the margin is set at 5 µg. The methods are also not equivalent when the margin is set at ±10 µg, because, although the mean difference meets the criteria on one side (the upper 90 % CI being 5·89, which is within the upper bound of 10 µg), the lower bound is outside the range (−10·49<10 µg) and both sides must be within the region to meet the assumption of equivalence. This is also reflected in the P values, both of which must be significant for equivalence to hold. Commands and outputs for the tests in SAS, R, STATA and SPSS are shown in online Supplementary Appendix S1. Fig. 3 shows the BA LOA plot with the 90 % CI of the mean bias used for the equivalence testing and the 95 % CI of the upper and lower LOA (numerically represented in Table 2).
Bland and Altman plots with superimposed equivalence intervals and the 90 % CI of the mean difference. (a) Equivalence ±5 µg I, (b) equivalence ±10 µg I, (c) equivalence ±10 % mean I 3×24HR and (d) equivalence ±15 µg I. 3×24HR, average of three 24 h recalls.

CI plots. (a) CI plot using the mean difference between the 3×24 h recall (24HR) and FFQ and (b) CI plot using the mean I intake in the 3×24HR (124·23 µg). 3×24HR, average of three 24 h recalls.

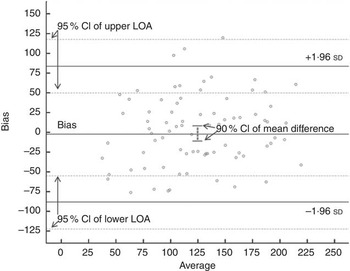
95 % CI of the upper and lower limits of agreement (LOA) for the mean bias in I intake (µg) between the 3×24HR and the FFQ.
Summary statistics, paired t test, Bland and Altman (BA) limits of agreement (LOA) and equivalence tests for assessing agreement between the 3×24HR and the FFQ

Discussion
This study demonstrates the use of assessing equivalence in dietary studies that compare two methods for agreement. Equivalence is presented to be used in conjunction with the more commonly applied BA LOA method. The advantage of the equivalence method is that it requires the clinician to make an a priori assessment of what represents agreement, rather than accepting or rejecting the LOA determined in the BA analysis a posteri. The equivalence approach can be assessed using CI, either independently or in combination with a BA plot, or equivalence can be assessed in the traditional paradigm of P values using TOST.
Frequently, the agreement between two dietary methods is assessed using the BA analysis, and the decision whether or not to determine agreement is based on a dependent samples test (paired t test or Wilcoxon’s matched pairs test). This approach was not advocated by BA and their initial paper that describes the method makes no reference to hypothesis testing regarding the bias. Rather, the initial manuscript by Bland & Altman( Reference Bland and Altman 1 ) states ‘How far apart the measurements can be without causing difficulties will be a question of judgement. Ideally, it should be defined in advance to help in the interpretation of the method comparison and to choose the sample size’.
Discussion to date on what constitutes a clinical LOA in the nutrition literature is limited. For example, among the studies reviewed in this analysis, many compared their LOA with other studies( Reference Villegas, Yang and Liu 21 ), but without discussion on whether this was acceptable in practice. In addition, when assessing agreement, the 95 % CI of the limits (as shown in Fig. 3) are rarely considered. These can be wide particularly for small data sets and should be reported, discussed and considered, particularly when estimating sample sizes, as advocated in the early BA literature. When only considering the LOA themselves, we may be prepared to accept that the measures agree; however, the interpretation of the 95 % CI of the LOA suggests that we could have an upper LOA as high as 117·96 µg or a lower LOA as low as −122·24 µg with repeated sampling.
Judging what is an acceptable equivalence between two methods is not a trivial procedure( Reference Lange and Freitag 17 , Reference Senn 30 ). Even in the pharmaceutical domain, where equivalence tests are most often used, a systematic review found that only 134 of 314 studies provided a rationale for the difference used( Reference Lange and Freitag 17 ). Given the number of agreement studies published in the field of nutrition, it is necessary to be able to determine the clinical rather than just the statistical interpretation of the results.
The question of what constitutes equivalence in the field of nutrition is complex. This may differ, depending on the nutrient being assessed and the population that is being studied. In the case of I, the estimated average requirement reported in the Australian Nutrient Reference Values is 100 µg/d for adults, with a recommended daily intake of 150 µg/d and an upper limit of 1100 µg/d( 31 ). Estimated average intakes in the Australian population based on the most recent (2011–2012) Australian nationally representative Health Survey were 191 µg in males and 152 µg in females( 32 ). Therefore, for the general population, a 10 % equivalence based on the mean of the reference food record appears reasonable. In populations where intakes may be inadequate (e.g. pregnant women)( Reference Charlton, Yeatman and Brock 33 , Reference Hynes, Otahal and Hay 34 ) and where the consequences of inadequacy have serious impacts on health outcomes, more stringent equivalence limits may be warranted.
Consideration of why it is important to state the acceptable LOA or equivalence a priori is warranted. Although there was a large range of sample sizes in the studies presented here (n 61–785), these were selected as being the most cited, and dietary validation studies can be conducted with relatively small sample sizes (e.g. n 49( Reference Weir, Carson and Mulhern 35 )). This may lead to an erroneous acceptance of the null hypothesis due to limited power to detect a difference in the traditional hypothesis test (i.e. a type 2 error). In our particular example, the power to detect a mean difference of 2·28 (sd 43·93) µg with eighty subjects is only 0·084. In order for this difference (2·28 µg with an sd of 43·93 µg) to be statistically significant at an α of 0·05 with 80 % power, a sample size of 2112 would be required. As the sample size increases, the probability of rejecting the null hypothesis in the traditional null hypothesis testing framework increases, whereas smaller sample sizes result in the opposite trend( Reference Hoenig and Heisey 15 ).
In this example, we considered only the paired t test for equivalence as it is generally the case that two dietary assessment methods would be compared on the same subjects. Independent t test methods also exist for both normally distributed and non-normal data. It is often the case that dietary intake data are skewed as was the case with the initial data set on which the simulation used in the present analysis was based( Reference Tan, Charlton and Tan 8 ). Non-normal data can be analysed using a similar approach for either paired or independent data based on the robust t test of Yuen( Reference Yuen 36 ) in the ‘equivalence’ package in R. Log transformation can also be considered. In this case, the interpretation relies on back-transformation, and the results represent the ratio of the two methods, generally expressed as a percentage with absolute equivalence being 100 %. SAS has a ‘dist=lognormal’ option in PROC TTEST where the TOST procedure is conducted, which will convert output and produce data based on the geometric (or back-transformed) mean. When back-transforming logarithmic data, a difference of ±10 % is approximately symmetrical, but wider limits will not be. For example, if the equivalence region chosen is ±20 %, this will correspond to a range of 80–125 % when the ratio is back-transformed. This relationship must be considered when setting equivalence limits with log-transformed data. Log transformations are commonly used in pharmaceutical equivalence testing and these concepts have been covered in the related literature( Reference Midha and McKay 12 ). The equivalence approach can also be applied to other hypothesis testing such as equivalence of slopes or trend( Reference Dixon and Pechmann 37 ). In addition, multisample and multivariate tests have also been described but are beyond the scope of what is covered in this study.
This study was designed to assess methodological comparison studies based on agreement using an example based on our previous research. There are other methods for judging the usefulness of new dietary assessment tools, such as the method of triads, which we have used previously( Reference Tan, Charlton and Tan 8 ), or missclassification, but they are not discussed here. Lombard et al.( Reference Lombard, Steyn and Charlton 38 ) provided a recent review and recommendations on the use of other methods, specifically applicable to nutrient assessment. The comparison of 3×24HR with a FFQ outlined here is an example of an approach that can be applied not only to dietary methodology but also to other methods used in nutrition practice and research, which are commonly assessed for agreement using BA methodology. These include comparing resting energy expenditure prediction equations to indirect calorimetry( Reference Reidlinger, Willis and Whelan 39 – Reference Lazzer, Patrizi and De Coi 42 ), bioelectrical impedance analysers to dual energy x-ray absorptiometry for assessing body composition( Reference Pineau and Frey 43 – Reference Ziai, Coriati and Chabot 46 ) and in validating physical activity assessment tools( Reference Oyeyemi, Umar and Oguche 47 – Reference Vanderloo, D’Alimonte and Proudfoot 49 ).
In summary, we have introduced an equivalence approach to be used in conjunction with the BA method in order to encourage clinicians to establish up front what constitutes a clinically meaningful difference between the two methods being considered. This not only makes interpretation of the results of the study clear but also assists with assessing the necessary sample size in planning the study.
Acknowledgements
This research received no specific grant from any funding agency, commercial or not-for-profit sectors.
The research idea was conceived during discussions between M. J. B., C. V. L., D. P. C. and A. D. O. M. J. B. formalised the study idea, simulated and analysed the data and drafted the paper. C. V. L. assisted in study conception and comparing the analytical approaches and reviewing the manuscript. D. P. C. assisted in the study conception and reviewed the manuscript. K. E. C. assisted with the provision of the context and practical applications of the I example. A. D. O. provided constructive feedback on the study design and implications and reviewed the manuscript.
The authors declare that there are no conflicts of interest.
Supplementary Material
For supplementary material/s referred to in this article, please visit http://dx.doi.org/doi:10.1017/S0007114516000040


