


Introduction
The cranium is a highly complex structure that has evolved myriad forms associated with many different ecologies throughout the tetrapod radiation. Despite this fact, tetrapod crania all exhibit a shared basic architecture—a braincase and associated sensory capsules and a facial skeleton associated with the jaws (Emerson and Bramble Reference Emerson, Bramble, Hanken and Hall1993)—facilitating comparisons across the group. Many tetrapod clades also have an extensive fossil record including well-preserved crania. These clades provide excellent systems in which to study both small- and large-scale patterns in shape evolution over time. Recent large-scale analyses of tetrapod crania have used geometric morphometric techniques to address questions of disparity and allometry within a variety of major tetrapod groups (e.g., Stayton Reference Stayton2005; Goswami Reference Goswami2006; Goswami and Polly Reference Goswami and Polly2010; Angielczyk and Ruta Reference Angielczyk and Ruta2012; Bhullar et al. Reference Bhullar, Marugán-Lobón, Racimo, Bever, Rowe, Norell and Abzhanov2012; Brusatte et al. Reference Brusatte, Sakamoto, Montanari and Harcourt Smith2012; Foth and Rauhut Reference Foth and Rauhut2013; Zelditch and Calamari Reference Zelditch, Calamari and Swiderski2016), including those with idiosyncratic or highly derived cranial structures (Claude et al. Reference Claude, Pritchard, Tong, Paradis and Auffray2004; Sherratt et al. Reference Sherratt, Gower, Klingenberg and Wilkinson2014; Churchill et al. Reference Churchill, Geisler, Beatty and Goswami2018). However, little work has been done to synthesize the results of these analyses or to look for pan-tetrapod morphological patterns.
One such pan-tetrapod pattern has been suggested, albeit obliquely, by analyses of cranial allometry in crown mammals. Within otherwise morphologically conservative mammalian families, there exists a widespread pattern of interspecific allometry in which larger animals have proportionately longer faces (Radinsky Reference Radinsky1985; Cardini and Polly Reference Cardini and Polly2013; Cardini et al. Reference Cardini, Polly, Dawson and Milne2015; Cardini Reference Cardini2019). Studies using geometric morphometric techniques have suggested that this trend is a salient and widespread pattern of cranial allometry within Mammalia, characterizing groups as disparate as antelopes (Antilopinae and Cephalopinae), fruit bats (Pteropodidae), African mongooses (Herpestidae), African tree squirrels (Sciuridae) (Cardini and Polly Reference Cardini and Polly2013), cats (Felidae) (Tamagnini et al. Reference Tamagnini, Meloro and Cardini2017), and kangaroos (Macropodidae) (Cardini et al. Reference Cardini, Polly, Dawson and Milne2015; but see Mitchell et al. Reference Mitchell, Sherratt, Ledogar and Wroe2018). Cardini et al. (Reference Cardini, Polly, Dawson and Milne2015) referred to this pattern of snout length allometry within closely related and morphologically conservative groups as the “cranial rule of evolutionary allometry,” or CREA, and suggested that it may be as widespread as Bergmann's rule and Allen's rule, extending to nearly all mammals.
If it is indeed so ubiquitous, the CREA pattern demands explanation. Cardini and Polly (Reference Cardini and Polly2013) suggested that the pattern may be driven by disparity in allometric scaling between the body, the jaw, and the brain. Because brain size scales with a ¾ exponent relative to body mass (Martin et al. Reference Martin, Genoud and Hemelrijk2005), and jaw length (under isometry) should scale with a ⅓ exponent relative to body mass, the relative length of the braincase should scale at a lower rate than the jaw. This produces a pattern of cranial allometry in which larger animals have relatively longer faces, because the snout must grow in line with the jaw to allow effective feeding. Due to the shared architecture of tetrapod crania and the difference in growth rate between the braincase and the jaw, this explanation, if valid, predicts an extension of the CREA pattern to all tetrapods.
Cardini and Polly (Reference Cardini and Polly2013) also noted the interrelationship between ontogenetic allometry in mammals and the observed pattern of interspecific allometry with respect to the relative size of the snout. Juvenile mammals generally display a higher degree of brachycephaly compared with adults of the same species, creating an ontogenetic pattern that mirrors CREA. They posited that this allometric relationship constrains the degree to which heterochronic shifts in the rate of development of the facial region can operate to change adult snout length in mammals. They also suggested that this link between size and shape allows shape adaptation to proceed through changes in body size.
Outside of mammals, fewer studies have explicitly focused on large-scale analyses of allometry within tetrapod crania. Angielczyk and Ruta (Reference Angielczyk and Ruta2012) found a pattern similar to CREA within Permo-Carboniferous temnospondyl amphibians. Smaller temnospondyls tended to have short, broad snouts, whereas larger temnospondyls had proportionally longer snouts. In addition, Bright et al. (Reference Bright, Marugán-Lobón, Cobb and Rayfield2016) and Linde-Medina (Reference Linde-Medina2016) recovered CREA-like patterns in raptors and Galliformes, respectively, using geometric morphometric techniques, though Linde-Medina found a traditional morphometric approach does not recover a CREA-like pattern and suggested that the use of centroid size as a predictor variable may be problematic.
Because temnospondyls, mammals, and birds represent each of the three great lineages of crown tetrapods that diverged in the Carboniferous (Benton et al. Reference Benton, Donoghue, Asher, Friedman, Near and Vinther2015), it is possible that a CREA-like allometric pattern is common to all tetrapods, in line with Cardini and Polly's (Reference Cardini and Polly2013) scaling hypothesis. If the similar allometric patterns in temnospondyls, birds, and mammals reflect an ancestral tetrapod pattern, we would expect a CREA-like pattern to characterize nonmammalian synapsids, the now-extinct members of the mammalian stem lineage. Alternatively, if the CREA pattern is not an ancestral tetrapod trait, we predict that other patterns of cranial allometry would be present in nonmammalian synapsids, although some synapsids might have evolved a similar allometric relationship independently. The evolution of synapsid skull characters is well-studied (e.g., Kemp Reference Kemp1982, Reference Kemp2005; Hopson Reference Hopson, Schultze and Trueb1991; Sidor and Hopson Reference Sidor and Hopson1998; Sidor Reference Sidor2001; Esteve-Altava et al., Reference Esteve-Altava, Marugán-Lobón, Botella and Rasskin-Gutman2013; Benoit et al. Reference Benoit, Abdala, Manger and Rubidge2016; Angielczyk and Kammerer Reference Angielczyk, Kammerer, Zachos and Asher2018), and the overall trend toward a more mammal-like skull within therapsids offers the possibility of pinpointing when this pattern of interspecific allometry evolved.
For this study, we assembled a photographic library of lateral-view images of nonmammalian synapsid crania for use in geometric morphometric analyses. Our sample includes all major groups of “pelycosaur”-grade synapsids (Caseasauria [Eothyrididae + Caseidae], Varanopidae, Ophiacodontidae, Edaphosauridae, Sphenacodontidae) and therapsids (Biarmosuchia, Dinocephalia, Anomodontia, Gorgonopsia, Therocephalia, nonmammalian Cynodontia) and represents the majority of well-preserved synapsid whole-cranium fossils. We used this data set to test for a CREA-like pattern in “pelycosaurs” as well as in each major therapsid subclade. To investigate similarity between interspecific and ontogenetic allometry in nonmammalian synapsids, we also analyzed a set of 39 specimens of the anomodont Diictodon feliceps and compared their ontogenetic trajectory with the interspecific allometric pattern recovered across Anomodontia. We made a similar comparison between an ontogenetic series of 26 specimens of the therocephalian Theriognathus microps and the interspecific allometric patterns in Therocephalia as a whole.
Materials and Methods
Phylogenetic Framework and Timescale Data
Our analyses focus on seven synapsid subgroups. Five of these groups are therapsid clades: Biarmosuchia, Dinocephalia, Anomodontia, Gorgonopsia, and Therocephalia. The other two groups, “pelycosaurs” and nonmammalian cynodonts, constitute evolutionary grades. Cynodontia contains Mammalia, rendering our sample of cynodonts paraphyletic. “Pelycosaurs” consist of a grade at the base of Synapsida containing several ecologically and anatomically distinct clades that serve as successive outgroups to Therapsida. Because of low sample sizes in the component family-level “pelycosaur” clades, we analyzed “pelycosaurs” as a group.
We used published phylogenies for “pelycosaurs” (Brocklehurst et al. Reference Brocklehurst, Reisz, Fernandez and Fröbisch2016), Biarmosuchia (Kruger et al. Reference Kruger, Rubidge, Abdala, Chindebvu and Jacobs2015), Dinocephalia (Kammerer Reference Kammerer2011), Anomodontia (Angielczyk and Kammerer Reference Angielczyk and Kammerer2017), Gorgonopsia (Kammerer and Masyutin Reference Kammerer and Masyutin2018), Therocephalia (Sigurdsen et al. Reference Sigurdsen, Huttenlocker, Modesto, Rowe and Damiani2012), and Cynodontia (Ruta et al. Reference Ruta, Botha-Brink, Mitchell and Benton2013) to construct topologies for time-scaled trees for each group. Any taxa or specimens not included in these trees were grafted on based on current taxonomy. Using these clade-specific trees, we then constructed a supertree following the prevailing hypothesis for branching order of the major synapsid clades (Sidor and Hopson Reference Sidor and Hopson1998; Angielczyk and Kammerer Reference Angielczyk, Kammerer, Zachos and Asher2018). Branch lengths for the trees were calculated using the equal branch length method (Brusatte et al. Reference Brusatte, Benton, Ruta and Lloyd2008) implemented in the R package strap (Bell and Lloyd Reference Bell and Lloyd2015), with species temporal occurrence data taken from the Paleobiology Database (paleobiodb.org) and other literature sources. First and last occurrence dates were binned by stratigraphic stage, and root lengths were added based on first occurrence data for the outgroup to each tree according to the branching order of our synapsid supertree. Our supertree can be found in the Supplementary Material for this paper.
Thirteen skulls could not be assigned to currently recognized species. In 10 cases, we assigned the specimens to genera (MMK 513 and NMQR 3512: Pristerognathus; CGS CM86-600, SAM-PK-708, SAM-PK-775, SAM-PK-6623, SAM-PK-7850, SAM-PK-K10703, SAM-PK-K11177: Emydops; USNM 487098: Ophiacodon), and in two cases, we assigned them to unnamed species (NHCC LB277: Abdalodon sp.; NHCC LB178: Lycaenops sp.) that were then used as terminal taxa in our trees and analyses. We treated these taxa identically to species-level taxa in our analyses.
Photography
We assembled a database of 910 photographs representing 461 nonmammalian synapsid crania. The majority of the specimens used in this study were photographed at their host institutions using a Sony Cyber-shot 7.2 megapixel camera. Additionally, a large number of dicynodonts and some other specimens were photographed in their host institutions using a Canon EOS Rebel DSLR. All photos included a scale bar of at least 1 cm. Specimens were photographed in lateral view and set against a contrasting background when possible. Twenty-one specimens in the initial data set were discarded, because they were either considered too badly distorted or incomplete to use or were represented by inadequate photographs. We considered photographs to be inadequate if they lacked a scale bar or were angled such that the shape of the skull was badly distorted due to perspective or parallax issues.
Digitization
Our final data set contains data from 440 crania, representing 194 taxa of nonmammalian synapsids. Information on the specimens and species included can be found in Supplementary Table 1.
One of us (I.W.K.) digitized 12 two-dimensional landmarks on the lateral surface of every specimen using TPSDig2 (v. 2.26) (Rohlf Reference Rohlf2016), digitizing both right and left lateral views of the skull when adequate images of both sides were available. Images of the right side of the skull were mirrored digitally so that all landmark data correspond to left lateral views. Many specimens were only able to be digitized on one side due to poor preservation. For the final analyses, only landmark configurations from the best-preserved side of the skull for each specimen were used. We calibrated the absolute size of the landmark data in TPSDig2 using a 1- to 5-cm-long reference length from the scale bars included in the photos. To assess the repeatability of landmark placement, I.W.K. digitized 10 D. feliceps specimens, repeating digitization of the full set 10 times, and compared variance within resampling trials of each specimen and between consensus data sets of all specimens. Average variance within specimens was 24× less than variance among the 10 specimens (σ2 = 0.000436 vs. σ2 = 0.0107).
Landmark Configuration
The extreme disparity in both anatomy and preservation quality of the specimens analyzed limited the number of homologous landmarks that could be consistently placed in the set of photographs. The majority of landmarks rely on geometric evidence (type 2) or partially rely on other landmarks to determine their position (type 3), rather than relying on sutures or other structural features (type 1) (see Bookstein [Reference Bookstein1991] for discussion of landmark types). In some cases (e.g., landmark 4), differences in anatomy and preservation meant that morphological proxies were used for landmark placements. The 12 landmarks chosen characterize the snout, orbit, temporal region, and cranial vault (Fig. 1, Table 1). Five landmarks (landmarks 1–5) make up the snout/face region and seven (landmarks 6–12) make up the braincase region. Though landmarks 6–12 do not all capture the braincase per se, they provide a proxy for the size and shape of the braincase region and allow some comparability to previous studies uncovering the CREA pattern.
Landmark configuration. Diictodon feliceps specimen (SAM-PK-K5189) with landmarks placed according to the configuration found in Table 1.

Landmark positions. *These teeth are absent/not preserved in many taxa; however, this is just anterior to the point of greatest curvature on most maxillae. †In cynodont taxa lacking a postorbital bar, this was marked as the tip of the postorbital process of the frontal.

Landmarks were not placed on the occipital, basicranial, and anterior palatal regions for several reasons. First, the morphological disparity in some of these areas is so great that establishing homology is quite difficult, particularly near the jaw articulation, a region of extreme morphological transformation within early synapsids. Second, a lack of clear sutures and a great diversity of component bones in these areas make landmarks difficult to place with any certainty. Third, many taxa either lack certain features that were considered as landmark candidates (e.g., dicynodonts lack a transverse process of the pterygoid, which establishes the anterior extreme of the braincase) or have features that obscure parts of their anatomy (e.g., in many synapsids, the squamosal extends posteriorly beyond the plane of the occiput, making landmarks in the occipital region impossible to assess from a lateral view; furthermore, in many specimens, the lower jaw is preserved in articulation with the skull, obscuring the palate and basicranium). Fourth, the basicranial and anterior palatal regions tend to be the most poorly preserved and prepared regions in synapsid skull fossils. Because of these difficulties, our conclusions may be less robust than those of an analysis in which many clearly homologous landmarks could be reliably located. Nevertheless, our landmark configuration does provide adequate information to assess the relative sizes of the preorbital and postorbital regions of the skull.
Analyses
All of the analyses in this study were performed using the R package Geomorph 3.0.1 (Adams et al. Reference Adams, Collyer, Kaliontzopoulou and Sherratt2016). For each synapsid subgroup, we constructed a data set consisting of one landmark configuration for each specimen. We then performed missing landmark estimation using thin-plate spline interpolation (Gunz et al. Reference Gunz, Mitteroecker, Neubauer, Weber and Bookstein2009). This step was necessary due to specimens in which some landmarks were unable to be placed because of poor preservation of the fossil. Any specimen for which five or more landmarks could not be confidently placed was removed from the sample. Percentages of missing landmarks in the data are as follows: “pelycosaurs,” 7.00%; Biarmosuchia, 5.83%; Dinocephalia, 4.57%; Anomodontia, 6.74%; Gorgonopsia, 7.41%; Therocephalia, 6.76%; nonmammalian cynodonts, 7.43%; Diictodon, 4.50%; Theriognathus, 5.02%.
After completing missing landmark estimation, we grouped specimens according to taxon (tip taxa in our phylogeny) and performed a generalized Procrustes analysis on the landmark data from the specimens, which generated consensus (mean) landmark configurations (with associated mean centroid size) for each tip taxon represented by more than one specimen. We then concatenated data for these mean shapes together with shapes for species represented by only one specimen to create final data sets containing one landmark configuration for each tip taxon.
For Anomodontia, we performed a simple linear regression using the lm() function (R Core Team 2017) to determine whether size changed over time within the clade, regressing log centroid size against first occurrence time for each species. We also tested for phylogenetic signal in log centroid size using the phylosig() function in phytools (Revell Reference Revell2012), using the Wilks's lambda method.
Analysis of Allometry
In all tests of allometry, we used log-transformed centroid size as a variable to predict changes in shape. Though it has been suggested that this approach may bias studies toward recovery of the CREA pattern (Linde-Medina Reference Linde-Medina2016), we use centroid size here in accordance with Tamagnini et al. (Reference Tamagnini, Meloro and Cardini2017) and Cardini (Reference Cardini2019), who find it to correspond well with other methods of measurement. This also allows for more direct comparability with previous mammalian studies (Cardini and Polly Reference Cardini and Polly2013; Cardini et al. Reference Cardini, Polly, Dawson and Milne2015; Tamagnini et al. Reference Tamagnini, Meloro and Cardini2017; Mitchell et al. Reference Mitchell, Sherratt, Ledogar and Wroe2018; Cardini Reference Cardini2019). To investigate whether nonmammalian synapsid groups share a common allometric pattern, we performed a phylogenetic generalized least-squares (PGLS) regression with a Brownian motion model of evolution using the geomorph function procD.pgls on a data set including all species in our study and using our concatenated supertree. We tested three models for the relationship between size and shape in nonmammalian synapsids: (1) cranial shape is explained by size (shape ~ size), (2) cranial shape is explained by size and group membership (shape ~ size + group), and (3) cranial shape is explained by size and group membership, with different groups having different allometric trajectories (shape ~ size * group). Because a corrected Akaike information criterion framework does not exist for these procD analyses, we compared the models based on their significance levels and R 2 values, selecting as favored the model with highest significance and best fit. To visualize differences in allometric trajectory, we plotted the PC 1 of predicted shapes from the PGLS regression versus log-transformed centroid size (Adams and Nistri Reference Adams and Nistri2010).
We also analyzed shape change in each synapsid subgroup independently to assess allometric patterns on a taxonomic scale similar to that of the mammalian family-level clades used by Cardini and Polly (Reference Cardini and Polly2013) and Cardini et al. (Reference Cardini, Polly, Dawson and Milne2015). For each subgroup, we performed a Procrustes distance–based generalized Procrustes analysis to remove the effects of size and rotation in the data set. We then performed a principal component analysis of the resulting Procrustes-aligned data to assess the effects of taphonomic distortion and size on major components of shape variation.
To assess and visualize covariation between size and shape, we performed a Procrustes ANOVA regression on each synapsid subgroup using the geomorph procD.lm function, with 1000 replicates to test for significance. We used PGLS regression to test whether the changes in shape recovered using the Procrustes ANOVA regression method were significant within a phylogenetic context. For each synapsid subgroup, these tests were performed both with shape (Procrustes distance) as the response variable and with PC 1–3 of morphospace as response variables to investigate how allometric patterns may influence major axes of shape variation. Here we report only phylogenetically corrected (PGLS) results, except in Anomodontia and Therocephalia, the groups in which we directly compared intraspecific allometry with ontogenetic allometry. In anomodonts, we found that the phylogenetically corrected regression did not recover an important pattern of allometry that was recovered using generalized least-squares (GLS) regression (see “Discussion”). In all tests, we used log-transformed centroid size as the predictor variable.
To assess similarity between ontogenetic and interspecific allometric trajectories in Anomodontia and Therocephalia, we combined data sets for ontogenetic series of D. feliceps and T. microps with the interspecific data sets for Anomodontia and Therocephalia, respectively. After performing Procrustes superimposition on these data sets, we regressed all shape components on log centroid size and performed a homogeneity of slopes test with 1000 replicates to determine whether the allometric trajectories in the selected species and their parent clades share a common slope, using the procD.allometry function in geomorph. In addition to the homogeneity of slopes test, we performed an angular comparison of vector directions (Zelditch et al. Reference Zelditch, Sheets and Fink2003) between recovered interspecific and ontogenetic allometric trajectories in these combined data sets using Geomorph's procD.lm function. We then generated 1000 alternative allometric trajectories for ontogenetic and interspecific shape data set by randomly reordering centroid size within the data set before recovering trajectories using procD.lm and compared the magnitude of observed angles between ontogenetic and interspecific allometric trajectories with the magnitude distributions of these alternative angles to obtain a p-value for the observed angles.
Results
Analyses of Allometry
All Nonmammalian Synapsids
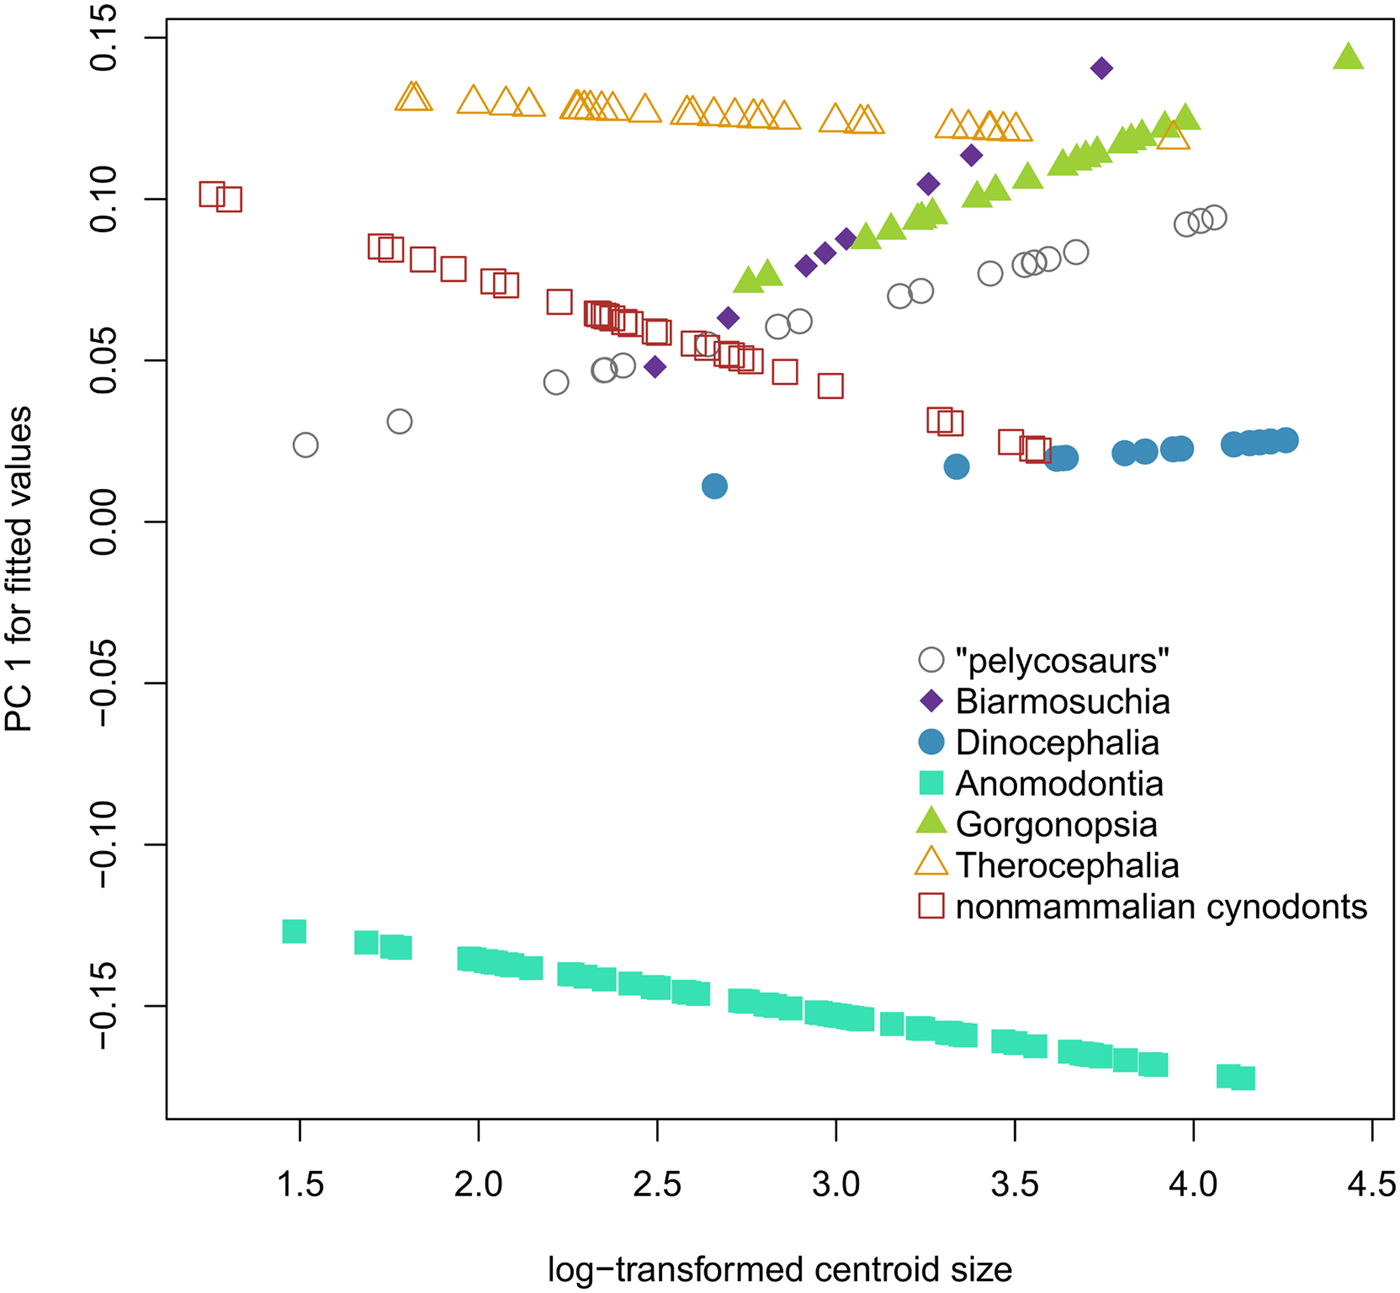
There is a significant but weak relationship between size and shape in our data set of all synapsid crania (R 2 = 0.0197, p < 0.001) (Table 2), but individual synapsid groups do not share allometric trajectories. Our best-fitting model is shape ~ size * group (R 2 = 0.03174, p = 0.006), in which shape is explained by size and group membership, with different groups having different trajectories (Fig. 2). Size does not correlate with PC 1 of synapsid morphospace, which is dominated by changes in relative snout length (R 2 = 0.001, p = 0.642), or PC 2, which is dominated by anterodorsal versus posterodorsal shearing (R 2 = 0.015, p = 0.096). PC 3 of synapsid morphospace involves changes in the relative size of the orbit and does correlate with size (R 2 = 0.0974, p < 0.001) (Supplementary Table S3).
Comparison of synapsid allometric trajectories. Log centroid size vs. predicted PC 1 scores of phylogenetic generalized least-squares regression of all shape components on log centroid size across 194 species of synapsids, organized by the seven main groups used for this study.
Comparison of synapsid allometric trajectories. Results of phylogenetic generalized least-squares regression of log centroid size vs. all shape components using the formula shape ~ size * group membership. The p-values in italics are significant with a threshold of p < 0.05.

“Pelycosaurs”
The relationship between centroid size and skull shape in “pelycosaur”-grade synapsids is particularly strong (R 2 = 0.278, p = 0.003) (Table 3), with larger-skulled “pelycosaurs” having long snouts and a sphenacodontid- or ophiacodontid-like skull shape, whereas smaller-skulled “pelycosaurs” have shorter snouts and a caseid-like morphology (Figure 3). It is important to note, however, that centroid size here refers to the size of the head, not the overall size of the animal in question, and this relationship probably does not hold for the latter metric. Some “pelycosaurs,” such as caseids, have very small heads relative to their large, robust bodies, whereas others, such as ophiacodontids, have proportionally much larger heads. This suggests a significant phylogenetic component to the size–shape relationship, yet we recovered a CREA-like pattern in the group, even when phylogenetic covariance was accounted for.
Representative specimens and predicted shapes. The first two columns display representative specimens from the largest and smallest ends of the size distribution in their groups to illustrate shape disparity in the crania. Specimens are not shown to scale, but the silhouettes of small specimens from the first column appear appropriately scaled next to large specimens from the second column to illustrate the magnitude of size differences in the group. The last three columns represent predicted minimum, mean, and maximum recovered shapes through a generalized least-squares (GLS) regression of all shape components on log-transformed centroid size. Shaded bars beneath the shapes illustrate the relative lengths of the snout and braincase regions, measured as the horizontal distance between landmarks 1 and 6 for the snout and landmarks 6 and 11 for the braincase. Only groups marked by an asterisk (*) show significant allometric trends when phylogeny is taken into account (see Table 3). Smallest and largest species are as follows: A, “pelycosaurs”: Eothyris parkeyi, Dimetrodon grandis; B, Biarmosuchia: Ictidorhinus martinsi, Biarmosuchus tener; C, Dinocephalia: Sinophoneus yumenensis, Jonkeria truculenta; D, Anomodontia: Kawingasaurus fossilis, Ischigualastia jenseni; E, Gorgonopsia: Eriphostoma microdon, Inostrancevia alexandri; F, Therocephalia: Tetracynodon darti, Scylacosaurus slateri; G, Cynodontia: Riograndia guaibensis, Cynognathus crateronotus.

Multivariate allometry. All shape components regressed against log-transformed centroid size. Numbers reported in bold represent non–phylogenetically corrected generalized least-squares (GLS) regressions; p-values below 0.05 reported in italics. *For Anomodontia and Therocephalia, we report ordinary least-squares/phylogenetic generalized least-squares (PGLS) regression results for better comparison with our results from ontogenetic series.

In “pelycosaurs,” PC 3 correlates strongly with size (9.47% of variance; R 2 = 0.293, p = 0.047). High PC 3 loadings represent shapes with wedge-shaped snouts, a posteriorly shifted postorbital bar and posterior maxillary margin, and a dorsally shifted landmark 11, which relates to a jaw joint in line with the tooth row. Low PC 3 loadings represent shapes with a more “blocky” snout, anteriorly shifted postorbital bar and posterior maxillary margin, and a somewhat more sinusoidal ventral margin of the cranium (Supplementary Figure S3). These extremes differentiate between varanopid-like and sphenacodontid-like shapes.
Biarmosuchia
In Biarmosuchia, we did not recover a significant interspecific allometric pattern (R 2 = 0.397, p = 0.115) using PGLS (Fig. 3). However, we note that a low sample size in this group may affect our ability to recover allometric trends.
Dinocephalia
Our analyses did not recover a significant relationship between size and shape within the Dinocephalia (R 2 = 0.117, p = 0.178).
Anomodontia
We did not recover a significant shared allometric trajectory within anomodonts independent of phylogeny (R 2 = 0.0252, p = 0.242), though the relationship between size and shape is stronger and significant when phylogenetic covariance is ignored (R 2 = 0.0928, p = 0.001) (see “Discussion”). In this shape-change regime, there is a transition from a shallow snout with a relatively small ventral displacement of the canine at small size to a deep snout and highly ventrally displaced canine at large size. The relative length of the snout does not change.
There is a strong relationship between geologic age and size in anomodonts (adjusted R 2 = 0.294, p < 0.001) and between size and phylogeny (Wilks's lambda = 0.999).
Diictodon feliceps
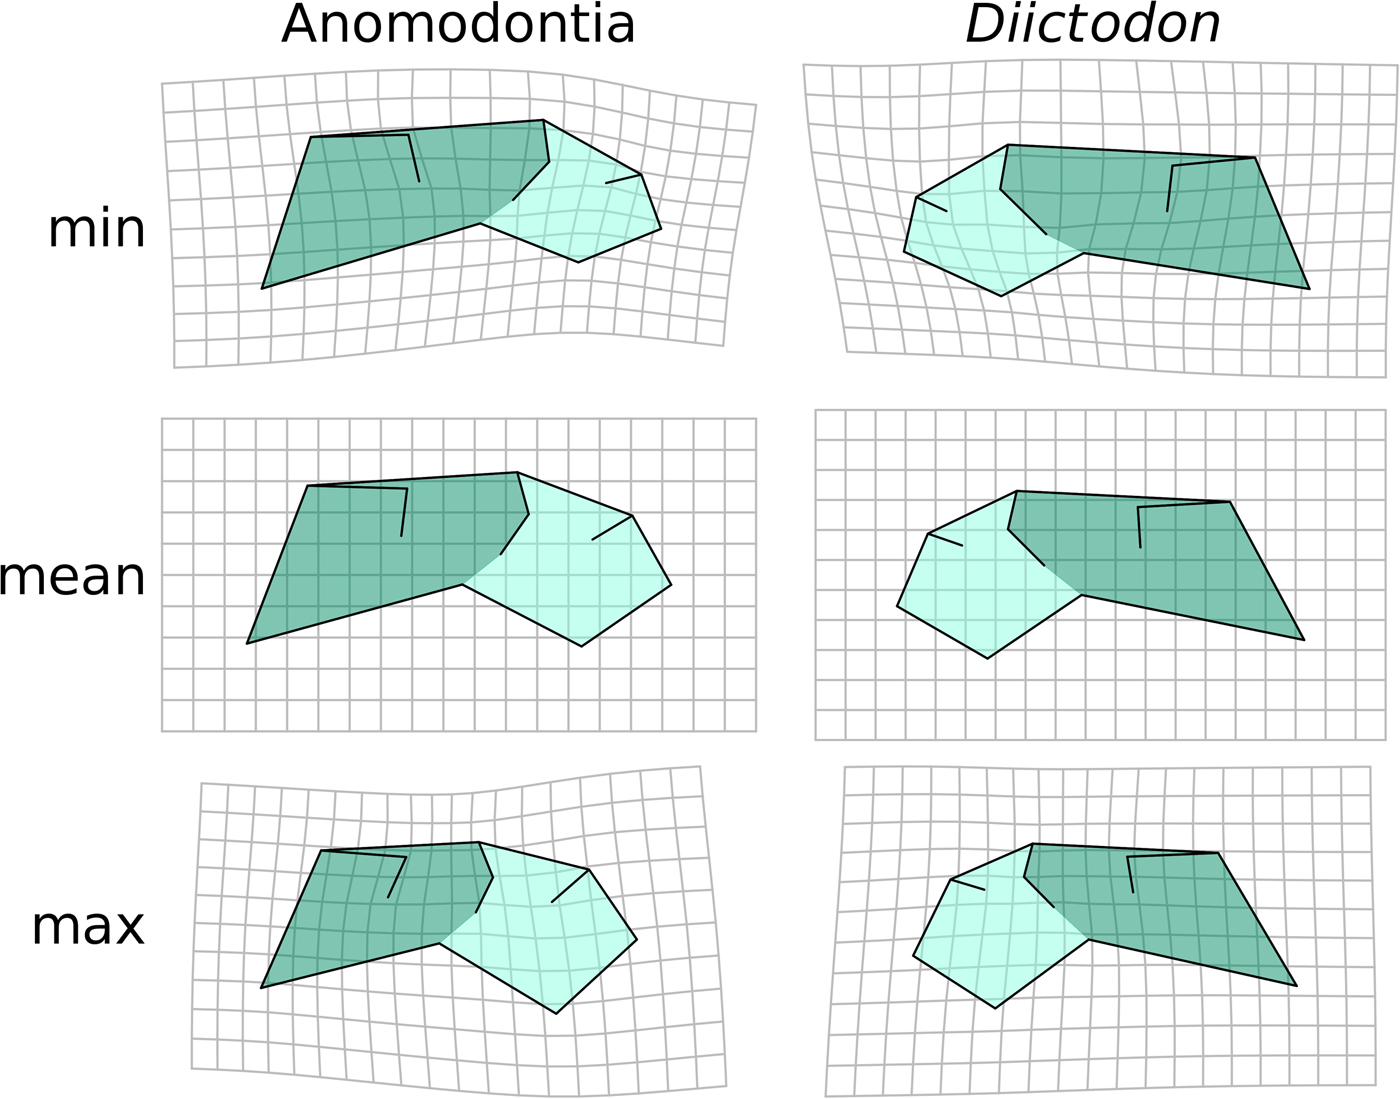
The pattern of intraspecific allometry in the dicynodont anomodont D. feliceps closely resembles the overall allometric trend across anomodonts recovered using OLS (Fig. 4), though the orbit is slightly larger in D. feliceps, likely because of the juvenile age of the smallest specimens (in contrast to the small-sized adults in the anomodont-wide data set). Likewise, the morphology of anomodonts at larger sizes represents a more extreme version of the D. feliceps large-size morphology, suggesting that the evolution of large size in the clade was accompanied by a stereotyped change in shape. Diictodon and anomodont allometric patterns have very similar trajectories, differing by 43.4° in 24-dimensional morphospace (p = 0.0045). The homogeneity of slopes test supports the null hypothesis that the anomodont and D. feliceps allometric trajectories are parallel (p = 0.179), further emphasizing the similar intraspecific and interspecific trends in the clade.
Diictodon vs. anomodont allometry. Predicted shapes at minimum, mean, and maximum size of Diictodon and Anomodontia by a regression of all shape components on log-transformed centroid size. We present shapes shown in a mirrored configuration to highlight similarity through symmetrical arrangement.
Gorgonopsia
Using PGLS, we recovered a CREA-like pattern of shape change in Gorgonopsia (R 2 = 0.0902, p = 0.013) in which larger species have longer and deeper snouts than smaller species. Size also has a significant effect on PC 2 of shape variation in Gorgonopsia (PC 2 representing 20.27% of total shape variance; R 2 = 0.175, p = 0.028) (Supplementary Table S3), in which the overall pattern of shape change appears very similar to that recovered for overall size.
Therocephalia
Contrary to the predictions of CREA, the snouts of small therocephalians tend to be slightly longer than the snouts of their larger relatives, though size explains a very small proportion of shape diversity (R 2 = 0.0071, p = 0.001) (Fig. 3). Size is correlated with the first two PC axes of shape variation in Therocephalia. The PC 1 of therocephalian morphospace (37.20% of variance; R 2 = 0.0022, p = 0.02) captures both the relative length and depth of the snout and the relative size of the orbit. At low PC 1 loadings, shapes have long, shallow snouts and large orbits, whereas at high PC 1 loadings, shapes have shorter, deeper snouts and small orbits. PC 2 of therocephalian morphospace (15.35% of variance; R 2 = 0.0019, p = 0.011) also significantly correlates with size: small shapes are deeper overall, whereas large shapes are shallow (Supplementary Fig. S2). This may correspond partially to taphonomic distortion, however. The crania of larger therocephalians have a much flatter dorsal profile than seen in smaller species. Some crania of large therocephalians in our data set appear to have been crushed dorsoventrally, with the skull roof being displaced ventrally, resulting in a very shallow braincase region, which may contribute to this pattern.
Theriognathus microps
Ontogenetic patterns in T. microps do not follow those seen in Therocephalia as a whole (Fig. 5). Whereas Therocephalia exhibits distinct allometric trends, we did not recover any significant allometric trend in T. microps (R 2 = 0.0398, p = 0.416), corroborating the results of Huttenlocker and Abdala's (Reference Huttenlocker and Abdala2016) revision of the species. A homogeneity of slopes test comparing the allometric slopes of T. microps and Therocephalia as a whole rejected the null hypothesis of parallel slopes (p = 0.02). The angle between recovered allometric trajectories of T. microps and Therocephalia was not smaller than expected by chance (59.6°; p = 0.066).
Theriognathus vs. therocephalian allometry. Predicted shapes at minimum, mean, and maximum size of Theriognathus and Therocephalia by a regression of all shape components on log-transformed centroid size. We present shapes in a mirrored configuration to highlight similarity through symmetrical arrangement.

Nonmammalian Cynodonts
The relative contributions of snout and postorbital region to overall skull length do not change across the size range of nonmammalian cynodont, nor is there any overarching allometric pattern in nonmammalian cynodonts (R 2 = 0.0511, p = 0.664). Size does not significantly correlate with PC 1–3 of cynodont morphospace.
Discussion
The central prediction of CREA is that larger animals will have proportionally longer snouts, a pattern based on relative lengths that could be recovered using three-dimensional, two-dimensional, or simple linear morphometrics. Though imperfect preservation and minor variations in photographic parameters likely have some effect on our results, we recovered many strong and significant signals that relate to both CREA and other patterns of synapsid allometry.
There appears to be no universal pattern of interspecific allometry within nonmammalian synapsid lineages (Fig. 2), though there are common traits. The relative contributions of snout and braincase to the total length of the skull account for a large amount of total variance within each group and within synapsids as a whole, as revealed by principal component analysis (Supplementary Table S4). However, this aspect of shape variation rarely correlates with size when phylogeny is taken into account. The only common features that seem to correlate with size across synapsids are a decrease in the relative size of the orbit in larger animals, a trend consistent with known allometric patterns across tetrapods (Howland et al. Reference Howland, Merola and Basarab2004), and an increased ventral displacement of the canine (landmark 4) (Fig. 3). Of the seven synapsid groups investigated, only two display a CREA-like pattern: “pelycosaurs” and Gorgonopsia.
In “pelycosaurs,” we find support for Cardini and Polly's (Reference Cardini and Polly2013) suggestion that variation in snout length is a key aspect of morphological disparity among skulls. PC 1, incorporating changes in snout length, accounts for 61.23% of variance, corroborating Goulds's (Reference Gould1967) finding that such variation was a major component of the “pelycosaur” radiation. Gould (Reference Gould1967) also proposed that snout length was strongly correlated with ecology in “pelycosaurs,” with shorter snouts typifying herbivorous taxa. This relationship is common in many extant sauropsids (Claude et al. Reference Claude, Pritchard, Tong, Paradis and Auffray2004; Metzger and Herrel Reference Metzger and Herrel2005; Stayton Reference Stayton2006) and seems related to the fact that a relatively short snout provides herbivorous taxa with a slow, powerful bite that is useful in processing plant material (Metzger and Herrel Reference Metzger and Herrel2005). Therefore, the interconnected relationships between skull proportions and skull size in “pelycosaurs,” and between diet and skull shape, might explain a distinctive aspect of the morphology of “pelycosaur” herbivores: their relatively small heads for their body sizes. Caseids, especially large members of the clade such as Cotylorhynchus (e.g., Stovall et al. Reference Stovall, Price and Romer1966), are well known for their proportionally small skulls, and this phenomenon is also apparent, albeit to a lesser degree, in edaphosaurids. Conversely, faunivorous “pelycosaurs” are characterized by proportionally larger heads, a trend that is likely associated with lengthening the tooth row to accommodate a larger number of teeth and changing the mechanical advantage of the jaws to favor a fast, snapping bite (Gould Reference Gould1967; Sakamoto Reference Sakamoto2010).
Unfortunately, our sample size for “pelycosaurs” is too small to allow detailed investigations of allometric patterns within the major subclades: despite an expansive postcranial record, complete, three-dimensionally preserved “pelycosaur” crania are rare. Further investigation and, ultimately, a larger number of complete cranial specimens will be needed to further test whether the apparent CREA-like pattern was indeed a ubiquitous feature of the grade (and possibly the ancestral character state for Synapsida), or an artifact of combining data from multiple clades that may have had distinct allometric relationships (and indeed may not all be closely related; see Ford and Benson Reference Ford and Benson2018).
The Biarmosuchia represent a morphologically and presumably ecologically conservative group, despite their often elaborate cranial ornamentation, similar to the mammal clades investigated by Cardini and Polly (Reference Cardini and Polly2013) and Cardini et al. (Reference Cardini, Polly, Dawson and Milne2015). Shape differences captured by PC 1 (explaining 47.50% of shape variance in the data set) (Supplementary Table S3) predominantly consist of relative lengthening of the snout, and this PC axis is strongly correlated with size. However, the relationship between size and shape is not independent of phylogeny. We therefore do not find support for a CREA-like allometric pattern in Biarmosuchia.
Likewise, we recovered no allometric pattern in Dinocephalia. This may be due to a combination of high disparity and the large average size of dinocephalians, which are ecologically and morphologically diverse but represented by very few species in our data set. Neither anteosaurs nor tapinocephalids appear to follow a CREA-like pattern, though low species diversity in both groups makes analysis difficult.
We recovered the strongest support for a CREA-like pattern in Gorgonopsia (Table 2). In this clade, the pattern of snout lengthening is subtle but significant, much like the pattern seen in mammalian clades (Cardini and Polly Reference Cardini and Polly2013; Cardini et al. Reference Cardini, Polly, Dawson and Milne2015). Gorgonopsia is a morphologically conservative group (Kammerer and Masyutin Reference Kammerer and Masyutin2018), and our sample of gorgonopsian crania had very low total shape variance compared with all other synapsid groups (Supplementary Fig. S3). Gorgonopsia are temporally constrained as well; only one species in our sample, Eriphostoma microdon, occurs outside the Lopingian. Because of their narrow temporal range and limited morphological variation, gorgonopsians may be the group in our study most comparable to those studied by Cardini and Polly (Reference Cardini and Polly2013) and Cardini et al. (Reference Cardini, Polly, Dawson and Milne2015).
In therocephalians, the pattern of snout length is reversed, with the smallest therocephalians having the proportionally longest snouts and larger therocephalians having shorter snouts. Our investigation of ontogenetic shape change in the whaitsiid therocephalian T. microps, however, did not align with this clade-wide trend. Instead, we recovered largely isometric growth within this species, indicating a disconnect between ontogenetic and interspecific patterns of allometry. The lack of postcanine dentition in Theriognathus may obviate one of the main benefits of a longer snout, a longer tooth row, a result in line with Cardini and Polly's (Reference Cardini and Polly2013) suggestion that CREA is linked to feeding efficiency.
Though “pelycosaurs” and gorgonopsians may follow a CREA-like pattern, the immediate outgroups to mammals—nonmammalian cynodonts and therocephalians—show no adherence to CREA. There is no relationship between snout length and log centroid size in nonmammalian cynodonts, the closest relatives of crown Mammalia in our data set. This result parallels Hoffman and Rowe's (Reference Hoffman and Rowe2018) recent discovery that relative snout length does not increase over ontogeny in the tritylodontid cynodont Kayentatherium wellesi. Taken together, these findings provide strong evidence for the specific CREA pattern observed in mammals having first appeared within Mammaliaformes rather than within nonmammalian synapsids, even if a similar allometric relationship was the basal character state for Synapsida and/or evolved independently in Gorgonopsia.
Our naïve regressions found strong support for a parallel relationship between ontogenetic allometry in D. feliceps and interspecific allometry of anomodonts (Fig. 4). However, the phylogenetically corrected regression results do not support a significant relationship between size and shape in Anomodontia. We believe that this finding may be related to both the specific evolutionary history of anomodonts and the properties of the PGLS regression. The anomodont tree used in our study is largely pectinate (Supplementary Fig. S1), with the most deeply nested clades containing the most geologically recent dicynodonts, many of which also are among the largest anomodonts. Though some earlier-diverging dicynodonts have very large skulls (e.g., Endothiodon, Odontocyclops, Rhachiocephalus), there is an extremely high degree of phylogenetic signal in centroid size in our data, as well as a strong trend of increasing size throughout anomodont history (Angielczyk and Walsh Reference Angielczyk and Walsh2008; Griffin and Angielczyk Reference Griffin and Angielczyk2019). This pattern of size evolution is certainly not independent of evolutionary history, and it results in phylogeny explaining the majority of anomodont shape variance when it is included as a term in the regression. Furthermore, if heterochronic development does indeed provide an evolutionary “path of least resistance” for changes in body size, we might expect there to be a large amount of phylogenetic signal in interspecific allometry associated with this path. Because of this combination of factors, we are reluctant to completely dismiss the significant size–shape relationship detected by our naïve regression, despite the contradictory results of PGLS regression.
If we accept the allometric pattern seen in the naïve regression across anomodonts, the close relationship to the ontogenetic pattern of Diictodon suggests an evolutionary link between ontogeny and size evolution in the clade. Anomodont size diversification likely occurred in part through a co-option of the ontogenetic process, with lineages changing size through heterochronic adjustments of a common ontogenetic plan. A probable example of this process can be found in changes in size in the dicynodont Lystrosaurus across the Permo-Triassic boundary documented by Botha-Brink et al. (Reference Botha-Brink, Codron., Huttenlocker, Angielczyk. and Ruta2016). Late Permian Lystrosaurus in the Karoo Basin of South Africa, especially L. maccaigi, were relatively large dicynodonts with prolonged, multiyear growth and life spans of over a decade. In contrast, the Early Triassic species L. declivis and L. murrayi typically were smaller and had much shorter life spans (individuals over 2 years old at the time of death appear to be extremely rare). Although these changes in size and life history likely represent an adaptation to harsh and unpredictable conditions in the aftermath of the Permo-Triassic extinction (Botha-Brink et al. Reference Botha-Brink, Codron., Huttenlocker, Angielczyk. and Ruta2016), the mechanism by which the reduction in size occurred (progenesis sensu Alberch et al. Reference Alberch, Gould, Oster and Wake1980) is consistent with our hypothesis that heterochronic shifts were a viable means of size evolution in anomodonts.
The influence of shared ontogeny on interspecific allometry may explain not only the pattern in anomodonts, but in mammals as well. As noted earlier, Cardini et al. (Reference Cardini, Polly, Dawson and Milne2015) posited that the observed CREA pattern has a basis in ontogeny. If mammals follow stereotyped ontogenetic patterns, size evolution in the group may follow an ontogenetic axis; growth is arrested or prolonged to reach an advantageous adult body size. In this view, the CREA pattern, nearly ubiquitous in mammals (Fig. 6), is produced by size diversification co-opting a common ontogeny, and this may explain the lack of support for CREA in nonmammalian clades, which do not necessarily share mammalian ontogenetic patterns (e.g., Hoffman and Rowe Reference Hoffman and Rowe2018; this study).
Prevalence of the CREA pattern in synapsids. Circle fill indicates whether the CREA pattern has been identified in that group or within a subclade of that group. Examples of the CREA pattern in mammals follow Cardini and Polly (Reference Cardini and Polly2013) and Cardini (Reference Cardini2019). Though the CREA pattern has been reported in Macropodids (Cardini et al. Reference Cardini, Polly, Dawson and Milne2015), it appears to be driven by ecological adaptation (Mitchell et al. Reference Mitchell, Sherratt, Ledogar and Wroe2018) and therefore may not be a true example of evolutionary allometry. Because “pelycosaurs” represent a morphologically and ecologically disparate grade, the group as a whole does not correspond to the analyses confirming CREA in other groups and is therefore marked as present/unclear.

If this explanation of CREA and anomodont allometry is correct, future investigations of ontogenetic pattern in nonmammalian synapsid clades such as biarmosuchians and gorgonopsians may reveal parallels between intraspecific ontogenetic allometry and interspecific allometry, even if a CREA-like pattern is not apparent. Moreover, it should be possible to detect similar parallelism between ontogeny and interspecific allometry in other clades, including the mammalian lineages originally investigated by Cardini and Polly (Reference Cardini and Polly2013), Cardini et al. (Reference Cardini, Polly, Dawson and Milne2015), Tamagnini et al. (Reference Tamagnini, Meloro and Cardini2017), and Cardini (Reference Cardini2019). Cardini and Polly's “cranial rule” may not strictly describe the relationship between relative proportions of the snout and braincase, but may instead capture a more universally applicable pattern linking ontogenetic shape change to interspecific allometry.
Acknowledgments
We thank the curators, collections managers, and friends at the many museums we have visited for their assistance in accessing specimens. Image data collection was supported by grants from the National Science Foundation (DEB 0608415) and Deutsche Forschungsgemeinschaft (KA 4133/1-1) to C.F.K. M. I. Coates, Z.-X. Luo, P. C. Sereno, and M. Webster provided helpful feedback on a previous version of the article. We would also like to thank three anonymous reviewers for their insightful commentary. This paper includes material from I.W.K's undergraduate honors thesis for the Biological Sciences Collegiate Division at the University of Chicago and was funded by the Research Honors program of the Biological Sciences Collegiate Division, University of Chicago.


 Open access