


MIND THE GAP: GROWING POLICY STOCKS AND CONSTRAINED ADMINISTRATIVE CAPACITIES
Over the last decades, modern democracies have witnessed a tremendous increase in the number and complexity of public policies. Recent empirical evidence suggests that the average number of policy measures in OECD countries has grown, for instance, four times in environmental policies and doubled in social policies between the 1980s and the 2010s (Adam et al. Reference Adam, Hurka, Knill and Steinebach2019). Hurka, Haag, and Kaplaner (Reference Hurka, Haag and Kaplaner2022) make a similar observation. They find that the average number of articles on European Union (EU) legal documents grew more than twofold from 25 in the early 1990s to more than 75 in 2021. This trend is even more pronounced when analyzing the average word count, which skyrocketed from about 1,000 to more than 4,000 words (Hurka, Haag, and Kaplaner Reference Hurka, Haag and Kaplaner2022).
More policies generally mean more implementation burdens for the authorities in charge of their execution and enforcement.Footnote 1 If policies are adopted without a parallel expansion of administrative capacities, this can directly translate into growing implementation problems (Knill, Steinebach, and Zink Reference Knill, Steinebach and Zink2023). As Gratton et al. (Reference Gratton, Guiso, Michelacci and Morelli2021) put it, the (over)production of public policies can shift the administration “from a Weberian to a Kafkaesque bureaucracy” if “too many and too frequent laws overload (…) the bureaucracy with too many acts to implement” (2965). The characteristic symptom of “bureaucratic overload” is that public authorities are “under-resourced relative to their responsibilities,” resulting in the “failure to implement programs on a scale sufficient to meet the demand for benefits among citizens despite statutory entitlements” (Dasgupta and Kapur Reference Dasgupta and Kapur2020, 1316). In a recently published opinion piece in the New York Times, Klein (Reference Klein2022) summarizes this trend as follows: US policymakers “spend too much time and energy imagining the policies that a capable government could execute and not nearly enough time imagining how to make a government capable of executing them.”
Yet, the size of the gap between implementation burdens and administrative capacities seems to vary considerably across countries and sectors. Levels of policy accumulation differ despite a common pattern of largely stagnating or even incrementally declining administrative capacities (Adam et al. Reference Adam, Hurka, Knill and Steinebach2019). Limberg et al. (Reference Limberg, Steinebach, Bayerlein and Knill2021, 438) substantiate this point by demonstrating that some countries can ensure that “the growth in rules [does] not outpace the expansion in administrative capacities,” while others cannot (see also Fernández-i-Marín et al. Reference Fernández-i-Marín, Hinterleitner, Knill and Steinebach2023a).
But how can we explain this variation in the relationship between the number of policies requiring implementation and the administrative capacities available to do so? We argue that the answer to this question lies in the coupling of sectoral bureaucracies in charge of policy formulation and those in charge of policy implementation. We consider these patterns of vertical policy-process integration (VPI) an important yet relatively overlooked feature of bureaucratic quality. We expect that (1) the more the policymaking level is involved in policy implementation (top-down integration) and (2) the easier the policy-implementing level finds it to feed its concerns into policymaking (bottom-up integration), the smaller the burden-capacity gap.
To test our argument, we systematically compare the development of the gap between implementation burdens and administrative capacities across two policy areas (environmental and social policy) in 21 OECD countries over a period of more than 40 years (1976 to 2018). Our results show a very clear picture: higher levels of VPI substantially reduce the risk that the number of policies requiring implementation and the administrative capacities drift apart.
Our paper contributes to existing scholarship in three ways. Our first contribution is theoretical in nature. Building on the concept of VPI, we offer a novel theoretical approach to account for the gap between burdens emerging from sectoral policy growth and the capacities available to put these policies into effect. Although implementation research has long acknowledged the relevance of administrative capacities for implementation success (Pressman and Wildavsky Reference Pressman and Wildavsky1973; Winter Reference Winter, Peters and Pierre2012), they have been merely assessed in absolute rather than relative terms: administrative capacities are typically classified as high or low—they are not assessed in reference to the implementation burden that must be handled with the capacities available. Second, we provide a conceptual approach to assess the relationship between policy accumulation and administrative capacities from a macro-perspective that goes beyond the analysis of individual instances of policy change and implementation. Third, we provide new and encompassing empirical evidence that allows for the systematic assessment of our argument across a large number of countries and a time period of over 40 years. Moreover, we demonstrate our argument by studying the impact of VPI on the burden-capacity gap in two highly diverse sectors of social and environmental policies.
The remainder of this paper is organized as follows. In the subsequent section, we present our theoretical argument. This will be followed by an introduction of our research design before we turn to the presentation and critical discussion of our empirical findings. The final section concludes and highlights the implications of our results for future research and practice. Supplementary material provides complementary information on our quantitative analysis and the qualitative substantiation of our arguments.
EXPLAINING THE GAP: THE IMPACT OF VPI
If policymaking was merely a matter of politics, the outlook for the development of the burden-capacity gap would be rather gloomy. Power-seeking politicians have strong incentives to demonstrate their responsiveness to societal demands by constantly proposing new policies (Gratton et al. Reference Gratton, Guiso, Michelacci and Morelli2021).Footnote 2 The same logic, however, does not apply to the expansion of administrative capacities that are needed for properly implementing these new policies. As political responsibilities for implementation success are often unclear, electoral incentives for politicians to invest in administrative capacities for policy implementation are generally weaker than those for adopting new policies (Dasgupta and Kapur Reference Dasgupta and Kapur2020). Although such capacity expansion improves implementation effectiveness, attributing such improvements to the actions of particular political actors is in many instances more difficult for voters (Hinterleitner Reference Hinterleitner2020). While political actors have strong incentives to engage in policy production, their incentives to engage in costly improvements of administrative capacities are typically much weaker. Deviations from this pattern are largely confined to specific constellations where implementation failures have immediate individual consequences for voters, for example, in the case of policies related to service delivery (Healy and Malhotra Reference Healy and Malhotra2013).
From a mere political logic, we should hence expect a toxic combination of strong policy growth and stagnating or even declining administrative capacities. Although the urgency of this problem varies across countries and sectors, the nature of the challenge essentially remains the same: if we assume that policymaking is exclusively driven by politics, we would expect an ever-growing burden-capacity gap, with more and more policies undermining rather than strengthening overall policy effectiveness in the long run.
Yet, politics is not the only factor at play. Politics might be counterbalanced by bureaucratic processes, as politicians strongly depend on bureaucracies’ information and expertise when developing new policy proposals (Nicholson-Crotty and Miller Reference Nicholson-Crotty and Miller2012). Bureaucracies’ potential to effectively attenuate the responsiveness-driven logic of politics by concerns of policy effectiveness cannot be taken for granted, however. Challenges emerge from the high degree of functional and structural differentiation characterizing modern bureaucracies. Governmental functions are divided not only across policy sectors but also across the stages of the policy cycle (e.g., policy formulation and implementation). Moreover, functions are assigned to different levels of government (Hooghe and Marks Reference Hooghe and Marks2003). This structural decoupling implies that policy-formulating bureaucracies may shift the implementation costs of the policies they produce to other administrative bodies or levels of government. Similarly, implementation bodies may find it difficult to communicate their policy experiences and needs from the lower administrative echelons up to the policymaking level.
To understand the balance of accumulating implementation burdens and administrative capacities, greater attention needs to be paid to the coupling of administrative bodies responsible for policy formulation and those in charge of policy implementation. While the tasks of policy formulation typically lie with bureaucracies at the ministerial level, “the polity of implementation” (Sager and Gofen Reference Sager and Gofen2022) follows a more diverse pattern of national and sectoral variation involving bureaucracies at very different levels of government.Footnote 3
We refer to these bureaucratic coupling arrangements as VPI. Our conception of VPI departs from a multilevel governance perspective that focuses on the interaction processes both between and within different layers of government (Peters and Pierre Reference Peters, Pierre, Bache and Flinders2004). We conceive VPI as a specific feature of bureaucratic quality. Bureaucratic quality can generally be defined as the “degree to which government policies are constructed and implemented accurately, swiftly, competently, and impartially” (Andersen Reference Andersen2018, 247; see also Hanson and Sigman Reference Hanson and Sigman2021). To assess bureaucratic quality, the focus has been mainly on other structural features, in particular the degree of bureaucratic professionalism, impartiality, and autonomy (Fukuyama Reference Fukuyama2013). While these aspects affect macro-level outcomes like socioeconomic development (Rauch and Evans Reference Rauch and Evans2000), corruption prevention (Dahlström, Lapuente, and Teorell Reference Dahlström, Lapuente and Teorell2012), and popular satisfaction (Dahlberg and Holmberg Reference Dahlberg and Holmberg2014), their potential impact on aggregate policy dynamics, such as the burden-capacity gap, is much less obvious.
VPI affects the burden-capacity gap in two ways. First, VPI defines the leeway that policy-producing bureaucracies have for unloading implementation costs to subordinate bodies (top-down integration). Second, the systematic integration of implementers’ experience into policy formulation (bottom-up integration) informs policymakers regarding what works in practice and what is needed to further improve policy design and implementation.
Top-Down Integration
As policies are rarely self-implementing, they usually come with some burden of implementation: Services must be provided, policies enforced, and compliance monitored. In short, implementation is costly, and these costs typically remain in the realm of public budgets, even when the government decides to delegate implementation tasks to private sector bodies (Ansell and Gash Reference Ansell and Gash2008).
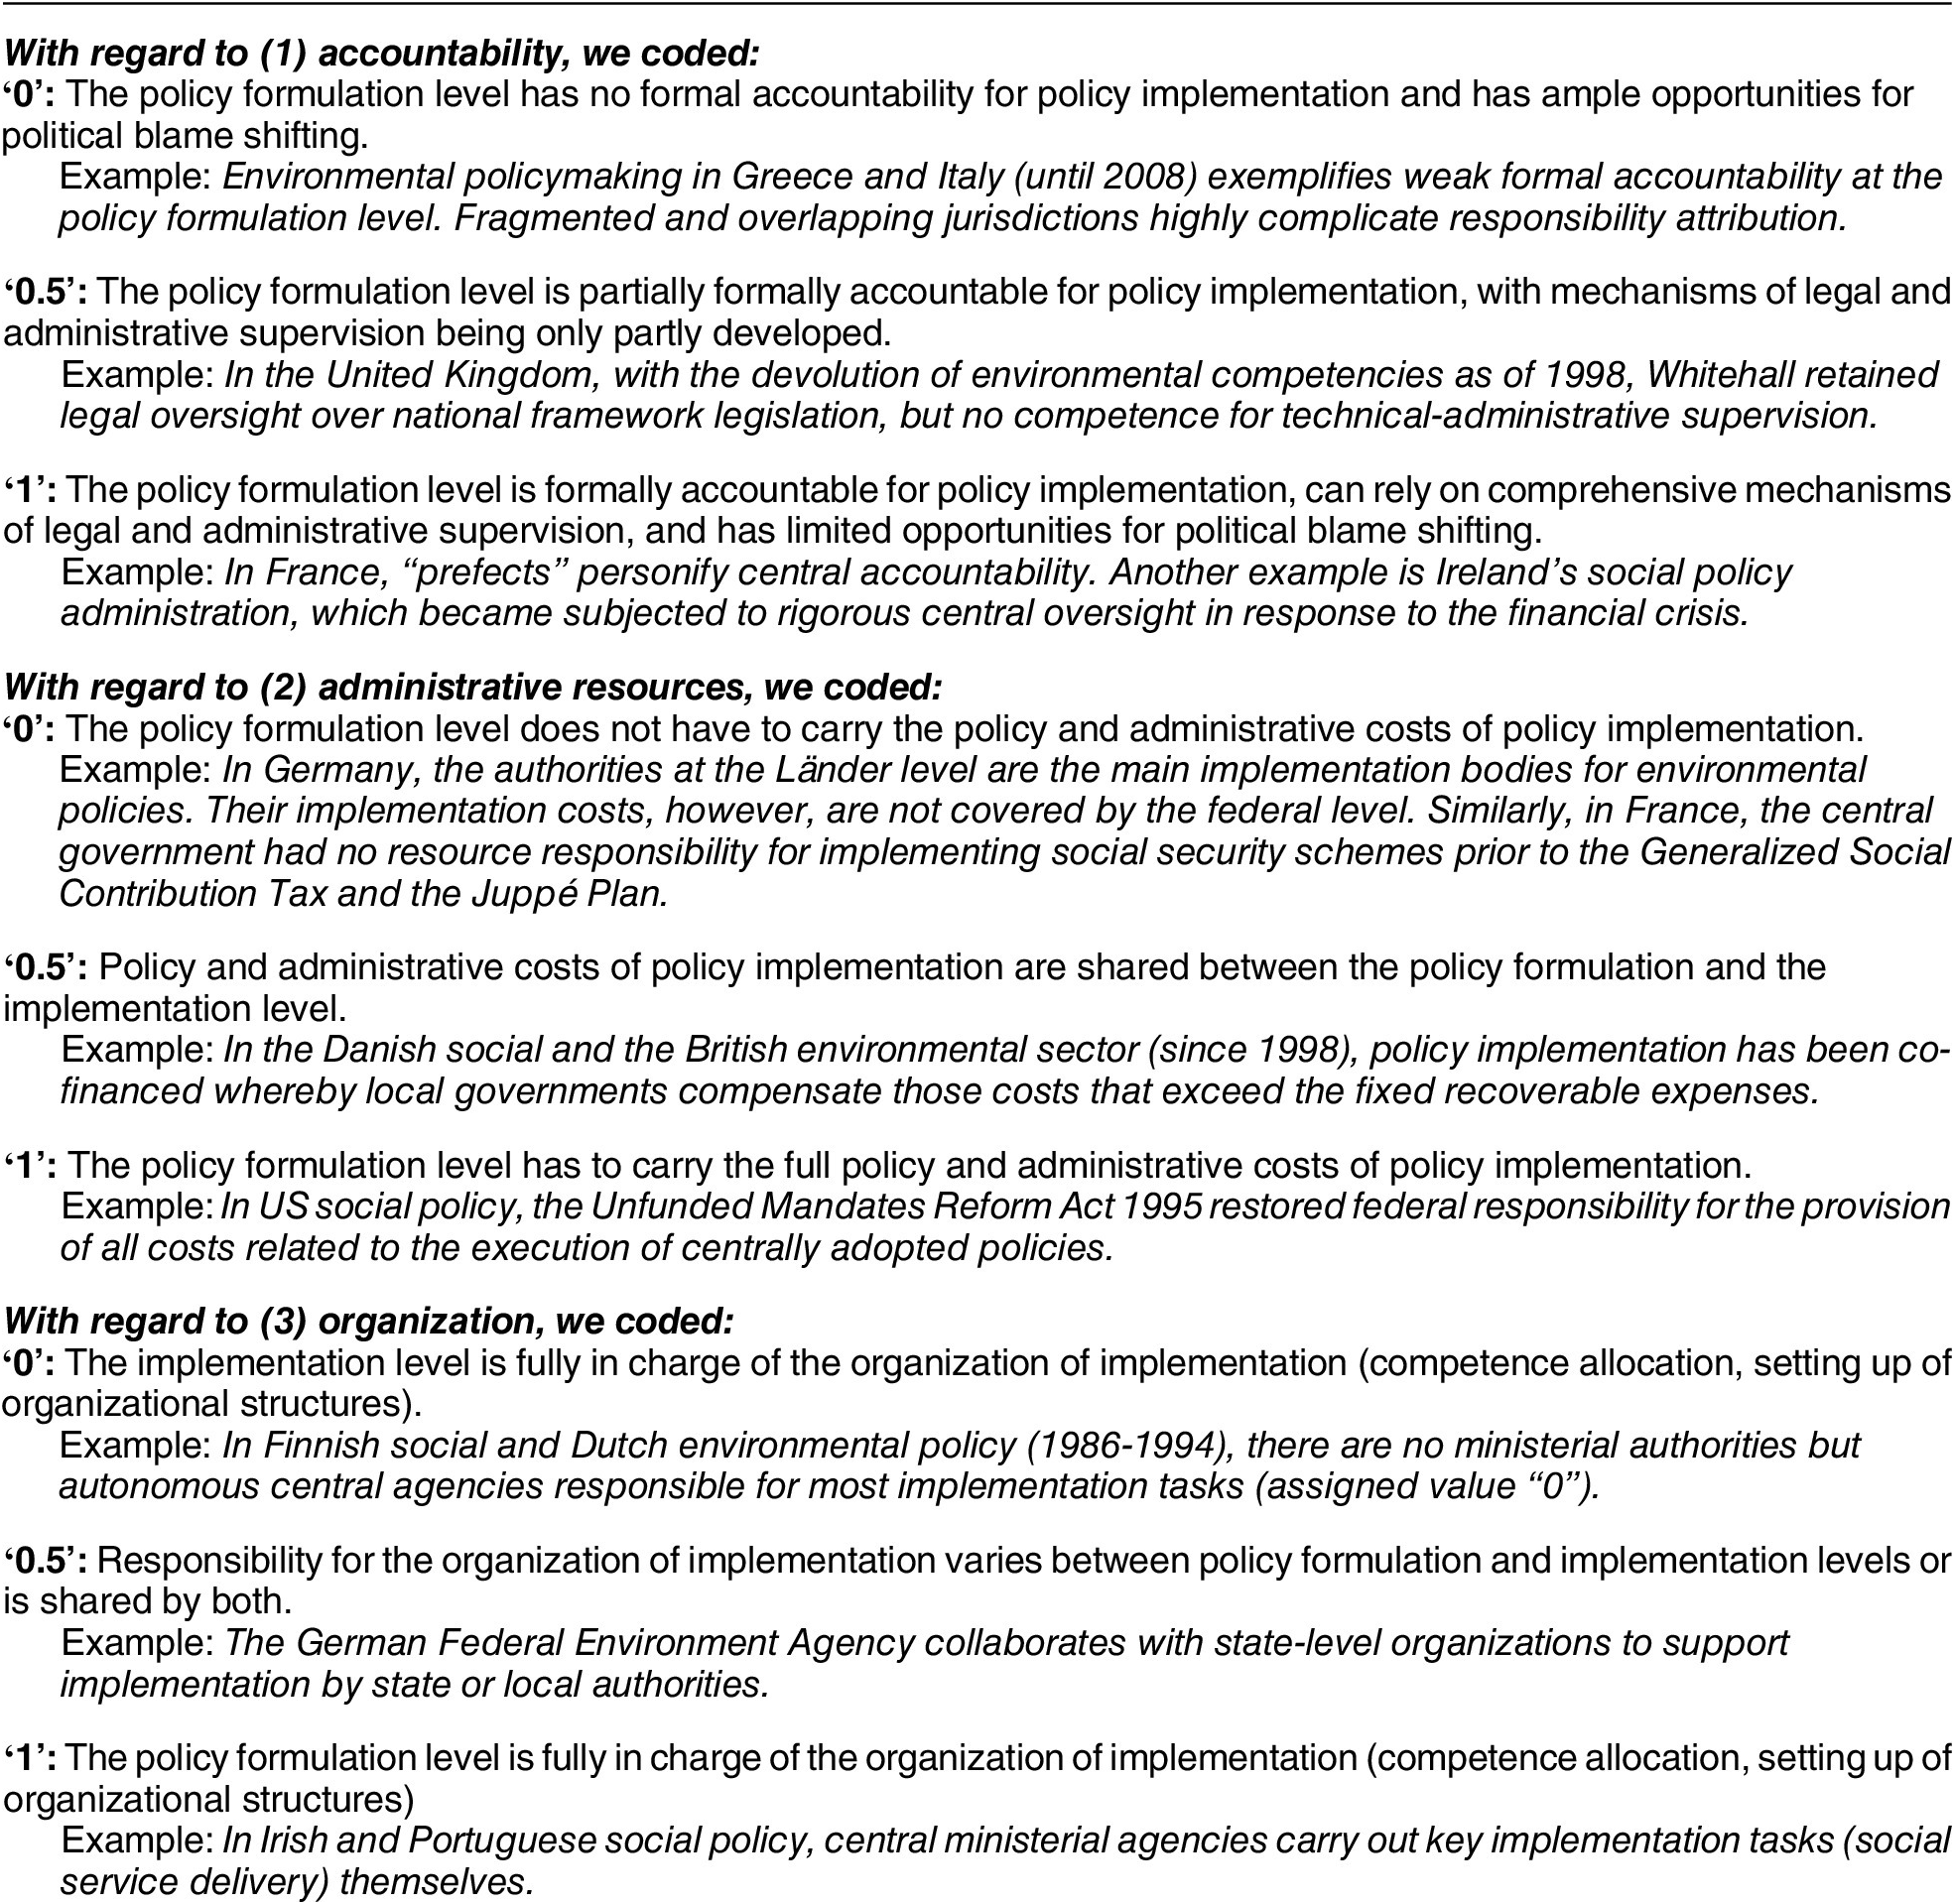
Yet, the tasks of policy formulation and implementation are often located at different levels and places of government. As shown in the literature on US federalism, central governments tend to impose additional financial and administrative burdens on subnational governments via unfunded mandates (Moffitt et al. Reference Moffitt, Willse, Smith and Cohen2021). There is hence a considerable potential that the costs and benefits of new policies are decoupled. On the one hand, the policy formulation level may benefit from demonstrating responsiveness to societal demands. On the other hand, the burden to apply and enforce these new measures accumulates at the implementation level. In such setups, there are relatively few barriers to the constant overproduction of policies. The top-down dimension of VPI takes this as a starting point (Knill, Steinbacher, and Steinebach Reference Knill, Steinbacher and Steinebach2021). It determines the leeway that policy producers have to unload the cost of policy implementation onto other administrative levels or bodies. We argue that this leeway varies with the factors: (1) accountability, (2) responsibility for administrative resources, and (3) organizational setup.
Accountability captures the extent to which policymakers can be held politically responsible for policy implementation. This depends not only on the formal arrangements that determine the extent to which policymakers must carry the burden of exercising legal and administrative oversight over implementation bodies (Hill and Hupe Reference Hill and Hupe2009) but also on informal opportunities to shift blame for implementation failures to other actors (Hinterleitner Reference Hinterleitner2020). The responsibility for administrative resources, by contrast, refers to the allocation of costs associated with the policy and its administration. Direct policy costs, the costs of child benefits, for example, must be accounted for. Moreover, implementers must be trained, employed, and equipped. Finally, the organizational setup captures a third type of implementation cost that relates to the responsibility for setting up and designing implementation structures (Winter Reference Winter, Peters and Pierre2012).
The distribution of these different implementation costs between policy formulation and implementation levels can significantly differ across countries and sectors. Higher degrees of top-down integration imply that the policy-formulating bureaucracies must also bear the implementation costs of the policies they produce. This way, top-down integration can be expected to reduce the scope of the burden-capacity gap in two ways. Higher levels of top-down integration may (1) curb the growth of implementation burdens on the ground by producing fewer policies and (2) increase the chances that those policies produced are backed with administrative capacities for implementation.
Bottom-Up Integration
There are numerous reasons why policies might fail to achieve their intended results. Policies might suffer from design flaws such as overly ambiguous objectives (Pressman and Wildavsky Reference Pressman and Wildavsky1973), faulty assessments of the nature of the problem (Linder and Peters Reference Linder and Peters1984), or incorrect assumptions about means-ends relationships (Schneider and Ingram Reference Schneider and Ingram1997). Moreover, governments might not possess the capacities required by a given policy instrument (Howlett and Ramesh Reference Howlett and Ramesh2016). While all these design flaws are essentially created during the policy formulation process, they are often identified only at the implementation stage, that is, by implementing bodies whose daily work reveals such discrepancies between policies’ intentions and actual conditions, as well as between the capacities needed and those available.
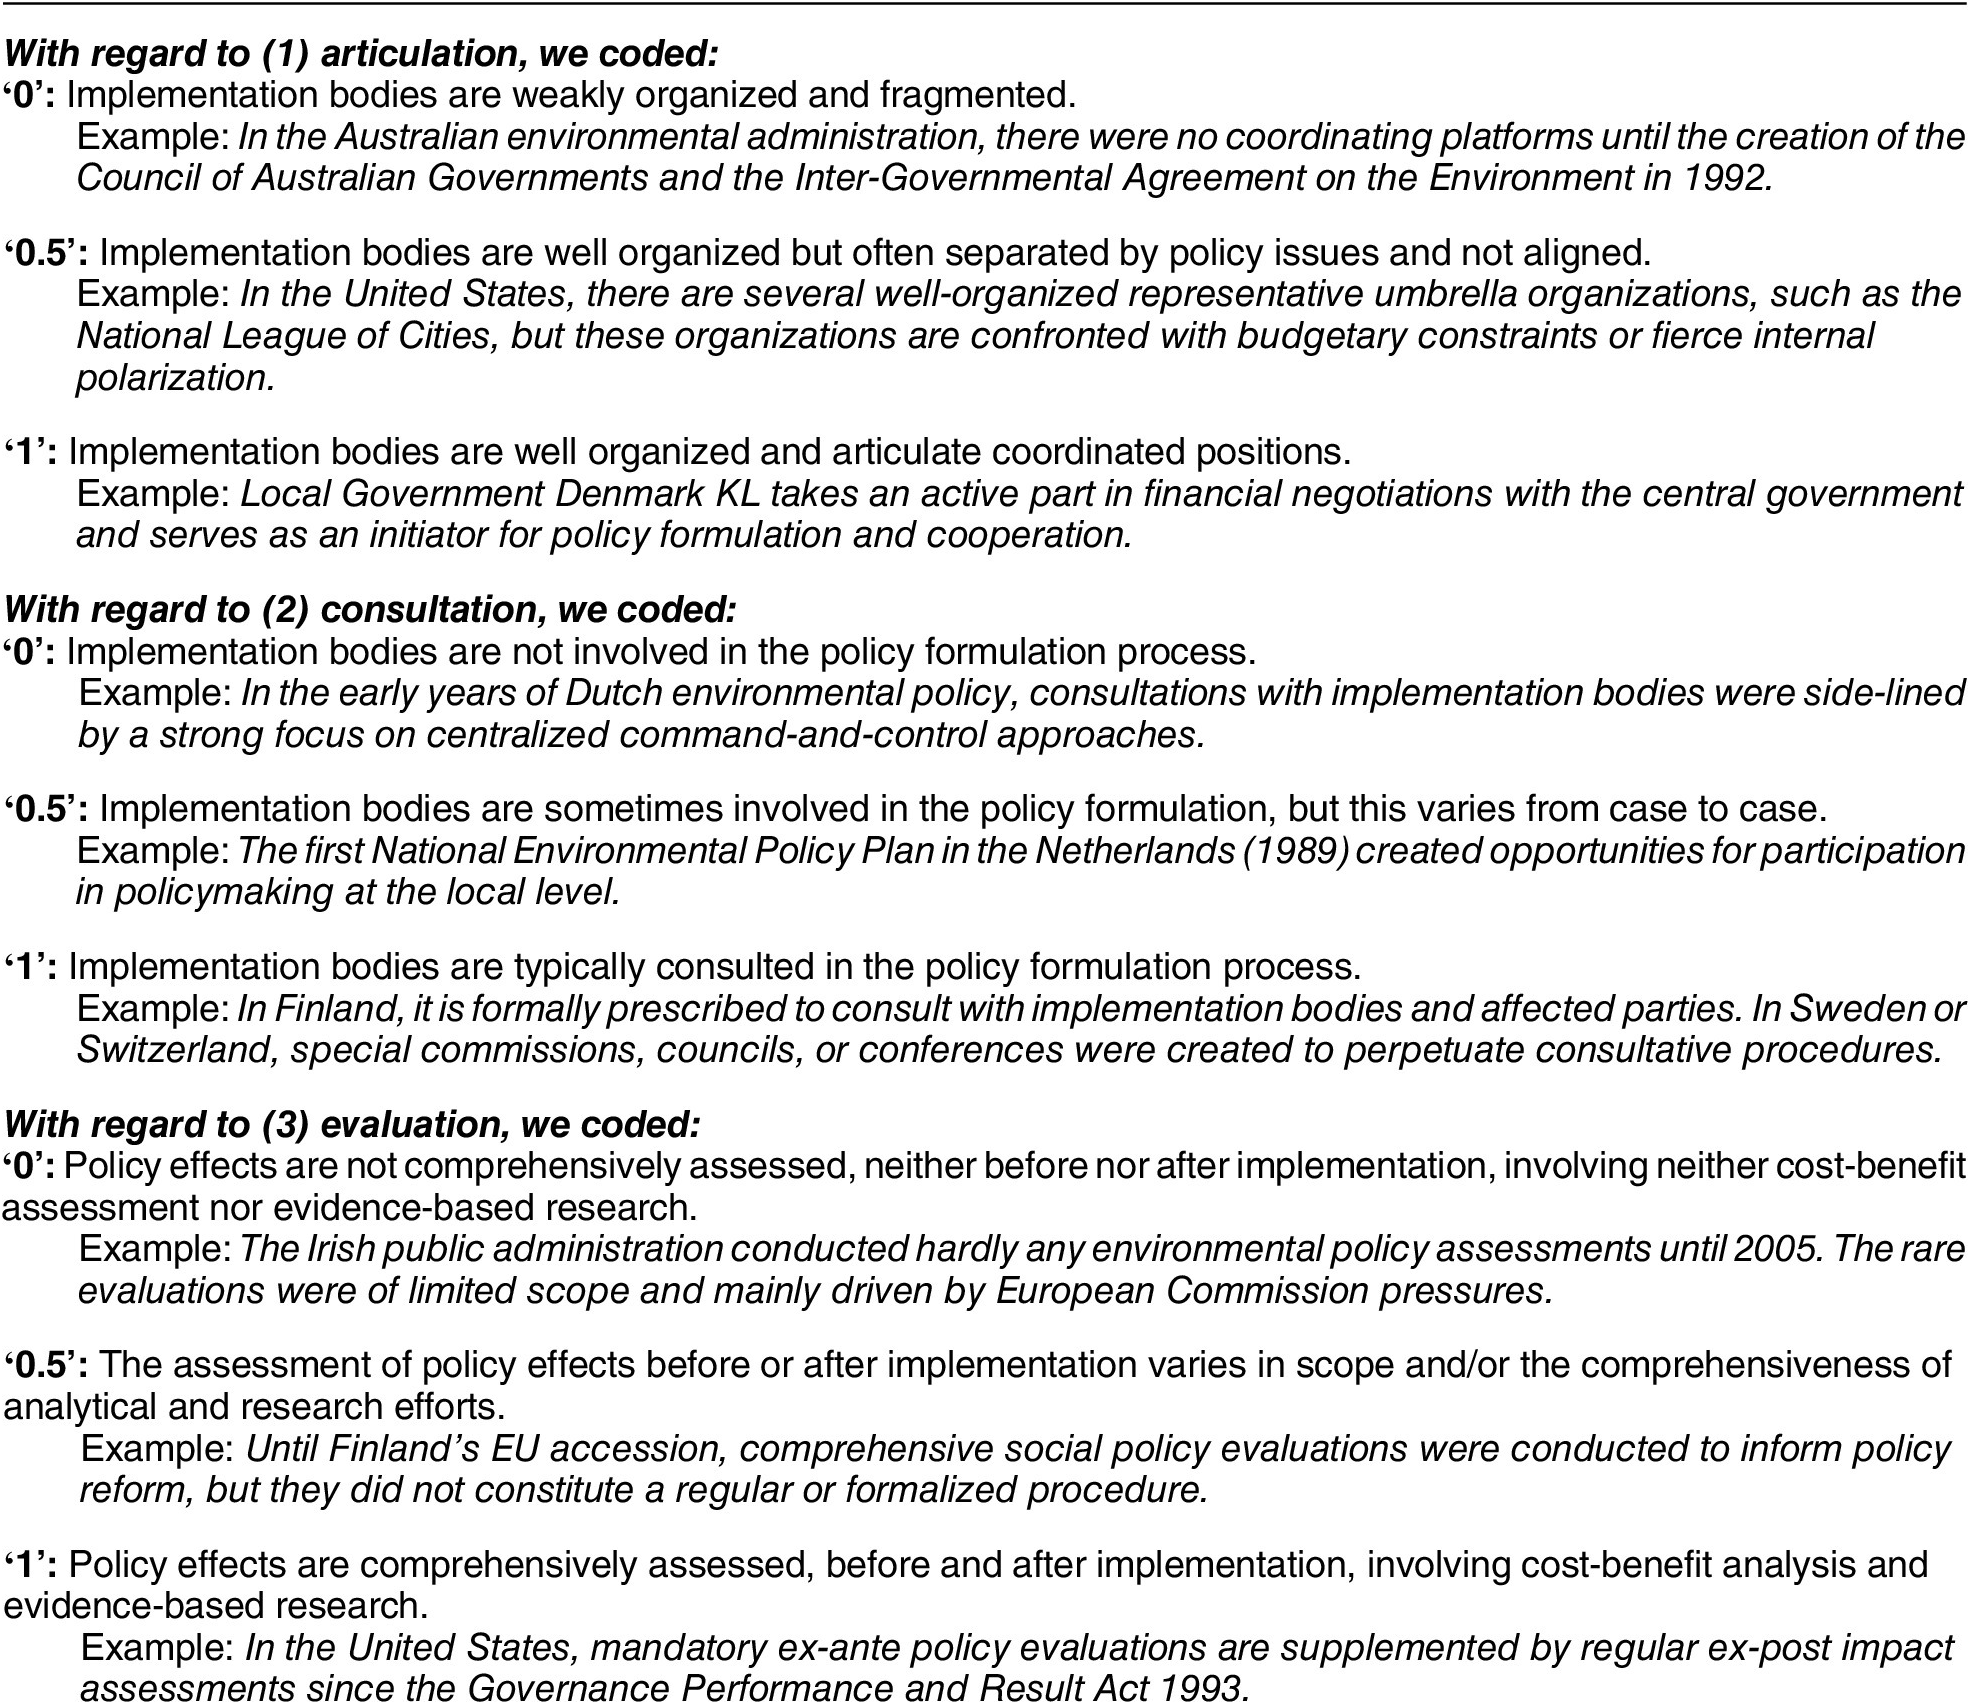
Against this background, the information flow from the bottom (policy implementation) to the top (policy formulation) emerges as an important condition affecting the design of effective policies. Yet, managing information flows in highly differentiated politico-administrative systems is a demanding undertaking, and its success cannot be taken for granted. Although “street-level policy entrepreneurship” thus constitutes an important part of policymaking (Cohen Reference Cohen2021), the actual realization of this potential depends on various institutional factors. These are: (1) articulation, (2) consultation, and (3) evaluation.
First, effective involvement in policy formulation presumes articulation. Articulation captures the implementation level’s ability to develop clear and coherent positions when assessing different policy design options. The bottom-up development of design options is often hindered by the fact that implementation bodies must juggle competing and sometimes contradictory demands (Cohen and Frisch-Aviram Reference Cohen and Frisch-Aviram2021). Articulation hence requires organizational integration across different implementation bodies, such as umbrella organizations or other platforms of local or regional authorities representing or actively advocating the interests of their member organizations. Yet, effective participation in policy formulation requires not only the formulation of common positions but also that these positions are actually taken into account. This aspect is reflected in the consultation indicator, which captures the presence and extent of institutional arrangements that allow implementation bodies to present their concerns and positions to the bureaucracies responsible for designing new policy proposals. The latter are of particular importance as implementing bodies typically have few direct formal channels of communication or close informal relationships with high-level bureaucrats and politicians (Cohen Reference Cohen2021). Third, opportunities to learn from the implementers’ experience increase with the existence and usage of systematic ex-ante and ex-post evaluations. Bottom-up integration in this context does not necessarily require that evaluations are merely policy-based and isolated from political controversies. Regardless of the concrete setup and the extent of politicization, the existence of evaluation practices increases the chance that the implementation level gets a voice within policy formulation processes (Stockmann, Meyer, and Taube Reference Stockmann, Meyer and Taube2020).
Taken together, higher degrees of bottom-up integration should ensure two things. First, implementation bodies can signal to policy formulators the required amount and type of resources needed to make policies work in practice. Second, the inclusion of policy implementers’ experience into policy formulation might help to improve policy design and hence overall policy effectiveness. This, in turn, reduces the need for new policies to correct the errors and deficiencies of already existing measures. Consequently, the growth of public policies and associated implementation burdens should be dampened.
VPI and the Burden-Capacity Gap
In the previous sections, we discussed two constituent dimensions of VPI and how they affect the gap between accumulating implementation burdens and available administrative capacities. Careful readers might argue that the two dimensions under scrutiny do not affect the burden-capacity gap in general but rather exert an individual influence on either the development of the implementation burdens (mainly by top-down integration) or on available administrative capacities (mainly by bottom-up integration). In practice, however, it is hardly possible to disentangle the distinct effects of VPI dimensions on implementation burden and administrative capacities. Bottom-up integration helps implementation bodies to effectively communicate to policymakers that they lack administrative capacities. Yet, this might lead policymaking bodies to either provide more resources or to not put additional tasks on their shoulders. In a recent example in Germany, local authorities published a public letter stating that their “load limit has been exceeded” (Gemeindetag Baden-Württemberg 2022, 4) and that, in consequence, “new standards, legal rights, and benefits can no longer be implemented.” They conclude by calling the upper levels of government to engage in an “honest and serious discussion” on what the state can actually provide. Likewise, top-down integration might not only lead to the production of fewer policies overall (as policymakers must carry implementation costs) but also to a stronger coupling of the development of implementation burdens and capacities, as policymakers are fully accountable for the implementation success of the policies they adopted. In essence, this implies that understanding the burden-capacity gap requires a holistic approach that considers the combined effects of multiple factors on both burden and capacity, rather than isolating them as separate entities. The VPI concept purportedly provides such a perspective by explicitly focusing on the gap phenomenon and recognizing the complex relationship between its determinants.Footnote 4
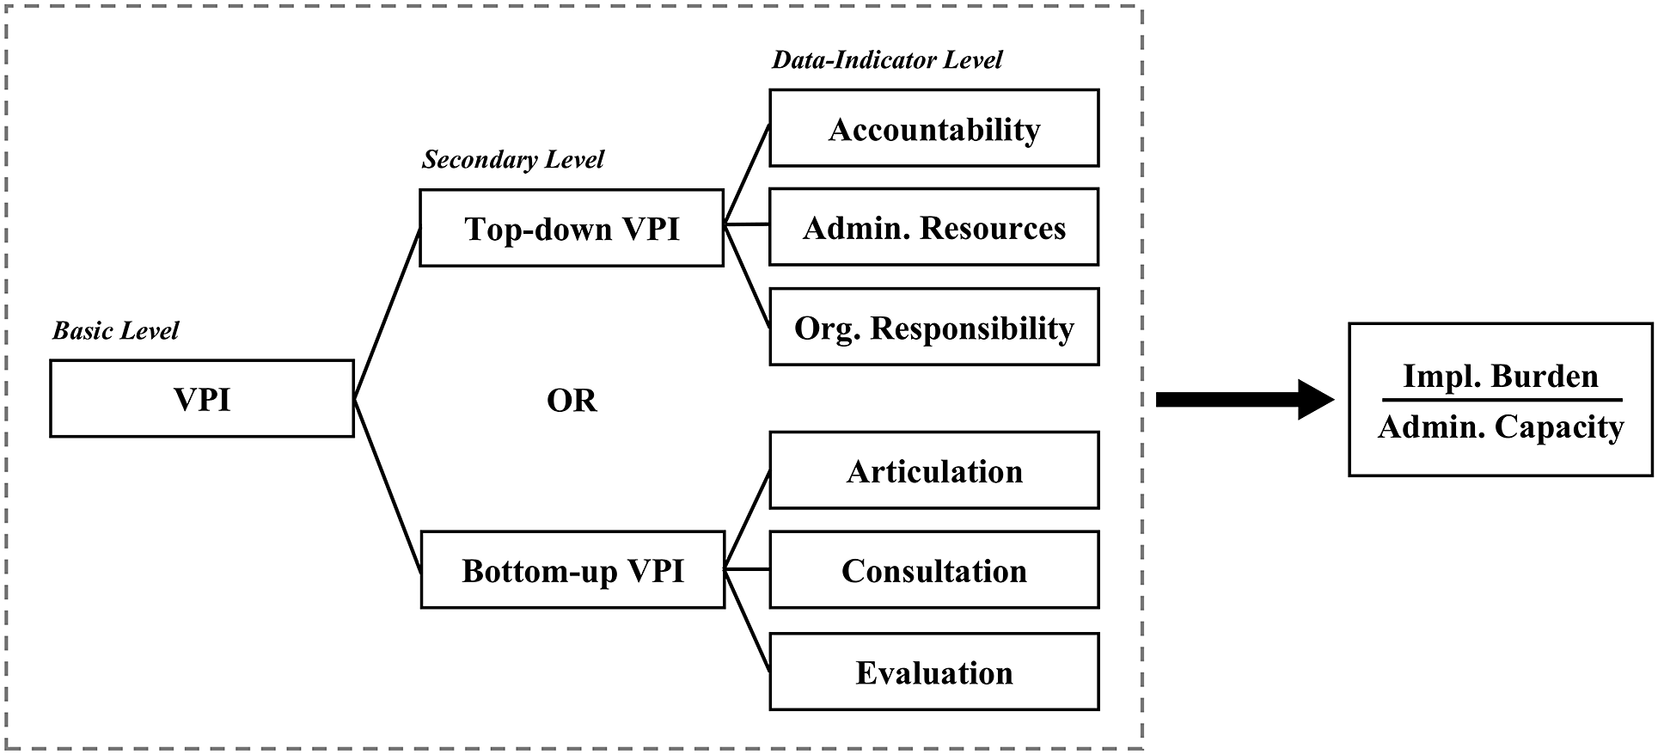
As we have no prior knowledge about the exact causal effect of top-down and bottom-up integration on the burden-capacity gap, we assume substitutability among our two dimensions as the underlying logic of concept formation. This means that the two dimensions are not linked by the operator “and” (necessity) but by the operator “or” (substitutability) (Goertz Reference Goertz2006, chap. 2). This implies that we expect top-down and bottom-up integration to commonly constitute and represent the degree of VPI and to jointly affect the burden-capacity gap. Therefore, our central expectation is that higher levels of sectoral VPI reduce the gap between implementation burdens emerging from policy accumulation and available administrative capacities.
Our central conceptual and theoretical considerations on VPI and its effect on the burden-capacity gap are summarized in Figure 1. Following Goertz’s (Reference Goertz2006) logic for concept formation, our model is structured in three hierarchical levels: at the basic level, we have VPI serving as the core concept; the secondary level expands on this by introducing the aspects of top-down and bottom-up VPI; and lastly, the data-indicator level, detailed further in the section on measuring VPI, comprises articulation, consultation, evaluation, accountability, administrative resources, and organizational responsibility. In this framework, we posit an inverse correlation between VPI and the burden-capacity gap, suggesting that increasing VPI could potentially reduce this gap.
Central Considerations of VPI and Its Effect on the Burden-Capacity Gap
RESEARCH DESIGN
Our country sample comprises 21 OECD countries (see Figure 3). While all the countries under analysis constitute advanced industrialized democracies, the institutional characteristics of their political systems vary substantially. This allows us to study the impact of VPI across a set of (otherwise) very different institutional conditions and, as such, to increase the generalizability of our findings (Gerring Reference Gerring, Box-Steffensmeier, Brady and Collier2008). The investigation period extends from 1976 to 2018.
We focus on the policy areas of environmental and social policies. Within each policy area, we study three policy fields: in environmental policy—air and climate, water, and nature protection policies; in social policy—pensions, unemployment, and child benefits. Studying both environmental and social policies allows us to test our argument across: (1) different policy types (regulatory versus redistributive policies); (2) fields with different degrees of maturity (young versus old fields); (3) quite different requirements for implementation (authorization, inspection, and planning versus public service provision); and, relatedly, (4) differences in political incentives for engaging in capacity expansions in view of voters’ affectedness in case of implementation failures (diffuse matters of environmental quality versus problems in individual service delivery). If our argument holds across this wide range of contextual conditions, it should also apply to other policy areas and constitute a general feature of bureaucratic quality.
Sizing the Burden-Capacity Gap
Our dependent variable is the gap between the size of the implementation burden as indicated by the level of policy accumulation, on the one hand, and administrative capacities, on the other. To assess the “size” of this gap, we calculate the ratio between the level of policy accumulation and the administrative capacities available. The higher the value of this quotient, the larger the burden-capacity gap. To make this measurement work in practice, we need a sound conceptualization of both the level of policy accumulation and the administrative capacities available.
Implementation Burden
We approach the development of the size of the policy-induced implementation burden by tracing changes in the size of sectoral policy portfolios over time (see Adam et al. Reference Adam, Hurka, Knill and Steinebach2019). Policy portfolios are typically composed of two dimensions: policy targets and policy instruments. Policy targets are all issues addressed by governments. Policy instruments are the means governments can use to meet these targets. The differentiation between policy targets and instruments leaves us with a two-dimensional portfolio space. Based on this portfolio space, we can calculate a standardized measure of the sectoral portfolio size that can range from 0 (no policy instrument for any target) to 1 (all policy instruments for all targets).
For illustrative purposes, let us imagine a hypothetical world in which there are only two environmental issues: carbon dioxide (CO2) emissions from cars and CO2 emissions from industrial plants. In this simplified world, the government is also restricted to only two means to reduce CO2 emissions: green taxation and an obligatory emission limit. When this hypothetical government does all it can to fight climate change, it addresses both targets (CO2 emissions from cars and CO2 emissions from industrial plants), each time using its entire policy toolkit, namely a tax and an obligatory emission limit. In this case, we would record a policy portfolio size of 1. If the government addresses all possible policy targets with only one of the two available instruments, we would record a policy portfolio size of 0.5, given that only half the possible combinations are covered. The same scenario would apply if our hypothetical government addressed only one of the two potential targets but used all the instruments in its toolkit. Unfortunately, in the real world, policymakers must deal with multiple policy issues. Luckily, however, they also possess more policy instruments to address those issues.
We measure policy-induced implementation burdens with reference to a benchmark of a (conceptually) maximum number of policy targets and instruments for each policy field under study. We predefined the relevant policy targets and instruments based on other scholarly contributions and the information provided by international organizations, public authorities, and non-governmental organizations. In the area of environmental policy, we identify 50 policy targets across the three subfields of clean air, water, and nature conservation policy. Policy targets are mostly pollutants like ozone, carbon dioxide, or sulfur dioxide in the air but also comprise other substances like lead content in gasoline, sulfur content in diesel, and nitrates and phosphates in continental surface water, as well as environmental objects like native forests, endangered plants, and endangered species. We distinguish 12 types of policy instruments (plus one residual category) that range from hierarchical forms of governing, such as obligatory policy standards and technological prescriptions, to economic (dis-)incentives through taxes, subsidies, and other forms of market intervention. For social policy, we distinguish a total of 27 policy targets spread across the three subfields of unemployment, retirement, and children and seven instrument types, including, for instance, permanent allowances, one-time bonuses, tax exemptions, retention periods, and contributions. A list of all policy targets and instruments is provided in section A of the Supplementary material.
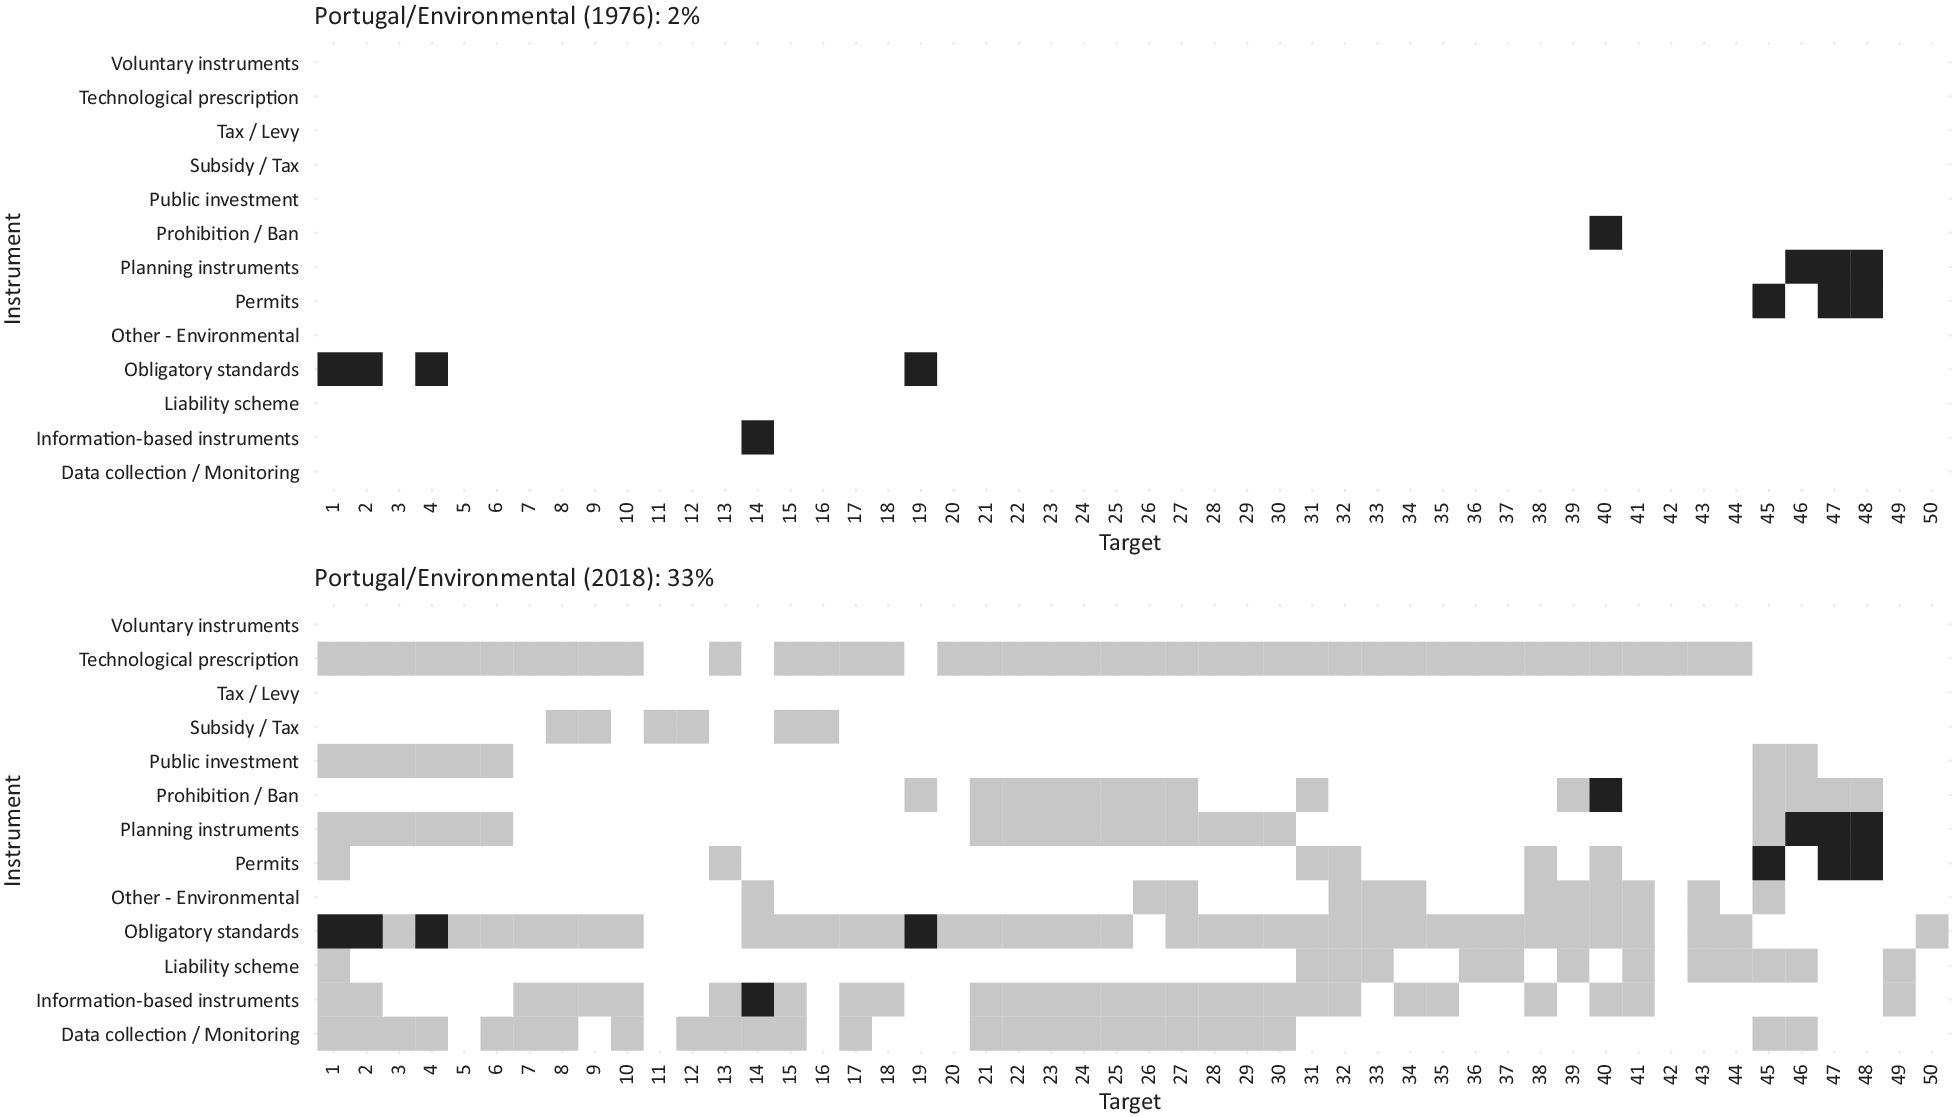
To illustrate our approach more explicitly, Figure 2 presents the Portuguese environmental policy portfolio at two points in time (1976 and 2018). It shows how the policy portfolio in the area of environmental policy has increased from 2 percent of the total space occupied in 1976 to 33 percent in 2018. The boxes marked in gray represent new environmental policy targets and instruments added to the portfolio.
Exemplary Policy Portfolio
Note: The figure illustrates the policy portfolio approach. The boxes marked in gray represent the new environmental target-instrument combinations added to the portfolio between 1976 and 2018.
The data on policy targets and instruments in place has been collected within the CONSENSUSFootnote 5 and the ACCUPOLFootnote 6 projects.Footnote 7 Changes in policy targets and policy instruments were assessed by scrutinizing all relevant national legislation that has been adopted throughout the observation period. The assessment hence relies on a comprehensive data collection encompassing all relevant national legal documents—laws, decrees, and regulations—in the specific policy areas under review. The legislation was collected from national legal repositories. Analysis of legislative content and the coding was carried out and cross-validated by the project teams. Additional checks of data reliability were performed based on legal commentaries and secondary literature. A coding manual (see section A of the Supplementary material) helped to extract the relevant information from the legal documents. Our measurement of policy-induced implementation burdens is therefore derived from the number of policy instruments and policy targets. An illustrative overview of the temporal evolution of the 21 national sectoral policy portfolios proxying implementation burden over time can be found in Figure A2 of the Supplementary material.
Administrative Capacities
Administrative capacities can imply very different things in practice (Lodge and Wegrich Reference Lodge and Wegrich2014). Some policies require public authorities to deliver policies themselves (delivery capacity). Other policies, in turn, require public authorities to regulate, monitor, and enforce policy delivery by non-state actors (regulatory capacity). Some policies largely depend on the administrations’ ability to coordinate and mediate between various actors and authorities. Moreover, policies might require the ability to evaluate the state’s courses of action within highly complex environments (analytical capacity). Lastly, the success of some policies—in particular, taxes, charges, and fees—depends on the administrations’ capacity to extract resources from society and manage the respective revenue streams (extractive capacity) (Bäck and Hadenius Reference Bäck and Hadenius2008).
By taking an aggregate view of changes in sectoral policy portfolios and the corresponding implementation tasks, we also require a rather broad-based measure that encompasses the different dimensions of administrative capacities. Unfortunately, most of the available measures suffer from shortcomings or capture only some dimensions of administrative capacities (Kaufmann, Kraay, and Mastruzzi Reference Kaufmann, Kraay and Mastruzzi2011). We decided to construct our own measure of administrative capacities using a combination of different data sources (for a similar approach, see Fernández-i-Marín et al. Reference Fernández-i-Marín, Hinterleitner, Knill and Steinebach2023a; Reference Fernández-i-Marín, Hinterleitner, Knill and Steinebach2023b; Hanson and Sigman Reference Hanson and Sigman2021). In essence, these provide information on the quality of national public administration provided by the V-Dem 10 dataset (Coppedge et al. Reference Coppedge, Gerring, Knutsen, Lindberg, Teorell, Altman and Bernhard2019) and the World Bank (2023). Moreover, we include the Weberianness index by Rauch and Evans (Reference Rauch and Evans2000) and the index of information capacity as generated by Brambor et al. (Reference Brambor, Goenaga, Lindvall and Teorell2020). In sum, our approach relies on the assumption that administrative capacity is a multifaceted phenomenon and that only through the combination of different data sources we can come close to the actual administrative capacities available. Table 1 provides a summary of different data sources and how they are transformed for the final administrative capacity score.
Variables and Data Sources Used to Construct the Administrative Capacity Score
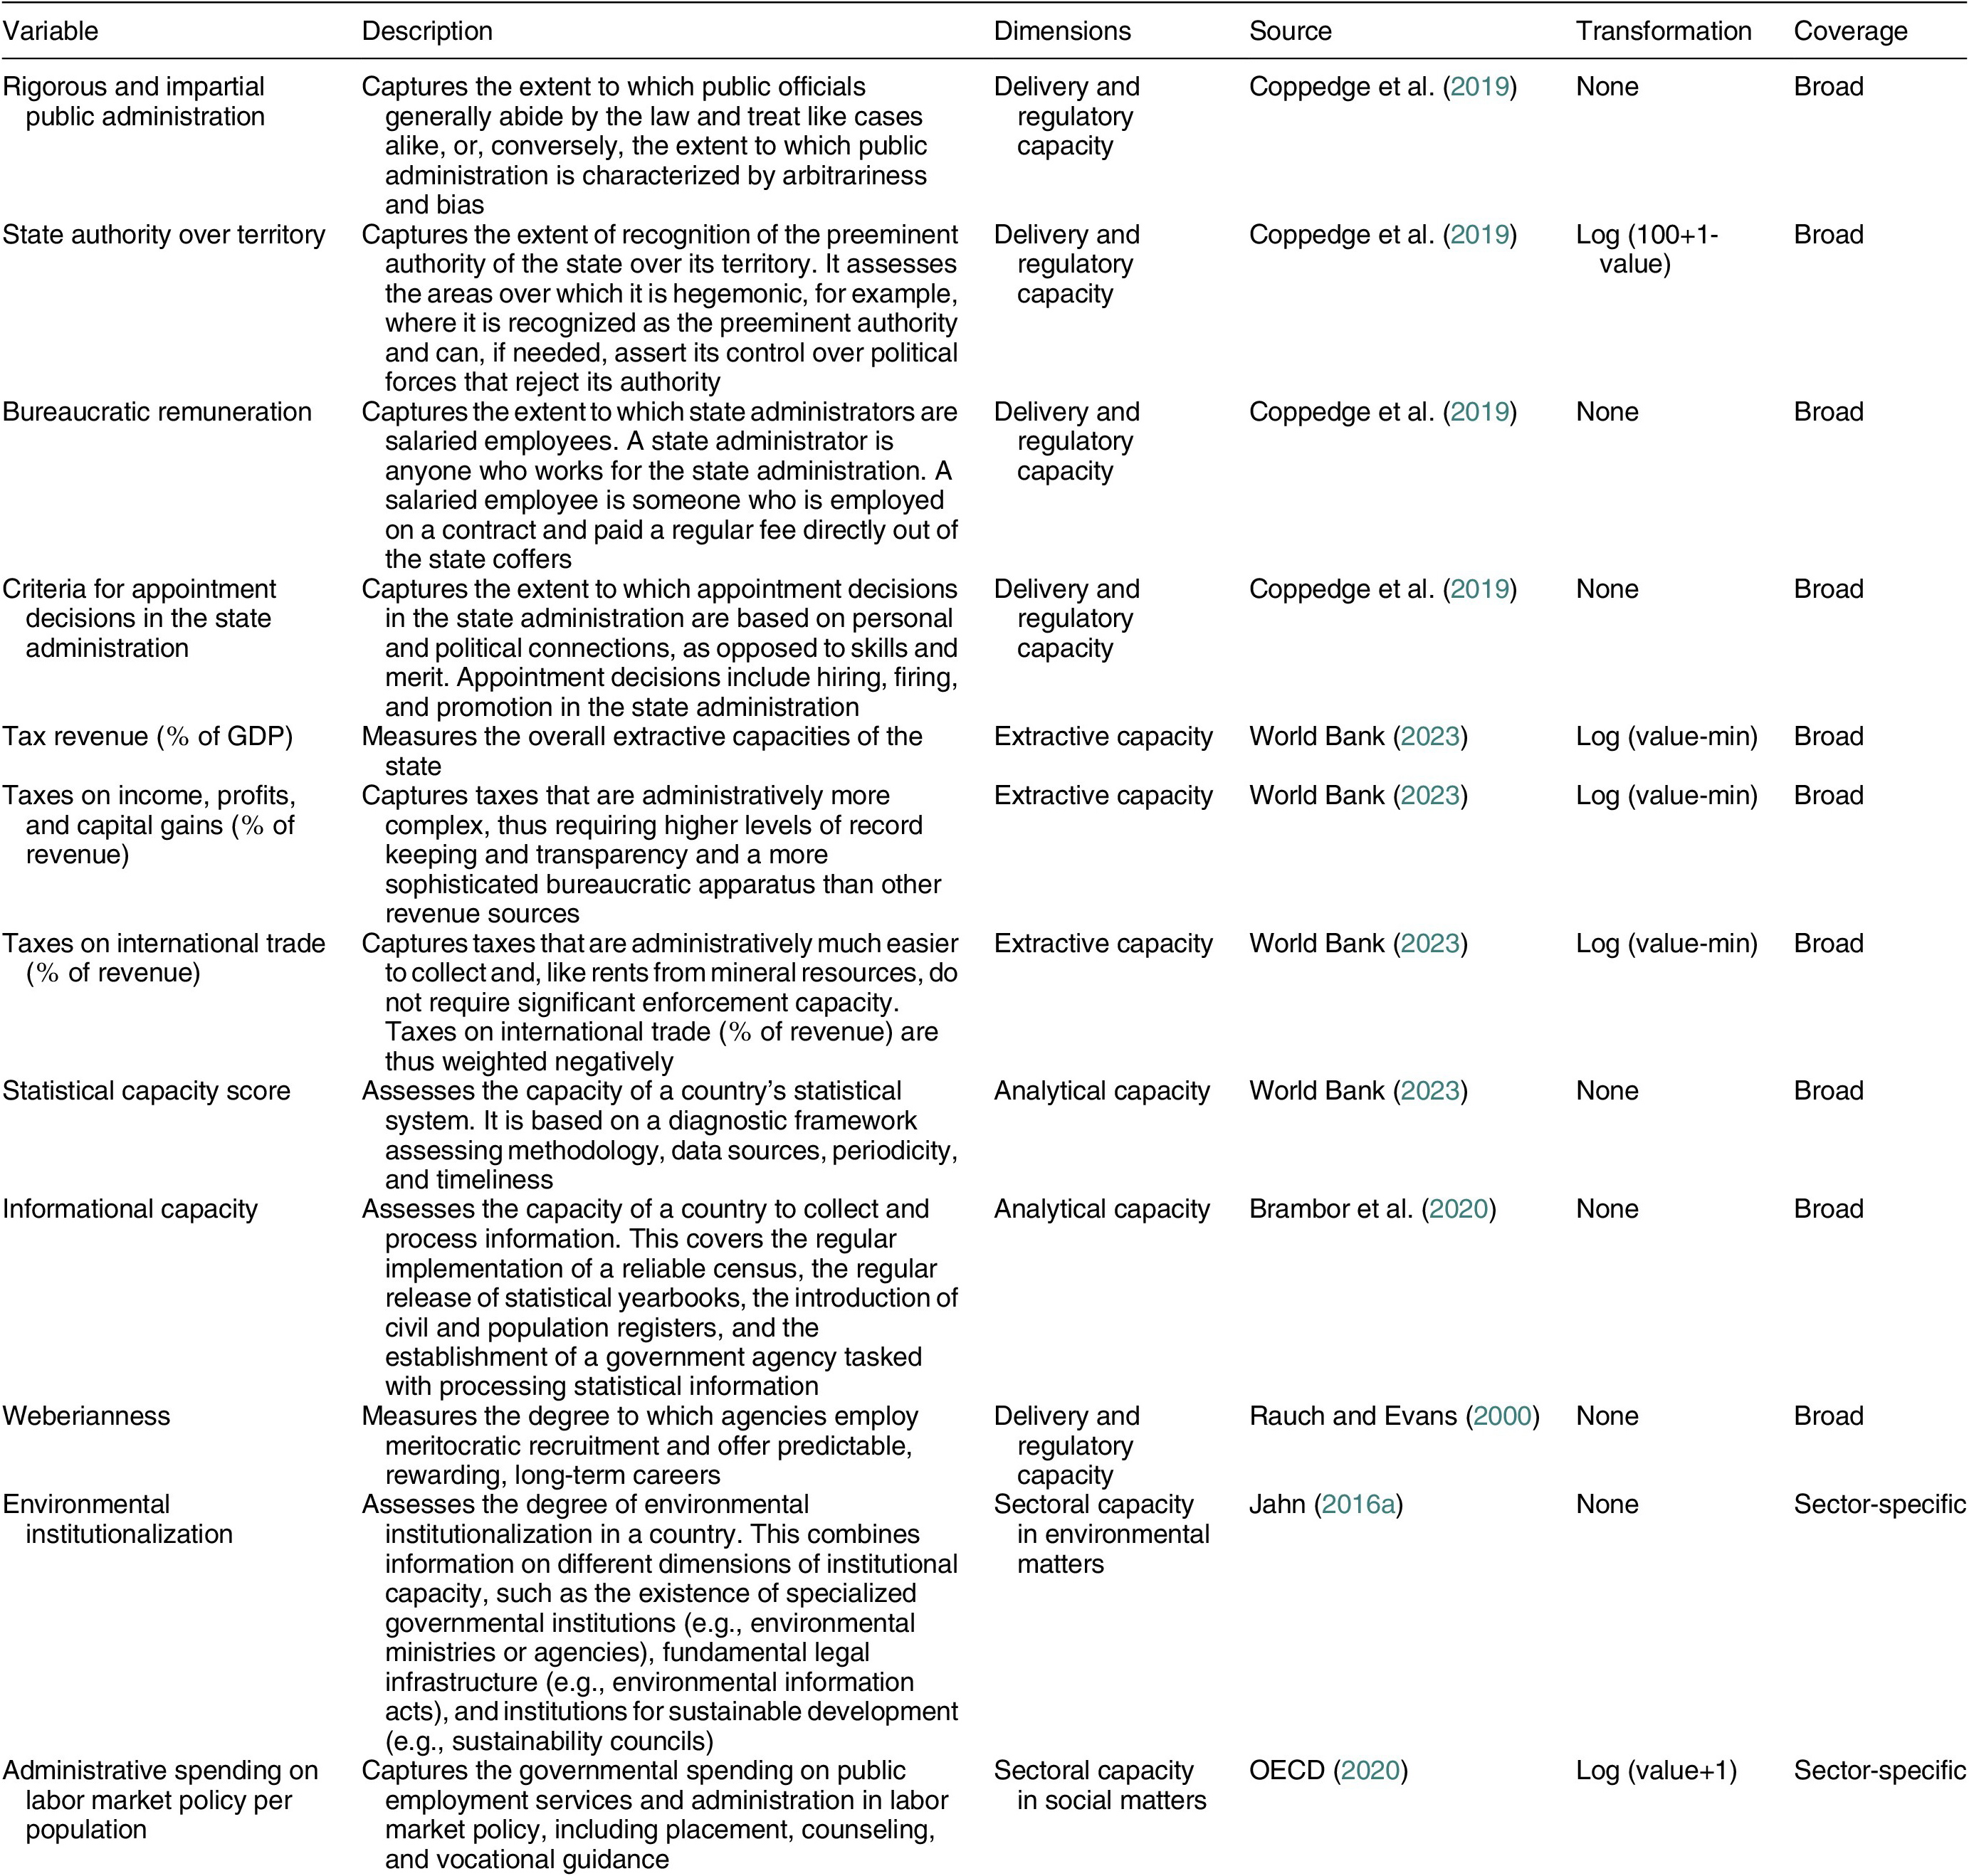
In addition to these general measures of administrative capacities, we adjust our measure for sectoral differences and peculiarities. This indicates how much emphasis the government puts on the implementation of environmental or social matters. For environmental policy, we use the environmental institutional capacity index provided by Jahn (Reference Jahn2016a). This index combines information on different dimensions of institutional capacity, such as the existence of specialized governmental institutions (e.g., environmental ministries or agencies), fundamental legal infrastructure (e.g., environmental information acts), and institutions for sustainable development (e.g., sustainability councils). For social policy, we refer to the government’s spending on public employment services and administration in the area of labor market policy, including placement, counseling, and vocational guidance. These data can be readily obtained from the Social Expenditure Database of OECD (2020). While this database provides information on various kinds of social spending (e.g., old age, family, or health), it explicitly reports administrative expenses of labor market policy implementation only.
We performed a Bayesian latent-variable model to combine different sources into two related scores of administrative capacities. Both scores contain broad, general variables and one additional sector-specific factor. The first score contains the specific variable for the environmental sector (environmental institutionalization), while the second score contains the social sector-specific one (administrative spending on labor market policy). The model produces posterior estimates of the latent construct (a state’s administrative capacity) by averaging information from each source in a similar way as a factor analysis.
Bayesian latent variable models provide several advantages when dealing with datasets of varying quality. They effectively handle missing data issues, account for measurement errors through explicitly modeling relationships between observed and latent variables, and enable the estimation of credible intervals or posterior distributions to capture parameter estimate uncertainty, even in the presence of varied data quality. Furthermore, these models capture dependencies, correlations, and hierarchical structures within the data, making them well-suited for handling datasets with complex structures and varying levels of reliability (Reuning, Kenwick, and Fariss Reference Reuning, Kenwick and Fariss2019).
We apply a geometrical loss function and use the parameters’ posterior means as our point estimates for the final scores. Section C of the Supplementary material (Figure A3) presents the temporal evolution of the administrative capacity scores for each country and sector. Here, we also report several indicators of reliability, including correlations between the variables and the resulting score and the discriminations of the original variables. The consistency of the resulting score of administrative capacity is supported by a congeneric reliability (omega) value of 0.78 in the environmental sector and 0.79 for the social sector.
A challenge for our analysis is that the ratio between the level of policy accumulation and available administrative capacities can be meaningfully interpreted only with reference to an empirical benchmark or anchor. We do so by using the mean value along both dimensions as a reference value. More precisely, our sectoral measures of portfolio size and administrative capacity are centered at 0 (mean value) and scaled at one standard deviation. By also testing our models with other ways of calculations, we ensured that the transformation did not affect our key results (see section E.3, Figure A11 of the Supplementary material). As a consequence of this transformation, most of our observations range between −2 and +2. A value of 0 indicates that the numerator and the denominator are at their global mean or jointly move in one direction (smaller portfolios and lesser capacities or greater portfolios with bigger capacities). Finally, we additionally validate our concept and measure of the burden-capacity gap by showing that the size of the gap between sectoral implementation burdens and available capacities is indeed negatively associated with sector-specific policy performance: A widening burden-capacity gap generally decreases the effectiveness of public policies as reported in section F of the Supplementary material. At a value of around 1 of the burden-capacity gap, additional policy measures prove to be largely ineffective.
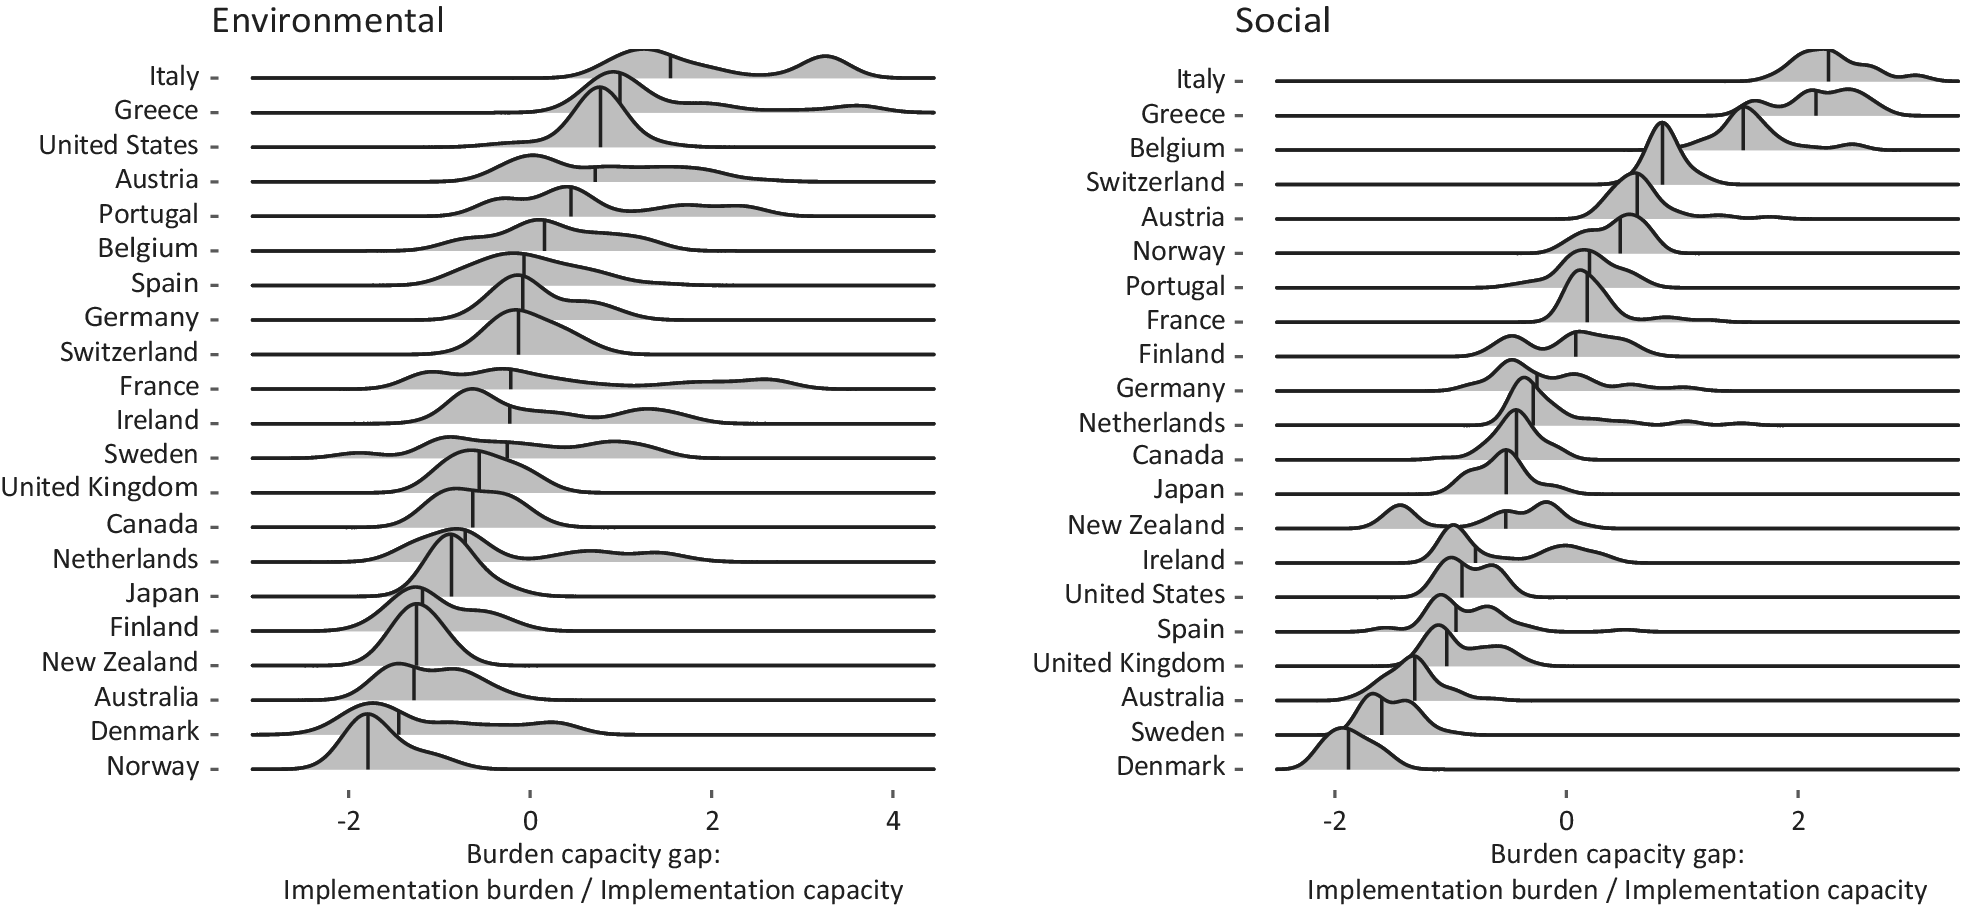
Figure 3 presents the burden-capacity gap for all countries under analysis. In environmental policy, the country with the largest average gap is Italy (1.97), while the country with the smallest average gap is Norway (−1.65). In social policy, Italy has again the largest average gap (2.30), while Denmark has the smallest (−1.86).
The Burden-Capacity Gap for 21 OECD Countries (1976–2018)
Note: The figure represents the distribution of the burden-capacity gap for each country. The vertical lines show the median.
Measuring VPI
As discussed above, we expect the burden-capacity gap to be primarily affected by the degree of VPI. VPI, in turn, consists of two dimensions: top-down integration and bottom-up integration. As discussed above, both dimensions have the potential to affect either the number of policies produced or the administrative capacities available. Given that both dimensions can theoretically have the same effect, we simply aggregate the two dimensions, that is, logical “or” (Goertz Reference Goertz2006). The logic of substitutability also applies to our indicators manifesting either the degree of top-down integration (accountability, administrative resources, and organization) or bottom-up integration (articulation, consultation, and evaluation). In practical terms, this implies that, for instance, a lack of policy evaluation efforts can be compensated by well-organized implementation authorities who are able to articulate and advocate a common position. At the same time, positive (e.g., more formal accountability) and negative (e.g., less consultation opportunities) changes can offset each other.
Overall, we have six different indicators capturing the manifestations of VPI’s influence on the distribution of implementation costs (accountability, administrative resources, and organization) and policy design (articulation, consultation, and evaluation). Depending on the exact institutional setup and the actual reliance on these integrative channels, each indicator can take on the values of 0 (low), 0.5 (medium), or 1 (high). In sum, our VPI index thus ranges from a theoretical minimum value of 0, representing the complete absence of vertical integration, to a maximum value of 6, indicating a full integration. Table 2 presents indicators and empirical examples for the top-down and Table 3 for the bottom-up VPI dimensions.
Indicators and Examples of Top-Down VPI
Indicators and Examples of Bottom-Up VPI
The task at hand is to strike a balance between abstractness and specificity when measuring a latent concept, such as VPI. On the one hand, it requires predefining a set of items (see indicators below) that can generate reasonably accurate estimates for each dimension, while encompassing the overall concept. These items should capture abstract dimensions related to VPI, refer to observable states in the real world, and be as clear as possible when applied to specific cases. On the other hand, coding particular cases necessarily and inevitably involves expert judgment, no matter how clearly an indicator is formulated (Hooghe, Marks, and Schakel Reference Hooghe, Marks and Schakel2008). To strike a balance between these different requirements, our coding methodology for national VPI patterns is underpinned by a meticulous analysis and comparison of secondary literature, along with official legal, statutory, and organizational documents of varying origins, such as parliamentary, governmental, or administrative. We further bolstered our methodology through consultations with country-specific experts, namely, scholars specializing in political and administrative sciences. The project members, the authors of this study, undertook the management and supervision of a team of five to six country specialists, ensuring a high degree of consistency and validity in their coding practices. Each indicator evaluation was cross-verified twice: once against a case possessing the same indicator value, and once against a case with a different indicator value. This dual verification process ensured uniformity in assessing cases with identical setups while guaranteeing distinct coding for cases with different circumstances. In conclusion, every data point included in our analysis represents a mini case study, revealing insights into the unique VPI patterns within a country or sector at a given point in time.Footnote 8
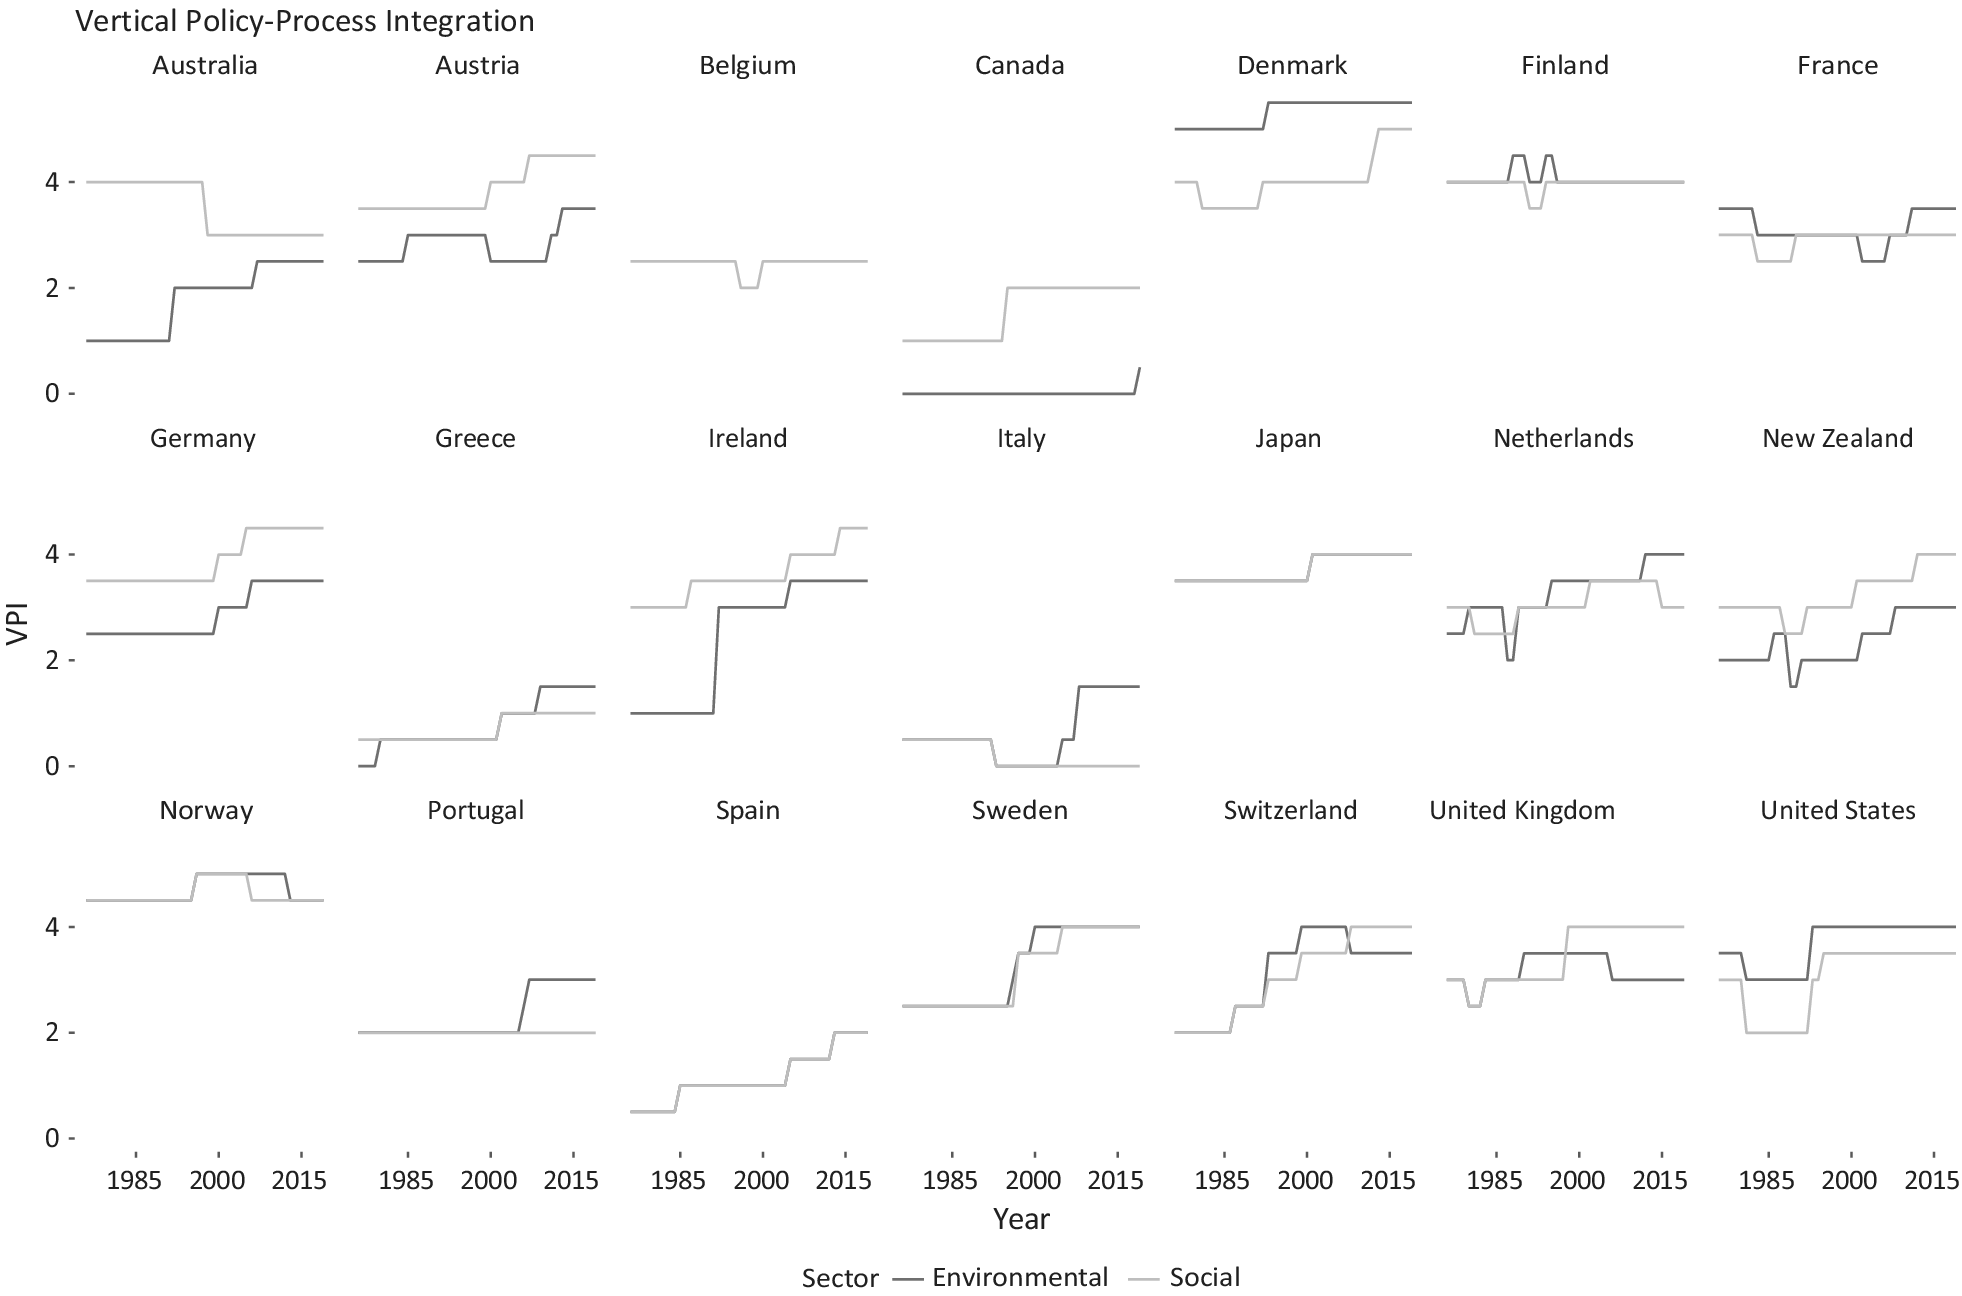
Figure 4 presents the VPI score per sector and country over time. The figure reveals that the VPI varies (1) across countries, (2) over time, and (3) even between policy sectors within the same countries. Moreover, it reveals that (4) the VPI goes beyond the mere structural features of the state. While, for instance, Belgium and Canada seem to struggle to couple policymaking and implementation in their multilayered systems of governance, other federalist countries such as Germany and Switzerland achieve rather high levels of VPI. Lastly, Figure A1 in the Supplementary material shows that in some countries and sectors, (5) values for top-down and bottom-up VPI are well aligned while in others, they develop very differently.
The Development of VPI Values across Countries, Sectors, and Time
Alternative Explanations
Because there are factors other than VPI that might affect the burden-capacity gap, we include several control variables in our analysis. First, we control for political factors. Governments that face strong political competition have—independent of the political color of the parties in office—a particularly strong short-term incentive to meet people’s demands by developing new policy targets and instruments regardless of whether they can de facto afford it given existing administrative capacities. To assess the degree of political competition, we rely on the electoral competitiveness index as provided by Kayser and Lindstädt (Reference Kayser and Lindstädt2015). This index estimates the “perceived loss probability” of the parties in government based on two interrelated factors: (1) whether voters will change their vote from one party to another, and (2) whether these vote shifts will ultimately make a difference for the electoral outcome, that is, the legislative seat share.
Second, to capture the effects of political institutions on the burden-capacity gap, we focus on institutional constraints and neo-corporatism. For data on institutional constraints, we rely on the indicator provided by Henisz (Reference Henisz2002). This indicator captures not only the number of independent veto points over policy outcomes but also the distribution of preferences of the actors that inhabit them and hence whether the actors possessing veto power hold similar or divergent policy preferences. To capture the effects of corporatism, we rely on the time-variant index provided by Jahn (Reference Jahn2016b). Jahn provides a comprehensive measurement of countries’ systems of interest intermediation based on the structure, function, and scope of corporatist arrangements.
Third, we control countries’ per capita GDP and the level of debt. These two variables capture the financial resources and flexibility the government possesses to either alter its policy portfolios or expand the administrative capacities available. Fourth, we check whether a country is a member of EU. EU has been a prolific producer of public policies, particularly in environmental policy. Moreover, empirical evidence suggests that member states tend to tailor supranational policies to their national context by increasing the “level of customized density” (Zhelyazkova and Thomann Reference Zhelyazkova and Thomann2022, 439), that is, the number of policy targets and instruments in place. EU membership can hence be expected to be an additional driver of policy accumulation while not (necessarily) involving additional national administrative capacities. Lastly, countries’ decisions to adopt new policies that may alter the burden-capacity gap can emerge from international policy diffusion. Here, we expect that governments are more prone to follow one another when they are geographically close or connected via trade ties. We control these aspects by checking whether countries have a common border and by examining the share of goods being exported from one country to the other. We standardize all our continuous variables to half a standard deviation so that we can contrast their relative importance and compare continuous variables with binary ones (Gelman Reference Gelman2008).
EMPIRICAL FINDINGS AND DISCUSSION
In the following, we first present the results for our general model and introduce additional model specifications. Thereafter, we discuss the plausibility of our measurements and perform different robustness checks.
General Results
We explain the year-to-year changes in the ratio between the implementation burdens and the capacities by a linear model in which we control for unequal variances (heteroscedasticity, clustered errors) by country. To model time dynamics, we include an autoregressive component of order one (AR1) and control for time-fixed effects (decade dummy). Standard errors are clustered by countries. All parameters are estimated using Bayesian inference. The full model specification can be found in Box 1. All variables are lagged by one year. For the VPI index, we use a three-year rolling average to account for the fact that political and administrative organizations and processes cannot easily be changed from one day to the next but typically take time to sediment and unfold their effects on policymaking. A three-year rolling average implies that we expect some effects from year one but that it takes up to three years until the full effect of institutional reform can be detected. We expect the strongest effect on policymaking procedures that just started after the reforms have been completed. While policymaking procedures vary from one policy to the other and between different institutional setups (countries), we anticipate that it takes about one year for a policy to be drafted in the ministerial bureaucracy and another one to two years until the policy is discussed and ultimately passed in the parliament (Hiroi and Rennó Reference Hiroi and Rennó2018).Footnote 9
Model Specification
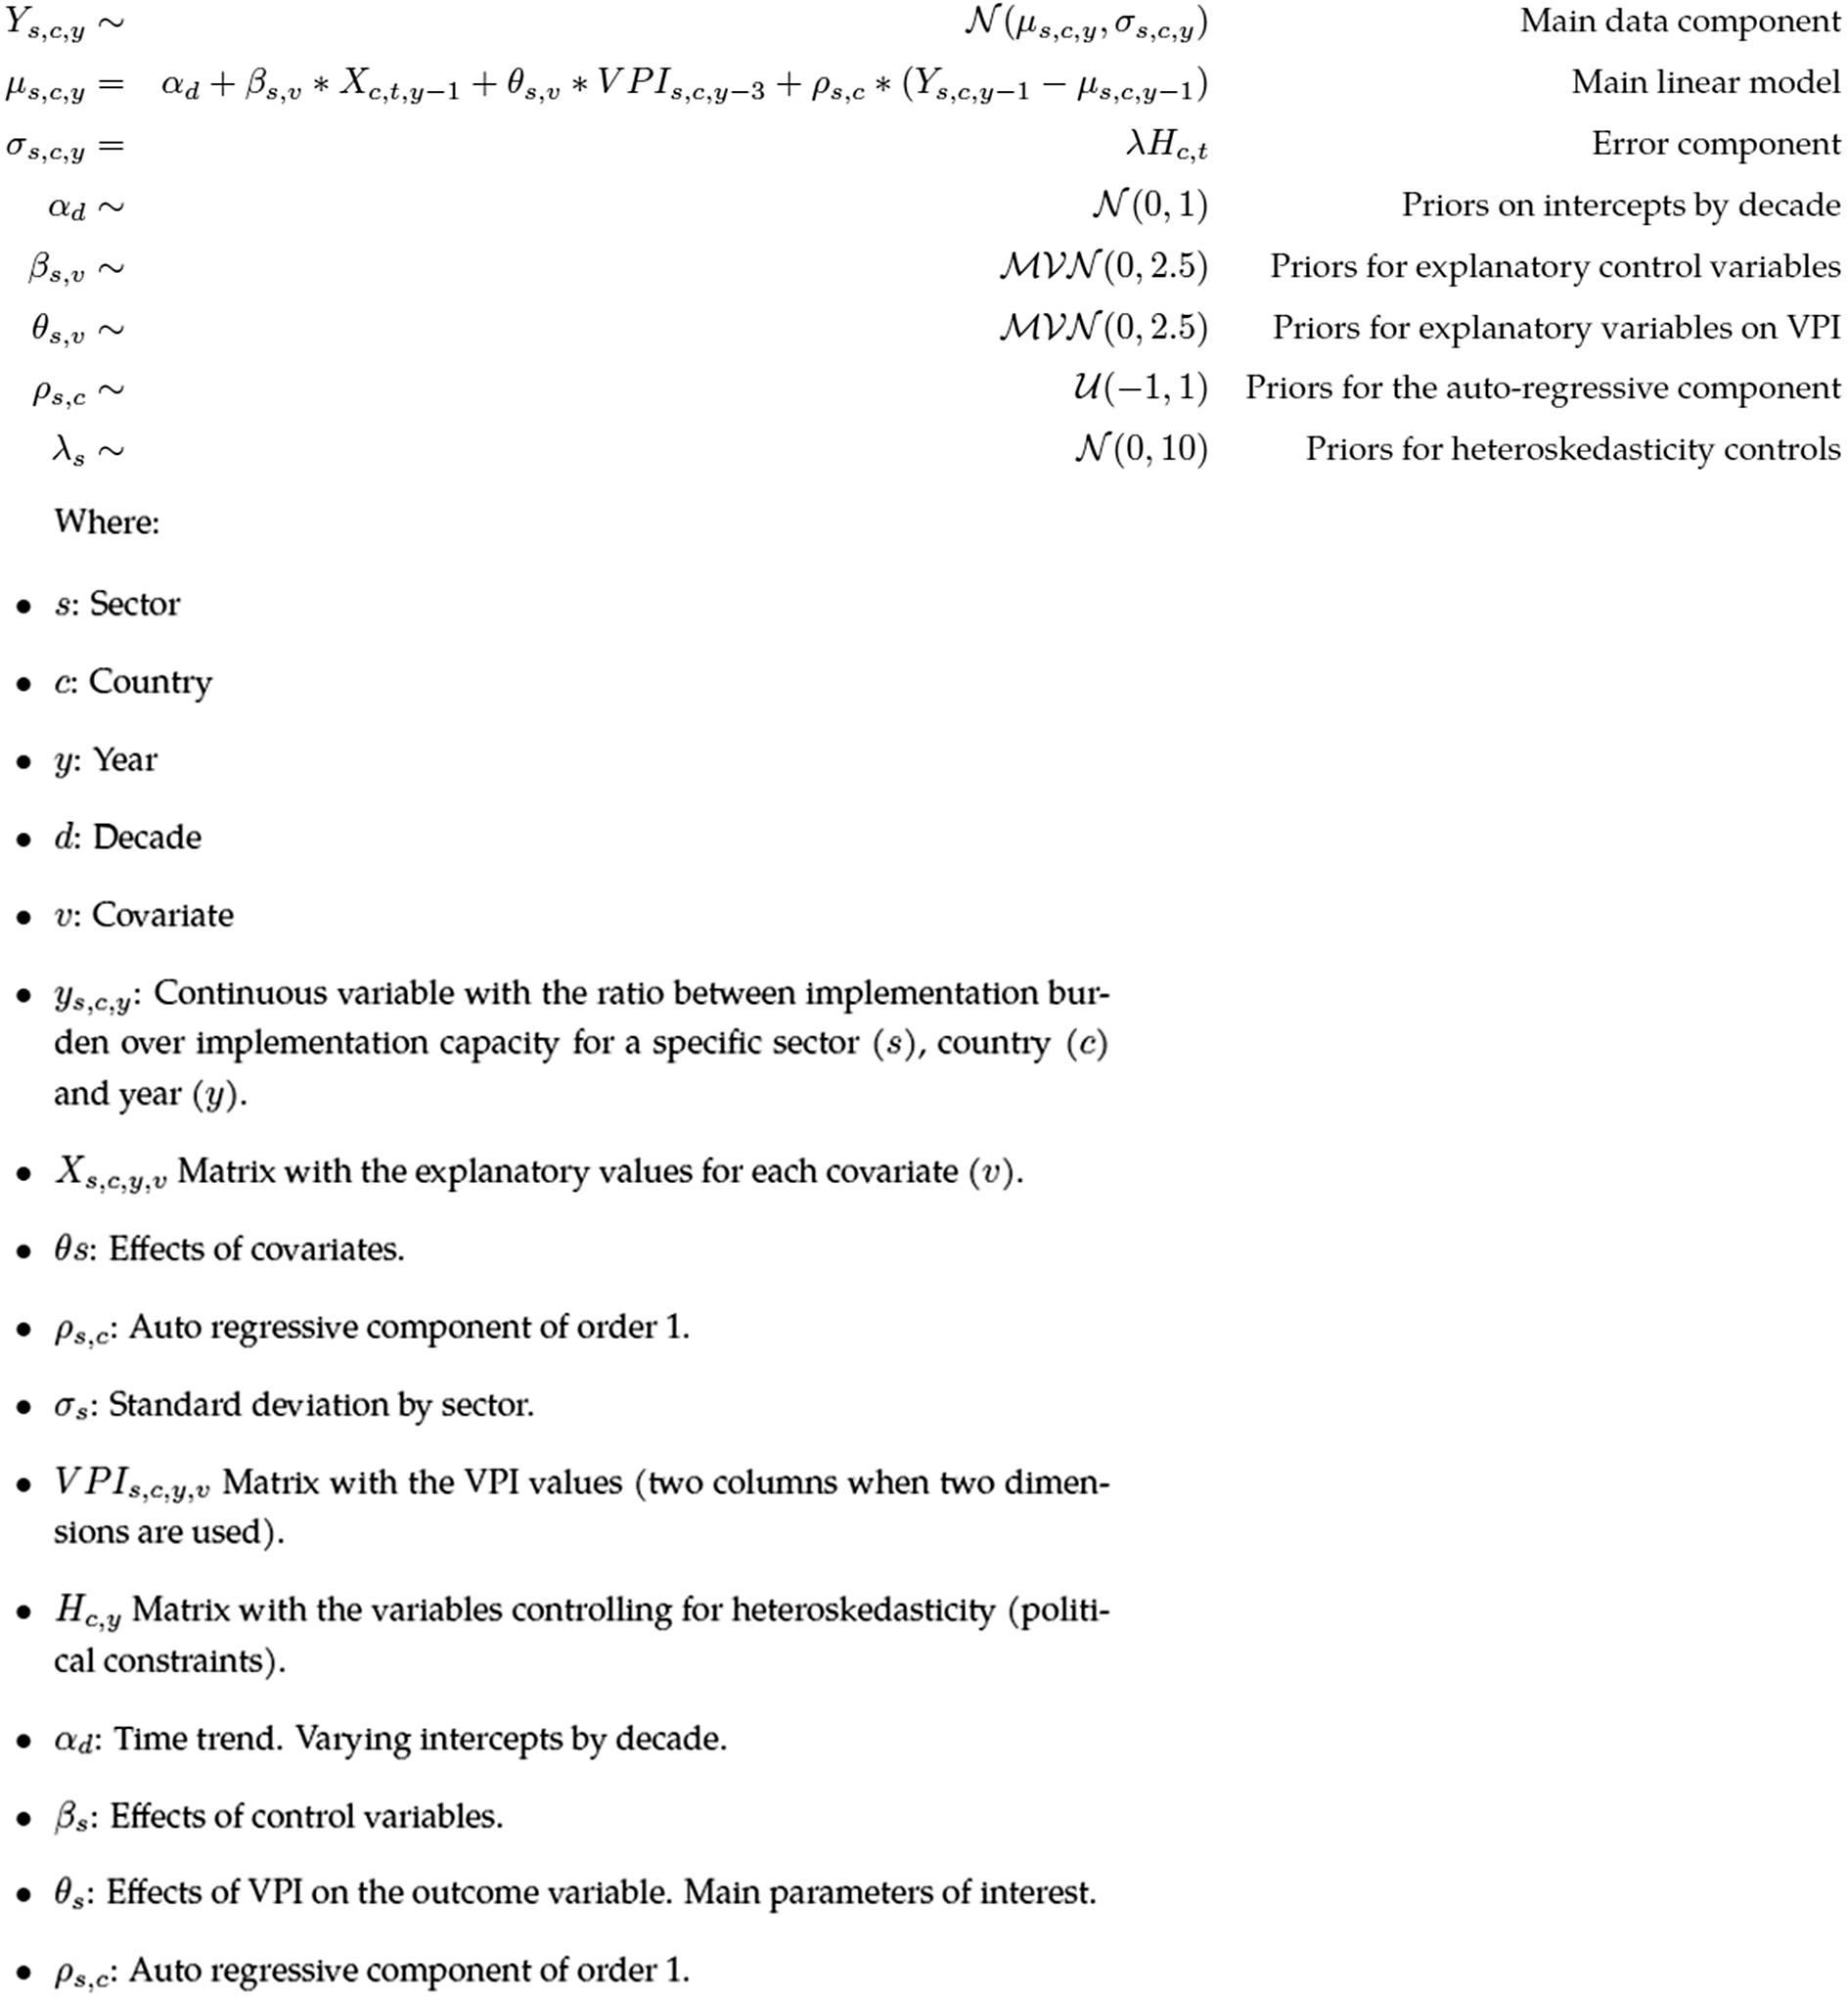
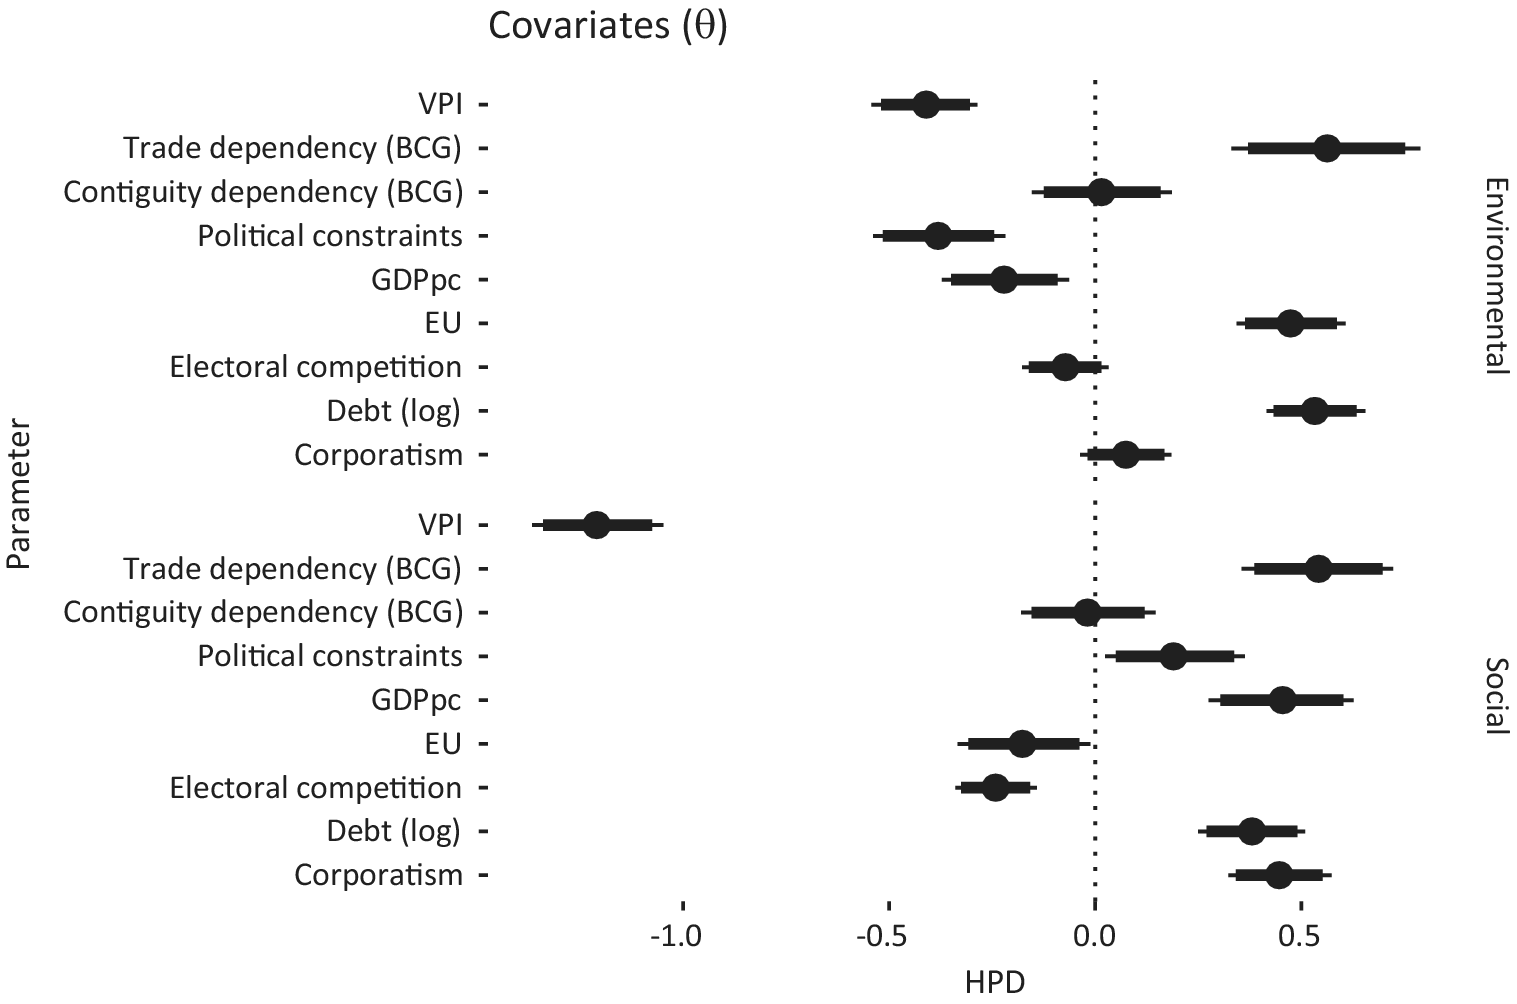
Figure 5 presents our key results. They can also be looked up in section D of the Supplementary material, together with additional material on our model testing. In total, the factors considered account for 59% of the variance of the dependent variables in environmental and 56% in social policy. The empirical analysis reveals that higher levels of VPI lead to a stronger match between policy accumulation and the administrative capacities available in both areas.
Determinants of the Burden-Capacity Gap, Aggregated VPI (21 Countries, 1976–2018)
Note: Highest posterior densities (HPD) of the main parameters of interest (β) (95% credible interval). All parameters are standardized to two standard deviations and can therefore be roughly interpreted as the effect of an increase in one interquartile range. Supplementary Table A6 in the Supplementary material presents the results in a tabular form.
In Figure A17 of the Supplementary material, we provide an additional analysis, separately assessing the impact of VPI on the numerator and denominator. When examining the unique impact of VPI on each “side” of the gap, our findings reveal that higher levels of VPI consistently correlate with fewer policies, yet greater capacities in social policy. However, in the context of environmental policy, VPI principally results in an increased allocation of resources for implementers, rather than a reduction in the number of policies.
This outcome appears logical given that environmental policy is frequently depicted as a highly internationalized policy field, particularly in areas such as air and water quality, which were the focus of our study (Knill, Debus, and Heichel Reference Knill, Debus and Heichel2010). Despite the perception of reduced leeway for governments to produce fewer policies within this field, our research indicates that enhanced VPI still results in a smaller gap size. This suggests two primary points: first, the burden-capacity gap is a distinct empirical phenomenon that is not merely about having more or fewer policies and it represents a different consideration altogether, and second, it needs the VPI to comprehensively understand this phenomenon.
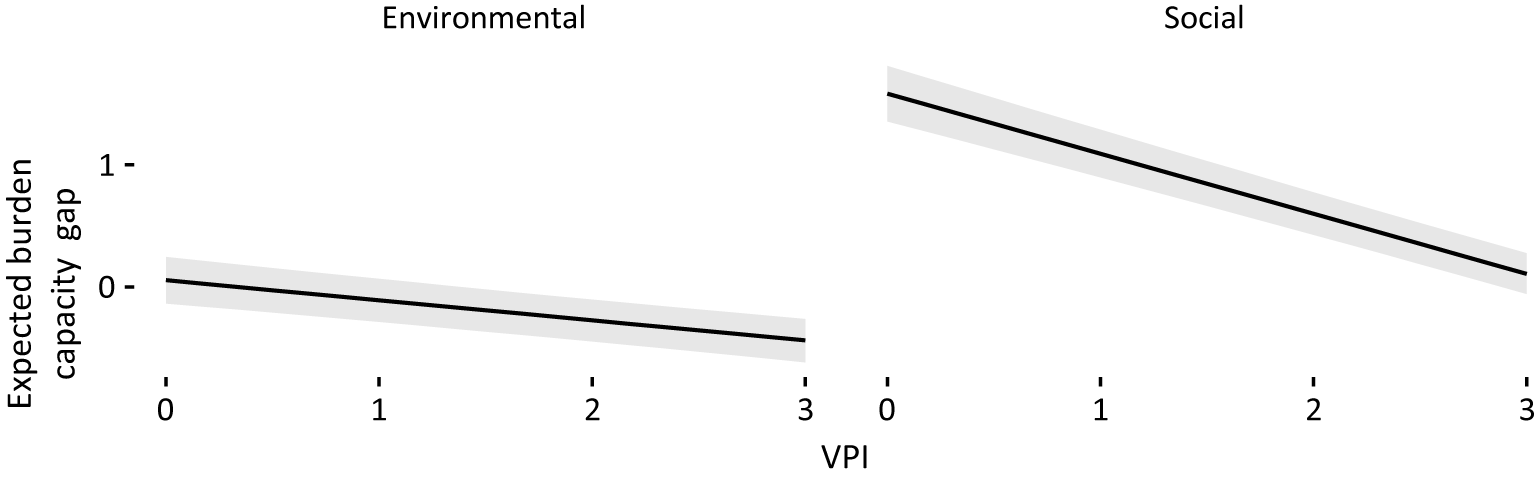
But how strong is the VPI effect exactly? Figure 6 provides a detailed assessment of the magnitude of the VPI’s effects when all other variables are kept at their mean values (see Supplementary Table A5). In environmental policy, moving from the minimum to the maximum VPI value implies a decrease in the burden-capacity gap from 0.10 to −0.40. This sounds rather small but equals a change of almost half a standard deviation. In the area of social policy, the effect is even more pronounced; here, the gap size decreases from an expected 1.6 to 0.10 when the VPI goes from the minimum to the maximum value. This equals a reduction of almost one and a half standard deviations.
Magnitude of the VPI Effect: Expected Change in the Burden-Capacity Gap
Note: The gray areas define 95% credible intervals. Descriptive statistics are shown in Supplementary Table A5, with full model specifications in Supplementary Table A6.
In contrast to the degree of VPI, the effects of most other variables vary across the policy sectors—not only in terms of their strength but also in terms of direction. These differing effects, however, are quite plausible when considering the peculiarities of the respective policy areas. First, it is for social policy only that we observe the effects of electoral competition on the burden-capacity gap. Here, higher competition contributes to a lower gap. As voters are directly affected by social policies and are hence highly aware of these measures’ effectiveness, merely demonstrating responsiveness might not be sufficient for vote-seeking politicians. They need to ensure that these policies actually work (for comparable findings, see Dasgupta and Kapur Reference Dasgupta and Kapur2020).
Second, political constraints seem to restrict excessive growth in environmental policy but have the exact opposite effect on social policy. An explanation could be that the redistributive character of social policies requires governments to engage in side payments and package deals when consensus requirements are particularly high (Scharpf Reference Scharpf1988). This argument also explains that corporatism is associated with a higher burden-capacity gap in social policy. Close cooperation between government and societal associations seems to facilitate the adoption of policy packages at the expense of third parties not participating in these negotiations (here the implementation level).
Third, higher levels of debt lead to a greater mismatch between policy accumulation and available administrative capacities in both policy areas. Essentially, this implies that governments facing budgetary pressure do not tend to produce less policies but in fact, save on administrative capacities. This finding resonates with the argument made above that policymakers face perverse incentives to overproduce policies even when knowing that effective implementation cannot be guaranteed. For the level of economic prosperity, we find the exact opposite relationship.
Fourth, turning to international factors, EU membership tends to increase the burden-capacity gap in environmental policy but to have an inverse effect on social policy. This is highly plausible, as the EU possesses far-reaching policymaking competencies in environmental matters. By contrast, member states have transferred considerably less social policy competences to the EUFootnote 10. In addition, diffusion effects emerging from higher trade dependence also come with higher burden-capacity gaps in both sectors. Close trade connections seem to stimulate the adoption of additional policies. The most likely reasons for this connection are the harmonization of domestic regulatory standards in the case of environmental policy (Vogel Reference Vogel1995) and governments’ attempts to compensate globalization losers for the risks associated with increased exposure to international trade in the case of social policy (Walter Reference Walter2010). It seems that this trade-induced policy growth is not compensated by corresponding expansions of administrative capacities.
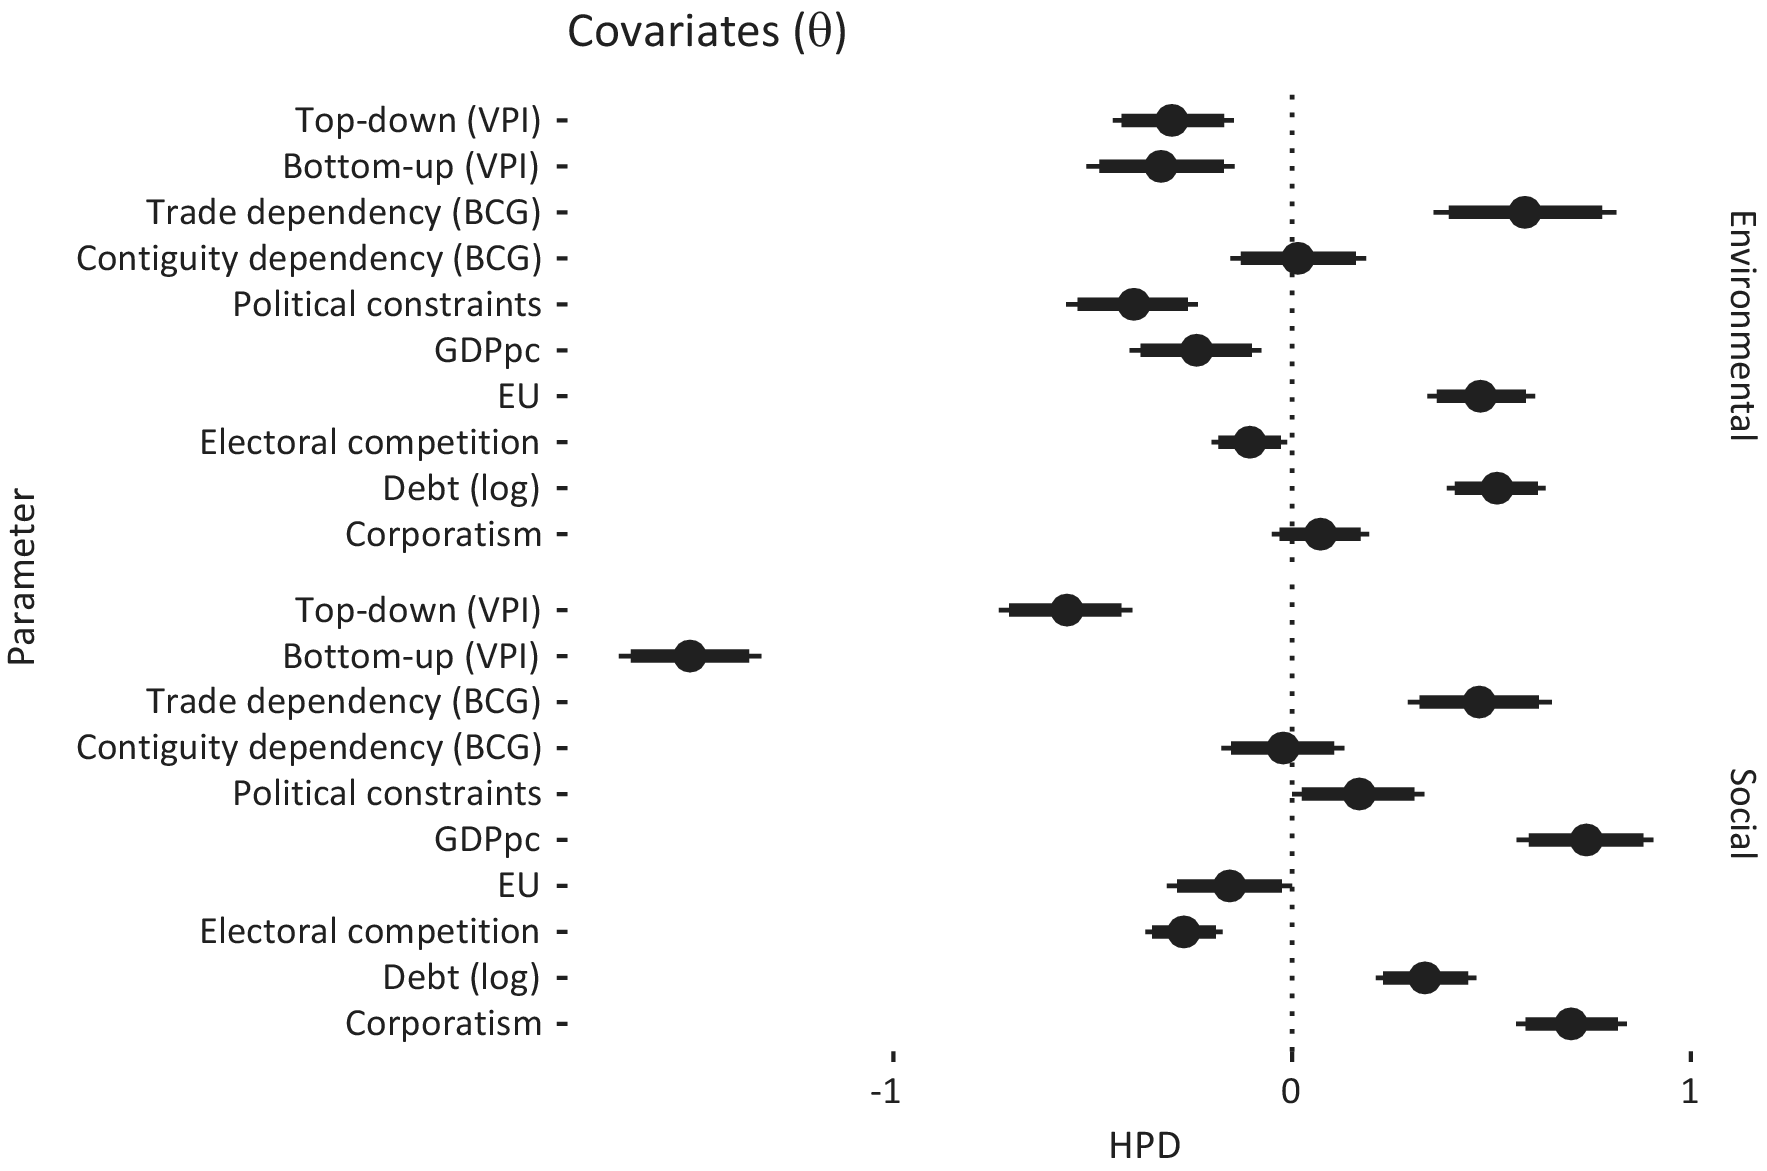
Up until this point, our analysis has primarily focused on examining how the formation of VPI has influenced the burden-capacity gap. To explore what happens when we disaggregate the concept into its constituent dimensions, Figure 7 includes the bottom-up and top-down VPI as separate variables. The findings show that both dimensions exhibit a negative and significant influence on the burden-capacity gap. These findings empirically support our logic of concept formation, specifically the notion of substitutability.
Determinants of the Burden-Capacity Gap, Disaggregated VPI (21 Countries, 1976–2018)
Note: HPD of the main parameters of interest (β) (95% credible interval). All parameters are standardized to two standard deviations and, therefore, can be roughly interpreted as the effect of an increase in one interquartile range. Supplementary Table A7 presents the results in a tabular form.
Plausibility and Robustness Checks
There are naturally several aspects of our conceptual and methodological approach that require further discussion. First, our analysis relies on macro-level concepts to size the burden-capacity gap. The accuracy of the empirical findings thus strongly depends on whether our aggregate estimates are able to quantitatively capture real-world differences. To check this aspect, we provide a “proof of concept” in the Supplementary material (section F, Figure A18). We demonstrate that the policy effectiveness of (environmental) policies generally decreases with higher gap sizes and that new measures become ineffective at a certain tipping point.
Moreover, to cross-validate and check the plausibility of our central measures, we conducted 36 semi-structured in-depth interviews with public employees responsible for implementing social and environmental policies in Denmark and Italy.Footnote 11 In line with Lieberman’s (Reference Lieberman2005) suggestion of a “nested analysis,” we chose Italy and Denmark based on our previous large-N study. These two countries present the most pronounced differences regarding the burden-capacity gap (see Figure 3). While the gap is particularly large in the Italian case in both sectors, Denmark effectively succeeds in keeping a due balance between implementation burdens and the administrative capacities available. If our quantitative measurements are correct, these marked differences should also be reflected in the work experiences of public administrators.
The qualitative insights from the interviews strongly confirm the impression gained from our aggregate measures. In Denmark, the policy implementers reported that the provided resources strongly match the capacities necessary for adequate implementation. They indicate that they “don’t see a lot of performance difficulties,”Footnote 12 “have enough scope for pursuing [their] tasks,” and “are not asked anything that is impossible for [them] to deliver.” In Italy, the picture is exactly the opposite. In both environmental and social policy, there are numerous accounts of “overburdened” and “struggling” implementing authorities that find themselves “in the eye of a storm” as “work (…) rains down on [them] from above.” Implementers state that “[resource] constraints affect (…) the impact of policies and (…) the achievement of objectives” and that, in practice, there is a “big disconnect between the political and the technical [implementation] side.”
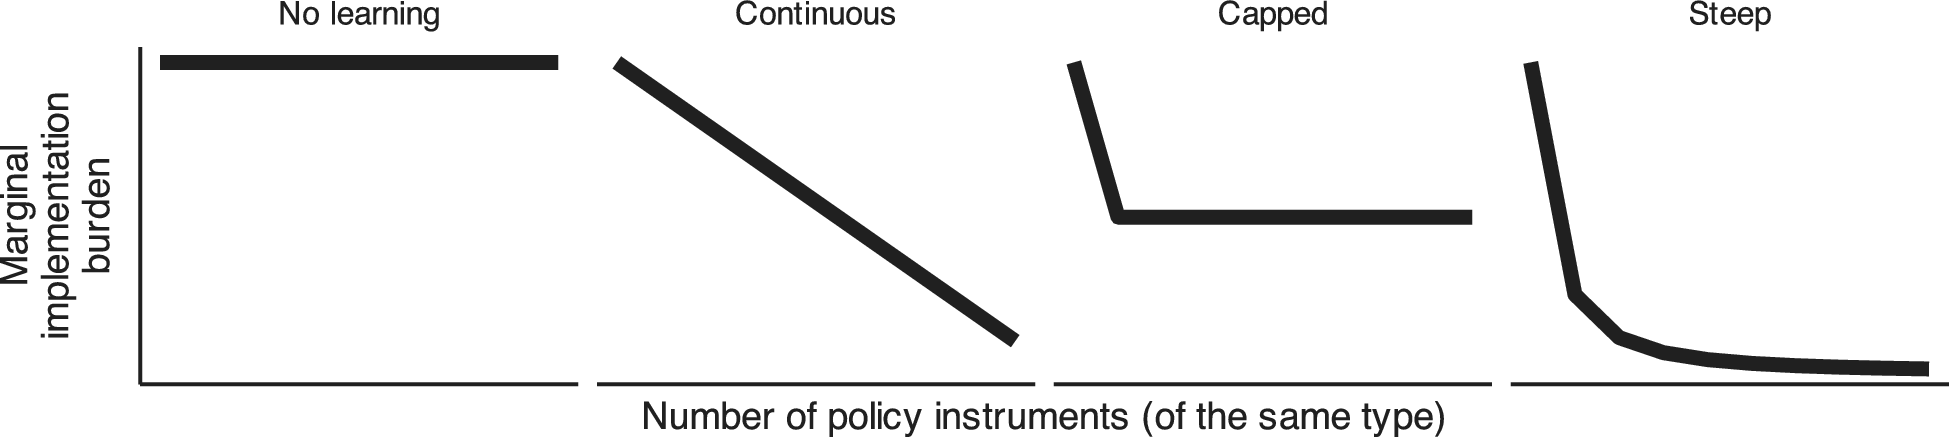
A second important assumption in our quantitative analysis is that all policies imply more or less the same implementation burden for the administration. In reality, however, it might be the case that policies strongly differ in what they require from the administration. While it is difficult to give varying weights to different policies from the outset, we can expect that over time, the administration might benefit from learning effects, that is, the acquisition of knowledge about the functioning of policies and the required implementation processes. In other words, administrators should find it easier to implement the types of policies they already know (Fernández-i-Marín et al. Reference Fernández-i-Marín, Hinterleitner, Knill and Steinebach2023b).
To account for such learning effects, we model different ideal-type learning curves. More precisely, we discount increases in the policy portfolios based on how extensively the government has previously used a given instrument type. As illustrated in Figure 8, the “no-learning” scenario represents our standard approach where all additional target-instrument combinations result in one additional “unit” of implementation burden (1; 1; 1; 1). In the “continuous learning” scenario, only the first target addressed by a given instrument is fully counted and gets the value of 1. The remaining policy targets addressed by the same instrument type get shares of the original implementation burden load (1; $ 1/2 $
;
$ 1/2 $
; $ 1/4 $
;
$ 1/4 $
; $ 1/8 $
, etc.). The “capped learning” scenario, by contrast, implies a one-time difference in the marginal implementation burden. After this initial decrease, the additional implementation burden induced by portfolio expansions stays constant (1;
$ 1/8 $
, etc.). The “capped learning” scenario, by contrast, implies a one-time difference in the marginal implementation burden. After this initial decrease, the additional implementation burden induced by portfolio expansions stays constant (1; $ 1/2 $
;
$ 1/2 $
; $ 1/2 $
;
$ 1/2 $
; $ 1/2 $
, etc.). Lastly, “steep learning” describes a scenario in which the marginal implementation burdens diminishes rapidly with each additional policy (
$ 1/2 $
, etc.). Lastly, “steep learning” describes a scenario in which the marginal implementation burdens diminishes rapidly with each additional policy ( $ 1;1/4 $
;
$ 1;1/4 $
; $ 1/9 $
;
$ 1/9 $
; $ 1/16 $
, etc.).
$ 1/16 $
, etc.).
Learning Effects on the Relationship between Policy Growth and Implementation Burdens
Note: Different curves represent the marginal implementation burdens caused by additional policies under the assumption of different learning curves of implementing authorities.
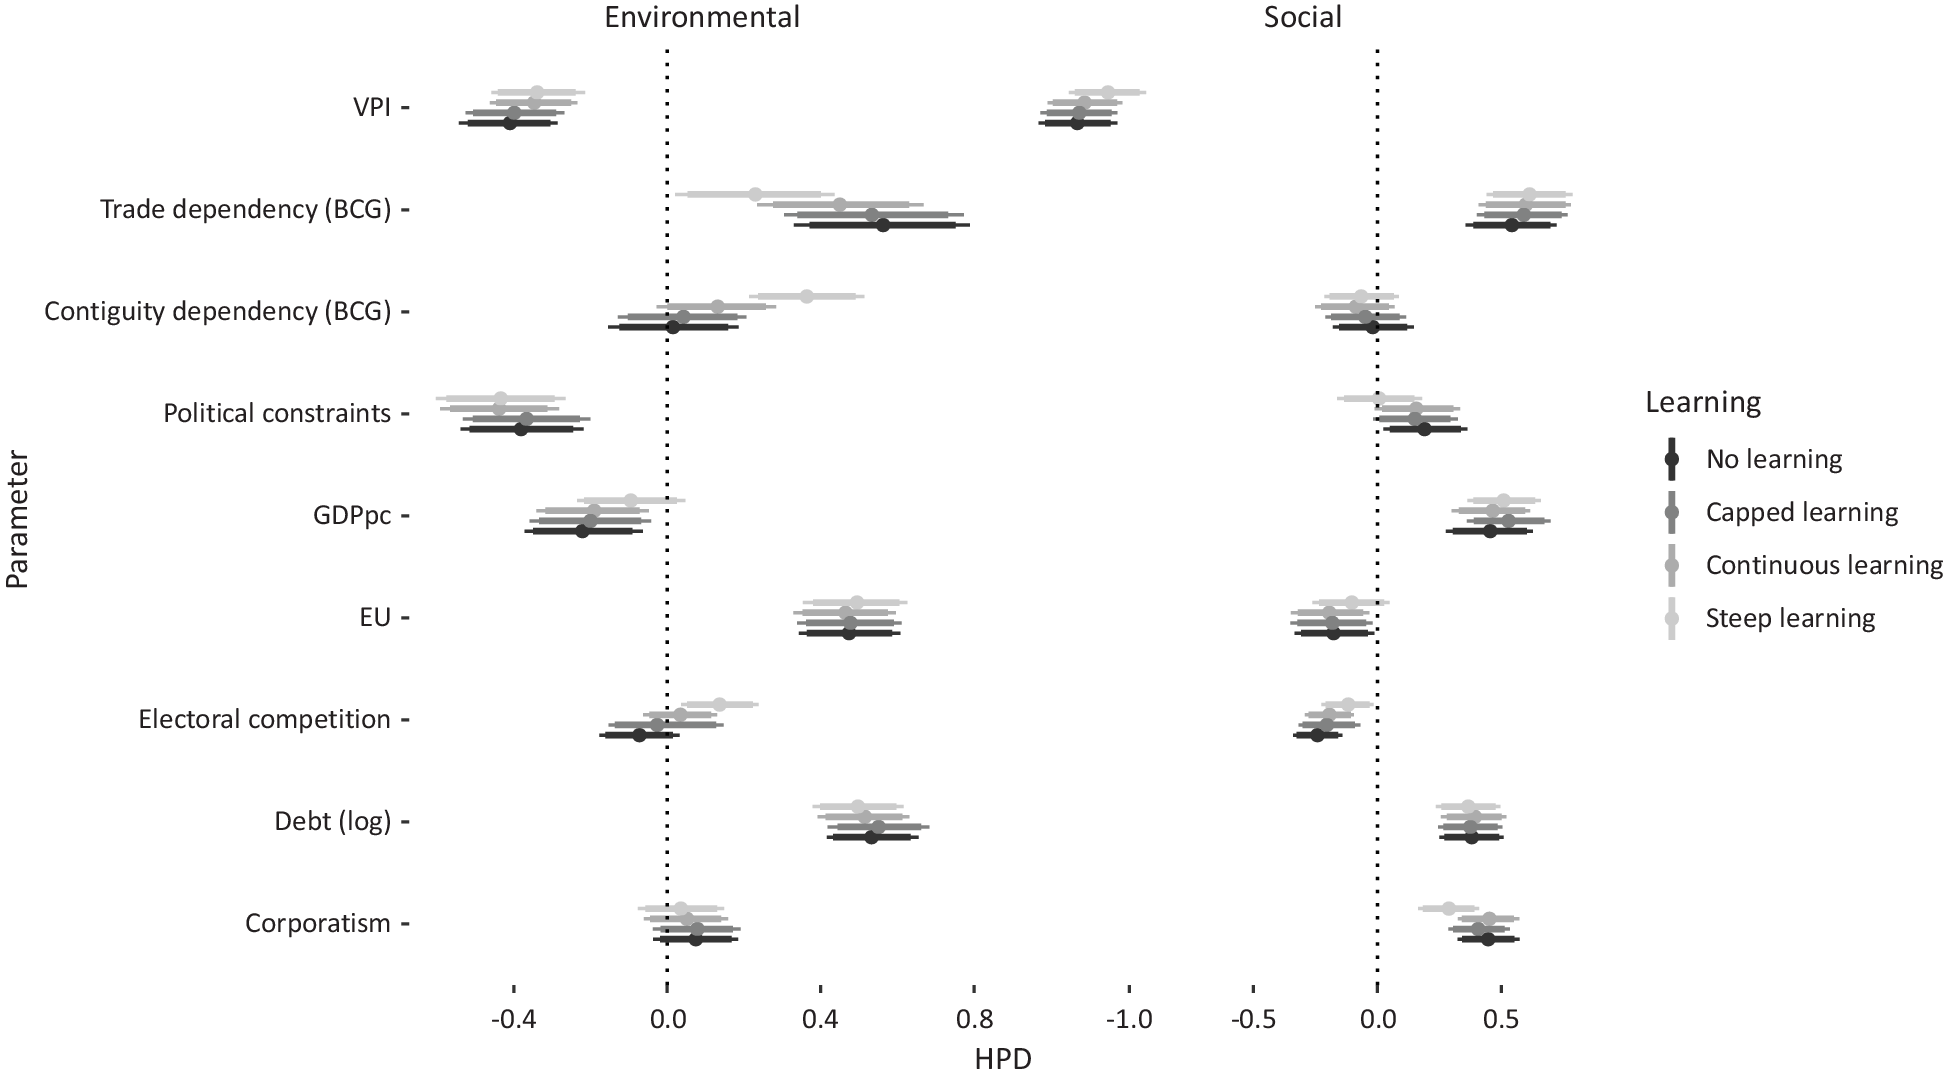
In Figure 9, we present our results when we replicate our previous analysis (see again Figure 4) while assuming different learning scenarios that mediate the impact of policy accumulation on implementation burdens.Footnote 13 While the impact of the VPI (very) slightly decreases in size, our central findings remain unchanged.
Determinants of the Burden-Capacity Gap, Aggregated VPI (21 Countries, 1976–2018) with Learning Effects
Note: HPD of the main parameters of interest (β) (95% credible interval). All parameters are standardized to two standard deviations. Supplementary Tables A6 (no learning) and A8 to A10 (learning) present the results in a tabular form.
Lastly, a challenge for our analysis might be that there is a negative correlation between VPI and the burden-capacity gap as both sides of the equation should benefit from higher levels of general state capacity. From this perspective, our analysis might suffer from an omitted variable bias. To address this concern, section E.7 of the Supplementary material (Figure A15) includes general state capacity as provided by Hanson and Sigman (Reference Hanson and Sigman2021) as an additional control. The analysis reveals that VPI has its own distinct effect on the burden-capacity gap, and this persist even when controlling for general state capacity as a potential confounder.
CONCLUSION
We started this paper with the observation that democratic governments tend to produce more and more policies, thus putting an ever-greater burden on the implementation level. Political responsiveness to societal demands comes with a continuous growth of policies. At the same time, policy growth leads to an accumulation of burdens for the bodies in charge of implementing these policies. If administrative capacities do not keep pace with ever-growing implementation burdens, this will undermine policy effectiveness, hence the long-term legitimacy of modern democracies.
In our analysis, we offer a novel approach to systematically measure and explain the development of the burden-capacity gap across countries and sectors and over time. We showed that national and sectoral variations of this gap are strongly affected by the extent to which processes of policy formulation and implementation are vertically integrated. Higher levels of VPI are strongly associated with a smaller burden-capacity gap. The existence of institutional arrangements that link the bureaucracies in charge of policymaking and those involved in policy implementation thus constitutes a crucial feature of bureaucratic quality that has so far been fairly neglected in academic debates. In fact, VPI is the only factor considered in our analysis (aside from a country’s economic wealth) that consistently and effectively affects the growth of the gap between implementation burdens and administrative capacities.
While VPI has a very strong and pronounced effect in this regard, a more fine-graded assessment of different VPI dimensions reveals that the effects of bottom-up integration tend to be even more pronounced than the effects of top-down integration. From a practitioner’s perspective, this is a promising finding. While the (re-)allocation of costs and competencies typically involves a strong political conflict and is thus difficult to pursue, the inclusion of policy implementers’ experience in policy formulation can be achieved relatively easily, through the creation and reform of both formal and informal institutions. Governments thus have potent tools at their disposal that if applied could safeguard democracies from overloading themselves with ineffective policies.
A limitation of our research is that in measuring policy growth, we focused on the introduction of new policy targets and instruments. Yet, the implementation burden might also increase in response to changes in the calibration of existing policies (derogations, exemptions, special clauses, etc.) which might affect the complexity, thus the time and effort that must be invested in applying a given policy provision. These increases in implementation burdens that emerge beyond changes in the mere number of policies constitute an important area for future research.
SUPPLEMENTARY MATERIAL
To view supplementary material for this article, please visit https://doi.org/10.1017/S0003055423001090.
DATA AVAILABILITY STATEMENT
Research documentation and data that support the findings of this study are openly available at the American Political Science Review Dataverse: https://doi.org/10.7910/DVN/ZNRTYA.
ACKNOWLEDGMENTS
We wish to thank the three anonymous American Political Science Review referees and the editors for their very helpful suggestions in improving our manuscript.
FUNDING STATEMENT
This research was funded by the European Research Council (ACCUPOL Project, Grant. No. 788941) and the European Commission (CONSENSUS project, Grant No. 217239).
CONFLICT OF INTEREST
The authors declare no ethical issues or conflicts of interest in this research.
ETHICAL STANDARDS
The authors declare the human subjects research in this article was reviewed and approved by the Ethics Commission of the Social Science Faculty of LMU Munich and certificate numbers are provided in the text (see Footnote footnote 11). The authors affirm that this article adheres to the APSA’s Principles and Guidance on Human Subject Research.


 Open access
Comments
No Comments have been published for this article.