



Diet assessment plays an important role in nutritional epidemiology(Reference Willet1). Worldwide studies have shown an association between dietary intake and non-communicable diseases(Reference Galbete, Kröger and Jannasch2,Reference Carlos, De La Fuente-Arrillaga and Bes-Rastrollo3) . Several instruments are used to evaluate food consumption. The FFQ is the most preferred method in epidemiological studies, especially when researchers aim to verify associations between dietary habits and disease. An FFQ is usually structured considering dietary intake recording frequency in time units(Reference Willet1).
Recently, some studies have developed computer-based FFQ for the assessment of dietary intakes. Electronic platforms offer advantages over printed questionnaires, such as automatic and direct data storage of answers and self-administration, thus having a potential to become a valuable research method(Reference Kato, Takachi and Ishihara4). In this way, a computer-based FFQ reduces costs, time, and it is convenient for building a database and analysing data. A computer-based FFQ can have a more efficient and interesting layout, and it is possible for respondents to see illustrated food items and their respective portion sizes. A Japanese study has found that >80 % of all participants (n 247) considered a web FFQ more straightforward than completing a printed questionnaire(Reference Kato, Takachi and Ishihara4). In France, a computer-based FFQ method was preferred by nearly 70 % of interviewees (n 147)(Reference Trouvier, Kesse-Guyot and Méjean5).
Accurate description and measurement of dietary intake are essential for determining a population’s dietary habits. Several studies have evaluated the validity of a computer-based FFQ(Reference Trouvier, Kesse-Guyot and Méjean5–Reference Morel, Portolese and Chertouk7). In Denmark, a study comparing a computer-based FFQ with three 24-h diet recalls (24HR) among 124 adolescents forming a part of the Danish National Birth Cohort found that the FFQ had the best ranking for estimated intake of dairy products, fruit, oils and dressing(Reference Bjerregaard, Halldorsson and Kampmann6). In Canada, eighty adolescents and adults answered a computer-based FFQ, and the data were compared with three 24HR(Reference Morel, Portolese and Chertouk7), and the correlations between nutrients were moderate to very good (0·46–0·74)(Reference Willet, Lenart and Willet8).
In Brazil, there is a lack of studies on the relative validity of a computer-based FFQ. The Pelotas Birth Cohort Studies in southern Brazil have investigated dietary habits of its members, and the research centre has developed a computer-based, semi-quantitative FFQ for use and application in the Pelotas cohorts. The objective of the current study was, therefore, to assess the relative validity of a computer-based, semi-quantitative FFQ developed for use in the Pelotas Birth Cohorts and administered in the most recent follow-up of the 1993 Pelotas Birth Cohort when its participants were 22 years of age.
Methods
The 1993 Pelotas Birth Cohort Study
Pelotas is a medium city in southern Brazil with a population of approximately 330 000 inhabitants, being located near the Uruguayan border. Its main economic activities are rice production, commerce and education. The 1993 Pelotas Birth Cohort Study is a population-based study of which the initial sample comprised 99 % of all live births that occurred in the urban area of the city from 1 January to 31 December in 1993 (n 5265)(Reference Victora, Araujo and Menezes9). The initial cohort comprised of 5249 eligible children (99·7 %). Follow-ups have been conducted periodically since 3 months of age to assess several socioeconomic, health and nutritional features of the participants. The Pelotas Birth Cohorts provide a complete coverage of the Pelotas city population, which has characteristics similar to other Brazilian cities in terms of demographic, socioeconomic and behavioural characteristics (e.g., maternal skin colour, education and obesity rates)(10,Reference Goncalves, Wehrmeister and Assuncao11) . The methodological aspects of the study protocol and follow-ups have guaranteed its internal validity. More details about the cohort can be found elsewhere(Reference Victora, Araujo and Menezes9,Reference Goncalves, Wehrmeister and Assuncao11,Reference Goncalves, Assuncao and Wehrmeister12) .
At the 22-year follow-up (2015), all participants were invited to attend an appointment at the research clinic. A total of 3810 participants attended, provided informed consent and underwent a series of assessments, which consisted of questionnaires, anthropometric measurements and blood sample collection. Identification of mortality among cohort participants was based on official records. The final cohort follow-up rate was estimated at 76·3 %, including 164 known deaths.
Validation study protocol
The 3810 participants individually answered a computer-based, self-administered, semi-quantitative FFQ(Reference Schneider, Motta and Muniz13). Immediately afterwards, a 24HR was administered in-person to a random sample of participants. Follow-up for a second recall by telephone occurred 14–28 d later without prior notice. To this end, participants confirmed their telephone numbers and a suitable time and day of the week for the call to be made, but the interview was not scheduled for a specific day. Up to three telephone calls were made to obtain recall information. Participants who did not answer the telephone were considered losses. Five research assistants received training that consisted of a theoretical course followed by a practical application of in-person and telephone 24HR. Two trained assistants conducted in-person interviews, and a further three did telephonic interviews. All recalls were reviewed by two research dietitians to check for missing information and ensure quality control. The sample size of this validation study (n 200) was based on the recommendation of validation studies(Reference Willet1). The inclusion of an additional 100 subjects was allowed to overcome possible inconsistencies between recalls and loss to follow-up. The final sample comprised of 301 subjects.
Semi-quantitative FFQ
A computer-based, semi-quantitative FFQ was developed to be used on the 18th year of follow-up of the 1993 Pelotas Birth Cohort(Reference Schneider, Motta and Muniz13) based on the paper version of a validated Brazilian FFQ(Reference Sichieri and Everhart14), adapted to the cohort after carrying out a sub-study when the participants were 15 years of age. That previous study has been reported elsewhere(Reference Gigante, Reichert and Hallal15). The electronic platform comprises all the food items included in the paper version of the FFQ(Reference Gigante, Reichert and Hallal15). Four additional food items were included in the new version, considering current changes in the food market (e.g., soya milk, cereal bars, raw fish), and one item was split into two (sodas with or without caffeine) to allow additional investigations. The methodological description of the revised FFQ has been reported elsewhere(Reference Schneider, Motta and Muniz13).
Participants used the FFQ platform in a room with computers at the research clinic. A trained research assistant individually explained how subjects should use the platform, even though the initial part of the platform provides instructions on how to fill out the questionnaire. This was done with the aim of minimising data entry errors and maximising data quality. For each food item, participants were asked first about the frequency of intake. When the consumption of a given item was confirmed, the platform provided photographic images to identify the usual portion size (small, medium or large). The FFQ recall period was the previous 12 months.
The FFQ comprised ninety-two food items clustered into eleven food groups (bread, biscuits and cereals; rice; beans and other legumes; milk and dairy products; fruit; vegetables and potatoes; meat and eggs; sweets and candies; beverages; fats (butter, margarine, mayonnaise), and eight frequency options were given: (i) five or more times a day, (ii) two to four times a day, (iii) once a day, (iv) five to six times a week, (v) two to four times a week, (vi) once a week, (vii) one to three times a month and (viii) never or less than once a month. Fruit seasonality was taken into consideration in the annual estimation of consumption by dividing the reported consumption by four. The options for daily frequencies were as follows: (i) 5, (ii) 2, (iii) 1, (iv) 0·7, (v) 0·28, (vi) 0·14, (vii) 0·03, (viii) 0 times per day.
24-h diet recalls
To conduct both in-person and telephonic 24HR, a structured interview guide was developed based on the Automated Multiple-Pass Method(Reference Moshfegh, Rhodes and Baer16,Reference Blanton, Moshfegh and Baer17) . A paper version of the 24HR was created for both recall interviews. The dietary recall steps were as follows: (i) request a quick recall of foods and beverages consumed in the last 24 h, starting from the morning of the previous day; (ii) prompt the respondent to food and meal events possibly forgotten during quick recall; (iii) go through each food item recalled requesting details using a standardised list of possible ingredients (e.g., added oils, cream, sugar), food brand, preparation and portion size; (iv) read the list of all foods and meal events as a final reminder and ask if they consumed anything else. The day and time of each telephone attempt were also recorded.
Information on time, meal event (breakfast, morning snack, lunch, afternoon snack, dinner, supper, dawn snack) and place (home, restaurant, snack bar, lunch bag) was obtained for each food item reported. Portion sizes were converted into grams or millilitres using a standard reference table(Reference Pinheiro, Lacerda and Benzecry18). All these data (food item, meal event, place, portion size) from the 24HR were coded and entered twice by two research assistants onto an Excel spreadsheet. The two data entries were compared with search for possible inconsistencies and typing mistakes (e.g. number of food items by participants, portion size and food codes). All inconsistencies identified were solved by reviewing the paper recall by the research dietitian coordinator. The final version of the dataset was exported to STATA 15.0 (StataCorp).
Energy, nutrient and food group intake estimation
For both the FFQ and the average of two 24HR, daily energy and fifteen nutrient intakes were estimated using mainly the Brazilian Food Composition Table(19), complemented with food items from the US Department of Agriculture’s National Nutrient Database for Standard Reference(20). In addition to energy and macronutrients, we estimated dietary fibre, Ca, Fe, thiamine, riboflavin, niacin, vitamin C, Na and cholesterol, as these nutrients are widely assessed in validation studies due to their importance in chronic nutritional deficiencies(Reference Willet1). Energy and nutrients from dietary supplements were excluded. Food groups were estimated by converting daily portion sizes reported of each food item into grams and combining individual items into the eleven FFQ food groups (described above).
Characteristics of the participants
Participants were described according to sex (female, male), current marital status (single, married), employment status (employed, unemployed), education (years of completed formal schooling) and current smoking habit (no, yes). These data were obtained via questionnaires applied during the cohort’s 22-year follow-up(Reference Goncalves, Wehrmeister and Assuncao11). Nutritional status was classified by the cut-offs of BMI (kg/m2): underweight (<18·5), normal weight (18·5–24·9), overweight (25–29·9) and obese (≥30). BMI was calculated using the weight measured to the nearest 0·1 kg (using an electronic digital scale coupled with the BOD POD system; COSMED) divided by the height measured to the nearest 0·1 com (using a portable stadiometer; C.M.S. Weighting Equipment Ltd).
Statistical analyses
Crude medians (interquartile ranges, IQR) of energy, nutrients and food groups (in grams) were estimated for FFQ as was the average of the two 24HR. To compare the dietary estimates between methods, test comparisons were conducted using the Wilcoxon rank test, considering that most nutrient and food group distributions were skewed. The relative difference between daily intake according to FFQ and the average of the two 24HR for energy, nutrients and food groups was estimated according to the formula: ((FFQ – 24HR)/24HR) × 100.
Data were transformed (log10) to optimise distribution normality. Nutrient intakes were energy-adjusted using Willet’s residual method(Reference Willet1). To correct for within-individual errors in the measurement of the average of two 24HR, which tends to reduce correlation coefficients towards zero, the correlation coefficient found was multiplied by the de-attenuation factor
 $$\left( 1 + \left( \sigma _w^2/\sigma _b^2 \right) /n\right)^{0 \cdot 5}$$
, where
$$\left( 1 + \left( \sigma _w^2/\sigma _b^2 \right) /n\right)^{0 \cdot 5}$$
, where
 $$\sigma _w^2$$
is within-individual variance,
$$\sigma _w^2$$
is within-individual variance,
 $$\sigma _b^2$$
is between-individual variance and n represents the number of replicate measurements (N 2)(Reference Willet1). Within- and between-individual variance components were determined by a random-effects model with recorded intake as a dependent variable and subject identification number as an independent variable(Reference Beaton, Milner and Corey21). The corrections of between- and within-individual variances are presented as de-attenuated correlation values.
$$\sigma _b^2$$
is between-individual variance and n represents the number of replicate measurements (N 2)(Reference Willet1). Within- and between-individual variance components were determined by a random-effects model with recorded intake as a dependent variable and subject identification number as an independent variable(Reference Beaton, Milner and Corey21). The corrections of between- and within-individual variances are presented as de-attenuated correlation values.
Pearson correlation coefficients and Lin’s concordance correlation coefficients of log-transformed crude and energy-adjusted nutrient intakes were calculated. Person correlation coefficient is a measure of linear relation between two variables, without specifying any degree of correspondence between the two sets of values(Reference Cade, Thompson and Burley22). Lin’s concordance coefficient is devised to provide a measure of reliability that is based on covariation and correspondence. It takes into account bias, the element that distinguishes agreement from correlation, that is, a good agreement (reproducibility) not only requires good correlation, it also requires small bias(Reference Lin23). The following cut-offs were applied to interpret Pearson correlation coefficients: <0·30 (low), 0·3–0·5 (moderate), 0·51–0·7 (good), 0·71–0·9 (very good) and 0·9–1·0 (high)(Reference Willet, Lenart and Willet8).
Energy, nutrient and food group quartiles were calculated, and the degree of gross misclassification in the FFQ in relation to the average of two 24HR was evaluated using contingency tables, including weighted κ to test whether the FFQ ranked participants according to the magnitude of food groups and nutrient intakes by comparison with the mean of two 24HR. The proportions of individuals who were classified correctly within the same quartile or opposite quartile (lowest quartile according to one dietary method and the highest quartile according to the other) were determined. Weighted Kappa (κ) statistics were calculated to quantify the agreement of energy-adjusted nutrient intakes, and food group quartiles as measured by the FFQ and two 24HR. The following κ interpretation proposed by Landis & Koch(Reference Landis and Koch24) was applied: 0·0–0·20 (slight), 0·21–0·40 (fair), 0·41–0·60 (moderate), 0·61–0·80 (substantial) and 0·81–1·0 (almost perfect).
Bland–Altman analysis was performed to provide a visual inspection of the systematic difference between methods. We plotted the differences of estimated energy and nutrients between FFQ and the average of two 24HR against the means of energy and nutrient estimates in both methods. The plots include lines for the mean difference and the so-called ‘limits of agreement’, defined as mean ± 1·96 sd of the mean. Graphs for energy and macronutrients, dietary fibre, Na, Fe and Ca are presented.
We performed further analyses of participants included in the sub-sample and those in the main cohort using the t test and χ 2 test of proportions for selected sociodemographic variables (sex, schooling, total monthly family income, nutritional status and smoking status) with the aim of ruling out possible selection bias.
All statistical analyses were performed using STATA 15.0 (StataCorp).
Results
Of the 301 participants who answered in-person 24HR, 257 answered the second recall by telephone. The forty-four losses (15 %) registered in the second recall were due to loss of contact (did not answer telephone calls). Also, three subjects were excluded due to an unusual diet – two of them reported a very restrictive diet with only one type of food (red meat) consumed throughout the day, and the other subject was sick the previous day and only ate soup. Thus, 254 subjects were considered for the validation study.
Of the 254 participants in the validation study, 50 % were women, and 67 % were white. Eighty-three percentage were single, 38 % had ≥12 years of schooling, 12 % were smokers, 67 % were employed and median monthly family income was $US 672·3 (IQR 392.1, 1·036.4). According to BMI, 4 % were underweight, 50 % had an adequate weight, and 30 and 15 % were overweight and obese, respectively. When comparing validation study participants with non-participants, statistically significant differences were observed for schooling and smoking status. A higher percentage of participants had ≥12 years of schooling (38 v. 29 %) and a lower percentage were smokers (12 v. 17 %) (P < 0·05) (data not shown).
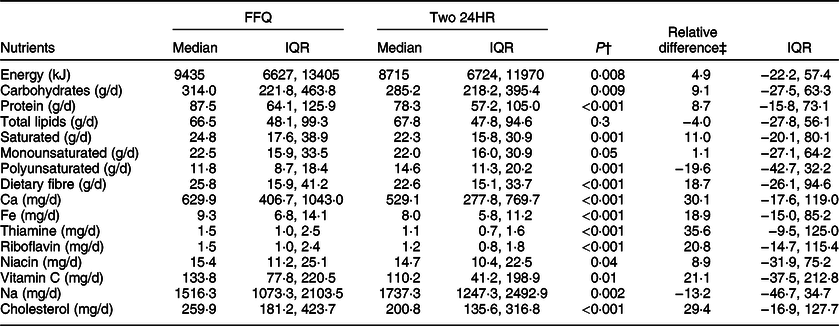
Table 1 shows the median and IQR of crude energy and nutrient intakes estimated from the FFQ and the average of two 24HR. Total energy intake as estimated by the FFQ was 4·9 % higher compared with the average of two 24HR. The percentage differences in estimated intakes of carbohydrate (9·1 %) and protein (8·7 %) were higher for the FFQ, while total lipids were 4·0 % lower compared with the average of two 24HR. Dietary fibre, cholesterol and selected micronutrients (Ca, Fe, thiamine, riboflavin, vitamin C) had the highest and positive percentage differences (ranging from 18·9 to 30·1 %), and saturated fat, niacin and monounsaturated fat had the lowest and positive percentage differences (11·0, 8·9 and 1·1 %, respectively). Polyunsaturated fat and Na had negative percentage differences in estimated intake based on the FFQ compared with the average of two 24HR.
Energy and nutrients estimated by FFQ and two 24-h recalls (24HR) (n 254)*
IQR, interquartile ranges.
* Sub-study nested within the 22 years follow-up (2015) of the 1993 Pelotas Birth Cohort Study.
† P-values refer to Wilcoxon sign-rank test.
‡ Relative difference = ((FFQ – 24HR)/24HR) × 100.
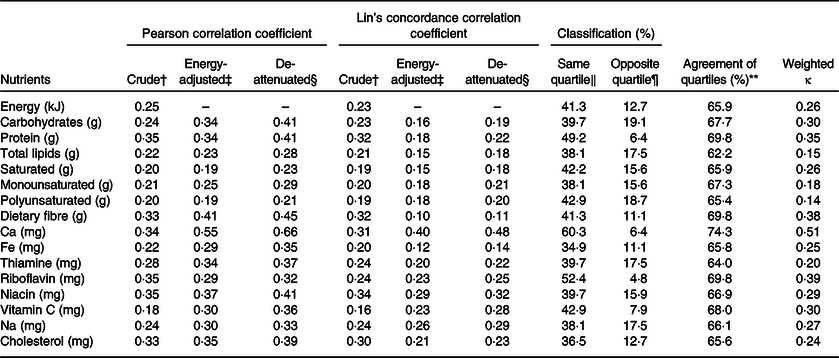
After correcting for within-person variation, the de-attenuated Pearson correlation coefficients were slightly higher than the energy-adjusted values, ranging from 0·21 to 0·66. The lowest coefficients found were 0·23 for polyunsaturated fat and 0·21 for saturated fat (Table 2). The highest coefficients (>0·40) were found for carbohydrates, protein, dietary fibre, Ca and niacin.
Pearson correlations, Lin’s concordance coefficients, agreement of quartiles and weighted κ of energy and nutrients estimated by FFQ and two 24-h recalls (24HR) (n 254)*
* Sub-study nested within the 22 years follow-up (2015) of the 1993 Pelotas Birth Cohort Study.
† Energy and nutrients log-transformed.
‡ Nutrients log-transformed and adjusted for total energy intake.
§ Nutrients log-transformed, adjusted for total energy intake and de-attenuated.
‖ Proportion of participants classified in the highest quartile in both methods.
¶ Proportion of participants classified in the lowest FFQ quartile and in the highest 24HR quartile.
** Observed agreement between methods in the κ analysis.
Lin’s concordance correlation coefficient ranged from 0·16 to 0·34, 0·10 to 0·40, and 0·11 to 0·48 for crude, energy-adjusted and de-attenuated nutrient intakes, respectively. Overall, concordance coefficient decreased with adjustment for energy intake, but a slight increase was observed after de-attenuation analysis. The highest coefficients were for Ca (0·48), niacin (0·32), Na (0·29), vitamin C (0·28) and riboflavin (0·25) in comparison with the rest of the nutrients. The highest decrease in concordance coefficient from crude, energy adjustment and de-attenuation analyses was found for dietary fibre (0·32 v. 0·10 v. 0·11, respectively) (Table 2).
Bland–Altman plots confirmed a general overestimation of nutrient intake by the FFQ compared with the average of two 24HR (except for Na that is slightly underestimated), and no systematic variation in agreement between FFQ and 24HR was observed (Figs 1 and 2).
Bland–Altman plot: comparisons of concordance of energy, carbohydrates, protein and total lipid intakes evaluated by FFQ and average of two 24HR (24-h recalls) after natural log transformation (n 254)

Bland–Altman plot: comparisons of concordance of fibre, sodium, calcium and iron intakes evaluated by FFQ and two 24HR (24-h recalls) after natural log transformation (n 254)

Between 38·0 and 60·3 % of participants in the FFQ were classified in the same quartile as the average of two 24HR. Overall, the agreement of quartiles was 60 % for most nutrients. Weighted κ coefficient was higher for Ca (0·51), riboflavin (0·39), dietary fibre (0·38), protein (0·35) and carbohydrate (0·30) (Table 2).
The grams per day of food groups estimated by FFQ and the average of two 24HR did not differ for rice, cereals, and meat and eggs. The highest differences were found for sweets and candies (+94·6 %), fish and seafood (−90·1 %), fruit (+46·7 %), vegetables (+41·5 %) and fats (−39·9 %). Between 30·2 and 62·5 % of the subjects were classified in the same quartile of estimated grams of food group intakes, with the agreement of quartiles ranging from 52·6 to 74·0 %. Weighted κ coefficient was higher for beans and legumes (0·50), milk and dairy products (0·49), rice (0·40), beverages (0·32) and meat and eggs (0·27). The lowest κ was for fats (0·06) (Table 3).
Food group consumption estimated by FFQ and two 24-h recalls (24HR) (n 254)*

IQR, interquartile ranges.
* Sub-study nested within the 22-year follow-up (2015) of the 1993 Pelotas Birth Cohort Study.
† Significant difference tested by Wilcoxon sign-rank test.
‡ Proportion of participants classified in the highest quartile in both methods.
§ Proportion of participants classified in the lowest FFQ quartile and in the highest 24HR quartile.
‖ Observed agreement between methods in the κ analysis.
¶ Butter, margarine and mayonnaise.
Discussion
Our results indicated an acceptable relative validity of the computer-based, semi-quantitative FFQ compared with the average of two 24HR among the urban young adults from a birth cohort study in Pelotas, southern Brazil. The FFQ overestimated the consumption of energy and the majority of nutrients compared with the two 24HR. Lin’s concordance coefficients were lower than Pearson correlation coefficients, and they tended to reduce after energy adjustment and de-attenuation. Ca and niacin were the best estimated nutrients. The estimated consumption (in grams) of rice, cereals, and meat and eggs did not differ between methods. The ability to rank participants according to quartiles of intake between instruments varied from fair to moderate(Reference Landis and Koch24).
An FFQ generally overestimates intakes of food groups in relation to 24HR(Reference Freeman, Commins and Willett25). In the case of fruits and vegetables, we believe that individuals overreported their consumption owing to several food items in the FFQ, thus overlapping their frequency of consumption. Regarding fish and seafood products, the observed overestimation by the FFQ reflects the usual consumption for a longer period covered compared with the 24HR. It is possible that two 24HR alone might be insufficient to capture these products because they are not part of daily eating habits of the region under study(Reference Schneider, Duro and Assunção26). Although the 24HR protocol aimed to predict consumption on four weekdays (Monday–Thursday), it may not be sufficient to capture day-to-day variability. Brazilians usually increase the consumption of unhealthy foods on weekends, including added sugar, sweets and fats(Reference Monteiro, Hassan and Estima27), which may also explain the differences observed in the consumption of sweets and candies, and fats. Similar results have been observed in protocols that included weekends(Reference Bjerregaard, Halldorsson and Kampmann6,Reference Morel, Portolese and Chertouk7) .
There is no consensus in the literature on the best interpretation of cut-off points of correlation coefficients between dietary instruments. Previous studies have observed low to moderate Pearson correlation coefficients (energy-adjusted and de-attenuated) for most nutrients, and the instruments were considered satisfactory(Reference Bjerregaard, Halldorsson and Kampmann6,Reference Zack, Irema and Kazonda28) . In our study, Pearson correlation coefficients were moderate for carbohydrates, protein, dietary fibre, Ca, Fe, thiamine, riboflavin, niacin, vitamin C, Na and cholesterol. Most correlation coefficients for nutrients increased after adjustment for energy and de-attenuation, which may be because the total amount of nutrients is dependent on the total energy intake. Moreover, the intake of vitamins and minerals showed a higher day-to-day variability, possibly indicating that some micronutrients depend on the quantity of intake of food sources (e.g., daily consumption of milk, dairy products and fruit affects the intake of Ca and other vitamins).
Despite the correlation coefficients being similar to those observed in the literature, the energy-adjusted and de-attenuated Lin’s concordance correlation coefficients between instruments were only >0·30 for Ca and niacin. Our analyses based on quartiles showed that all nutrients and most food groups presented at least 60 % of agreement between quartiles. The weighted κ was moderate for Ca (0·51), beans and legumes (0·50) and milk and dairies (0·49). For the majority of nutrients and food groups, the concordance varied from 0·21 to 0·40. Although the ability to rank habitual consumption was fair, our FFQ showed a moderate agreement with selected nutrients and food groups.
Previous studies have tested agreement between web-based FFQ against 24HR(Reference Bjerregaard, Halldorsson and Kampmann6,Reference Medin, Carlsen and Hambly29) . A 279-item FFQ was tested against four non-consecutive 24HR with ninety-two Norwegian adults of both sexes. The authors assessed cross-classification between quartiles and observed that the proportion of individuals being correctly classified in the same quartile ranged from 33 to 46 % for nutrients, and from 33 to 54 % for food groups(Reference Medin, Carlsen and Hambly29). In another web-based FFQ answered by 124 adolescents aged 12–15 years from the Danish National Birth Cohort, the relative validity was tested against three 24HR(Reference Bjerregaard, Halldorsson and Kampmann6). In that study, the authors observed a lower ability to rank participants in the same quartiles and a lower weighted κ. The proportion of individuals being correctly classified in the same quartiles ranged from 23 to 46 %, and the highest weighted κ observed was for dairy products (0·43). In line with these findings, our study showed comparable results in terms of cross-classification and weighted κ values.
The main limitation of our study is the use of relative validation using dietary recalls as a reference method. Both FFQ and 24HR rely on memory and are subject to under- and overreporting. Besides, due to logistic reasons and limited financial resources, the validation protocol considered only two weekdays for 24HR, resulting in weekends being excluded, and accounted for low seasonality, which may have limited the variability in estimated dietary food intakes. Also, we did not have a biological marker available to apply in the validation of dietary intakes, whereby the inclusion of a biological marker would show independent errors compared with traditional dietary methods. So far, a biochemical analysis for this purpose has not been foreseen in the current cohort follow-up. On the other hand, multiple 24HR or food diaries is a widely used approach applied to FFQ validation. In addition, our sample had a higher proportion of non-smokers and individuals with higher education compared with the entire cohort, which could have overestimated our results.
The main strengths of the current study are the use of standard and quality control procedures and the application of appropriate statistical procedures for the evaluation of agreement between methods, such as the concordance correlation coefficient and weighted κ. All the research assistants involved in the protocol received training specific to the study, and all steps were undertaken using standard protocols (e.g., revision of all 24HR, double data entry, use of standardised food composition to estimate nutrients in both dietary methods) to minimise errors. This FFQ was applied to identify dietary patterns in previous cohort follow-ups when participants were 15 and 18 years of age, and the FFQ provided relevant findings on dietary patterns that were associated with body composition(Reference Schneider, Dumith and Lopes30), number of siblings(Reference Meller, Assunção and Schäfer31) and blood lipids(Reference Vaz, Buffarini and Kac32).
Conclusion
Our results indicated a moderate agreement of intake, at the food group level, of carbohydrates, protein, dietary fibre, Ca, riboflavin and vitamin C, rice, beans and legumes, milk and dairies, and beverages between the computer-based FFQ and the average of two 24HR in a young adult population living in the city of Pelotas, Brazil. Future validation studies might consider using multiple 24HR to capture variability and seasonality of dietary intakes, as well as dietary biological markers as a reference method. In addition, based on our experience, it is recommended that participants of validation studies be thoroughly educated on the objectives of the study and be sensitised on the importance of the quality of information solicited.
Acknowledgements
Acknowledgements: We are extremely grateful to all participants and their parents who took part in the 1993 Pelotas Birth Cohort. Funding support: The current work was supported by the Science and Technology Department, Brazilian Ministry of Health, with resources transferred through the Brazilian National Council for Scientific and Technological Development (CNPq) (grant no. 400943/2013-1). The 1993 Pelotas Birth Cohort was conducted by the Postgraduate Programme in Epidemiology at Universidade Federal de Pelotas, with the collaboration of the Brazilian Public Health Association and was financed in part by the Coordenação de Aperfeiçoamento de Pessoal de Nível Superior – Brazil, finance code 001. From 2004 to 2013, the Wellcome Trust supported the 1993 Birth Cohort Study (grant no. 086974/Z/08/Z). The initial phases of the cohort were funded by the European Union and the Brazilian National Program for Centers of Excellence, CNPq and the Ministry of Health. The funding body had no influence in the design, analysis and interpretation of data and in the writing of the manuscript. Conflict of interest: There are no conflicts of interest. Authorship: J.S.V. and M.C.F.A. designed the study protocol. J.S.V., B.C.S., R.B. conducted statistical analysis and wrote the first draft. R.M.B., H.G. and M.C.F.A. provided critical reviews. All authors reviewed and commented on subsequent drafts and approved the final manuscript. Ethics of human subject participation: The current study was conducted according to the guidelines laid down in the Declaration of Helsinki, and all procedures involving research study participants were approved by the Research Ethics Committee of the Federal University of Pelotas School of Medicine (protocol no. 1.250.366). Written informed consent was obtained from all participants before each follow-up.



