


1. Introduction
Bilingualism is a global phenomenon (Grosjean, Reference Grosjean and Grosjean2010). There is therefore much interest in understanding how bilingualism affects brain and cognitive development including functional and structural neural plasticity (Bialystok, Craik & Luk, Reference Bialystok, Craik and Luk2012). Bilingual and monolingual speakers differ in gray matter volume (GMV) (Mechelli, Crinion, Noppeney, Doherty, Ashburner, Frackowiak & Price, Reference Mechelli, Crinion, Noppeney, Doherty, Ashburner, Frackowiak and Price2004; Bialystok et al., Reference Bialystok, Craik and Luk2012, Abutalebi, Della Rosa, Green, Hernandez, Scifo, Keim & Costa, Reference Abutalebi, Della Rosa, Green, Hernandez, Scifo, Keim and Costa2012; Abutalebi, Rosa, Gonzaga, Keim, Costa & Perani, Reference Abutalebi, Rosa, Castro Gonzaga, Keim, Costa and Perani2013) and white matter microstructure (Luk, Bialystok, Craik & Grady, Reference Luk, Bialystok, Craik and Grady2011) as measured by Diffusion Tensor Imaging (DTI). DTI includes parameters such as fractional anisotropy (FA) and mean diffusivity (MD). FA is a measure of tract direction and quantifies the degree of diffusivity whereas MD characterizes magnitude of tract diffusion, e.g., water in a fluid-filled ventricle would have high MD whereas water in bone would have low MD. FA values reflect axonal density as well as myelination whereas MD is associated with strength. Higher FA suggests greater coherence in the orientation of white matter whereas higher MD implies a higher rate of diffusion (Soares, Marques, Alves & Sousa, Reference Soares, Marques, Alves and Sousa2013). Two other measures of water diffusion are axial diffusivity (AD) and radial diffusivity (RD) (Mori & Zhang, Reference Mori and Zhang2006). AD is a measure of diffusivity in the direction of a principal axis while RD is a measure of diffusivity in the perpendicular axes. Higher AD values reflects greater ellipsoidal relative to spherical geometry whereas higher RD values reflect faster diffusion of water molecules (Mori & Zhang, Reference Mori and Zhang2006).
Several studies report that DTI values differ for bilingual and monolingual speakers and it is argued this reflects neuroplasticity due to bilingual experience. However, the direction of the differences varies across studies. For example, Cummine and Boliek (Reference Cummine and Boliek2013) report lower mean FA in bilingual speakers compared to monolingual speakers (see also Gold, Johnson & Powell, Reference Gold, Johnson and Powell2013) whereas others find higher mean FA values in bilinguals (Mohades, Struys, Van Schuerbeek, Mondt, Van De Craen & Luypaert, Reference Mohades, Struys, Van Schuerbeek, Mondt, Van De Craen and Luypaert2012; Pliatsikas, Moschopoulou & Saddy, Reference Pliatsikas, Moschopoulou and Saddy2015; Schlegel, Rudelson & Tse, Reference Schlegel, Rudelson and Tse2012). Similarly, Cummine and Boliek (Reference Cummine and Boliek2013) reported lower MD in the left inferior fronto-occipital fasciculus (IFOF) and forceps minor but also higher MD in the cingulum.
It is not surprising that studies vary in direction and location of DTI values when comparing bilinguals and monolinguals – since participants also differ on variables such as age, education, SES that have effects on neuroplasticity; and, more critically, participants differ in bilingual experience, e.g., early or late acquisition of a second language, sequential versus simultaneous acquisition and language distance, e.g., Chinese–English versus Spanish–English. For instance, Luk et al. (Reference Luk, Bialystok, Craik and Grady2011) reported higher FA values for bilinguals compared to monolingual seniors in bilateral superior longitudinal fasciculi (SLF), right inferior fronto-occipital fasciculus (IFOF) and corpus callosum (CC). Gold et al. (Reference Gold, Johnson and Powell2013) on the other hand reported lower FA values in IFOF as well as the inferior longitudinal fasciculus (ILF), fornix and CC for bilingual seniors together with higher RD in overlapping regions of the IFOF and CC. Mohades et al. (Reference Mohades, Struys, Van Schuerbeek, Mondt, Van De Craen and Luypaert2012) reported higher FA values for bilingual children (aged 10 years) in IFOF and lower FA values in the anterior CC. Schegel et al. (Reference Mohades, Struys, Van Schuerbeek, Mondt, Van De Craen and Luypaert2012) found significant differences in the CC only for immersed bilinguals. Pliastikas et al. (Reference Pliatsikas, Moschopoulou and Saddy2015) report increased FA values in the CC and IFOF for young to middle aged bilinguals (20-40 years) (also García-Pentón, Pérez-Fernández, Iturria-Medina, Gillon-Dowens & Carreiras, Reference García-Pentón, Pérez Fernández, Iturria-Medina, Gillon-Dowens and Carreiras2014). FA values therefore seem to differ reliably in CC and IFOF for bilingual speakers across studies despite variability in the participants’ demographic characteristics and bilingual language experience.
Differences in diffusivity (MD, RD and AD) values also emerge across studies. Luk et al. (Reference Luk, Bialystok, Craik and Grady2011) reported reduced RD values for bilingual seniors in bilateral SLF, right IFOF and CC. On the other hand, Gold et al. (Reference Gold, Johnson and Powell2013) reported increased RD in IFOF, ILF, fornix and CC. A detailed analysis reveals a double dissociation across these two studies in the CC and IFOF for bilingual seniors i.e., increased FA and reduced RD in overlapping areas for Luk et al. but reduced FA and increased RD for Gold et al. (Reference Gold, Johnson and Powell2013). Clearly, the relationship between bilingualism and white matter microstructure is complex even if demographic characteristics and bilingual language experience are comparable. Differences in DTI values cannot therefore be regarded as diagnostic markers of bilingualism in specific brain regions.
Turning to studies of language learning, two white-matter tracts are consistently reported to show differences after training. The first tract is the left arcuate fasciculus (AF) of the SLF. The SLF is assumed to be part of a direct pathway connecting the posterior superior temporal gyrus to the anterior part of the inferior frontal gyrus (Hickok & Poeppel, Reference Hickok and Poeppel2004, Reference Hickok and Poeppel2007) as well as an indirect pathway connecting the inferior parietal cortex to the anterior language cortices (Catani, Jones & Ffytche, Reference Catani, Jones and Ffytche2005). The second tract is the ILF, also part of the direct pathway (Hickok & Poeppel, Reference Hickok and Poeppel2004, Reference Hickok and Poeppel2007) and, via another route connects the anterior temporal lobe with the uncinate fasciculus (Anwander, Tittgemeyer, von Cramon, Friederici & Knosche, Reference Anwander, Tittgemeyer, Von Cramon, Friederici and Knösche2007). Qi, Han, Garel, San & Gabrieli (Reference Qi, Han, Garel, San and Gabrieli2015) reported that language learning is associated with increased FA in the ILF bilaterally for naive English speakers learning Mandarin and that RD (but not AD) was correlated with language proficiency in right ILF and SLF. These results are compatible with other training studies and suggest that neuroplasticity reflects experience with second languages. For example, Hosoda, Tanaka, Nariai, Honda & Hanakawa (Reference Hosoda, Tanaka, Nariai, Honda and Hanakawa2013) reported that language training produced an increase in structural connectivity between the inferior frontal gyrus and caudate in the right hemisphere. These effects may reflect the language control system, which can switch between language-specific sensory-motor gestures, based on context. This system adjusts utterances to circumstance and aborts utterances from the non-target language and is associated with a bilateral brain network related to control including prefrontal areas, the ACC, parietal areas and the caudate nucleus (Abutalebi & Green, Reference Abutalebi and Green2016). This leads to the prediction that white matter microscopic changes should be found in white matter tracts that are implicated in the articulatory control of speech gestures in fluent bilinguals e.g., IFOF. Our goal in the present study was to test this prediction by comparing FA, MD, AD and RD between bilingual and monolingual adults. Following Cummine and Boliek, we expected reduced FA in the anterior thalamic radiation and IFOF and reduced MD in forceps minor and IFOF and differences between AD and RD for bilingual and monolingual speakers in critical areas.
2. Methods
2.1. Participants
Participants were eighteen early Hindi–English female bilingual speakers (mean age and SD: 23.94 ± 1.5 years) and eighteen female monolingual Italian speakers (mean age and SD: 23.45 ± 2.1 years). Bilingual participants were recruited from a tertiary institution in Delhi and monolingual participants were recruited from a tertiary institution in Milan. Participants were matched for age, level of education, handedness and socio-economic status according to the procedures described in Abutalebi, Canini, Della Rosa, Sheung, Green & Weekes (Reference Abutalebi, Canini, Della Rosa, Sheung, Green and Weekes2014). Monolingual participants were recruited from Milan for three reasons: 1) availability of enhanced T1 images from a participant pool in Milan with similar demographic characteristics thus allowing location of regions of interest for comparison between bilingual and monolingual speakers (see Abutalebi et al., Reference Abutalebi, Canini, Della Rosa, Sheung, Green and Weekes2014; Abutalebi, Canini, Della Rosa, Sheung, Green & Weekes, Reference Abutalebi, Canini, Della Rosa, Green and Weekes2015 for discussion of methodology of a similar sample), 2) availability of the identical model of MR scanner in Delhi and Milan (3T Achieva Philips MR scanner (Philips Medical Systems, Best, NL) allowing use of the same exam card i.e., the same acquisition parameters and 3) inability to recruit a monolingual sample in Delhi matched for levels of education, literacy and socio-economic status. All bilingual speakers spoke Hindi as their L1 and English as L2. Bilingual participants were residing in the National Capital Region of India (New Delhi) and were proficient in reading, writing and conversation in Hindi and English and with similar educational backgrounds. Given that participants were from different cultures and languages, we considered whether these differences might potentially influence results. Delhi is a central region for commerce in India as is Milan for Italy. Both cities are cultural hubs located in a network of states within a nation that is defined by a common ethnic and historical identity (i.e., Delhi in India and Milan in Italy) but have distinct identities in their respective nations with circumscribed epistemological, historical, linguistic and pedagogic roots. Although we acknowledge that participants from Delhi and Milan can never be equivalent, we reasoned that a monolingual group from Milan closely matched for educational and socio-economic status was a preferable control to a lower socioeconomic (monolingual) group in Delhi. Past studies report differences in brain structure and white matter integrity due to socio-economic status (Altarelli, Monzalvo, Fluss & Dubois, Reference Altarelli, Monzalvo, Fluss and Dubois2012) and education (Noble, Korgaonkar, Grieve & Brickman, Reference Noble, Korgaonkar, Grieve and Brickman2013). On the other hand, the body of cross-cultural work reveals minimal effects of culture on brain structure and bilingualism (e.g., Bialystok & Viswanathan, Reference Bialystok and Viswanathan2009; Bialystok, Barac, Blaye & Poulin-dubois, Reference Bialystok, Barac, Blaye and Poulin-Dubois2010; Barac & Bialystok, Reference Barac and Bialystok2012). Despite differences in cultural and linguistic background, our participants were well matched in mean SES and level of education (see Table 2). Furthermore, participants were excluded if they had neurological or psychiatric conditions. The study was approved by the Ethics Panels of the National Brain Research Centre, India and University of San Rafaelle, Milan, including written, signed consent from all participants.
2.1.1. Language Proficiency Tasks
Bilinguals: Three tasks were administered to assess language proficiency in Hindi (L1) and English (L2). First, all participants completed a self rating questionnaire wherein language proficiency was rated on a Likert type scale of 1–10 in terms of speaking, comprehension, reading, writing and conversation in both Hindi and English. Next, participants were asked to name thirty colorized pictures in both languages from the Snodgrass and Vanderwart (Reference Snodgrass and Vanderwart1980) set within a time span of 2 seconds. Pictures were presented and the responses recorded by DMDX software (Forster & Forster, Reference Forster and Forster2003). Then, participants were asked to translate 90 Hindi words into English and vice versa following the procedures described in Abutalebi, Brambati, Annoni, Moro, Cappa & Perani, Reference Abutalebi, Brambati, Annoni, Moro, Cappa and Perani2007. Target stimuli were divided into high, medium and low frequency words in each language and there was no time limit. Performance is summarized in Table 1. Bilingual participants were equally proficient in Hindi and English. Participants completed a detailed and validated questionnaire of their socio-economic status (MacArthur Foundation Network, http://www.macses.ucsf.edu/research/socialenviron/sociodemographic.php)
Average accuracy of all language proficiency tasks in Hindi and English.

Mean, standard deviation (SD) and range values for bilingual and monolingual participants used in the statistical models; p-values for sample t-test between monolingual and bilingual groups. (TIV = total intracranial volume).

Whole brain mean and variances of FA, MD, AD and RD.
2.2. DTI data acquisition
Brain images from all participants were obtained from 3-T Philips ‘Achieva’ MRI scanners (Philips, Best, The Netherlands) in Delhi and Milan respectively using identical exam card, sequence parameters and scanning protocols. Diffusion weighted images were acquired with a transverse multi-slice, single-shot, spin echo-planar imaging (EPI) sequence with 35 gradient directions at b-value = 1000 s/mm2 and one b = 0 reference image. The optimized parameter settings were: 8 channel head coil, TE/TR = 56/7785 ms, FOV = 230 ×150 mm2, reconstructed matrix size = 128 × 128, 50 contiguous slices, slice thickness 2.29 mm and voxel dimension = 1.8 × 1.09 × 2.29 mm3 with no gap between slices. In order to ensure image quality and to control for motion artefacts, two structural scans were acquired (Hartzell, Davis, Melcher, Miceli, Jovicich, Nath, Singh & Hasson, Reference Hartzell, Davis, Melcher, Miceli, Jovicich, Nath and Hasson2015). Total time for the diffusion tensor imaging scanning was approximately 10 minutes at each site. High-resolution T1-weighted MPRAGE was also obtained. T1-weighted MPRAGE parameters were: TE/TR = 4/8ms, flip angle 8°, FOV = 256 × 256 mm2, reconstructed matrix size = 230 × 230, 150 contiguous slices with a slice thickness 2 mm and a 1 mm gap between slices. To visualize the fibre direction map in the context of a conventional structural image, data from each participant were co-registered with their corresponding T1-weighted MPRAGE image.
2.3. DTI image processing
DTI images from all participants were transferred to a workstation and checked for motion artefacts. Using FMRIB's diffusion toolbox (FDT) (http://www.fmrib.ox.ac.uk/fsl/), DTI images were corrected for eddy current distortion and head movement by affine registration to a reference volume (b=0). Parameters of head motions were calculated and found to have a median relative mean displacement of 0.585 mm (range from 0.479 mm to 0.733 mm). Brain extraction tool was used to remove non-brain tissue from the images with fractional intensity threshold=0.3 (see Smith, Reference Smith2002). After extracting corrected images, a diffusion tensor was fitted onto corrected images using FDT toolbox to generate diffusion image maps with eigenvalues (λ1, λ2, and λ3), fractional anisotropy (FA) and MD, AD λ|| = λ1, RD (λ┴ = (λ2 +λ3)/2). Due to anatomical differences between participants and cultural groups, a voxel can be contaminated by greater inclusion of adjacent white matter tracts, grey matter or cerebrospinal fluid; which, in turn, can give rise to apparent changes in diffusivity that are not due to true diffusion alterations in a tract of interest (see Acosta-Cabronero, Williams, Pengas & Nestor, 2010). To overcome this problem, the tract-based spatial statistics (TBSS) method (Smith, Jenkinson, Johansen-Berg, Rueckert, Nichols, Mackay & Behrens, Reference Smith, Jenkinson, Johansen-Berg, Rueckert, Nichols, Mackay and Behrens2006) was employed, wherein the nearest most relevant tract centre in spatially normalized FA images for each participant is projected onto a skeleton containing the centre of all major tracts that are common to all participants; thereby allowing voxel-wise statistics to be carried out at tract centres only, thus minimizing the effect of misregistration. Fractional anisotropy maps were then generated for voxel-wise statistical analysis. First, FA images were non-linearly registered to a standard space of 1 × 1 × 1 mm through FNIRT (Andersson, Jenkinson & Smith, Reference Andersson, Jenkinson and Smith2007a and Andersson, Jenkinson & Smith, Reference Andersson, Jenkinson and Smith2007b), following which they were combined to form 4D images and a mean FA image. These mean FA images were introduced into an FA skeletonised program to create mean FA skeletonised images. Mean diffusivity maps were registered non-linearly and registered images were then merged to form 4D images that were then projected onto the original mean FA skeleton. The resulting images were subsequently skeletonised for MD. The same procedure was then repeated for RD and AD images.
2.4. Statistical analysis
Mean FA skeletonised images were used for group comparisons of voxel-wise cross-subject statistical analyses via the randomize command in FSL i.e., Bilingual versus Monolingual and Monolingual versus Bilingual. For significance, over 10000 permutations were tested at p< 0.05 and p<0.01 levels, and threshold-free cluster-enhancement (Smith & Nichols, Reference Smith and Nichols2009) corrected for multiple comparisons. TIV (total intracranial volume) was added as a regressor in the analysis to ensure that differences in TIV between groups did not contribute to other variables (Sanfilipo, Benedict, Zivadinov & Bakshi, Reference Sanfilipo, Benedict, Zivadinov and Bakshi2004). TIV was estimated as the sum of grey matter, white matter and CSF volumes from segmentation of T1 weighted images. SPM12 software was used (www.fil.ion.ucl.ac.uk/spm/). Significant group differences were projected as cluster voxels with different colors for the purpose of illustration. Since the data were acquired at different locations, potential confounding effects from the scanners were also accounted for (Fox, Sakaie, Lee, Debbins, Arnold, Melhem & Philips, Reference Fox, Sakaie, Lee, Debbins, Arnold, Melhem, Philips and &Lowe2012). One bilingual Hindi–English speaking volunteer (who did not participate in the experiment) was scanned at both sites using the same protocols, sequence and exam card. FA, AD, RD and MD maps were generated at each site. In order to ensure voxelwise correspondence, images and maps from the Delhi site were coregistered to corresponding maps from Milan using FSL FLIRT. Nine white matter ROIs were defined from the ICBM-DTI-81 atlas of white-matter labels (Mori, Oishi, Jiang, Jiang, Li, Akhter et al., Reference Mori, Oishi, Jiang, Jiang, Li and Akhter2008), which included the anterior and posterior limbs of the internal capsule (bilaterally), corpus callosum (genu, body and splenium) and the superior longitudinal fasciculus (bilaterally). ROIs were transformed to the subject space and eroded with a 3x3x3 voxel box kernel to minimize partial volume effects. The diffusion measures from these ROIs were found to be comparable across scanners (See Figure 3). Further, the ratio of measures was calculated from a single voxel in the genu of the corpus callosum and applied as a correction factor on FA, AD, RD and MD maps for all participant data prior to TBSS analysis.
3. Results
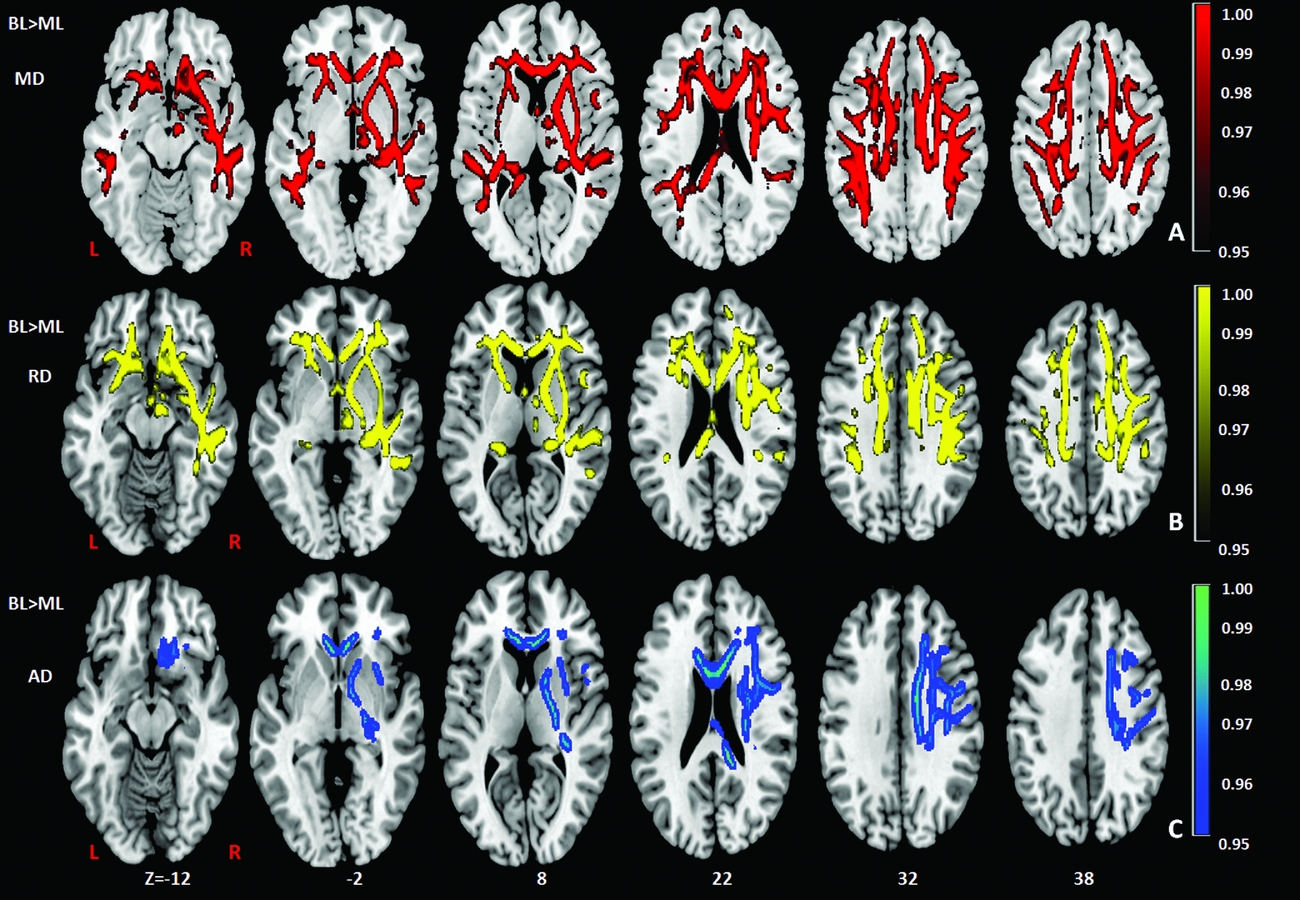
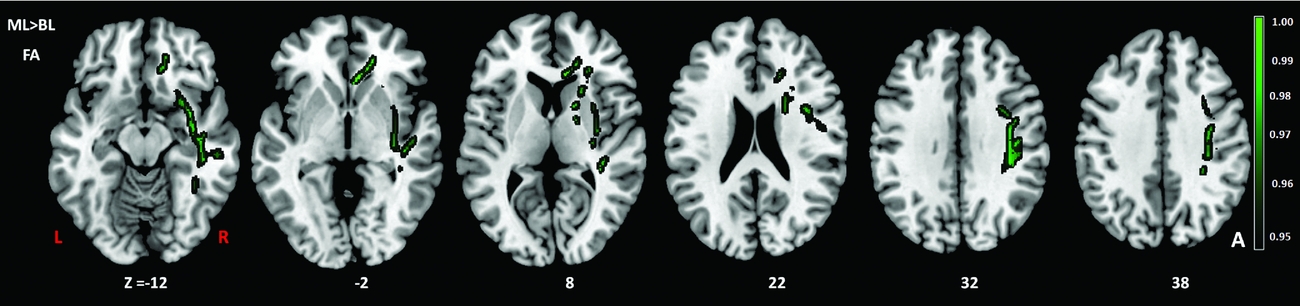
Comparison of the DTI measures between monolingual and bilingual speakers (Monolingual > Bilingual) found reduced mean FA (p<.05) in the right anterior thalamic radiation, ILF and IFOF (Figure 1). Reverse contrasts between bilingual and monolingual speakers (Bilingual > Monolingual) were not significant. TBSS revealed higher mean MD for bilinguals in forceps minor and bilateral SLF (Figure 2, Panel A). Bilinguals also had higher mean RD in forceps minor, right SLF, ILF and the right anterior thalamic radiation (Figure 2, Panel B) and higher mean AD in forceps minor, right SLF and right anterior thalamic radiation (Figure 2, Panel C). Comparisons between monolingual and bilingual speakers (Monolingual > Bilingual) found no significant differences in mean MD, RD or AD (p>0.05). For bilingual speakers, there was a positive correlation (r=0.424) between average L2 proficiency score and mean RD in the right SLF (p<0.07) (see Figures 4 and 5, for details). A summary of the TBSS analyses of regions where mean RD correlated with average L2 proficiency for bilinguals is shown in Figure 4 and Figure 5 shows the plot of mean RD and average L2 proficiency in the right SLF. A component L2 proficiency index was constructed comprising speaking, reading, writing and comprehension scores and it revealed significant correlations between speaking in L2 (p<0.07) and writing in L2 (p<0.05) with mean RD values in right SLF (see Table 5).
TBSS results showing group differences (BL> ML) in mean diffusivity (MD) (red), radial diffusivity (RD) (yellow), axial diffusivity (AD) (blue), expressed in 1-P values (p=0.05, corrected) and overlaid onto MNI152 template. Superior Longitudinal Fasciculus (SLF) and forceps minor (FM) in the right hemisphere have also been indicated. TIV (total intracranial volume) was added as a regressor in the analysis to ensure that differences in TIV between the groups did not contribute to other variables. BL=Bilinguals, ML=Monolinguals.
TBSS results showing group differences in fractional anisotropy (FA) (green) expressed in 1-P values (p=0.05, corrected) and overlaid onto MNI152 template. TIV (total intracranial volume) was added as a regressor in the analysis to ensure that differences in TIV between the groups did not contribute to other variables. BL=Bilinguals, ML=Monolinguals.
Comparison of diffusion measures across scanners: Mean FA, MD, RD and AD were compared within nine white matter ROIs-1. Anterior Limb of the Internal Capsule, Left; 2.Anterior Limb of the Internal Capsule, Right; 3.Posterior Limb of the Internal Capsule, Left; 4.Posterior Limb of the Internal Capsule, Right; 5.Body of Corpus Callosum; 6.Genu of Corpus Callosum; 7.Splenium of Corpus Callosum; 8.Superior Longitudinal Fasciculus, (SLF) Left; 9.Superior Longitudinal Fasciculus (SLF), Right. The error bars show standard deviations within the ROI.

Correlation between Radial Diffusivity in the right SLF and the L2 proficiency scores for Bilinguals.

Correlation between Radial Diffusivity in the right SLF and the L2 proficiency scores for Bilinguals. Results of TBSS analysis with Threshold Free Cluster Enhancement and permutation testing (5000 permutations), at p< 0.097.

4. Discussion
The results support our expectations that white matter microscopic differences will be found in white matter tracts for bilingual compared to monolingual speakers. We observed higher mean MD, RD and AD for bilingual speakers in forceps minor and right SLF and a positive correlation between L2 proficiency and mean RD in the right SLF. Furthermore, as reported by Cummine and Boliek (Reference Cummine and Boliek2013) with a comparable sample, we confirmed reduced mean FA for bilinguals in the anterior thalamic radiation and the right IFOF. However, unlike Cummine and Boliek (Reference Cummine and Boliek2013) we did not find reduced MD in forceps minor or left IFOF or no evidence of increased MD in the cingulum for bilingual speakers. Other studies using different samples also report differences in mean FA, MD and RD between monolingual and bilingual speakers (Gold et al., Reference Gold, Johnson and Powell2013; Luk et al., Reference Luk, Bialystok, Craik and Grady2011; Kuhl, Richards, Stevenson, Can, Wroblewski, Fish & Mizrahi, Reference Kuhl, Richards, Stevenson, Can, Wroblewski, Fish and Mizrahi2013; Plitsiakis et al., Reference Pliatsikas, Moschopoulou and Saddy2015). However, we show for the first time that mean axial diffusivity (AD) is greater for bilingual than monolingual speakers in forceps minor and right SLF. We note that the same pattern was observed in the right SLF for mean MD and RD and moreover that the right SLF is implicated in neuroplasticity after second language experience (cfr. Qi et al., Reference Qi, Han, Garel, San and Gabrieli2015 discussed below). We discuss the implications of these results for models of bilingual language processing in detail below.
Bilingual adults had higher mean MD values in bilateral SLF and forceps minor, higher mean RD in right SLF, forceps minor and higher mean AD in right SLF and forceps minor. These findings converge on a pattern that reflects the role of language control in bilingual speech in our view. It is of interest that higher mean RD and mean AD in the anterior thalamic radiation are coincident with lower FA in the same region which may indicate a different pattern of myelination. Furthermore, mean FA is in fact lower for bilingual speakers than monolingual speakers. One possible inference is that higher RD and AD, which characterize the rate of diffusion in the perpendicular and parallel directions respectively, indicate a higher rate of isotropic diffusivity in bilinguals but lower axonal density, myelination and coherence in the orientation of white matter as reflected in mean FA. However, although myelination may be reflected in changes to mean axial and radial diffusivities, the underlying mechanisms are complex. Myelination is not a necessary condition for anisotropy and an increase reflects coherent organization of the fibre tracts within the voxel more than myelination per se. Other factors such as the variability in axonal dimensions, membrane permeability, membrane packing density and extra cellular spacing between axons may contribute to mean FA values. Indeed, results from computer simulations suggest axonal diameter and membrane permeability affect transverse (or perpendicular) ADC (Beaulieu, Reference Beaulieu2002). Moreover, unlike
for neurodegeneration wherein the direction of changes in DTI metrics are diagnostic, the values are more ambiguous for neuroplasticity since incoherence in the geometry due to spontaneous changes in a white matter fiber bundle can decrease mean FA values (see Jones, Knösche & Turner, Reference Jones, Knösche and Turner2013). It is therefore unwise to attribute differences in the direction of effects across metrics before knowing whether such changes have been controlled. Although this is done in training studies routinely (see Qi et al., Reference Qi, Han, Garel, San and Gabrieli2015), our research design does not allow any such inferences.
A review on changes in grey and white matter due to training (Zatorre, Fields & Johansen-Berg, Reference Zatorre, Fields and Johansen-Berg2012) suggests that while mean FA quantifies directional dependence of water diffusion, principal diffusion direction corresponds to the underlying fiber direction in a coherent fiber bundle. Zatorre et al. (Reference Zatorre, Fields and Johansen-Berg2012) therefore suggest that reduced FA might be observed if axon diameters increase or if a secondary fiber population matures in a region of the fiber crossing. In keeping with this reasoning, we tentatively suggest that reduced FA in our sample could indicate increased axonal diameter resulting from second language experience in daily use over several years. Given reduced FA is coincident with increased RD, MD and AD in our results, we contend that second language experience increases the axonal diameter in critical regions, resulting in more isotropic geometry in bilingual than monolingual speakers. This could in turn lead to the development of enlarged and less prolate myelination in white microstructure of bilingual speakers. At a minimum our results confirm previous reports of differences in the underlying geometry of white matter microstructure in bilinguals compared to monolinguals. However, we are cautious in offering a detailed account of the processes that generate these differences.
The strongest evidence for our contention that DTI metrics index enlarged and less prolate myelination in white microstructure due to bilingual experience with a second language is the correlation between average L2 proficiency and mean RD in the right SLF (Figures 4 and 5) and the correlations between mean writing and speaking sub-scores and mean RD values in the right SLF (Table 5). Given the established role of SLF pathways in language production (Dick & Tremblay, Reference Dick and Tremblay2012; Kamali, Flanders, Brody, Hunter & Khader, Reference Kamali, Flanders, Brody, Hunter and Khader2014; Thiebaut de Schotten, Acqua, Forkel, Simmons, Vergani, Murphy & Catani, Reference Thiebaut de Schotten, Acqua, Forkel, Simmons, Vergani, Murphy and Catani2011), we contend that the reliable white matter microstructural changes observed in the right SLF can be attributed to speaking more than one language at a minimum. The novelty of our findings concerns AD and RD. We know that FA and MD reflect neuroplasticity in the language system including second language learning. The effects of second language immersion on FA was reported in a longitudinal study by Schlegel et al. (Reference Schlegel, Rudelson and Tse2012) who found that nine month immersion in L2 (Mandarin) was correlated with increased mean FA in the genu of the CC for native English speakers. Changes in mean FA are also correlated with language training-induced increases in the strength of the structural connectivity between the inferior frontal gyrus and caudate in the right hemisphere. For example, Hosoda et al. (Reference Hosoda, Tanaka, Nariai, Honda and Hanakawa2013) reported that Japanese (L1) learners of English (L2) had an increase in mean FA in the right ILF after training and showed that L2 proficiency was correlated with mean FA in the right ILF. Although we observed a relationship between mean FA and second language experience in the right ILF, the effect was in the opposite direction to Hosoda et al., i.e., it is reduced for bilingual speakers. Moreover we found RD was greater in the ILF for bilingual speakers showing that FA and RD are dissociable processes that follow bilingual language experience in our sample. On the latter point, we stress that bilingual language experience in our study is a binary, fixed variable whereas second language exposure is a continuous, random variable in the study by Hosoda et al. (Reference Hosoda, Tanaka, Nariai, Honda and Hanakawa2013). Therefore, we are reluctant to make direct comparisons between studies. It is of interest however that the right ILF is sensitive to speaking more than one language. In a study of native English speakers who were also learning Mandarin, Qi et al. (Reference Qi, Han, Garel, San and Gabrieli2015) report that average RD was correlated with language proficiency following second language training and with increased mean FA in the right ILF and also in the right SLF. Our finding of increased RD in right SLF is compatible with their results and suggests effects of neuroplasticity reflect bilingual language experience that is not specific to the language or the type of language experience. We therefore disagree with one of the conclusions of Qi et al. who argue their results reflected language specific properties e.g., the use of pitch contour (tone) and visuospatial skills for learning Mandarin. Our results show effects in right SLF for native Hindi speakers who use English regularly and there are no similarities between Hindi and Mandarin. In our view it is remarkable that the right ILF is a sensitive measure of second language experience across different language types. Comparing results to Qi et al. (Reference Qi, Han, Garel, San and Gabrieli2015), we contend a broader role for the SLF in second language exposure that is not limited to the training effects that inevitably result from learning a second language. However, we agree with the conclusions of Qi et al. (Reference Qi, Han, Garel, San and Gabrieli2015) that differences in linguistic attributes between first and second languages may underpin correlations between mean RD and speaking and writing attainment in a second language (see Table 5). Since our sample was early immersed in L2 (compared to the late learners in a training study), changes due to training might have been in evidence at an earlier age for our sample but have stabilized over time. As Qi et al. argue, right hemisphere involvement in second language learning is most likely not a unique feature of the linguistic properties of a second language and is likely due to the recruitment of brain regions outside the native language network that reflect the cognitive demands that arise from second language use. This hypothesis gains support from significant associations observed between mean RD in right SLF and ILF for bilinguals here. Our results add to those from Qi et al. (Reference Qi, Han, Garel, San and Gabrieli2015) in terms of the mean AD and RD measures. Qi et al. (Reference Qi, Han, Garel, San and Gabrieli2015) reported a negative correlation between mean RD and no correlation between mean AD and second language proficiency whereas we found mean AD and RD are both higher in bilingual speakers and mean RD is correlated with proficiency in a second language (English). Hence, results from lifelong Hindi–English bilingual speaking students are different from the findings from native English speaking students who learn a new language (Mandarin) over a much shorter period of time. Comparisons between these studies suggest that (functionally) reports of white matter microscopic changes after second language experience or exposure should distinguish between samples whereby the second language is early acquired and then used routinely in a multilingual environment (Delhi) compared to late acquired learning of a second language in a constrained environment such as the classroom.
Turning to differential patterns of diffusivity across studies, we begin with the MD findings. MD is a measure of neuroplasticity that is assumed to reflect tissue changes such as astrocyte swelling, synaptic changes, dendritic spine changes and angiogenesis (Takeuchi, Taki, Nouchi, Hashizume, Sekiguchi, Kotozaki & Kawashima, Reference Takeuchi, Taki, Nouchi, Hashizume, Sekiguchi, Kotozaki and Kawashima2014). FA and MD are not necessarily correlated, i.e., reduced FA can be observed with increased MD but indices can also be coincident and MD can be lower or higher across different brain regions (Cummine & Boliek, Reference Cummine and Boliek2013). To recap, we found that bilinguals show higher levels of MD in forceps minor and bilateral SLF. The left SLF is classically associated with language processing across languages (cf. Catani et al., Reference Catani, Jones and Ffytche2005; Hickok & Poeppel, Reference Hickok and Poeppel2004, Reference Hickok and Poeppel2007). The left SLF has been implicated in language production and is associated with the dorsal language pathway (Saur, Kreher, Schnell, Kummerer, Kellmeyer, Vry et al., Reference Saur, Kreher, Schnell, Kummerer, Kellmeyer, Vry and Weiller2008) that connects Broca's area and premotor cortex to the Superior Temporal Gyrus (STG) – all regions that have a role in the articulation of language (Friederici, Reference Friederici2011). We note here that fMRI studies report that practice on non-verbal training tasks (reversing the Simon effect) is negatively correlated with neural activity in right ventral premotor cortex (vPMC) (Wang & Weekes, Reference Wang and Weekes2014). Although classical neurobiological models of language processing assume left hemispheric dominance, the advent of brain imaging data – including specifically in bilingual speakers – revealed bilateral activation (Chee, Caplan, Soon, Sriram, Tan, Thiel & Weekes, Reference Chee, Caplan, Soon, Sriram, Tan, Thiel and Weekes1999; Chee, Weekes, Lee, Soon, Schreiber, Hoon & Chee, Reference Chee, Weekes, Lee, Soon, Schreiber, Hoon and Chee2000; Hämäläinen, Sairanen, Leminen & Lehtonen, Reference Hämäläinen, Sairanen, Leminen and Lehtonen2017; Hull & Vaid, Reference Hull and Vaid2006; Weekes, Coltheart & Gordon, Reference Weekes, Coltheart and Gordon1997) as well as evidence of a shift to the right hemisphere for L2 related tasks (Dehaene, Dupoux, Mehler, Cohen, Paulesu, Perani et al., Reference Dehaene, Dupoux, Mehler, Cohen, Paulesu and Perani1997; Xiang, Leeuwen, Van Dediu, Norris & Hagoort, Reference Xiang, Leeuwen, Van Dediu, Norris and Hagoort2015). Since languages differ in articulatory features, speakers of multiple languages are required to develop a repertoire of articulatory gestures that are unique to a target language. Therefore, speakers of two or more languages have additional needs to coordinate their verbal motor acts when compared to monolinguals. Such gestures are likely supervised by the language control system that adjusts utterances to context and eschews utterances from a non-target language (Abutalebi & Green, Reference Abutalebi and Green2007; Abutalebi, Reference Abutalebi2008). Such control of the language system is achieved through a bilateral network of brain areas related to cognitive control including prefrontal areas, ACC, parietal areas and the caudate nucleus (Abutalebi & Green, Reference Abutalebi and Green2016). Evidence of DTI changes in the right hemisphere reported here may be specifically related to language control processes necessary to support L2 processing. Our results show a bilateral pattern of white matter changes measures detected through MD for bilingual speakers, in regions of the right hemisphere that coincides with RD and AD. In the light of these findings, we suggest that the changes in tract geometry in the right SLF for the present sample reflect early immersion and daily use of L2.
Cummine and Boliek (Reference Cummine and Boliek2013) report reduced MD for bilingual young adults in forceps minor (and left IFOF) together with increased MD in the cingulum. Sagi, Tavor, Hofstetter, Tzur-Moryosef, Blumenfeld-Katzir & Assaf (Reference Sagi, Tavor, Hofstetter, Tzur-Moryosef, Blumenfeld-Katzir and Assaf2012) proposed that MD measures astrocyte swelling and remodeling of glial processes reflecting neuroplasticity (see also Alexander, Lee, Lazar & Field, Reference Alexander, Lee, Lazar and Field2007; Song, Yoshino, Le, Lin, Sun, Cross & Armstrong, Reference Song, Yoshino, Le, Lin, Sun, Cross and Armstrong2005). Therefore, it is unremarkable that MD is higher for bilinguals but puzzling that Cummine and Boliek (Reference Cummine and Boliek2013) report the opposite effect. Of deeper interest is the lateralization of AD and RD effects to the right hemisphere for our sample. RD is related to myelination. TBSS analysis and histogram measures (Table 4) show a consistent pattern of differences in mean AD, RD and MD effects in SLF but the AD and RD indices are observed in right SLF only. According to Qi et al. (Reference Qi, Han, Garel, San and Gabrieli2015) lower RD reflects axonal myelination or denser axonal tracts whereas AD measures axon integrity. Whereas Qi et al. (Reference Qi, Han, Garel, San and Gabrieli2015) found an inverse correlation between FA and RD (but not AD) with higher FA values associated with lower RD for second language learners, we found the reverse pattern (lower FA and higher RD) for bilingual speakers. Qi et al. (Reference Qi, Han, Garel, San and Gabrieli2015) proposed second language learning increases myelination leading to denser axonal tracts in SLF. However, we cannot reconcile this account with our data unless we assume that bilingual experience is different to second language learning. We noticed Qi et al. (Reference Qi, Han, Garel, San and Gabrieli2015) reported average values across SLF regions in their analyses. However, the SLF is divided into at least four parts including the arcuate and temporo-parietal SLF (Thiebaut de Schotten et al., Reference Thiebaut de Schotten, Acqua, Forkel, Simmons, Vergani, Murphy and Catani2011). When overlays are applied to SLF regions (following the method reported by Kamali et al., Reference Kamali, Flanders, Brody, Hunter and Khader2014), we found that mean MD was associated more with SLF III. SLF III originates in the supramarginal gyrus and terminates in ventral premotor and prefrontal cortex – a region that is associated with practice on cognitive tasks (Wang & Weekes, Reference Wang and Weekes2014). Schmahmann and Pandya (Reference Schmahmann and Pandya2006) propose that somatosensory information related to language articulation is conveyed via SLF III. As outlined above, if we compare our data to comparable effects from language learning we see correlated but dissociable patterns of myelination. In our view it is lifelong bilingual language experience that generates neuroplasticity and this is reflected in greater isotropic diffusivity. Given that increases in MD observed here are accompanied by increases in AD and RD (as expected), we assert that bilingual language experience is a valid measure of neuroplasticity when compared to training studies and moreover it is cumulative exposure not learning per se that leads to less prolate and spherical (increased axon) diameter.
Results showing all the significant group differences in MD, RD, AD and FA.

Correlations between the L2 proficiency measures and diffusion measures (Mean MD, RD, AD and FA) in bilinguals. Pearson's correlation(r) with corresponding p-values.
We need to further distinguish cumulative exposure from second language learning. Qi et al (Reference Qi, Han, Garel, San and Gabrieli2015) proposed their results derive from cognitive processes including tone perception and visuo-spatial processing. These processes are no doubt essential to achieve both spoken and written language proficiency in Mandarin. The Hindi–English participants in our study belong to a unique group. In the biliteracy environment of India, the acquisition of English starts as a second language and spoken, written and comprehension skills are taught simultaneously in school at around the age of 5 years (Cherodath & Singh, Reference Cherodath and Singh2015). Consequently, pupils can become fluent bilingual bi-literates quite early and have similar skills in both languages (Cherodath & Singh, Reference Cherodath and Singh2015; Das, Padakannaya, Pugh & Singh, Reference Das, Padakannaya, Pugh and Singh2011). We contend that regular use of a second language leads to specific alteration to the myelination of axonal pathways. According to Green and Abutalebi (Reference Green and Abutalebi2013), regular second language should be manifested in changes to neural areas that are necessary for cognitive control when compared to monolingual speakers. Right SLF and forceps minor are neural structures that are assumed to be necessary for cognitive control (see Tamnes, Fjell, Westlye, Østby & Walhovd, Reference Tamnes, Fjell, Westlye, Østby and Walhovd2012; Strenziok, Greenwood, Santa Cruz, Thompson & Parasuraman, Reference Strenziok, Greenwood, Santa Cruz, Thompson and Parasuraman2013) including for language control in bilingual speakers (Rossi, de Moura, de Mello, de Souza, Muszkat & Bueno, Reference Rossi, de Moura, de Mello, de Souza, Muszkat and Bueno2015). Forceps minor is a commissural tract that connects the medial and lateral surfaces of prefrontal cortices (Wycoco, Shroff, Sudhaka & Lee, Reference Wycoco, Shroff, Sudhaka and Lee2013) and is associated with the acquisition of new skills (Song, Sharma, Buch & Cohen, Reference Song, Sharma, Buch and Cohen2012) and reaction time in control tasks (Rossi et al., Reference Rossi, de Moura, de Mello, de Souza, Muszkat and Bueno2015). On the other hand, SLF is a fiber bundle involved in intra-hemispheric dorso-dorsal connections between frontal and parietal lobes. One hypothesis about the effects observed here is that the requirement to articulate in more than one language on a regular basis (as in our sample) will induce neural changes that are not found in monolingual speakers and critically are not necessary in second language learning as that typically relies on text and spoken immersion in one language only.
We found little evidence that left hemisphere networks and tracts become more important as language proficiency improves at least when the language is early acquired and used daily. It is also notable that studies with simultaneous interpreters compared to matched monolingual controls report decreases in FA at the whole brain level that accompany increases in RD and decreases in AD in the CC, the cortico-spinal tract and cingulum bundle (Elmer, Hanggi, Meyer & Jancke, Reference Elmer, Hanggi, Meyer and Jancke2011). Differences were attributed to demands in sensory-motor coupling mechanisms necessary for simultaneous interpreters in regions supporting articulation such as forceps minor (Figure 1).
We submit that higher MD and RD in forceps minor and SLF reflects cognitive control used to balance the non-overlapping sets of articulatory gestures in regular discourse for bilingual speakers. We further contend that speaking two languages on a daily basis has the additional requirement to coordinate verbal schemas (mental sets) via cortico-cortico connections due to variable pragmatic demands that are determined by the linguistic context, which is not unique to Delhi. For example, the daily use of more than one language is a fact of discourse in many countries around the world and is typical of several regions in Asia including Hong Kong, Malaysia and Singapore. We label this requirement linguistic load and contend that increasing linguistic load produces neuroplasticity in bilingual speakers that is different to monolinguals.
In sum, we submit that higher mean AD, RD and MD reflects differences in diffusion of water molecules in specific white matter tracts including the forceps minor and right SLF and is a consequence of the neuroplasticity that is necessarily generated by the linguistic load for bilingual discourse. We do not rule out a role for SLF in the co-articulation necessary for monolingual speech production but this cannot ever be more demanding than the linguistic load that is a defining feature of bilingual speech production (Schmahmann & Pandya, Reference Schmahmann and Pandya2006). According to our hypothesis, we can expect differences in SLF for bilingual speakers to be correlated with the complexity of the articulatory repertoire of multilingual individuals, as in related studies showing increased grey matter volume in regions that are necessary for articulation for bilingual speakers (Abutalebi et al., Reference Abutalebi, Rosa, Castro Gonzaga, Keim, Costa and Perani2013). Such studies show that language environments shape the brain into myriad and diverse structures.


