


1. Introduction
Irrotational surface gravity waves affect the transport of mass in the ocean through their mean Lagrangian drift (van den Bremer & Breivik Reference van den Bremer and Breivik2018). For steady monochromatic plane waves, this drift is horizontally uniform and increases with wave steepness (Stokes Reference Skyner1847). Ocean waves are neither steady nor monochromatic, and yet in most cases it is assumed that the total mean Lagrangian drift can be computed by treating the sea surface as a linear sum of non-interacting monochromatic plane waves (e.g. Kenyon Reference Kenyon1969). In this paper we show that this assumption significantly underpredicts the near-surface mean Lagrangian drift when the surface becomes locally steep.
The mean Lagrangian drift impacts upper-ocean processes across spatio-temporal scales greater than those of individual waves, making its accurate estimation crucial to a number of applications. For example, this drift directly influences the transport and dispersal of buoyant marine debris, such as plankton, plastics and oil spills (van Sebille et al. Reference van Sebille2020; Deike Reference Deike2022). It is also widely understood that this vertically sheared Lagrangian-mean flow interacts with the background vorticity field to tilt and stretch vortices, producing horizontal overturning cells indicative of Langmuir circulation (Craik & Leibovich Reference Craik and Leibovich1976; Leibovich Reference Leibovich1983). These overturning cells help mix the upper ocean, and many studies emphasise the need to parameterise these effects in large-scale models (e.g. Belcher et al. Reference Belcher2012). Additionally, the generation of waves by wind is modified by the drift magnitude (Seitz, Freilich & Pizzo Reference Zakharov2026). Any enhancements to the mean Lagrangian drift, especially in steep wave fields where its magnitude is largest, can therefore have a profound effect on these upper-ocean processes.
The impetus for this work came from a series of laboratory experiments (Lenain, Pizzo & Melville Reference Lenain, Pizzo and Melville2019; Sinnis et al. Reference Seitz, Freilich and Pizzo2021) which measured the total Lagrangian displacement of surface particles induced by breaking and non-breaking wave packets. These packets consisted of multiple wave components which were tuned to constructively interfere or focus at a prescribed location and time via dispersion. Wave breaking was found to greatly increase the Lagrangian transport, with the enhancements strongly dependent on each particle’s distance from the breaking location. Interestingly, a similar, albeit weaker, spatial dependence was observed for steep non-breaking packets, with the largest enhancements occurring within the focusing region where the packet was most steep. This result was unexpected, since when viewed as a sum of linear monochromatic plane waves, the only differences between a focused and unfocused packet are relative phase shifts between wave components. If the total mean Lagrangian drift could be obtained by summing the individual drifts of each wave independently of the others, the relative phase shifts should be irrelevant. Thus, one should expect both the total drift and net transport to be spatially constant and independent of packet focusing.
To supplement the limited laboratory data, we present numerical simulations of surface Lagrangian particle trajectories in equivalently defined packets using a fully nonlinear potential flow solver (Longuet-Higgins & Cokelet Reference Longuet-Higgins and Cokelet1976; Dold Reference Dold1992). With a high spatial particle density, these simulations can better capture the spatial dependence of the surface Lagrangian transport. Repeating these simulations over a wide parameter space of steepness and bandwidth parameters reveals that the surface transport of particles averaged over the focusing region can exceed the spatially invariant predictions of linear theory by up to $30\,\%$
. Some individual particles can even be transported up to twice this prediction, all without any wave breaking.
$30\,\%$
. Some individual particles can even be transported up to twice this prediction, all without any wave breaking.
It should be clear that one cannot predict local enhancements to the mean Lagrangian drift without a local theory to explain it. By working in the Lagrangian reference frame, we derive a new exact technique for constraining the local mean Lagrangian drift of general wavy flows through the local mean pseudomomentum. This result is similar to the circulation theorem in generalised Lagrangian-mean (GLM) theory (Andrews & McIntyre Reference Andrews and McIntyre1978) but presented in a fully Lagrangian framework. Leveraging this new method, we derive an expression for the local mean Lagrangian drift in two-dimensional, deep-water and narrow-banded wave packets governed by the nonlinear Schrödinger equation (NLSE) (Zakharov Reference Yuen and Lake1968; Chu & Mei Reference Chu and Mei1970). This result complements previous estimates of the mean Lagrangian drift in wave packets derived via Eulerian frameworks (van den Bremer & Taylor Reference van den Bremer and Taylor2016; Deike, Pizzo & Melville Reference Deike, Pizzo and Melville2017; Carter, Curtis & Kalisch Reference Carter, Curtis and Kalisch2020; Li & Li Reference Li and Li2021), which allow for greater generality in directionality, depth and bandwidth, but are valid only to leading order in wave steepness. In this derivation, we retain the effects of finite bandwidth and steepness beyond leading order, and show that their combined influence enhances the near-surface mean Lagrangian drift during wave focusing and steepening. We then use this analytical expression to estimate local enhancements to the mean Lagrangian transport in the simulations, finding good agreement, especially for lower bandwidths where the NLSE approximation is most valid.
This paper is organised as follows, in § 2, we introduce the equations of motion in the Lagrangian reference frame and derive a novel method to compute the local mean Lagrangian drift for general wavy flows. In § 3, we define the focusing wave packets used, and numerically simulate their surface particle trajectories, comparing the results with laboratory data. In § 4, we derive the Lagrangian particle trajectories in narrow-banded waves and compute a higher-order expression for the local mean Lagrangian drift, testing this theory against the simulations. In § 5, we discuss the implications of these results in broader geophysical contexts.
2. The mean Lagrangian drift of waves
There are two natural coordinate systems for representing fluid motion within surface gravity waves: the Eulerian and the Lagrangian. The Eulerian frame solves for the fluid velocity as a function of fixed physical space and time and is mathematically appealing due to the fact that, for two-dimensional irrotational and incompressible flow, the fluid velocity is analytic in the interior. This means that the entirety of the flow is determined by its behaviour at the boundaries (Luke Reference Luke1967). The fluid interior is governed by the linear Laplace equation
 \begin{equation} {\nabla} ^2 \phi = 0 , \quad \boldsymbol{u} = \boldsymbol{\nabla } \phi , \end{equation}
for the velocity potential $\phi (x,y,t)$
, whose spatial gradient is the Eulerian fluid velocity
$\phi (x,y,t)$
, whose spatial gradient is the Eulerian fluid velocity $\boldsymbol{u}(x,y,t)$
. Despite the equation of motion being linear, the problem is made considerably more difficult due to the nonlinear boundary conditions (see, for example, § 3.1 of Phillips Reference Phillips1977)
$\boldsymbol{u}(x,y,t)$
. Despite the equation of motion being linear, the problem is made considerably more difficult due to the nonlinear boundary conditions (see, for example, § 3.1 of Phillips Reference Phillips1977)
 \begin{align} \eta _t + \phi _x \eta _x - \phi _y = 0 \Big |_{y = \eta (x,t)}, \\[-12pt]\nonumber \end{align}
 \begin{align} \phi _t + \frac {1}{2}(\boldsymbol{\nabla } \phi )^2 - g \eta = 0 \Big |_{y = \eta (x,t)} , \end{align}
where $\eta (x,t)$
is the surface elevation, an introduced independent variable not known a priori, and
$\eta (x,t)$
is the surface elevation, an introduced independent variable not known a priori, and $g$
is the acceleration due to gravity, which in our notation points in the
$g$
is the acceleration due to gravity, which in our notation points in the $-\hat {y}$
direction, with subscripts indicating partial derivatives. While it is common to evaluate these boundary conditions by expanding in a Taylor series about the still water level
$-\hat {y}$
direction, with subscripts indicating partial derivatives. While it is common to evaluate these boundary conditions by expanding in a Taylor series about the still water level $y=0$
, this introduces infinitely many nonlinear terms which are in practice truncated by invoking some small parameter which is typically related to the surface wave slope. To compute the physical trajectories of fluid particles as functions of their initial positions and time, one must then integrate the coupled pathline equations
$y=0$
, this introduces infinitely many nonlinear terms which are in practice truncated by invoking some small parameter which is typically related to the surface wave slope. To compute the physical trajectories of fluid particles as functions of their initial positions and time, one must then integrate the coupled pathline equations
 \begin{equation} \frac {{\textrm {d}} x}{{\textrm {d}} t} = u = \phi _x (x,y,t), \quad \frac {{\textrm {d}} y}{{\textrm {d}} t} = v = \phi _y(x,y,t) , \end{equation}
holding particles fixed. Solving (2.4) yields Lagrangian particle trajectories correct to the same level of accuracy as the Eulerian velocity field. However, in practice, analytical solutions quickly become intractable as one must account for changing particle locations in the velocity field. If the desired result is to compute the mean Lagrangian motion of particles, it is much more natural to work directly in the Lagrangian reference frame, where the physical particle trajectories $(x,y)$
are explicitly solved for as functions of general labelling coordinates
$(x,y)$
are explicitly solved for as functions of general labelling coordinates $(\alpha ,\beta )$
and time
$(\alpha ,\beta )$
and time $\tau$
, which we distinguish from the usual notation
$\tau$
, which we distinguish from the usual notation $t$
to emphasise that a partial derivative with respect to
$t$
to emphasise that a partial derivative with respect to $\tau$
holds particle labels fixed (i.e. equivalent to the material derivative
$\tau$
holds particle labels fixed (i.e. equivalent to the material derivative ${\textrm{d}}/{{\textrm {d}} t}$
in the Eulerian frame). One can view these physical trajectories as a time-dependent mapping from a certain ‘label space’ to physical space with a corresponding Jacobian determinant
${\textrm{d}}/{{\textrm {d}} t}$
in the Eulerian frame). One can view these physical trajectories as a time-dependent mapping from a certain ‘label space’ to physical space with a corresponding Jacobian determinant
 \begin{equation} {\mathcal{J}} \equiv \frac {{\partial } (x,y)}{{\partial }(\alpha ,\beta )}= x_\alpha y_\beta - x_\beta y_\alpha , \end{equation}
whose value determines how infinitesimal areas are scaled by the nonlinear mapping. Since incompressible flow requires that a small collection of particles ${\textrm {d}} \alpha \, {\textrm {d}} \beta$
enclose the same physical area
${\textrm {d}} \alpha \, {\textrm {d}} \beta$
enclose the same physical area ${\mathcal{J}}^{-1}{\textrm {d}} x \, {\textrm {d}} y$
as the flow evolves, we see that
${\mathcal{J}}^{-1}{\textrm {d}} x \, {\textrm {d}} y$
as the flow evolves, we see that $\mathcal{J}$
must be everywhere time independent and non-zero,
$\mathcal{J}$
must be everywhere time independent and non-zero,
 \begin{equation} {\mathcal{J}}_\tau = x_{\alpha \tau }y_\beta + x_\alpha y_{\beta \tau } - x_{\beta \tau }y_\alpha - x_\beta y_{\alpha \tau } = 0 . \end{equation}
The particular choice of labelling particles must not affect the dynamics and thus represents an important gauge freedom in fluid mechanics (Salmon Reference Salmon2020). For simplicity we hereinafter choose to work with a labelling gauge such that ${\mathcal{J}} = 1$
, so that areas in label space equal areas in physical space. While we can still define a velocity potential in the Lagrangian frame for irrotational flow, the generally nonlinear mapping between physical and label space implies that the form of the Laplacian operator is more complicated in label space as these maps are not generally harmonic. Instead, we turn to the full Euler equations which in the Lagrangian frame are written as (Lamb Reference Lamb1932, Art. 15)
${\mathcal{J}} = 1$
, so that areas in label space equal areas in physical space. While we can still define a velocity potential in the Lagrangian frame for irrotational flow, the generally nonlinear mapping between physical and label space implies that the form of the Laplacian operator is more complicated in label space as these maps are not generally harmonic. Instead, we turn to the full Euler equations which in the Lagrangian frame are written as (Lamb Reference Lamb1932, Art. 15)
 \begin{equation} {\mathcal{J}} x_{\tau \tau } + p_\alpha y_\beta - p_\beta y_\alpha = 0 , \end{equation}
 \begin{equation} {\mathcal{J}} y_{\tau \tau } + p_\beta x_\alpha - p_\alpha x_\beta + {\mathcal{J}} g = 0 , \end{equation}
where $p$
is the fluid pressure. Note that while the material acceleration is greatly simplified in the Lagrangian frame, the pressure gradient force is no longer represented by a simple linear operator. In practice any Eulerian quantity or operator can be converted to the Lagrangian frame through the Jacobian. For example, the vorticity of the fluid can be converted to the Lagrangian frame via the following steps:
$p$
is the fluid pressure. Note that while the material acceleration is greatly simplified in the Lagrangian frame, the pressure gradient force is no longer represented by a simple linear operator. In practice any Eulerian quantity or operator can be converted to the Lagrangian frame through the Jacobian. For example, the vorticity of the fluid can be converted to the Lagrangian frame via the following steps:
 \begin{equation} q = v_x - u_y = \frac {{\partial } (v,y)}{{\partial }(x,y)} + \frac {{\partial } (u,x)}{{\partial } (x,y)} = \frac {1}{{\mathcal{J}}} \bigg (\frac {{\partial }(y_\tau ,y)}{{\partial } (\alpha ,\beta )} + \frac {{\partial } (x_\tau ,x)}{{\partial } (\alpha ,\beta )}\bigg ), \end{equation}
where $q$
is conserved on particles (i.e.
$q$
is conserved on particles (i.e. $q_\tau = 0)$
for two-dimensional inviscid flow, which can be seen by eliminating
$q_\tau = 0)$
for two-dimensional inviscid flow, which can be seen by eliminating $p$
between the two Euler equations. The strict condition of irrotational flow thus imposes the following constraint on the fluid trajectories:
$p$
between the two Euler equations. The strict condition of irrotational flow thus imposes the following constraint on the fluid trajectories:
 \begin{equation} {\mathcal{J}} q = x_{\tau \alpha }x_\beta - x_{\tau \beta }x_\alpha + y_{\tau \alpha } y_\beta - y_{\tau \beta }y_\alpha = 0 . \end{equation}
To close the system, we impose the following boundary conditions: first, that the pressure vanishes up to a constant at the free surface which we label by our choice as $\beta =0$
 \begin{equation} p(\beta =0) = 0 , \end{equation}
and second, that the vertical velocity vanishes approaching the bottom at infinite depth
 \begin{equation} y_\tau (\beta \rightarrow -\infty ) = 0 . \end{equation}
Note that, while we have necessarily abandoned the simplicity of Laplace’s equation for more complicated nonlinear equations of motion (2.7)–(2.8), what we have gained from this approach is having simple boundary conditions without potentially infinite nonlinear terms which necessitate small-amplitude approximations. In addition, as vorticity is conserved on particles, adding arbitrary vorticity to particles is straightforward in the Lagrangian frame as opposed to in the Eulerian frame where Laplace’s equation would have to be replaced with the full nonlinear Euler equations alongside the nonlinear boundary conditions.
2.1. Mean Lagrangian drift of general flows
While directly solving the Euler (2.7)–(2.8) subject to ${\mathcal{J}}=1$
,
${\mathcal{J}}=1$
, $q=0$
and the boundary conditions (2.11)–(2.12) will yield particle trajectories that explicitly contain the mean Lagrangian drift, this offers little physical insight into its origin. Previous studies connected the mean Lagrangian drift, or equivalently the mean Lagrangian momentum density, to other physical quantities such as vorticity and energy (Pizzo et al. Reference Pizzo, Murray, Smith and Lenain2023; Blaser et al. Reference Blaser, Benamran, Bôas, Lenain and Pizzo2024), but these results necessarily assumed waves that were steady and monochromatic. In this section, we introduce a new method of constraining the mean Lagrangian drift for completely general flows. To do so, we start by considering the circulation of a material loop
$q=0$
and the boundary conditions (2.11)–(2.12) will yield particle trajectories that explicitly contain the mean Lagrangian drift, this offers little physical insight into its origin. Previous studies connected the mean Lagrangian drift, or equivalently the mean Lagrangian momentum density, to other physical quantities such as vorticity and energy (Pizzo et al. Reference Pizzo, Murray, Smith and Lenain2023; Blaser et al. Reference Blaser, Benamran, Bôas, Lenain and Pizzo2024), but these results necessarily assumed waves that were steady and monochromatic. In this section, we introduce a new method of constraining the mean Lagrangian drift for completely general flows. To do so, we start by considering the circulation of a material loop $\mathcal{C}$
, which is defined as
$\mathcal{C}$
, which is defined as
 \begin{equation} \varGamma \equiv \oint _{\mathcal{C}} \boldsymbol{u} \boldsymbol{\cdot }{\textrm {d}} \boldsymbol{\ell } = \iint _{\varOmega } (\boldsymbol{\nabla } \times \boldsymbol{u}) \boldsymbol{\cdot } \boldsymbol{\hat {n}} \, {\textrm {d}} x {\textrm {d}} y , \end{equation}
with the last relation due to Stokes’ theorem for the area $\varOmega$
enclosed by the contour where
$\varOmega$
enclosed by the contour where $\boldsymbol{\hat {n}}$
is the unit outward normal. We simplify here to two-dimensional flow, but the following results may be readily extended to three dimensions (Salmon Reference Salmon1988). Just as with the vorticity, we can rewrite the circulation in Lagrangian coordinates via the chain rule
$\boldsymbol{\hat {n}}$
is the unit outward normal. We simplify here to two-dimensional flow, but the following results may be readily extended to three dimensions (Salmon Reference Salmon1988). Just as with the vorticity, we can rewrite the circulation in Lagrangian coordinates via the chain rule
 \begin{equation} \varGamma = \oint _{\mathcal{C}_0} \big (x_\tau \boldsymbol{\nabla _\alpha }x + y_\tau \boldsymbol{\nabla _\alpha }y\big ) \, \boldsymbol{\cdot } {\textrm {d}} \boldsymbol{\alpha } = \iint _{\varOmega _0} {\mathcal{J}} q \, {\textrm {d}} \alpha \, {\textrm {d}} \beta , \end{equation}
where $\boldsymbol{\nabla _\alpha } = ({\partial }_\alpha ,{\partial }_\beta )$
is the gradient operator in label space. The contour
$\boldsymbol{\nabla _\alpha } = ({\partial }_\alpha ,{\partial }_\beta )$
is the gradient operator in label space. The contour $\mathcal{C}_0$
is now a contour in label space and is therefore fixed in time by definition; the same goes for the enclosed area
$\mathcal{C}_0$
is now a contour in label space and is therefore fixed in time by definition; the same goes for the enclosed area $\varOmega _0$
. If we decompose the Lagrangian trajectories into deviations from a quiescent reference state
$\varOmega _0$
. If we decompose the Lagrangian trajectories into deviations from a quiescent reference state $(x,y) = (\alpha ,\beta )$
 \begin{equation} x = \alpha + \xi (\alpha ,\beta ,\tau ) , \quad y = \beta + \zeta (\alpha ,\beta ,\tau ), \end{equation}
so that $\alpha$
and
$\alpha$
and $\beta$
can be seen as ‘horizontal’ and ‘vertical’ labels respectively, we can rewrite the circulation as
$\beta$
can be seen as ‘horizontal’ and ‘vertical’ labels respectively, we can rewrite the circulation as
 \begin{equation} \varGamma = \oint _{\mathcal{C}_0} (\boldsymbol{x}_\tau - \boldsymbol{p}) \boldsymbol{\cdot } {\textrm {d}} \boldsymbol{\alpha } , \end{equation}
where $\boldsymbol{x}_\tau = (\xi _\tau ,\zeta _\tau )$
is the Lagrangian velocity, and
$\boldsymbol{x}_\tau = (\xi _\tau ,\zeta _\tau )$
is the Lagrangian velocity, and $\boldsymbol{p} =-(\xi _\tau \xi _\alpha + \zeta _\tau \zeta _\alpha , \, \xi _\tau \xi _\beta + \zeta _\tau \zeta _\beta )$
is identified as the Lagrangian pseudomomentum. While its form looks identical to pseudomomentum as defined in GLM theory (Andrews & McIntyre Reference Andrews and McIntyre1978; Bühler Reference Bühler2014), they are still distinct since the displacement vector in GLM is a function of the Lagrangian-mean trajectory, not Lagrangian particle labels. For irrotational flows where
$\boldsymbol{p} =-(\xi _\tau \xi _\alpha + \zeta _\tau \zeta _\alpha , \, \xi _\tau \xi _\beta + \zeta _\tau \zeta _\beta )$
is identified as the Lagrangian pseudomomentum. While its form looks identical to pseudomomentum as defined in GLM theory (Andrews & McIntyre Reference Andrews and McIntyre1978; Bühler Reference Bühler2014), they are still distinct since the displacement vector in GLM is a function of the Lagrangian-mean trajectory, not Lagrangian particle labels. For irrotational flows where $\varGamma =0$
for all closed loops, (2.16) implies that the label space curl of the velocity must be everywhere equal to the label space curl of the pseudomomentum
$\varGamma =0$
for all closed loops, (2.16) implies that the label space curl of the velocity must be everywhere equal to the label space curl of the pseudomomentum
 \begin{equation} \boldsymbol{\nabla }_{\boldsymbol{\alpha }} \times \boldsymbol{x}_\tau = \boldsymbol{\nabla }_{\boldsymbol{\alpha }}\times \boldsymbol{p}, \end{equation}
analogous to the celebrated result in GLM (Bühler Reference Bühler2014, Ch. 10). Since what we are interested in is the mean component of the velocity, we can take an average of (2.17) to get
 \begin{equation} \boldsymbol{\nabla }_{\boldsymbol{\alpha }} \times \langle \boldsymbol{x}_\tau \rangle = \boldsymbol{\nabla }_{\boldsymbol{\alpha }} \times \langle \boldsymbol{p} \rangle , \end{equation}
where the angle brackets represent any general averaging operator in the Lagrangian frame that commutes with the curl in label space, such as a time mean or convolutional average. It is worth pausing here for a moment to unpack this result, which states that, for irrotational flow, the curl of the mean Lagrangian drift is exactly set by the curl of the mean pseudomomentum so that any modification to one immediately affects the other. Viewing the mean Lagrangian drift in relation to the dynamic mean pseudomomentum highlights its role as not simply a passive byproduct of the waves, but as a dynamic mean flow in its own right. This view will be especially helpful when we turn to the mean Lagrangian drift of narrow-banded wave packets. However, for completeness, we will use this new general framework to compute the mean Lagrangian drift for linear waves in the following subsections.
2.2. Monochromatic waves
We start with the classical example of a linear deep-water monochromatic wave with wavenumber $k$
and constant amplitude
$k$
and constant amplitude $A$
where the non-dimensional steepness
$A$
where the non-dimensional steepness $Ak$
is assumed to be small. Following the method of (Salmon Reference Salmon2020, § 1), we assume a wavelike solution for
$Ak$
is assumed to be small. Following the method of (Salmon Reference Salmon2020, § 1), we assume a wavelike solution for $x$
and
$x$
and $y$
after expanding about a hydrostatic state of rest (
$y$
after expanding about a hydrostatic state of rest ( $x=\alpha$
,
$x=\alpha$
, $y=\beta$
,
$y=\beta$
, $p = -g\beta$
)
$p = -g\beta$
)
 \begin{align} x(\alpha ,\beta ,\tau ) &= \alpha - A e^{k \beta } \sin (k\alpha - \omega \tau ), \\[-12pt]\nonumber \end{align}
 \begin{align} y(\alpha ,\beta ,\tau ) &= \beta + Ae^{k \beta }\cos (k\alpha - \omega \tau ), \\[-12pt]\nonumber \end{align}
 \begin{align} p(\beta ) &= -g \beta , \end{align}
where $\omega ^2 = g k$
is the linear deep-water dispersion relation determined by substituting (2.19)–(2.21) into the Euler (2.7)–(2.8). These simple circular trajectories are in fact exact solutions to the Euler equations known as Gerstner (Reference Gerstner1802) waves. However, these waves are not irrotational, which can be seen by computing their vorticity using (2.9). From (2.18), we see that irrotational flow requires that the curl of the mean Lagrangian drift be equal to the curl of the mean pseudomomentum. Computing the pseudomomentum of (2.19)–(2.20) yields only a horizontal component
$\omega ^2 = g k$
is the linear deep-water dispersion relation determined by substituting (2.19)–(2.21) into the Euler (2.7)–(2.8). These simple circular trajectories are in fact exact solutions to the Euler equations known as Gerstner (Reference Gerstner1802) waves. However, these waves are not irrotational, which can be seen by computing their vorticity using (2.9). From (2.18), we see that irrotational flow requires that the curl of the mean Lagrangian drift be equal to the curl of the mean pseudomomentum. Computing the pseudomomentum of (2.19)–(2.20) yields only a horizontal component
 \begin{equation} \mathrm{p}^{(x)} = -(\xi _\tau \xi _\alpha + \zeta _\tau \zeta _\alpha ) = A^2 k \omega e^{2 k \beta }, \end{equation}
that varies only with depth. Taking the mean to be a long time average following a fixed particle, from (2.18) we require
 \begin{equation} \frac {{\partial } \langle y_\tau \rangle }{{\partial } \alpha } - \frac {{\partial } \langle x_\tau \rangle }{{\partial } \beta } = -\frac {{\partial } \langle \mathrm{p}^{(x)}\rangle }{{\partial } \beta } = -2 A^2 k^2 \omega e^{2 k \beta }. \end{equation}
On physical grounds we can assume there is no mean vertical velocity, so that the solution to (2.23) is
 \begin{equation} \langle x_\tau \rangle = A^2 k \omega e^{2 k \beta }, \end{equation}
where the arbitrary constant of integration can be removed in the frame where the velocity of fluid at depth vanishes. This the classical Stokes drift. We reproduce it here as an example of our general method but also because it shows how the second-order mean flow is constrained by first-order orbital motion, due to the pseudomomentum being a quadratic quantity. This carries to higher-order corrections as well; since the particle displacements in surface gravity wave fields $(\xi ,\zeta )$
are always first-order quantities or higher, one needs only to constrain trajectories valid to order
$(\xi ,\zeta )$
are always first-order quantities or higher, one needs only to constrain trajectories valid to order $n$
to constrain the drift to order
$n$
to constrain the drift to order $n+1$
.
$n+1$
.
2.3. Multiple waves – lowest-order theory
Following Pierson (Reference Pierson1961), if we instead consider a discrete spectrum of $N$
deep-water plane waves travelling in the same direction, to first order we have
$N$
deep-water plane waves travelling in the same direction, to first order we have
 \begin{align} x &= \alpha - \sum _{n=1}^N A_n e^{k_n \beta } \sin (k_n\alpha - \omega _n \tau + \varphi _n), \\[-12pt]\nonumber \end{align}
 \begin{align} y &= \beta + \sum _{n=1}^N A_n e^{k_n \beta } \cos (k_n \alpha - \omega _n \tau + \varphi _n), \end{align}
where $A_n$
,
$A_n$
, $k_n$
,
$k_n$
, $\omega _n$
and
$\omega _n$
and $\varphi _n$
are the amplitude, wavenumber, frequency and initial phase of each wave component, respectively. It is assumed that each wave’s steepness
$\varphi _n$
are the amplitude, wavenumber, frequency and initial phase of each wave component, respectively. It is assumed that each wave’s steepness $A_n k_n$
is small and, importantly for this analysis, constant. The horizontal component of the pseudomomentum is given by products of sums, but taking the mean to be a long time average following a fixed particle, we have
$A_n k_n$
is small and, importantly for this analysis, constant. The horizontal component of the pseudomomentum is given by products of sums, but taking the mean to be a long time average following a fixed particle, we have
 \begin{equation} \langle \mathrm{p}^{(x)}\rangle =-\langle \xi _\tau \xi _\alpha + \zeta _\tau \zeta _\alpha \rangle = \sum _{n=1}^N A_n^2 k_n \omega _n e^{2 k_n \beta }, \end{equation}
where any cross-terms vanish in the time mean due to to the fact that $A_n$
,
$A_n$
, $k_n$
,
$k_n$
, $\omega _n$
and
$\omega _n$
and $\varphi _n$
are constant. From (2.18),
$\varphi _n$
are constant. From (2.18),
 \begin{equation} \frac {{\partial } \langle y_\tau \rangle }{{\partial } \alpha } - \frac {{\partial } \langle x_\tau \rangle }{{\partial } \beta } = -\frac {{\partial } \langle \mathrm{p}^{(x)} \rangle }{{\partial } \beta } \ = -\sum _{n=1}^N 2A_n^2 k_n^2 \omega _n e^{2 k_n \beta }. \end{equation}
Once again, the only physically valid solution is balanced by $\langle x_\tau \rangle$
, so that
$\langle x_\tau \rangle$
, so that
 \begin{equation} \langle x_\tau \rangle = \sum _{n=1}^N A_n^2 k_n \omega _n e^{2 k_n \beta }, \end{equation}
where the constant of integration vanishes in the frame where the fluid interior is at rest. We see that according to lowest-order theory, the total mean Lagrangian drift for a wave field is a simple linear sum of the individual drifts of each wave component. While the full second-order particle trajectory solutions contain bounded second-order harmonics (Pierson Reference Pierson1961; Nouguier, Chapron & Guérin Reference Nouguier, Chapron and Guérin2015), which can be interpreted as local fluctuations to the mean Lagrangian drift, these terms are fully oscillatory and do not contribute to the long time transport regardless of how the initial phases $\varphi _n$
are tuned. We will henceforth refer to this as the linear theory, on account of its additive property, although this should not be confused with linearity with respect to wave steepness. From this theory, the effect of local steepness fluctuations to the mean Lagrangian drift is symmetric; any local increases during constructive interference are cancelled by local decreases during destructive interference. We would therefore expect the total transport of a passing wave packet, expressed as a sum of plane waves, to be similarly invariant to local wave focusing. In the following section, we investigate the Lagrangian transport of focusing wave packets, presenting numerically simulated particle trajectories alongside laboratory data.
$\varphi _n$
are tuned. We will henceforth refer to this as the linear theory, on account of its additive property, although this should not be confused with linearity with respect to wave steepness. From this theory, the effect of local steepness fluctuations to the mean Lagrangian drift is symmetric; any local increases during constructive interference are cancelled by local decreases during destructive interference. We would therefore expect the total transport of a passing wave packet, expressed as a sum of plane waves, to be similarly invariant to local wave focusing. In the following section, we investigate the Lagrangian transport of focusing wave packets, presenting numerically simulated particle trajectories alongside laboratory data.
3. Lagrangian transport due to focusing wave packets
We now narrow our scope to spatially compact focusing wave packets. First, we define these packets and provide a linear prediction of their induced surface Lagrangian transport. Next, we introduce the fully nonlinear solver used to simulate the Lagrangian trajectories of surface particles, and show the results of these simulations for a range of packet parameter space. Finally, we compare the results of the simulations and laboratory experiments against the predictions of linear theory.
3.1. Packet initialisation
We define our packets as in Rapp & Melville (Reference Rapp and Melville1990), Drazen, Melville & Lenain (Reference Drazen, Melville and Lenain2008) and Sinnis et al. (Reference Seitz, Freilich and Pizzo2021) to focus according to linear theory at a prescribed space and time
 \begin{equation} \eta (x,t) = \sum _{n=1}^N A_n \cos (k_n (x - x_{\!f}) - \omega _n (t - t_{\!f})), \end{equation}
where $\eta (x,t)$
is the Eulerian free surface displacement,
$\eta (x,t)$
is the Eulerian free surface displacement, $A_n$
is the amplitude of each discrete wave,
$A_n$
is the amplitude of each discrete wave, $k_n$
and
$k_n$
and $\omega _n$
represent the respective wavenumber and frequency of each component, both positive as all wave components travel to the right, and
$\omega _n$
represent the respective wavenumber and frequency of each component, both positive as all wave components travel to the right, and $x_{\!f}$
and
$x_{\!f}$
and $t_{\!f}$
denote the focusing location and time respectively according to linear theory. We consider a uniformly distributed spectrum in frequency space, so that our frequencies can be expressed as
$t_{\!f}$
denote the focusing location and time respectively according to linear theory. We consider a uniformly distributed spectrum in frequency space, so that our frequencies can be expressed as
 \begin{equation} \omega _n = \omega _c \left(1 + \varDelta \left(\frac {n}{N} - \frac {1}{2}\right)\right)\!, \end{equation}
where $\omega _c$
is the central frequency (so that
$\omega _c$
is the central frequency (so that $k_c = \omega _c^2/g$
is the central wavenumber) and
$k_c = \omega _c^2/g$
is the central wavenumber) and $\varDelta$
is the non-dimensional bandwidth equivalent to
$\varDelta$
is the non-dimensional bandwidth equivalent to $(\omega _N - \omega _1)/\omega _c$
which sets the time and space scales of the focusing event and must be less than
$(\omega _N - \omega _1)/\omega _c$
which sets the time and space scales of the focusing event and must be less than $2$
to ensure positive frequencies. In addition, as the slope of waves is an indicator of their nonlinearity, we wish to define the amplitudes
$2$
to ensure positive frequencies. In addition, as the slope of waves is an indicator of their nonlinearity, we wish to define the amplitudes $A_n$
such that at focusing, the linear prediction of the maximum slope equals some prescribed value
$A_n$
such that at focusing, the linear prediction of the maximum slope equals some prescribed value $S$
. Therefore, we define
$S$
. Therefore, we define
 \begin{equation} S = \sum _{n=1}^N A_n k_n . \end{equation}
Thus, given the linear deep-water dispersion relationship $\omega _n^2 = g k_n$
, we can determine the values of
$\omega _n^2 = g k_n$
, we can determine the values of $A_n$
, assuming the slope of each mode is equal following Drazen et al. (Reference Drazen, Melville and Lenain2008) (i.e.
$A_n$
, assuming the slope of each mode is equal following Drazen et al. (Reference Drazen, Melville and Lenain2008) (i.e. $A_n = S/(Nk_n)$
). Placed in this formulation, the wave packets we consider are primarily functions of two independent variables,
$A_n = S/(Nk_n)$
). Placed in this formulation, the wave packets we consider are primarily functions of two independent variables, $S$
and
$S$
and $\varDelta$
, which will be used as our parameter space.
$\varDelta$
, which will be used as our parameter space.
The linear prediction of the surface mean Lagrangian drift is given by a simple sum of the lowest-order contributions (2.29)
 \begin{equation} \langle x_\tau \rangle \big |_{\beta =0} = \sum _n^N A_n^2 k_n \omega _n = \sum _n^N \frac {S^2}{N^2} \frac {\omega _n}{k_n} . \end{equation}
Based solely on (3.4), the surface mean Lagrangian drift scales as $ {1}/{N}$
, which implies that a packet with more waves experiences less drift, despite the fact that
$ {1}/{N}$
, which implies that a packet with more waves experiences less drift, despite the fact that $N$
simply represents the spectral resolution of the packet, whose form converges as
$N$
simply represents the spectral resolution of the packet, whose form converges as $N \rightarrow \infty$
. This is due to the fact that the temporal periodicity of (3.1) is given by
$N \rightarrow \infty$
. This is due to the fact that the temporal periodicity of (3.1) is given by
 \begin{equation} T_{\!p} = \frac {2\pi N}{\omega _c \varDelta }, \end{equation}
so that as $N$
increases, the time between subsequent packets also increases. Since what we are after is not the mean Lagrangian drift itself, which according to (2.29) is the same for all particles at all times since it treats the packet as a sum of monochromatic plane waves, we instead compute the total linear surface Lagrangian transport
$N$
increases, the time between subsequent packets also increases. Since what we are after is not the mean Lagrangian drift itself, which according to (2.29) is the same for all particles at all times since it treats the packet as a sum of monochromatic plane waves, we instead compute the total linear surface Lagrangian transport $\delta x_{\textit{lin}}$
after a single packet has passed. This is done by integrating (3.4) in time over the temporal periodicity of the packet (3.5)
$\delta x_{\textit{lin}}$
after a single packet has passed. This is done by integrating (3.4) in time over the temporal periodicity of the packet (3.5)
 \begin{equation} \delta x_{\textit{lin}} = \int _0^{T_{\!p}} \langle x_\tau \rangle \, {\textrm {d}}\tau \big |_{\beta =0}= \langle x_\tau \rangle T_{\!p} \big |_{\beta =0}= \frac {2\pi S^2}{\omega _c \varDelta } \left(\frac {1}{N}\sum _n^N \frac {\omega _n}{k_n} \right)\!. \end{equation}
We see that the linear prediction of the total surface Lagrangian transport should scale with $S^2$
as one should expect for the lowest-order theory. The transport scaling inversely with
$S^2$
as one should expect for the lowest-order theory. The transport scaling inversely with $\varDelta$
should also be expected as the packet width in physical space is inversely proportional to its width in wavenumber space (Sinnis et al. Reference Seitz, Freilich and Pizzo2021). The last term represents a spectrally weighted phase speed. For
$\varDelta$
should also be expected as the packet width in physical space is inversely proportional to its width in wavenumber space (Sinnis et al. Reference Seitz, Freilich and Pizzo2021). The last term represents a spectrally weighted phase speed. For $N$
large, (3.6) can be approximated in closed form from (3.2) as
$N$
large, (3.6) can be approximated in closed form from (3.2) as
 \begin{equation} \delta x_{\textit{lin}} \approx \frac {2 \pi S^2}{k_c} f(\varDelta ), \quad f(\varDelta ) = \frac {1}{\varDelta ^2}\ln \left(\frac {1 + \varDelta /2}{1 - \varDelta /2} \right)\!, \end{equation}
where $f(\Delta )$
represents the linear bandwidth dependence on the total transport, found by approximating the sum in (3.6) as an integral. While this full expression is slightly more complicated than the heuristic argument given above,
$f(\Delta )$
represents the linear bandwidth dependence on the total transport, found by approximating the sum in (3.6) as an integral. While this full expression is slightly more complicated than the heuristic argument given above, $f(\Delta )$
is well approximated by
$f(\Delta )$
is well approximated by $\Delta ^{-1}$
when
$\Delta ^{-1}$
when $\varDelta$
is small.
$\varDelta$
is small.
3.2. Numerical simulations of Lagrangian trajectories
To simulate the Lagrangian trajectories of surface particles within these packets, we employ a fully nonlinear mixed Eulerian–Lagrangian potential flow solver (Dold Reference Dold1992). Originally developed by Longuet-Higgins & Cokelet (Reference Longuet-Higgins and Cokelet1976), this method takes advantage of the fact that, at a fixed time, the Eulerian and Lagrangian velocities are equal since a particle occupies a single fixed location at a fixed time. Because solutions to Laplace’s (2.1) are uniquely determined by the boundary conditions, only the surface needs to be simulated, assuming a constant or infinite depth and a periodic domain. By initialising Lagrangian particles with initial positions $(x_0,y_0)$
and velocity potential
$(x_0,y_0)$
and velocity potential $\phi _0$
, this solver computes the gradient of
$\phi _0$
, this solver computes the gradient of $\phi$
at the surface given its value via Cauchy’s integral theorem at each time step. This allows for the particle positions
$\phi$
at the surface given its value via Cauchy’s integral theorem at each time step. This allows for the particle positions $(x,y)$
to evolve via the pathline (2.4), with the velocity potential evolving according to Bernoulli’s equation at the free surface (2.3). Because Lagrangian particles naturally cluster at wave crests where the spatial curvature is strongest, the resolution of this method is naturally adaptive, and numerous studies (Dommermuth et al. Reference Dommermuth, Yue, Lin, Rapp, Chan and Melville1988; Skyner Reference Sinnis, Grare, Lenain and Pizzo1996) have validated the accuracy and validity of this numerical method.
$(x,y)$
to evolve via the pathline (2.4), with the velocity potential evolving according to Bernoulli’s equation at the free surface (2.3). Because Lagrangian particles naturally cluster at wave crests where the spatial curvature is strongest, the resolution of this method is naturally adaptive, and numerous studies (Dommermuth et al. Reference Dommermuth, Yue, Lin, Rapp, Chan and Melville1988; Skyner Reference Sinnis, Grare, Lenain and Pizzo1996) have validated the accuracy and validity of this numerical method.
For our simulations, we chose a central wave frequency of $1$
Hz, so that
$1$
Hz, so that $\omega _c = 2\pi$
rad s−1 and
$\omega _c = 2\pi$
rad s−1 and $k_c= (2\pi )^2/g$
rad m−1. The domain length was chosen to be
$k_c= (2\pi )^2/g$
rad m−1. The domain length was chosen to be $L = 150$
m, long enough so that the entire packet could fully pass over a large enough collection of particles to obtain an unambiguous measure of total Lagrangian transport before any signal wrapped around due to the periodicity of the domain. To fully resolve the free surface, we systematically increased the number of Lagrangian particles used until convergence was reached at 2048 particles, or around 20 per central wavelength. The depth of the water is taken to be infinitely deep, and the packets were initialised to start
$L = 150$
m, long enough so that the entire packet could fully pass over a large enough collection of particles to obtain an unambiguous measure of total Lagrangian transport before any signal wrapped around due to the periodicity of the domain. To fully resolve the free surface, we systematically increased the number of Lagrangian particles used until convergence was reached at 2048 particles, or around 20 per central wavelength. The depth of the water is taken to be infinitely deep, and the packets were initialised to start $20$
m away from the prescribed focusing location so that there were sufficient particles within the focusing region that both started and ended at rest. We defined the linear prediction of the focusing time as
$20$
m away from the prescribed focusing location so that there were sufficient particles within the focusing region that both started and ended at rest. We defined the linear prediction of the focusing time as $t_{\!f} = x_{\!f}/c_g$
, where
$t_{\!f} = x_{\!f}/c_g$
, where $c_g = ({1}/{2})\sqrt {g/k_c}$
is the central group velocity according to linear theory. Lastly, we chose to use
$c_g = ({1}/{2})\sqrt {g/k_c}$
is the central group velocity according to linear theory. Lastly, we chose to use $N=1000$
wave modes so that the spectral resolution is sufficiently high to converge the physical shape of the packet.
$N=1000$
wave modes so that the spectral resolution is sufficiently high to converge the physical shape of the packet.
The procedure for simulating these packets is as follows. First, we initialise the horizontal positions $x_0$
to be evenly spaced along the domain. Then, using (3.1), the vertical initial positions
$x_0$
to be evenly spaced along the domain. Then, using (3.1), the vertical initial positions $y_0$
are found for prescribed values of
$y_0$
are found for prescribed values of $S$
and
$S$
and $\varDelta$
. To ensure only one packet is used and that the domain is totally periodic, a windowing function is applied to
$\varDelta$
. To ensure only one packet is used and that the domain is totally periodic, a windowing function is applied to $y_0$
with minimal energy loss (less than one part in 100). The initial velocity potential is found according to linear theory by performing a Fourier transform on the windowed
$y_0$
with minimal energy loss (less than one part in 100). The initial velocity potential is found according to linear theory by performing a Fourier transform on the windowed $y_0$
, multiplying each Fourier amplitude by
$y_0$
, multiplying each Fourier amplitude by $\omega _n/k_n$
, and performing an inverse transform. The simulations were repeated for a parameter space spanning
$\omega _n/k_n$
, and performing an inverse transform. The simulations were repeated for a parameter space spanning $\varDelta = 0.3$
, incremented by
$\varDelta = 0.3$
, incremented by $0.1$
until
$0.1$
until $\varDelta = 1.3$
, and
$\varDelta = 1.3$
, and $S = 0.05$
, incremented by
$S = 0.05$
, incremented by $0.02$
until the packet broke, which agreed well with the results of Pizzo & Melville (Reference Pizzo and Wagner2019); see also Pizzo et al. (Reference Pizzo and Melville2021), who numerically investigated the breaking threshold
$0.02$
until the packet broke, which agreed well with the results of Pizzo & Melville (Reference Pizzo and Wagner2019); see also Pizzo et al. (Reference Pizzo and Melville2021), who numerically investigated the breaking threshold $S_*$
of these same packets as a function of bandwidth. To improve parameter space resolution near
$S_*$
of these same packets as a function of bandwidth. To improve parameter space resolution near $S_*$
, we ran additional simulations near this threshold.
$S_*$
, we ran additional simulations near this threshold.
Figure 1 shows a typical output of the surface particle trajectories during one such focusing event with bandwidth $\varDelta = 0.8$
and linear prediction of maximum slope at focusing
$\varDelta = 0.8$
and linear prediction of maximum slope at focusing $S = 0.27$
. For particles far downstream and upstream of focusing, represented by the blue and green curves respectively, their trajectories evolve gradually as the packet passes over. Their measured total transport
$S = 0.27$
. For particles far downstream and upstream of focusing, represented by the blue and green curves respectively, their trajectories evolve gradually as the packet passes over. Their measured total transport $\delta x$
, represented by the difference from their final and initial positions, mostly follows linear theory (3.6). In contrast, for the particles at or near the focusing location, highlighted by the red curve, the transport occurs in one short burst as the focused packet passes over, well surpassing the predictions of linear theory and violating the supposed spatial invariance of the transport. For each particle, the total Lagrangian transport
$\delta x$
, represented by the difference from their final and initial positions, mostly follows linear theory (3.6). In contrast, for the particles at or near the focusing location, highlighted by the red curve, the transport occurs in one short burst as the focused packet passes over, well surpassing the predictions of linear theory and violating the supposed spatial invariance of the transport. For each particle, the total Lagrangian transport $\delta x$
is computed by taking the horizontal position averaged over the final two seconds of the simulation, roughly two central wave periods, and subtracting from it the particle’s fixed initial position
$\delta x$
is computed by taking the horizontal position averaged over the final two seconds of the simulation, roughly two central wave periods, and subtracting from it the particle’s fixed initial position $x_0$
. Both here and for the rest of this paper, we only show results for particles that began and ended at rest (i.e. they experienced the full packet passing) so that total transport
$x_0$
. Both here and for the rest of this paper, we only show results for particles that began and ended at rest (i.e. they experienced the full packet passing) so that total transport $\delta x$
is unambiguous.
$\delta x$
is unambiguous.
Surface particle trajectories in a focusing wave packet with $\varDelta = 0.8$
and
$\varDelta = 0.8$
and $S = 0.27$
. In panel
$S = 0.27$
. In panel $(a)$
, the vertical elevation of individual fluid particles is plotted as a function of time. Each curve represents a different particle, labelled by its initial horizontal distance from the focusing region
$(a)$
, the vertical elevation of individual fluid particles is plotted as a function of time. Each curve represents a different particle, labelled by its initial horizontal distance from the focusing region $(x_0 - x_{\!f})$
, normalised by the central wavenumber
$(x_0 - x_{\!f})$
, normalised by the central wavenumber $k_c$
, as shown on the vertical axis. The coloured lines represent particles downstream of focusing (blue), at focusing (red) and upstream of focusing (green). Likewise, on the right, panels (b,c,d) show the physical particle trajectories of these downstream, at focusing, and upstream particles respectively, normalised by
$k_c$
, as shown on the vertical axis. The coloured lines represent particles downstream of focusing (blue), at focusing (red) and upstream of focusing (green). Likewise, on the right, panels (b,c,d) show the physical particle trajectories of these downstream, at focusing, and upstream particles respectively, normalised by $k_c$
. Note that the total transport during focusing (red) is much greater than that away from focusing, contrary to linear theory (3.6) (dashed line) which states that all particles should experience the same transport.
$k_c$
. Note that the total transport during focusing (red) is much greater than that away from focusing, contrary to linear theory (3.6) (dashed line) which states that all particles should experience the same transport.

The total Lagrangian transport $\delta x$
of surface particles as a function of their initial distance from the linear prediction of maximum focusing
$\delta x$
of surface particles as a function of their initial distance from the linear prediction of maximum focusing $(x_0 - x_{\!f})$
, normalised by the central wavenumber
$(x_0 - x_{\!f})$
, normalised by the central wavenumber $k_c$
for the same simulation as in figure 1,
$k_c$
for the same simulation as in figure 1, $\varDelta = 0.8$
and
$\varDelta = 0.8$
and $S = 0.27$
. The normalised linear prediction of the total transport
$S = 0.27$
. The normalised linear prediction of the total transport $k_c \delta x_{\textit{lin}}$
(3.6), constant in space, is shown in red.
$k_c \delta x_{\textit{lin}}$
(3.6), constant in space, is shown in red.

Figure 2 shows the computed total surface Lagrangian transport $\delta x$
as a function of its initial position relative to the linear focusing prediction, both normalised by the central wavenumber
$\delta x$
as a function of its initial position relative to the linear focusing prediction, both normalised by the central wavenumber $k_c$
for the same simulation as in figure 1. Plotted also is
$k_c$
for the same simulation as in figure 1. Plotted also is $\delta x_{\textit{lin}}$
, normalised by
$\delta x_{\textit{lin}}$
, normalised by $k_c$
, constant for each particle. From figure 2, we see a strong spatial dependence of the total Lagrangian transport, with a maximum transport 75 % higher than linear theory predicts. At larger values of
$k_c$
, constant for each particle. From figure 2, we see a strong spatial dependence of the total Lagrangian transport, with a maximum transport 75 % higher than linear theory predicts. At larger values of $\varDelta$
, where the physical packet width at focusing is smaller, the maximum transport was even found to be up to double that of linear theory. These are surprising results as it might be expected that any higher-order corrections to linear theory would be necessarily small. Here, we show that these corrections are comparable in magnitude to the linear prediction and exhibit a strong spatial dependence. In addition to the general increase around the focusing location, all simulations have oscillations in their transport curve near focusing with a spatial periodicity that matches the wavelength of the central wave. To compare these results with laboratory experiments, we also introduce a measure of the mean surface transport over the focusing region following Sinnis et al. (Reference Seitz, Freilich and Pizzo2021),
$\varDelta$
, where the physical packet width at focusing is smaller, the maximum transport was even found to be up to double that of linear theory. These are surprising results as it might be expected that any higher-order corrections to linear theory would be necessarily small. Here, we show that these corrections are comparable in magnitude to the linear prediction and exhibit a strong spatial dependence. In addition to the general increase around the focusing location, all simulations have oscillations in their transport curve near focusing with a spatial periodicity that matches the wavelength of the central wave. To compare these results with laboratory experiments, we also introduce a measure of the mean surface transport over the focusing region following Sinnis et al. (Reference Seitz, Freilich and Pizzo2021),
 \begin{equation} \langle \delta x \rangle = \frac {1}{x_{02}-x_{01}}\int _{x_{01}}^{x_{02}} \delta x \, {\textrm {d}} x_{0}, \end{equation}
where in our study we define $x_{01}$
and
$x_{01}$
and $x_{02}$
as the first and last points, respectively, where the deviation of the transport from linear theory
$x_{02}$
as the first and last points, respectively, where the deviation of the transport from linear theory $(\delta x - \delta x_{\textit{lin}})$
exceeds 10 % of its maximum value. In this case the mean transport is
$(\delta x - \delta x_{\textit{lin}})$
exceeds 10 % of its maximum value. In this case the mean transport is $23.6\,\%$
higher than linear theory. Although this particular definition of the mean transport is by no means unique, it was chosen to best match the approach used in Sinnis et al. (Reference Seitz, Freilich and Pizzo2021).
$23.6\,\%$
higher than linear theory. Although this particular definition of the mean transport is by no means unique, it was chosen to best match the approach used in Sinnis et al. (Reference Seitz, Freilich and Pizzo2021).
While these simulations provide the first detailed account of the increased transport of steep non-breaking focusing wave packets, this study was motivated by earlier laboratory experiments (Lenain et al. Reference Lenain, Pizzo and Melville2019; Sinnis et al. Reference Seitz, Freilich and Pizzo2021). These wave tank experiments measured the spatially varying surface transport in primarily breaking focusing wave packets described by (3.1), with several steep non-breaking cases included for comparison. They found that wave breaking produces a large local increase to the surface transport. Wave breaking, in this case, breaks both the translational symmetry of the system and the transport in an obvious way. However, this symmetry breaking is also present for non-breaking focusing waves, allowing for a spatially dependent non-breaking transport which can be seen for example in Sinnis et al. (Reference Seitz, Freilich and Pizzo2021) figure 5.
Figure 3 $(a)$
compares the mean surface transport from laboratory experiments and simulations as a function of
$(a)$
compares the mean surface transport from laboratory experiments and simulations as a function of $S$
, normalised by the central wavenumber
$S$
, normalised by the central wavenumber $k_c$
and linear bandwidth dependence
$k_c$
and linear bandwidth dependence $f(\Delta )$
so that the linear theory (3.7) coincides for both cases. For the laboratory experiments, conducted in a finite-depth tank of mean depth
$f(\Delta )$
so that the linear theory (3.7) coincides for both cases. For the laboratory experiments, conducted in a finite-depth tank of mean depth $\ell = 0.5$
m, this requires using the full dispersion relationship
$\ell = 0.5$
m, this requires using the full dispersion relationship $\omega ^2 = g k \tanh (k \ell )$
to numerically compute
$\omega ^2 = g k \tanh (k \ell )$
to numerically compute $f(\Delta )$
. Despite these differences, a clear trend emerges: the mean surface transport exceeds the predictions of linear theory as
$f(\Delta )$
. Despite these differences, a clear trend emerges: the mean surface transport exceeds the predictions of linear theory as $S$
increases. To better visualise these increases, figure 3(b) plots the same data instead as a percentage deviation from linear theory, revealing that these enhancements are of comparable magnitude to the linear theory itself.
$S$
increases. To better visualise these increases, figure 3(b) plots the same data instead as a percentage deviation from linear theory, revealing that these enhancements are of comparable magnitude to the linear theory itself.
Mean surface transport $\langle \delta x \rangle$
as a function of the linear prediction of maximum wave slope
$\langle \delta x \rangle$
as a function of the linear prediction of maximum wave slope $S$
. Panel
$S$
. Panel $(a)$
shows the mean transport normalised by the central wavenumber
$(a)$
shows the mean transport normalised by the central wavenumber $k_c$
and linear bandwidth dependence
$k_c$
and linear bandwidth dependence $f(\Delta )$
so that the prediction of linear theory (3.6) (red) collapses to a single curve for both the simulation and laboratory parameters. A polynomial fit of the discrete simulation points is shown in green. Panel
$f(\Delta )$
so that the prediction of linear theory (3.6) (red) collapses to a single curve for both the simulation and laboratory parameters. A polynomial fit of the discrete simulation points is shown in green. Panel $(b)$
shows the same data plotted as a percentage increase from linear theory.
$(b)$
shows the same data plotted as a percentage increase from linear theory.

Percentage increases of the maximum $(a)$
and mean
$(a)$
and mean $(b)$
surface Lagrangian transport relative to linear theory (3.6) for numerically simulated focusing wave packets as a function of parameter space
$(b)$
surface Lagrangian transport relative to linear theory (3.6) for numerically simulated focusing wave packets as a function of parameter space $(S,\varDelta )$
. Discrete simulation runs are shown via coloured markers, with interpolated values in between. Note the two distinct colour bar scalings for panels (a,b). The red line outlining the parameter space represents the breaking slope threshold numerically determined by Pizzo et al. (Reference Pizzo and Melville2021) which we found to be consistent with our simulations.
$(S,\varDelta )$
. Discrete simulation runs are shown via coloured markers, with interpolated values in between. Note the two distinct colour bar scalings for panels (a,b). The red line outlining the parameter space represents the breaking slope threshold numerically determined by Pizzo et al. (Reference Pizzo and Melville2021) which we found to be consistent with our simulations.

The enhancements of the maximum and mean surface transport relative to linear theory for all simulations are shown in figure 4 as discrete points, with interpolated values in between. The dashed red line indicates the breaking slope threshold $S_*$
numerically determined by Pizzo et al. (Reference Pizzo and Melville2021) for equivalently defined deep-water packets. Individual particles, shown in figure 4
$S_*$
numerically determined by Pizzo et al. (Reference Pizzo and Melville2021) for equivalently defined deep-water packets. Individual particles, shown in figure 4 $(a)$
, can be transported up to twice as far as linear theory predicts, with the mean transport over the focusing region surpassing linear theory by up to
$(a)$
, can be transported up to twice as far as linear theory predicts, with the mean transport over the focusing region surpassing linear theory by up to $30\,\%$
as shown in figure 4
$30\,\%$
as shown in figure 4 $(b)$
. Although the enhancements to the surface Lagrangian transport primarily scale with increasing
$(b)$
. Although the enhancements to the surface Lagrangian transport primarily scale with increasing $S$
, there is also a noticeable
$S$
, there is also a noticeable $\varDelta$
dependence close to the breaking threshold. To investigate why these spatially varying enhancements occur when waves steepen, we next turn to a theoretical derivation of the local mean Lagrangian drift in deep-water narrow-banded waves.
$\varDelta$
dependence close to the breaking threshold. To investigate why these spatially varying enhancements occur when waves steepen, we next turn to a theoretical derivation of the local mean Lagrangian drift in deep-water narrow-banded waves.
4. Wave packets in the Lagrangian frame
We begin by considering a unidirectional wave packet in infinitely deep water with a characteristic wavenumber $k_0$
and frequency
$k_0$
and frequency $\omega _0=\sqrt {g k_0}$
, and for simplicity normalise our units with new primed variables
$\omega _0=\sqrt {g k_0}$
, and for simplicity normalise our units with new primed variables
 \begin{equation} x' = k_0 x, \quad y' = k_0 y , \quad p' = \frac {\omega _0^2}{k_0^2} p , \quad \tau ' = \omega _0 \tau , \quad \alpha ' = k_0 \alpha , \quad \beta ' = k_0 \beta , \end{equation}
which we henceforth drop for clarity of presentation. Using $\epsilon$
as a small steepness parameter, analogous to
$\epsilon$
as a small steepness parameter, analogous to $S$
, we start with non-dimensionalised monochromatic waves
$S$
, we start with non-dimensionalised monochromatic waves
 \begin{align} x &= \alpha + \frac {1}{2}\big (i\epsilon {\mathcal{F}} e^{i \theta _0} e^{\beta } + \text{c.c.} \big ), \\[-12pt]\nonumber \end{align}
 \begin{align} y &= \beta + \frac {1}{2} \big (\epsilon {\mathcal{F}} e^{i \theta _0} e^{\beta } + \text{c.c.} \big ), \\[-12pt]\nonumber \end{align}
 \begin{align} p &= -\beta, \end{align}
where $\theta _0 = \alpha - \tau$
,
$\theta _0 = \alpha - \tau$
, $\mathcal{F}$
is an
$\mathcal{F}$
is an $O(1)$
non-dimensional complex amplitude and
$O(1)$
non-dimensional complex amplitude and $\text{c.c.}$
indicates the complex conjugate. At this order
$\text{c.c.}$
indicates the complex conjugate. At this order $\mathcal{F}$
is constant and the solutions represent monochromatic plane waves identical to (2.19)–(2.21). To account for the effects of finite bandwidth, we allow for this complex amplitude to vary slowly in space and time, so that
$\mathcal{F}$
is constant and the solutions represent monochromatic plane waves identical to (2.19)–(2.21). To account for the effects of finite bandwidth, we allow for this complex amplitude to vary slowly in space and time, so that ${\mathcal{F}} = {\mathcal{F}}({\mathcal{A}},T)$
where we have introduced the new slow variables
${\mathcal{F}} = {\mathcal{F}}({\mathcal{A}},T)$
where we have introduced the new slow variables
 \begin{equation} {\mathcal{A}} = \gamma \alpha, \quad T = \gamma \tau, \end{equation}
where $\gamma$
is another small parameter which is proportional to the normalised bandwidth
$\gamma$
is another small parameter which is proportional to the normalised bandwidth $\varDelta$
. We separate
$\varDelta$
. We separate $\gamma$
from
$\gamma$
from $\epsilon$
to show how finite steepness and bandwidth individually affect the solutions following the approach of van den Bremer & Taylor (Reference van den Bremer and Taylor2016), but assume both to be small parameters of the same asymptotic ordering so that a second-order quantity, for example, describes terms proportional to any of the following:
$\epsilon$
to show how finite steepness and bandwidth individually affect the solutions following the approach of van den Bremer & Taylor (Reference van den Bremer and Taylor2016), but assume both to be small parameters of the same asymptotic ordering so that a second-order quantity, for example, describes terms proportional to any of the following: $\epsilon ^2$
,
$\epsilon ^2$
, $\epsilon \gamma$
or
$\epsilon \gamma$
or $\gamma ^2$
. The general procedure for computing higher-order solutions is to expand
$\gamma ^2$
. The general procedure for computing higher-order solutions is to expand $x$
,
$x$
, $y$
and
$y$
and $p$
in a standard asymptotic series starting at second order
$p$
in a standard asymptotic series starting at second order
 \begin{align} x &= \alpha + \frac {1}{2}\big ( i \epsilon {\mathcal{F}} e^{i \theta _0} e^{\beta } + \text{c.c.} \big ) + {\sum _{n+m \geqslant 2}} \epsilon ^n \gamma ^m x^{(n,m)}(\alpha ,\beta ,\tau ,{\mathcal{A}},T), \\[-12pt]\nonumber \end{align}
 \begin{align} y &= \beta + \frac {1}{2} \big (\epsilon {\mathcal{F}} e^{i \theta _0} e^{\beta } + \text{c.c.} \big ) + {\sum _{n+m\geqslant 2}} \epsilon ^n \gamma ^m y^{(n,m)}(\alpha ,\beta ,\tau ,{\mathcal{A}},T), \\[-12pt]\nonumber \end{align}
 \begin{align} p &= -\beta + {\sum _{n+m\geqslant 2}} \epsilon ^n \gamma ^m p^{(n,m)}(\alpha ,\beta ,\tau ,{\mathcal{A}},T), \end{align}
where $n,m$
are non-negative integers. Inserting (4.6)–(4.8) into the Euler (2.7)–(2.8), the irrotational condition (2.10) and the continuity gauge choice
$n,m$
are non-negative integers. Inserting (4.6)–(4.8) into the Euler (2.7)–(2.8), the irrotational condition (2.10) and the continuity gauge choice ${\mathcal{J}} = 1$
, and grouping terms by powers of
${\mathcal{J}} = 1$
, and grouping terms by powers of $\epsilon$
and
$\epsilon$
and $\gamma$
, we obtain a set of linear equations at second order. Solving them along with the relevant boundary conditions yields
$\gamma$
, we obtain a set of linear equations at second order. Solving them along with the relevant boundary conditions yields
 \begin{align} x &= \alpha + \frac {1}{2}\big (\big [i\epsilon \mathcal{F} + \epsilon \gamma \beta \mathcal{F}_{A} \big ] e^{i \theta _0}e^\beta + \text{c.c.} \big ) + \epsilon ^2 e^{2\beta }|\mathcal{F}|^2 \tau , \\[-12pt]\nonumber \end{align}
 \begin{align} y &= \beta + \frac {1}{2}\big (\big [\epsilon \mathcal{F} -i \epsilon \gamma \beta \mathcal{F}_{A}\big ] e^{i \theta _0}e^\beta + \text{c.c.} \big ) + \frac {\epsilon ^2}{2} |\mathcal{F}|^2 e^{2 \beta }, \\[-12pt]\nonumber \end{align}
 \begin{align} p &= -\beta + \frac {1}{2}\big (\epsilon \gamma (i \mathcal{F}_A + 2i \mathcal{F}_T) e^{i \theta _0}e^\beta + \text{c.c.}\big ), \end{align}
where the oscillatory motion now no longer decays purely exponentially with depth, similar to what is found in the Eulerian frame for narrow-banded packets (Yuen & Lake Reference Vanneste and Young1975; Pizzo & Melville Reference Pizzo, Lenain, Rømcke, Ellingsen and Smeltzer2016). Just as with monochromatic waves, a second-order mean Lagrangian drift is required to enforce irrotational flow, although here its strength is set by the local squared magnitude of the packet envelope (van den Bremer & Taylor Reference van den Bremer and Taylor2016; Haney & Young Reference Haney and Young2017). The presence of the waves also raises the potential energy of the fluid, as seen in (4.10) through the Lagrangian-mean water level. The condition that pressure vanishes at the sea surface requires ${\mathcal{F}}_T +({1}/{2}){\mathcal{F}}_{\mathcal{A}} = 0$
which simply means that to lowest order the envelope translates with the non-dimensional linear group velocity, which in deep water is half of the phase velocity.
${\mathcal{F}}_T +({1}/{2}){\mathcal{F}}_{\mathcal{A}} = 0$
which simply means that to lowest order the envelope translates with the non-dimensional linear group velocity, which in deep water is half of the phase velocity.
As reported by Buldakov, Taylor & Taylor (Reference Buldakov, Taylor and Taylor2006) for monochromatic waves, directly continuing this asymptotic expansion to third order yields non-physical oscillatory terms in $x$
and
$x$
and $y$
which grow secularly in time. To obtain uniformly valid particle trajectories, Clamond (Reference Clamond2007) identified that the phase of the waves must be Doppler shifted by the mean Lagrangian drift, effectively renormalising the phase. This correction is necessary since two particles that are initially in phase (same
$y$
which grow secularly in time. To obtain uniformly valid particle trajectories, Clamond (Reference Clamond2007) identified that the phase of the waves must be Doppler shifted by the mean Lagrangian drift, effectively renormalising the phase. This correction is necessary since two particles that are initially in phase (same $\alpha$
, different
$\alpha$
, different $\beta$
) gradually move out of phase at long times due to the vertically sheared mean Lagrangian drift transporting one more than the other. To account for the effects of the vertically sheared mean Lagrangian drift in our system (4.9), and because our solutions must reduce to those of monochromatic waves when the envelope is constant in space, we adopt the same renormalisation of the carrier wave phase
$\beta$
) gradually move out of phase at long times due to the vertically sheared mean Lagrangian drift transporting one more than the other. To account for the effects of the vertically sheared mean Lagrangian drift in our system (4.9), and because our solutions must reduce to those of monochromatic waves when the envelope is constant in space, we adopt the same renormalisation of the carrier wave phase
 \begin{equation} \theta = \alpha - \tau + \epsilon ^2 e^{2\beta }|{\mathcal{F}}|^2 \tau . \end{equation}
At third order, this yields the solutions
 \begin{align} x = \alpha + \frac {1}{2} \left(\left[i\epsilon \mathcal{F} + \epsilon \gamma \beta \mathcal{F}_{{\mathcal{A}}} -\epsilon \gamma ^2 i \frac {\beta ^2}{2}\mathcal{F}_{{\mathcal{A}} {\mathcal{A}}} + \epsilon ^3 2i |\mathcal{F}|^2 \mathcal{F}e^{2\beta } \right ] e^{i \theta }e^\beta + \text{c.c.} \right) \nonumber \\ + \int \langle x_\tau \rangle \, {\textrm {d}} \tau , \\[-12pt]\nonumber \end{align}
 \begin{align} y = \beta + \frac {1}{2} \left( \left[\epsilon \mathcal{F} -i \epsilon \gamma \beta \mathcal{F}_{{\mathcal{A}}} -\epsilon \gamma ^2 \frac {\beta ^2}{2}\mathcal{F}_{{\mathcal{A}} {\mathcal{A}}} + \epsilon ^3|\mathcal{F}|^2 \mathcal{F}e^{2\beta }\right] e^{i \theta }e^\beta + \text{c.c.} \right) + \frac {\epsilon ^2}{2} |\mathcal{F}|^2 e^{2 \beta } \nonumber \\+ \epsilon ^2 \gamma \left(-\frac {i}{2} \left(\beta + \frac {1}{2}\right)({\mathcal{F}}_{\mathcal{A}} {\mathcal{F}}^* - {\mathcal{F}} {\mathcal{F}}^*_{\mathcal{A}}) \right) e^{2\beta } + \int \langle y_\tau \rangle \, {\textrm {d}} \tau , \\[-12pt]\nonumber \end{align}
 \begin{align} p = -\beta + \frac {1}{2}\bigg (\bigg (\epsilon \gamma (i \mathcal{F}_A + 2i \mathcal{F}_T) - \epsilon ^3|\mathcal{F}|^2\mathcal{F} e^{2\beta } - \frac {1}{4}\epsilon \gamma ^2 \mathcal{F}_{{\mathcal{A}}{\mathcal{A}}}\bigg )\bigg )e^{i \theta }e^\beta + \text{c.c.} \bigg ), \end{align}
where the mean Lagrangian drift, left in general form here, is formally derived in the following subsection. It is important to note that only the second-order mean terms are required to fully constrain the third-order orbital motion. From the condition of vanishing pressure at the free surface, and following Abrashkin & Pelinovsky (Reference Abrashkin and Pelinovsky2017) and Pizzo et al. (Reference Pizzo, Murray, Smith and Lenain2023), we derive an equation governing the evolution of the wave envelope
 \begin{equation} i\bigg ({\mathcal{F}}_T + \frac {1}{2}{\mathcal{F}}_{\mathcal{A}}\bigg ) - \Bigg (\gamma \frac {1}{8}{\mathcal{F}}_{{\mathcal{A}}{\mathcal{A}}} + \frac {\epsilon ^2}{\gamma }\frac {1}{2}|{\mathcal{F}}|^2 {\mathcal{F}}\Bigg ) = 0, \end{equation}
which reduces to the classical NLSE for narrow-banded irrotational waves when $\epsilon = \gamma$
(Zakharov Reference Yuen and Lake1968). This (4.16) has a number of conserved quantities in time. These are, as they are commonly referred to in the literature, the linear wave energy
$\epsilon = \gamma$
(Zakharov Reference Yuen and Lake1968). This (4.16) has a number of conserved quantities in time. These are, as they are commonly referred to in the literature, the linear wave energy
 \begin{equation} \mathcal{E} = \int |{\mathcal{F}}|^2 \, {\textrm {d}} {\mathcal{A}} , \end{equation}
the mean wavenumber
 \begin{equation} \mathcal{P} = \int i({\mathcal{F}}_{\mathcal{A}}{\mathcal{F}}^* - {\mathcal{F}} {\mathcal{F}}_{\mathcal{A}}^*) \, {\textrm {d}} {\mathcal{A}}, \end{equation}
and the Hamiltonian
 \begin{equation} H = \int \frac {1}{4}\epsilon ^2|{\mathcal{F}}|^4 - \frac {1}{8}\gamma ^2|{\mathcal{F}}_{\mathcal{A}}|^2 \, {\textrm {d}} {\mathcal{A}}, \end{equation}
which arise via Noether’s theorem from symmetries of the NLSE action to phase shifts, spatial translation and time translation, respectively (Sulem & Sulem Reference Stokes1999). The conservation of $\mathcal{E}$
ensures that
$\mathcal{E}$
ensures that $\mathcal{F}$
remains bounded for a finite packet, and therefore the third-order solutions (4.13)–(4.15) are free of secular amplitude growth.
$\mathcal{F}$
remains bounded for a finite packet, and therefore the third-order solutions (4.13)–(4.15) are free of secular amplitude growth.
From these conservation laws, it follows that the time integral of $|{\mathcal{F}}|^2$
is conserved to third order. The leading-order mean Lagrangian drift (4.9) therefore predicts that the net Lagrangian displacement
$|{\mathcal{F}}|^2$
is conserved to third order. The leading-order mean Lagrangian drift (4.9) therefore predicts that the net Lagrangian displacement $\delta x$
,
$\delta x$
,
 \begin{equation} \delta x = \epsilon ^2 e^{2\beta }\int |{\mathcal{F}}|^2 \, {\textrm {d}}\tau, \end{equation}
is conserved on fluid particles and independent of focusing (Deike et al. Reference Deike, Pizzo and Melville2017, Appendix B). Consequently, although the NLSE accounts for both dispersion and weak nonlinearities, second-order envelope-based predictions cannot explain the localised enhancement of the total Lagrangian transport observed during focusing events, necessitating higher-order predictive theories.
4.1. The mean Lagrangian drift of steep narrow-banded waves
Because we enforced a scale separation between the fast orbital motion and the slow envelope evolution through the small parameter $\gamma$
, the averaging operator
$\gamma$
, the averaging operator $\langle \boldsymbol{\cdot }\rangle$
is defined as a spatial convolution over an intermediate scale – large enough to remove the fast oscillations but small enough to retain slow envelope modulations. Spatial convolutions commute with the curl, so that from (2.18) we know that the curl of the mean Lagrangian drift is exactly equal to the curl of the mean pseudomomentum. The pseudomomentum itself is computed from products of the Lagrangian particle displacements
$\langle \boldsymbol{\cdot }\rangle$
is defined as a spatial convolution over an intermediate scale – large enough to remove the fast oscillations but small enough to retain slow envelope modulations. Spatial convolutions commute with the curl, so that from (2.18) we know that the curl of the mean Lagrangian drift is exactly equal to the curl of the mean pseudomomentum. The pseudomomentum itself is computed from products of the Lagrangian particle displacements $(\xi ,\zeta )$
whose leading-order contributions are
$(\xi ,\zeta )$
whose leading-order contributions are $O(\epsilon )$
; consequently, the fourth-order pseudomomentum is determined entirely by third-order terms. It is easy to check that the second-order mean terms in (4.9)–(4.10) only contribute to the curl of the mean pseudomomentum beginning at fifth order, so that only the oscillatory terms are required. Direct evaluation of this quantity from (4.13)–(4.14) shows that the mean Lagrangian drift must satisfy
$O(\epsilon )$
; consequently, the fourth-order pseudomomentum is determined entirely by third-order terms. It is easy to check that the second-order mean terms in (4.9)–(4.10) only contribute to the curl of the mean pseudomomentum beginning at fifth order, so that only the oscillatory terms are required. Direct evaluation of this quantity from (4.13)–(4.14) shows that the mean Lagrangian drift must satisfy
 \begin{align} &\frac {{\partial } \langle y_\tau \rangle }{{\partial } \alpha } - \frac {{\partial } \langle x_\tau \rangle }{{\partial } \beta }= -2 \epsilon ^2 |{\mathcal{F}}|^2 e^{2\beta } + \epsilon ^2\gamma \Big(2i (1 + \beta ) \big ({\mathcal{F}}_{\mathcal{A}} {\mathcal{F}}^* - {\mathcal{F}} {\mathcal{F}}_{\mathcal{A}}^*\big ) - i \big ({\mathcal{F}}_T{\mathcal{F}}^* - {\mathcal{F}} {\mathcal{F}}_T^*\big )\Big )e^{2\beta } \nonumber \\ &\quad - 8 \epsilon ^4 |{\mathcal{F}}|^4 e^{4\beta } + \epsilon ^2 \gamma ^2 \left(\left(\frac {1}{2} + \frac {5}{2}\beta + \beta ^2 \right)|{\mathcal{F}}|^2_{{\mathcal{A}}{\mathcal{A}}} e^{2\beta } - \big (4 + 10\beta + 4\beta ^2\big )|{\mathcal{F}}_{\mathcal{A}}|^2 e^{2\beta } \right)\!, \end{align}
where we have used the identity
 \begin{equation} \big ({\mathcal{F}}_{{\mathcal{A}}{\mathcal{A}}}{\mathcal{F}}^* + {\mathcal{F}} {\mathcal{F}}_{{\mathcal{A}}{\mathcal{A}}}^*\big )= |{\mathcal{F}}|^2_{{\mathcal{A}}{\mathcal{A}}} - 2|{\mathcal{F}}_{\mathcal{A}}|^2 , \end{equation}
to consolidate various terms. In its current form (4.21) is underdetermined since we cannot ignore ${\partial }_\alpha \langle y_\tau \rangle$
at higher orders. Although the fluid is incompressible, the mean Lagrangian velocity need not be divergence free (2.6). As pointed out by Vanneste & Young (Reference Sulem and Sulem2022), the fact that waves modify the potential energy of a fluid implies a changing centre of mass, which, when paired with the bottom boundary condition, requires a divergent Lagrangian-mean flow. We can account for this, however, in the Lagrangian-mean water level, whose value can be computed from the Jacobian (2.5) independently of the mean Lagrangian drift to fourth order from (4.13)–(4.14)
${\partial }_\alpha \langle y_\tau \rangle$
at higher orders. Although the fluid is incompressible, the mean Lagrangian velocity need not be divergence free (2.6). As pointed out by Vanneste & Young (Reference Sulem and Sulem2022), the fact that waves modify the potential energy of a fluid implies a changing centre of mass, which, when paired with the bottom boundary condition, requires a divergent Lagrangian-mean flow. We can account for this, however, in the Lagrangian-mean water level, whose value can be computed from the Jacobian (2.5) independently of the mean Lagrangian drift to fourth order from (4.13)–(4.14)
 \begin{align} \langle y\rangle _{\textit{MWL}} = \frac {1}{2}\epsilon ^2|{\mathcal{F}}|^2 e^{2\beta } - \frac {1}{2}\epsilon ^2 \gamma i \bigg (\beta + \frac {1}{2}\bigg )\big ({\mathcal{F}}_{{\mathcal{A}}}{\mathcal{F}}^* - {\mathcal{F}} {\mathcal{F}}_{\mathcal{A}}^*\big ) e^{2\beta } + \frac {3}{2}\epsilon ^4 |{\mathcal{F}}|^4 e^{4\beta }\nonumber \\ + \epsilon ^2 \gamma ^2 \bigg ( \big(\beta + \beta ^2\big)|{\mathcal{F}}_{\mathcal{A}}|^2 + \frac {1}{8}\big(1 - 2\beta -2\beta ^2 \big) |{\mathcal{F}}|_{{\mathcal{A}}{\mathcal{A}}}^2 \bigg )e^{2\beta } . \end{align}
The Lagrangian-mean water level (4.23), or more aptly changes thereof, fully constrain the divergent part of the total mean Lagrangian velocity. This can be seen by taking the average of the incompressibility condition (2.6), which from (4.13), (4.14) and (4.23) imply
 \begin{equation} \langle x_\tau \rangle _\alpha + \langle y_\tau \rangle _\beta = O(\epsilon ^4 \gamma ), \end{equation}
so that, to fourth order, the mean Lagrangian drift is divergence free (at higher orders products of the mean Lagrangian drift enter (4.24)). This allows us to define a streamfunction for the mean Lagrangian drift $\psi$
such that
$\psi$
such that
 \begin{equation} \langle x_\tau \rangle = -\psi _\beta, \quad \langle y_\tau \rangle = \psi _\alpha . \end{equation}
Equation (4.21) does not distinguish between the mean Lagrangian drift or the Lagrangian-mean water level, so to only constrain the drift we must account for the mean water level’s contribution to the curl, which only emerges at fourth order
 \begin{equation} {\partial }_\alpha {\partial }_\tau (\langle y \rangle _{\textit{MWL}}) = \frac {1}{2}\epsilon ^2 \gamma ^2|{\mathcal{F}}|^2_{{\mathcal{A}} T} \approx -\frac {1}{4}\epsilon ^2 \gamma ^2 |{\mathcal{F}}|^2_{{\mathcal{A}}{\mathcal{A}}}, \end{equation}
where for simplicity we have used the fact that, to lowest order, ${\mathcal{F}}_T = -({1}/{2}){\mathcal{F}}_{\mathcal{A}}$
. Combining (4.21) with (4.25) therefore results in
${\mathcal{F}}_T = -({1}/{2}){\mathcal{F}}_{\mathcal{A}}$
. Combining (4.21) with (4.25) therefore results in
 \begin{align} &{\nabla} ^2_{\boldsymbol{\alpha }} \psi = -2 \epsilon ^2 |{\mathcal{F}}|^2 e^{2\beta } + \epsilon ^2\gamma \bigg (2i (1 + \beta ) \big ({\mathcal{F}}_{\mathcal{A}} {\mathcal{F}}^* - {\mathcal{F}} {\mathcal{F}}_{\mathcal{A}}^*\big ) - i \big ({\mathcal{F}}_T{\mathcal{F}}^* - {\mathcal{F}} {\mathcal{F}}_T^*\big )\bigg )e^{2\beta } \nonumber \\ &\quad - 8 \epsilon ^4 |{\mathcal{F}}|^4 e^{4\beta } + \epsilon ^2 \gamma ^2 \left(\left(\frac {3}{4} + \frac {5}{2}\beta + \beta ^2\right)|{\mathcal{F}}|^2_{{\mathcal{A}}{\mathcal{A}}} e^{2\beta } - \big (4 + 10\beta + 4\beta ^2\big )|{\mathcal{F}}_{\mathcal{A}}|^2 e^{2\beta }\right)\!, \end{align}
which is just the linear Poisson equation. One can interpret (4.27) as equating the vorticity of the mean Lagrangian drift to the curl of the mean pseudomomentum, which acts here as a wave-induced source of vorticity (Salmon Reference Salmon2020). It is important to reiterate that, despite this interpretation, the vorticity of the fluid is still exactly zero everywhere in the fluid. The monochromatic mean Lagrangian drift shows how a mean flow that is sheared in the Lagrangian reference frame can still describe perfectly irrotational flow.
To close the system, we require boundary conditions on $\psi$
. The first one is simple: the flow vanishing at infinite depth implies
$\psi$
. The first one is simple: the flow vanishing at infinite depth implies $\psi \rightarrow 0$
as
$\psi \rightarrow 0$
as $\beta \rightarrow -\infty$
. The surface boundary condition is more subtle, as it was implicitly introduced in § 2 from the fact that the surface of the fluid is always defined by particles with
$\beta \rightarrow -\infty$
. The surface boundary condition is more subtle, as it was implicitly introduced in § 2 from the fact that the surface of the fluid is always defined by particles with $\beta =0$
. This is the Lagrangian equivalent of the kinematic boundary condition, (2.2) in the Eulerian frame, which in plain language states that particles which start at the surface always remain at the surface. From the perspective of the mean Lagrangian drift, there can therefore be no mass flux through the surface, making it a streamline which we can without loss of generality set to
$\beta =0$
. This is the Lagrangian equivalent of the kinematic boundary condition, (2.2) in the Eulerian frame, which in plain language states that particles which start at the surface always remain at the surface. From the perspective of the mean Lagrangian drift, there can therefore be no mass flux through the surface, making it a streamline which we can without loss of generality set to $\psi = 0$
at
$\psi = 0$
at $\beta =0$
. This is not to say that there can be no mean vertical motion, only that any such motion at the surface must correspond with changes to the surface geometry, which is already set by the Lagrangian-mean water level. Slow changes in the Lagrangian-mean water level, found by taking a time derivative of (4.23), can be interpreted as a ‘vertical drift’ which several studies investigate (e.g. Vanneste & Young Reference Sulem and Sulem2022). We choose to separate these effects due to their distinct dynamical origins; the mean Lagrangian drift is fundamentally set by the vorticity (or lack thereof), whereas the Lagrangian-mean water level is constrained by the geometry of material curves and would be present even in the absence of the mean Lagrangian drift, such as in the rotational Gerstner (Reference Gerstner1802) wave.
$\beta =0$
. This is not to say that there can be no mean vertical motion, only that any such motion at the surface must correspond with changes to the surface geometry, which is already set by the Lagrangian-mean water level. Slow changes in the Lagrangian-mean water level, found by taking a time derivative of (4.23), can be interpreted as a ‘vertical drift’ which several studies investigate (e.g. Vanneste & Young Reference Sulem and Sulem2022). We choose to separate these effects due to their distinct dynamical origins; the mean Lagrangian drift is fundamentally set by the vorticity (or lack thereof), whereas the Lagrangian-mean water level is constrained by the geometry of material curves and would be present even in the absence of the mean Lagrangian drift, such as in the rotational Gerstner (Reference Gerstner1802) wave.
The full solution to (4.27) can be found in Appendix A, although its general character is determined solely by considering the pseudomomentum forcing term. To leading order, this forcing is negative and concentrated near the surface. Assuming the wave packet has a finite width, so that the streamlines must be closed, a clockwise circulation will develop which moves with the packet. This circulation presents itself as a strong jet near the surface, as determined in (4.9) as the classical mean Lagrangian drift, but also includes a slow deep return flow in a direction opposite to that of wave propagation that is well known in the literature (Longuet-Higgins & Stewart Reference Longuet-Higgins and Stewart1962; McIntyre Reference McIntyre1981; Salmon Reference Salmon2020; Pizzo & Wagner Reference Pizzo and Melville2025). These studies, however, only constrain the lowest-order mean flow response.
At higher orders, additional forcing terms arise that modify the structure of the mean Lagrangian drift. The third-order forcing terms in (4.27) depend on the quantities $i({\mathcal{F}}_{\mathcal{A}}{\mathcal{F}}^* - {\mathcal{F}} {\mathcal{F}}_{\mathcal{A}}^*)$
and
$i({\mathcal{F}}_{\mathcal{A}}{\mathcal{F}}^* - {\mathcal{F}} {\mathcal{F}}_{\mathcal{A}}^*)$
and $i({\mathcal{F}_T}{\mathcal{F}}^* - {\mathcal{F}} {\mathcal{F}}_T^*)$
, which represent local fluctuations to the wavenumber and frequency from their characteristic values
$i({\mathcal{F}_T}{\mathcal{F}}^* - {\mathcal{F}} {\mathcal{F}}_T^*)$
, which represent local fluctuations to the wavenumber and frequency from their characteristic values $k_0$
and
$k_0$
and $\omega _0$
, respectively. These terms therefore account for modifications to the mean Lagrangian drift associated with local variations in the phase speed.
$\omega _0$
, respectively. These terms therefore account for modifications to the mean Lagrangian drift associated with local variations in the phase speed.
At fourth order, there is a forcing term proportional to the fourth power of the envelope magnitude, which will always act to strengthen the near-surface mean Lagrangian drift, particularly during focusing when its magnitude is most pronounced. The quantity $|{\mathcal{F}}|^2_{{\mathcal{A}}{\mathcal{A}}}$
is the curvature of the squared envelope magnitude; it enhances the forcing where the curvature of the envelope is most negative (near the packet centre), and reduces it at the edges where the curvature is positive. Owing to the non-trivial vertical dependence, this effect is reversed at depth. The final contribution, proportional to
$|{\mathcal{F}}|^2_{{\mathcal{A}}{\mathcal{A}}}$
is the curvature of the squared envelope magnitude; it enhances the forcing where the curvature of the envelope is most negative (near the packet centre), and reduces it at the edges where the curvature is positive. Owing to the non-trivial vertical dependence, this effect is reversed at depth. The final contribution, proportional to $|{\mathcal{F}}_{\mathcal{A}}|^2$
, similarly enhances the forcing near the surface. Together, these fourth-order corrections provide enhancements to the forcing of the mean Lagrangian drift near the surface in regions where wave envelopes are both steep and concave, precisely the conditions present during focusing which led to the greatest observed transport.
$|{\mathcal{F}}_{\mathcal{A}}|^2$
, similarly enhances the forcing near the surface. Together, these fourth-order corrections provide enhancements to the forcing of the mean Lagrangian drift near the surface in regions where wave envelopes are both steep and concave, precisely the conditions present during focusing which led to the greatest observed transport.
Despite the complexity of the full solution, which can be found in Appendix A, the mean Lagrangian drift at the surface can be written explicitly as
 \begin{align} \langle x_\tau \rangle \big |_{\beta =0} =\epsilon ^2 |{\mathcal{F}}|^2 + \epsilon ^2\gamma \bigg (\frac {1}{2}i \big ({\mathcal{F}}_T {\mathcal{F}}^* - {\mathcal{F}} {\mathcal{F}}_T^*\big ) - \frac {1}{2} i\big ({\mathcal{F}}_{\mathcal{A}}{\mathcal{F}}^* - {\mathcal{F}} {\mathcal{F}}^*_{\mathcal{A}}\big ) +\frac {1}{2}\mathcal{H}\big (|{\mathcal{F}}|^2_{\mathcal{A}}\big )\bigg ) \nonumber \\ + 2\epsilon ^4 |{\mathcal{F}}|^4 + \epsilon ^2 \gamma ^2 \bigg ( \frac {1}{2}|{\mathcal{F}}_{\mathcal{A}}|^2 - \frac {1}{4}|{\mathcal{F}}|^2_{{\mathcal{A}}{\mathcal{A}}} + \frac {1}{4}i {\partial }_{\mathcal{A}}\mathcal{H}\big ({\mathcal{F}}_{T}{\mathcal{F}}^* - {\mathcal{F}}{\mathcal{F}}_{T}^*\big )\Big )\bigg ), \end{align}
where $\mathcal{H}$
represents the spatial Hilbert transform.
$\mathcal{H}$
represents the spatial Hilbert transform.
To check that our solutions reduce to known results for steep monochromatic waves, we see what happens when the envelope $\mathcal{F}$
is constant in space. From (4.16), we have
$\mathcal{F}$
is constant in space. From (4.16), we have
 \begin{equation} i {\mathcal{F}}_T = \frac {\epsilon ^2}{\gamma }\frac {1}{2}|{\mathcal{F}}|^2 {\mathcal{F}}, \end{equation}
which admits the exact solution (recalling $T = \gamma \tau$
)
$T = \gamma \tau$
)
 \begin{equation} {\mathcal{F}} = {\mathcal{F}}_0 e^{-\frac {1}{2}i \epsilon ^2 |{\mathcal{F}}_0|^2 \tau } , \end{equation}
where ${\mathcal{F}}_0$
is a complex constant, still
${\mathcal{F}}_0$
is a complex constant, still $O(1)$
. This slow time modulation to
$O(1)$
. This slow time modulation to $\mathcal{F}$
is just the classical Stokes correction to the phase speed for finite amplitude waves (Stokes Reference Skyner1847). Assuming without loss of generality that
$\mathcal{F}$
is just the classical Stokes correction to the phase speed for finite amplitude waves (Stokes Reference Skyner1847). Assuming without loss of generality that ${\mathcal{F}}_0 = 1$
(the physical dimensions can be added later), inserting (4.30) into the trajectories (4.13)–(4.15) yields
${\mathcal{F}}_0 = 1$
(the physical dimensions can be added later), inserting (4.30) into the trajectories (4.13)–(4.15) yields
 \begin{align} x &= \alpha - \big(\epsilon + 2\epsilon ^3 e^{2\beta }\big)e^\beta \sin (\alpha - (c-U(\beta ))\tau ) + U(\beta )\tau , \\[-12pt]\nonumber \end{align}
 \begin{align} y &= \beta + \big(\epsilon + \epsilon ^3 e^{2\beta }\big) e^\beta \cos (\alpha - (c-U(\beta ))\tau ) + \frac {1}{2}\epsilon ^2 e^{2\beta }, \\[-12pt]\nonumber \end{align}
 \begin{align} p &= -\beta + \epsilon ^3\big(e^\beta - e^{3\beta }\big)\cos (\alpha - (c-U(\beta ))\tau ), \end{align}
where $c = ( 1 + ({1}/{2}) \epsilon ^2 )$
is the nonlinear, non-dimensionalised phase speed, and
$c = ( 1 + ({1}/{2}) \epsilon ^2 )$
is the nonlinear, non-dimensionalised phase speed, and $U(\beta )$
is the mean Lagrangian drift, governed by
$U(\beta )$
is the mean Lagrangian drift, governed by
 \begin{equation} {\nabla} _{\boldsymbol{\alpha }}^2 \psi = -2\epsilon ^2 e^{2\beta } - 8 \epsilon ^4 e^{4\beta } - \epsilon ^4 e^{2\beta }, \end{equation}
which only depends on $\beta$
. Therefore, (4.34) reduces to an ordinary differential equation, and by simple integration the solution becomes
$\beta$
. Therefore, (4.34) reduces to an ordinary differential equation, and by simple integration the solution becomes
 \begin{equation} U(\beta ) = -\psi _\beta = \epsilon ^2 \underbrace {\Big (1 + \frac {1}{2}\epsilon ^2\Big )}_ce^{2\beta } + 2\epsilon ^4 e^{4\beta }. \end{equation}
While these are uniformly valid solutions that match those of Clamond (Reference Clamond2007), he defines his small steepness parameter $\epsilon '$
to be equal to
$\epsilon '$
to be equal to $k_0 h/2$
, where
$k_0 h/2$
, where $h$
is the crest to trough distance at the surface. The surface crest to trough distance from our solution (4.32) implies the relationship between these small parameters is
$h$
is the crest to trough distance at the surface. The surface crest to trough distance from our solution (4.32) implies the relationship between these small parameters is
 \begin{equation} \epsilon ' = \epsilon + \epsilon ^3, \end{equation}
so that using the standard definition of wave steepness $\epsilon '$
, the drift at the surface can be expressed as
$\epsilon '$
, the drift at the surface can be expressed as
 \begin{equation} U(0) = \epsilon '^2 c', \quad c' = \left(1 + \frac {1}{2}\epsilon '^2 \right), \end{equation}
to fourth order in $\epsilon '$
, which matches the results in the literature (Longuet-Higgins Reference Longuet-Higgins1987). Because unsteady narrow-banded waves do not have an unambiguous geometric reference such as crest to trough height, we must instead settle for its more basic definition above based on the steepness of the first-order Lagrangian expansions.
$\epsilon '$
, which matches the results in the literature (Longuet-Higgins Reference Longuet-Higgins1987). Because unsteady narrow-banded waves do not have an unambiguous geometric reference such as crest to trough height, we must instead settle for its more basic definition above based on the steepness of the first-order Lagrangian expansions.
4.2. Comparison with simulation
As a test of the above theory, we directly apply our above expression for the local mean Lagrangian drift of steep, narrow-banded waves (4.28) to estimate the surface transport of focusing wave packets from measurements of the wave envelope, comparing these predictions with the results from our fully nonlinear simulations. Note that the independent variables of the simulation, the initial positions $(x_0,y_0)$
, only coincide with the Lagrangian labels
$(x_0,y_0)$
, only coincide with the Lagrangian labels $(\alpha ,\beta )$
for particles which begin at rest (i.e. where
$(\alpha ,\beta )$
for particles which begin at rest (i.e. where $\mathcal{F}$
and its derivatives vanish). Since the Lagrangian displacement is only computed for particles which both begin and end at rest, for these particles we may treat both sets of independent variables identically. At the surface the transport is given by integrating (4.28) in time
$\mathcal{F}$
and its derivatives vanish). Since the Lagrangian displacement is only computed for particles which both begin and end at rest, for these particles we may treat both sets of independent variables identically. At the surface the transport is given by integrating (4.28) in time
 \begin{align} \delta x = \int \epsilon ^2 |{\mathcal{F}}|^2 + \epsilon ^2\gamma \bigg (\frac {1}{2}i \big ({\mathcal{F}}_T {\mathcal{F}}^* - {\mathcal{F}} {\mathcal{F}}_T^*\big ) - \frac {1}{2} i\big ({\mathcal{F}}_{\mathcal{A}}{\mathcal{F}}^* - {\mathcal{F}} {\mathcal{F}}^*_{\mathcal{A}}\big ) +\frac {1}{2}\mathcal{H}\big (|{\mathcal{F}}|^2_{\mathcal{A}}\big )\bigg ) \nonumber \\ + 2\epsilon ^4 |{\mathcal{F}}|^4 + \epsilon ^2 \gamma ^2 \bigg ( \frac {1}{2}|{\mathcal{F}}_{\mathcal{A}}|^2 - \frac {1}{4}|{\mathcal{F}}|^2_{{\mathcal{A}}{\mathcal{A}}} + \frac {1}{4}i {\partial }_{\mathcal{A}}\mathcal{H}\big ({\mathcal{F}}_{T}{\mathcal{F}}^* - {\mathcal{F}}{\mathcal{F}}_{T}^*\big )\bigg ) \, {\textrm {d}} \tau . \end{align}
To compare this prediction with the simulations, $\mathcal{F}$
is estimated by using the spatial Hilbert transform of the vertical Lagrangian positions at each time to produce an analytic envelope signal. While this correctly estimates the magnitude of the envelope
$\mathcal{F}$
is estimated by using the spatial Hilbert transform of the vertical Lagrangian positions at each time to produce an analytic envelope signal. While this correctly estimates the magnitude of the envelope $\mathcal{F}$
, its phase must be corrected by removing the phase of the carrier wave, which is given by (4.12). Because the theory outlined above is non-dimensional, all quantities must be dimensionalised by a characteristic wavenumber
$\mathcal{F}$
, its phase must be corrected by removing the phase of the carrier wave, which is given by (4.12). Because the theory outlined above is non-dimensional, all quantities must be dimensionalised by a characteristic wavenumber $k_0$
and frequency
$k_0$
and frequency $\omega _0 = \sqrt {g k_0}$
. Note that
$\omega _0 = \sqrt {g k_0}$
. Note that $k_0$
and
$k_0$
and $\omega _0$
need not be equivalent to the initially specified
$\omega _0$
need not be equivalent to the initially specified $k_c$
and
$k_c$
and $\omega _c$
. Because the phase of
$\omega _c$
. Because the phase of $\mathcal{F}$
represents narrow-banded deviations from the phase of the carrier wave, we choose
$\mathcal{F}$
represents narrow-banded deviations from the phase of the carrier wave, we choose $k_0$
such that these deviations have zero mean when integrated in time. Once the envelope
$k_0$
such that these deviations have zero mean when integrated in time. Once the envelope $\mathcal{F}$
is computed, all that remains is to compute the surface mean Lagrangian transport (4.38) (where
$\mathcal{F}$
is computed, all that remains is to compute the surface mean Lagrangian transport (4.38) (where $\epsilon$
and
$\epsilon$
and $\gamma$
are implicitly included in measurements of
$\gamma$
are implicitly included in measurements of $\mathcal{F}$
and its slow derivatives) for each particle and integrate in time over the duration of the packet passing to estimate the total transport predicted by this theory. From this, we can compute the maximum and mean transport predicted by narrow-banded theory to compare directly with the simulations.
$\mathcal{F}$
and its slow derivatives) for each particle and integrate in time over the duration of the packet passing to estimate the total transport predicted by this theory. From this, we can compute the maximum and mean transport predicted by narrow-banded theory to compare directly with the simulations.
The mean surface transport $\langle \delta x \rangle$
within the focusing region as a function of
$\langle \delta x \rangle$
within the focusing region as a function of $S$
computed both directly from simulation (circles) and using our higher-order theory (4.38) (lines) for each simulation. The mean surface transport for all laboratory experiments (Lenain et al. Reference Lenain, Pizzo and Melville2019; Sinnis et al. Reference Seitz, Freilich and Pizzo2021) is additionally shown (triangles). In
$S$
computed both directly from simulation (circles) and using our higher-order theory (4.38) (lines) for each simulation. The mean surface transport for all laboratory experiments (Lenain et al. Reference Lenain, Pizzo and Melville2019; Sinnis et al. Reference Seitz, Freilich and Pizzo2021) is additionally shown (triangles). In $(a)$
,
$(a)$
, $\langle \delta x \rangle$
is normalised by the central wavenumber
$\langle \delta x \rangle$
is normalised by the central wavenumber $k_c$
, and each line represents the theoretical prediction of mean transport for each bandwidth value. In
$k_c$
, and each line represents the theoretical prediction of mean transport for each bandwidth value. In $(b)$
,
$(b)$
, $\langle \delta x \rangle$
is also normalised by the linear bandwidth dependence
$\langle \delta x \rangle$
is also normalised by the linear bandwidth dependence $f(\Delta )$
(3.7) which collapses the results. The theory performs best at lower values of
$f(\Delta )$
(3.7) which collapses the results. The theory performs best at lower values of $\varDelta$
where the narrow-banded envelope assumption is most valid.
$\varDelta$
where the narrow-banded envelope assumption is most valid.

Figure 5 presents the mean surface transport obtained directly from the simulations, together with the corresponding theoretical prediction evaluated for each case using (4.38). Also included is the mean surface transport from all available laboratory experiments (Lenain et al. Reference Lenain, Pizzo and Melville2019; Sinnis et al. Reference Seitz, Freilich and Pizzo2021). In figure 5(a), the mean transport is scaled only by the central wavenumber $k_c$
, and good agreement between simulation and theory is found, especially for lower values of
$k_c$
, and good agreement between simulation and theory is found, especially for lower values of $\varDelta$
and
$\varDelta$
and $S$
. This is expected since (4.38) is valid to fourth order in the small parameters
$S$
. This is expected since (4.38) is valid to fourth order in the small parameters $(\epsilon ,\gamma )$
which are proportional to
$(\epsilon ,\gamma )$
which are proportional to $(S,\Delta )$
respectively. The theory still performs well across a wide range of parameter space, indicating that the narrow-banded wave approximation is able to capture the local enhancements to the mean Lagrangian drift. Figure 5(b) collapses these results, normalising by both
$(S,\Delta )$
respectively. The theory still performs well across a wide range of parameter space, indicating that the narrow-banded wave approximation is able to capture the local enhancements to the mean Lagrangian drift. Figure 5(b) collapses these results, normalising by both $k_c$
and the linear bandwidth dependence
$k_c$
and the linear bandwidth dependence $f(\Delta )$
, showing that the bandwidth dependence of the surface transport, even in steep packets, is still reasonably approximated by linear theory. This collapse demonstrates good qualitative agreement between the simulations, theory and experiments, even though neither the theory nor the simulations account for finite-depth effects.
$f(\Delta )$
, showing that the bandwidth dependence of the surface transport, even in steep packets, is still reasonably approximated by linear theory. This collapse demonstrates good qualitative agreement between the simulations, theory and experiments, even though neither the theory nor the simulations account for finite-depth effects.
5. Discussion
In this paper we investigated the mean Lagrangian drift of two-dimensional irrotational steep focusing surface gravity waves. By working directly in the Lagrangian reference frame, we derived a novel exact technique for constraining the mean Lagrangian drift in general wavy flows, illustrating its role as a spatially varying dynamic mean flow instead of as a passive byproduct of waves. Through a combination of numerical simulations and archived laboratory data, we showed that the surface Lagrangian transport in steep focusing waves can vary spatially and is significantly increased in regions of wave focusing. By performing a separation of scales analysis in the Lagrangian reference frame, we derived Lagrangian particle trajectories in deep-water narrow-banded wave fields, and derived a higher-order expression for the local mean Lagrangian drift and corresponding deep recirculation flow. The form of this expression suggests that wave focusing locally increases the surface drift. Comparing the predictions of this theory with the simulated results shows that it captures a large portion of the observed enhancements especially at smaller bandwidths where the narrow-banded assumption holds.
This study in general advocates for a more local interpretation of the mean Lagrangian drift. For irrotational flow, we showed that in the Lagrangian frame the curl of the mean Lagrangian drift is exactly equal to the curl of the mean pseudomomentum, which itself originates from correlations of wavy particle displacements. Consequently, spatial modifications to the wave orbital motion generate local variations in the mean pseudomomentum, which in turn drive corresponding variations in the mean Lagrangian drift. As evidenced by the particle trajectories within focusing wave packets, this has a profound affect on the way particles are transported – those directly in the focusing region are transported in a rapid burst, whereas particles further downstream drift more slowly as the packet disperses. Modelling the mean Lagrangian drift as a dynamic mean flow which can vary in both space and time may better explain various processes such the enhanced horizontal diffusion due to waves (Herterich & Hasselmann Reference Herterich and Hasselmann1982) and could provide more insight into how this mean flow interacts with the vorticity field to generate Langmuir circulation.
These results show that it is the local steepness of the wave field, not just the steepness of individual wave components, which sets the magnitude of these enhancements. That is, even if individual waves comprising a wave field are otherwise well described by linear theory, linear dispersion will consistently create localised focusing events that produce bursts of an increased near surface mean Lagrangian drift. While the likelihood of all wave components constructively interfering such as in the packets studied above may be low, the local steepness need only approach moderate values to begin to see these enhancements, which can occur so long as only some waves constructively interfere. In the real ocean, wave directionality will impact the spatial and temporal scales of both linear and nonlinear wave focusing (Fedele et al. Reference Fedele, Brennan, Ponce de León, Dudley and Dias2016; McAllister & van den Bremer Reference McAllister and van den Bremer2019), and extending this approach to three-dimensional wave packets is a natural direction for future work. Such focusing events in both two and three dimensions should be commonplace in moderately developed seas, suggesting that both the magnitude and vertical dependence of the mean Lagrangian drift may be incorrectly estimated with models that ignore these effects.
Acknowledgements
We thank R. Salmon for many insightful conversations.
Funding
A. Blaser, L. Lenain and N.E. Pizzo were partially supported by NSF OCE-2219752, 2342714 and 2342716, NASA 80NSSC19K1037 (S-MODE) and 80NSSC23K0985 (OVWST) awards.
Declaration of interests
The authors report no conflicts of interest.
Author contributions
Blaser: formal analysis (lead); writing - original draft presentation (lead); writing - review and editing (lead); conceptualisation (supporting). Lenain: formal analysis (supporting), review (supporting), conceptualisation (supporting), funding acquisition (lead). Pizzo: formal analysis (supporting), review (supporting), conceptualisation (lead), funding acquisition (lead).
Appendix A. Streamfunction for the mean Lagrangian drift
Here, we solve Poisson’s equation for the streamfunction of the mean Lagrangian drift (4.27) and compute its value at the surface. In § 4, we showed, that after averaging over the fast orbital motion, the mean Lagrangian drift is divergence free in label space to fourth order, allowing for the introduction of a streamfunction for the mean flow with the following sign convention:
 \begin{equation} \langle x_\tau \rangle = -\psi _\beta, \quad \langle y_\tau \rangle = \psi _\alpha . \end{equation}
Using the exact equivalence between the curl of the mean Lagrangian drift and the curl of the mean pseudomomentum (2.18), this streamfunction was found to obey
 \begin{align} &{\nabla} ^2_{\boldsymbol{\alpha }} \psi = -2 \epsilon ^2 |{\mathcal{F}}|^2 e^{2\beta } + \epsilon ^2\gamma \Big (2i (1 + \beta ) \big ({\mathcal{F}}_{\mathcal{A}} {\mathcal{F}}^* - {\mathcal{F}} {\mathcal{F}}_{\mathcal{A}}^*\big ) - i \big ({\mathcal{F}}_T{\mathcal{F}}^* - {\mathcal{F}} {\mathcal{F}}_T^*\big ) \Big)e^{2\beta } \nonumber \\ &\quad - 8 \epsilon ^4 |{\mathcal{F}}|^4 e^{4\beta } + \epsilon ^2 \gamma ^2 \bigg (\bigg (\frac {3}{4} + \frac {5}{2}\beta + \beta ^2\bigg )|{\mathcal{F}}|^2_{{\mathcal{A}}{\mathcal{A}}} e^{2\beta } - \big (4 + 10\beta + 4\beta ^2\big )|{\mathcal{F}}_{\mathcal{A}}|^2 e^{2\beta }\bigg ), \end{align}
within the fluid domain, which in label space is just the lower half-plane. The system is closed with boundary conditions $\psi = 0$
at the surface
$\psi = 0$
at the surface $(\beta =0)$
and at infinite depth
$(\beta =0)$
and at infinite depth $(\beta \rightarrow -\infty )$
. The above (A2) is linear, meaning that we can separate
$(\beta \rightarrow -\infty )$
. The above (A2) is linear, meaning that we can separate $\psi$
into a homogeneous and particular solution
$\psi$
into a homogeneous and particular solution
 \begin{equation} \psi = \psi _H + \psi _P . \end{equation}
The right-hand side of (A2) only varies slowly in $\alpha$
, so by inspection, the particular solution valid to fourth order is
$\alpha$
, so by inspection, the particular solution valid to fourth order is
 \begin{align} \psi _P &= -\frac {1}{2}\epsilon ^2 |{\mathcal{F}}|^2 e^{2 \beta }+ \epsilon ^2\gamma \bigg (-\frac {1}{4}i \big ({\mathcal{F}}_T{\mathcal{F}}^* - {\mathcal{F}} {\mathcal{F}}_T^*\big ) + \frac {1}{2}i \beta \big ({\mathcal{F}}_{\mathcal{A}}{\mathcal{F}}^* - {\mathcal{F}} {\mathcal{F}}_{\mathcal{A}}^*\big )\bigg )e^{2\beta } \nonumber \\ &\,- \frac {1}{2}\epsilon ^4 |{\mathcal{F}}|^4 e^{4\beta } + \epsilon ^2\gamma ^2 \bigg (\frac {1}{16}\big (1 + 2\beta + 4\beta ^2\big ) |{\mathcal{F}}|^2_{{\mathcal{A}}{\mathcal{A}}} - \frac {1}{2}\big (\beta + 2\beta ^2\big )|{\mathcal{F}}_{\mathcal{A}}|^2\bigg )e^{2\beta } . \end{align}
From (A3), we see that $\psi _H$
must therefore obey
$\psi _H$
must therefore obey
 \begin{equation} {\nabla} ^2_{\boldsymbol{\alpha }}\psi _H = 0 , \quad \psi _H \big |_{\beta =0} = -\varXi ({\mathcal{A}},T) , \end{equation}
where for brevity $\varXi ({\mathcal{A}},T)$
is defined as the right-hand side of (A4) evaluated at the surface. Since the homogeneous system (A5) only depends on the slow variables
$\varXi ({\mathcal{A}},T)$
is defined as the right-hand side of (A4) evaluated at the surface. Since the homogeneous system (A5) only depends on the slow variables $\mathcal{A}$
and
$\mathcal{A}$
and $T$
, we introduce a slow vertical variable
$T$
, we introduce a slow vertical variable $\mathcal{B}=\gamma \beta$
to make explicit that
$\mathcal{B}=\gamma \beta$
to make explicit that $\psi _H$
varies slowly with depth. The homogeneous solution still obeys the Laplace equation in these slow variables (i.e.
$\psi _H$
varies slowly with depth. The homogeneous solution still obeys the Laplace equation in these slow variables (i.e. ${\partial }_{{\mathcal{A}}}^2 \psi _H + {\partial }_{\mathcal{B}}^2\psi _H = 0)$
, and because the domain is the lower half plane, we can use the theory of Poisson kernels to immediately write the full solution
${\partial }_{{\mathcal{A}}}^2 \psi _H + {\partial }_{\mathcal{B}}^2\psi _H = 0)$
, and because the domain is the lower half plane, we can use the theory of Poisson kernels to immediately write the full solution
 \begin{equation} \psi _H = \frac {1}{\pi }\int _{-\infty }^\infty \frac {\varXi ({\mathcal{A}}',T)\mathcal{B}}{({\mathcal{A}}'-{\mathcal{A}})^2 + \mathcal{B}^2} \, {\textrm {d}} {\mathcal{A}}' . \end{equation}
Looking at the form of these solutions, it is clear that $\psi _P$
describes the majority of the mean Lagrangian drift near the surface, manifesting as a jet beneath the wave envelope as expected. However, the streamlines of
$\psi _P$
describes the majority of the mean Lagrangian drift near the surface, manifesting as a jet beneath the wave envelope as expected. However, the streamlines of $\psi _P$
intersect the surface for a compact packet, which violates the kinematic boundary condition that surface particles remain at the surface. This is remedied by
$\psi _P$
intersect the surface for a compact packet, which violates the kinematic boundary condition that surface particles remain at the surface. This is remedied by $\psi _H$
, which enforces the boundary condition and describes a deep recirculation flow opposite in direction to packet propagation, generating downwelling and upwelling beneath the front and back of the packet, respectively. Combined, the streamlines of
$\psi _H$
, which enforces the boundary condition and describes a deep recirculation flow opposite in direction to packet propagation, generating downwelling and upwelling beneath the front and back of the packet, respectively. Combined, the streamlines of $\psi$
are all closed beneath the surface, indicative of one half of a Bretherton dipole flow (Bretherton Reference Bretherton1969). Finally, we note that in a box which contains the entire wave packet, such that
$\psi$
are all closed beneath the surface, indicative of one half of a Bretherton dipole flow (Bretherton Reference Bretherton1969). Finally, we note that in a box which contains the entire wave packet, such that $\psi \rightarrow 0$
on all boundaries, it is easy to show through the divergence theorem that even for this higher-order solution the total integrated momentum vanishes, which is a well-established result in the literature (McIntyre Reference McIntyre1981; Pizzo & Wagner Reference Pizzo and Melville2025).
$\psi \rightarrow 0$
on all boundaries, it is easy to show through the divergence theorem that even for this higher-order solution the total integrated momentum vanishes, which is a well-established result in the literature (McIntyre Reference McIntyre1981; Pizzo & Wagner Reference Pizzo and Melville2025).
From the definition of the streamfunction (A1), we can explicitly derive the mean Lagrangian drift everywhere to fourth order. For the horizontal mean flow this yields
 \begin{align} &\langle x_\tau \rangle = -\psi _\beta = \epsilon ^2 |{\mathcal{F}}|^2 e^{2\beta } + \epsilon ^2 \gamma \bigg (\frac {1}{2}i \big ({\mathcal{F}}_T {\mathcal{F}}^* - {\mathcal{F}} {\mathcal{F}}_T^*\big ) - \frac {1}{2}i (1 + 2\beta )\big ({\mathcal{F}}_{\mathcal{A}} {\mathcal{F}}^* - {\mathcal{F}} {\mathcal{F}}_{\mathcal{A}}^*\big )\bigg )e^{2\beta } \nonumber \\ &\quad + 2 \epsilon ^4 |{\mathcal{F}}|^4 e^{4\beta } + \epsilon ^2 \gamma ^2 \bigg (-\frac {1}{4}\big(1 + 3\beta + 2\beta ^2\big)|{\mathcal{F}}|^2_{{\mathcal{A}}{\mathcal{A}}} + \frac {1}{2}\big(1 + 6\beta + 4\beta ^2\big)|{\mathcal{F}}_{\mathcal{A}}|^2\bigg )e^{2\beta } \nonumber \\ &\qquad \qquad\qquad\qquad\qquad \qquad- \gamma \frac {1}{\pi }\int _{-\infty }^\infty \frac {\varXi ({\mathcal{A}}',T)\big (\big({\mathcal{A}}'-{\mathcal{A}}\big)^2 - \mathcal{B}^2\big )}{\big (\big({\mathcal{A}}'-{\mathcal{A}}\big)^2 + \mathcal{B}^2\big )^2} \, {\textrm {d}} {\mathcal{A}}', \end{align}
where the integral term comes from $-\partial _\beta \psi _H$
. While this integral in general cannot be evaluated in closed form, we can determine its value at the free surface
$-\partial _\beta \psi _H$
. While this integral in general cannot be evaluated in closed form, we can determine its value at the free surface $\beta =0$
. Because
$\beta =0$
. Because $\psi _H$
obeys Laplace’s equation, it must be the imaginary part of an analytic complex potential
$\psi _H$
obeys Laplace’s equation, it must be the imaginary part of an analytic complex potential $\chi = \phi _H + i \psi _H$
. Along the real axis (
$\chi = \phi _H + i \psi _H$
. Along the real axis ( $\beta =0$
),
$\beta =0$
), $\psi _H$
and
$\psi _H$
and $\phi _H$
are related by the Hilbert transform
$\phi _H$
are related by the Hilbert transform $\mathcal{H}$
so that
$\mathcal{H}$
so that
 \begin{equation} \phi _H \big |_{\beta =0} = \mathcal{H} \big (\psi _H\big ) \big |_{\beta =0}. \end{equation}
This, combined with one half of the Cauchy–Riemann equations
 \begin{equation} -{\partial }_{\mathcal{B}}\psi _H = {\partial }_{\mathcal{A}} \phi _H, \end{equation}
yields
 \begin{equation} {\partial }_\beta \psi _H \big |_{\beta =0}= -\gamma {\partial }_{\mathcal{A}} \mathcal{H}\big (\psi _H\big ) \big |_{\beta =0}= \gamma {\partial }_{\mathcal{A}} \mathcal{H}\big (\varXi \big ({\mathcal{A}},T\big )\big ). \end{equation}
Thus, at the free surface, we can simplify (A7) as
 \begin{align} \langle x_\tau \rangle \big |_{\beta =0} = -{\partial }_\beta \big (\psi _P + \psi _H\big )\big |_{\beta =0} =\epsilon ^2 |{\mathcal{F}}|^2 + \epsilon ^2\gamma \bigg (\frac {1}{2}i \big ({\mathcal{F}}_T {\mathcal{F}}^* - {\mathcal{F}} {\mathcal{F}}_T^*\big ) - \frac {1}{2} i\big ({\mathcal{F}}_{\mathcal{A}}{\mathcal{F}}^* - {\mathcal{F}} {\mathcal{F}}^*_{\mathcal{A}}\big ) \nonumber \\ +\frac {1}{2}\mathcal{H}\big (|{\mathcal{F}}|^2_{\mathcal{A}}\big )\bigg ) + 2\epsilon ^4 |{\mathcal{F}}|^4 + \epsilon ^2 \gamma ^2 \bigg ( \frac {1}{2}|{\mathcal{F}}_{\mathcal{A}}|^2 - \frac {1}{4}|{\mathcal{F}}|^2_{{\mathcal{A}}{\mathcal{A}}}+ \frac {1}{4}i{\partial }_{\mathcal{A}} \mathcal{H}\big ({\mathcal{F}}_T{\mathcal{F}}^* - {\mathcal{F}} {\mathcal{F}}_T^*\big )\bigg ), \end{align}
where we have used the fact that $\mathcal{H}$
as a linear operator commutes with partial derivatives to simplify various terms.
$\mathcal{H}$
as a linear operator commutes with partial derivatives to simplify various terms.
Appendix B. Fourth-order mean Lagrangian drift for two waves
It is natural to ask whether or not an enhanced mean Lagrangian drift can be found from the simplest wave interaction case, that of two irrotational waves with arbitrary wavenumbers $k_1$
and
$k_1$
and $k_2$
travelling in the same direction. This system is well studied, with nonlinear wave–wave interactions inducing finite amplitude phase speed corrections to each wave while leaving the wave amplitudes time independent (Longuet-Higgins & Phillips Reference Longuet-Higgins and Phillips1962). Without loss of generality we set
$k_2$
travelling in the same direction. This system is well studied, with nonlinear wave–wave interactions inducing finite amplitude phase speed corrections to each wave while leaving the wave amplitudes time independent (Longuet-Higgins & Phillips Reference Longuet-Higgins and Phillips1962). Without loss of generality we set $k_1 \lt k_2$
to ensure that solutions decay with depth. Using
$k_1 \lt k_2$
to ensure that solutions decay with depth. Using $\epsilon _1$
and
$\epsilon _1$
and $\epsilon _2$
to represent the small steepness parameters of each wave, solutions valid to second order in each small parameter are given in Pierson (Reference Pierson1961)
$\epsilon _2$
to represent the small steepness parameters of each wave, solutions valid to second order in each small parameter are given in Pierson (Reference Pierson1961)
 \begin{align} x(\alpha ,\beta ,\tau ) &= \alpha + \epsilon _1^2 c_1 e^{2 k_1 \beta }\tau + \epsilon _2^2 c_2 e^{2 k_2 \beta }\tau -\frac {\epsilon _1}{k_1} e^{k_1\beta } \sin (\theta _1) - \frac {\epsilon _2}{k_2} e^{k_2 \beta } \sin (\theta _2) \nonumber \\ &\quad + \frac {\epsilon _1 \epsilon _2}{g k_1 k_2} (\omega _2 + \omega _1) \omega _2 e^{(k_2 - k_1)\beta } \sin (\theta _2 - \theta _1) \nonumber \\ &\quad - \frac {\epsilon _1 \epsilon _2}{g k_1 k_2} \left( \frac {\omega _1^3 + \omega _2^3}{\omega _2 - \omega _1} \right) e^{(k_2 +k_1)\beta }\sin (\theta _2 - \theta _1), \\[-12pt]\nonumber \end{align}
 \begin{align} y(\alpha ,\beta ,\tau ) &= \beta + \frac {\epsilon _1^2}{2 k_1}e^{2 k_1 \beta } + \frac {\epsilon _2^2}{2 k_2}e^{2 k_2 \beta } + \frac {\epsilon _1}{k_1} e^{k_1 \beta } \cos (\theta _1) + \frac {\epsilon _2}{k_2} e^{k_2 \beta } \cos (\theta _2) \nonumber \\[6pt] &\quad + \frac {\epsilon _1 \epsilon _2}{g k_1 k_2}\big(\omega _1^2 + \omega _1 \omega _2 + \omega _2^2\big) e^{(k_1 + k_2)\beta }\cos (\theta _2 - \theta _1) \nonumber \\[6pt] &\quad - \frac {\epsilon _1 \epsilon _2}{g k_1 k_2}\omega _2 (\omega _2 + \omega _1)e^{(k_2-k_1)\beta }\cos (\theta _2 - \theta _1), \\[-12pt]\nonumber \end{align}
 \begin{align} p(\alpha ,\beta ,\tau ) &= -g \beta + 2 \epsilon _1 \epsilon _2 c_1 c_2 e^{(k_2 - k_1)\beta }\cos (\theta _2 - \theta _1) \nonumber \\ &\quad- 2 \epsilon _1 \epsilon _2 c_1 c_2 e^{(k_1 + k_2)\beta }\cos (\theta _2 - \theta _1), \end{align}
where to this order $\omega _1 = \sqrt {g k_1}$
,
$\omega _1 = \sqrt {g k_1}$
, $\omega _2 = \sqrt {g k_2}$
, with phases
$\omega _2 = \sqrt {g k_2}$
, with phases
 \begin{equation} \theta _1 = k_1 (\alpha - c_1 \tau ), \quad \theta _2 = k_2 (\alpha - c_2 \tau ), \end{equation}
where $c_1 = \omega _1/k_1$
and
$c_1 = \omega _1/k_1$
and $c_2 = \omega _2/k_2$
. As we saw previously for linear theory, the mean Lagrangian drift to this order is simply additive for each wave, and we have
$c_2 = \omega _2/k_2$
. As we saw previously for linear theory, the mean Lagrangian drift to this order is simply additive for each wave, and we have
 \begin{equation} U(\beta ) = \epsilon _1^2 c_1 e^{2 k_1 \beta } + \epsilon _2^2 c_2 e^{2 k_2 \beta }. \end{equation}
Solutions to second order can only constrain the Lagrangian pseudomomentum to third order, which has no mean terms. Therefore, we must extend these results to third order in $\epsilon _1$
and
$\epsilon _1$
and $\epsilon _2$
to constrain the pseudomomentum, and as a result the mean Lagrangian drift, to fourth order. Similar to what is necessary for monochromatic waves (Clamond Reference Clamond2007), this requires Doppler shifting the phase by the total mean Lagrangian drift as well as allowing for higher-order corrections to the linear phase speeds. The modified phase can be expressed as
$\epsilon _2$
to constrain the pseudomomentum, and as a result the mean Lagrangian drift, to fourth order. Similar to what is necessary for monochromatic waves (Clamond Reference Clamond2007), this requires Doppler shifting the phase by the total mean Lagrangian drift as well as allowing for higher-order corrections to the linear phase speeds. The modified phase can be expressed as
 \begin{equation} \theta _1 = k_1 (\alpha - (c_1 - U(\beta ))\tau ), \quad c_1 = \sqrt {\frac {g}{k_1}} + \epsilon _1^2 c_{11} + \epsilon _2^2 c_{12}, \end{equation}
 \begin{equation} \theta _2 = k_2 (\alpha - (c_2 - U(\beta ))\tau ), \quad c_2 = \sqrt {\frac {g}{k_2}} + \epsilon _1^2 c_{21} + \epsilon _2^2 c_{22}, \end{equation}
where $c_{11}$
,
$c_{11}$
, $c_{12}$
,
$c_{12}$
, $c_{21}$
and
$c_{21}$
and $c_{22}$
are to-be-determined corrections (there are no phase speed corrections proportional to
$c_{22}$
are to-be-determined corrections (there are no phase speed corrections proportional to $\epsilon _1 \epsilon _2$
, Longuet-Higgins & Phillips Reference Longuet-Higgins and Phillips1962). From the second-order solutions (B1)–(B3), third-order terms are added of the form, e.g. for
$\epsilon _1 \epsilon _2$
, Longuet-Higgins & Phillips Reference Longuet-Higgins and Phillips1962). From the second-order solutions (B1)–(B3), third-order terms are added of the form, e.g. for $x$
,
$x$
,
 \begin{equation} \sum _{i + j = 3}\epsilon _1^i \epsilon _2^j x^{(i,j)}(\alpha ,\beta ,\tau ), \end{equation}
for non-negative integers $i,j$
. Similar expansions are made for
$i,j$
. Similar expansions are made for $y$
and
$y$
and $p$
. The third-order expansions, using the expanded phases (B6)–(B7), are then inserted into the Euler (2.7)–(2.8), irrotational condition (2.10) and Jacobian gauge (
$p$
. The third-order expansions, using the expanded phases (B6)–(B7), are then inserted into the Euler (2.7)–(2.8), irrotational condition (2.10) and Jacobian gauge ( ${\mathcal{J}}=1$
) (2.5). Terms proportional to the same powers of
${\mathcal{J}}=1$
) (2.5). Terms proportional to the same powers of $\epsilon _1$
and
$\epsilon _1$
and $\epsilon _2$
are then matched. Because of our phase expansion, all third-order terms are non-secular and can be found by assuming sinusoidal
$\epsilon _2$
are then matched. Because of our phase expansion, all third-order terms are non-secular and can be found by assuming sinusoidal $\alpha$
dependence and exponential
$\alpha$
dependence and exponential $\beta$
dependence. In the process the corrections to the phase speeds are also constrained. These corrections were found to be
$\beta$
dependence. In the process the corrections to the phase speeds are also constrained. These corrections were found to be
 \begin{align} c_1 &= \sqrt {\frac {g}{k_1}} \left(1 + \frac {1}{2}\epsilon _1^2 \right) + \epsilon _2^2 \frac {k_1}{k_2}\sqrt {\frac {g }{k_2}}, \\[-12pt]\nonumber \end{align}
 \begin{align} c_2 &= \sqrt {\frac {g}{k_2}} \left(1 + \frac {1}{2}\epsilon _2^2 \right) + \epsilon _1^2 \sqrt {\frac {g}{k_1}}, \end{align}
which match exactly with the results of Longuet-Higgins & Phillips (Reference Longuet-Higgins and Phillips1962) derived by a purely Eulerian approach. In addition to the standard finite amplitude Stokes correction to the phase speeds, there also exist corrections due to tertiary nonlinear interactions. Notably, these corrections are not symmetric; the relative increase of $c_1$
from wave 2 depends on the ratio of
$c_1$
from wave 2 depends on the ratio of $k_1/k_2$
whereas the relative increase of
$k_1/k_2$
whereas the relative increase of $c_2$
from wave 1 solely depends on wave 1.
$c_2$
from wave 1 solely depends on wave 1.
From these third-order solutions, including corrections to the phase speeds, we can constrain the fourth-order mean Lagrangian drift $\langle x_\tau \rangle$
from the mean pseudomomentum at each vertical level. This yields
$\langle x_\tau \rangle$
from the mean pseudomomentum at each vertical level. This yields
 \begin{align} &\langle x_\tau \rangle = \epsilon _1^2c_1e^{2 k_1\beta } + 2\epsilon _1^4 e^{4 k_1 \beta }\sqrt {\frac {g}{k_1}} + \epsilon _2^2c_2 e^{2 k_2\beta } + 2\epsilon _2^4 e^{4 k_2 \beta }\sqrt {\frac {g}{k_2}} \nonumber \\ &\quad +\epsilon _1^2 \epsilon _2^2 \bigg ( \frac {\sqrt {g}\big(\sqrt {k_1}-\sqrt {k_2}\big)^2 \big(\sqrt {k_1}+\sqrt {k_2}\big)^3}{k_1^2 k_2}e^{2(k_2-k_1)\beta } + \frac {\big(\sqrt {gk_1}+\sqrt {g k_2}\big)(k_1+k_2)^3}{k_1^2 k_2^2}e^{2(k_1 + k_2)\beta } \nonumber \\ &\qquad \qquad \qquad \qquad \qquad \qquad \qquad \qquad \qquad \qquad \qquad - 2\frac {k_2\big(\sqrt {g k_1} + \sqrt {g k_2}\big)}{k_1^2}e^{2 k_2 \beta }\bigg ), \end{align}
where $c_1$
and
$c_1$
and $c_2$
include nonlinear corrections (B9)–(B10). Reassuringly, the ‘monochromatic terms’ for each wave (i.e. those not multiplied by
$c_2$
include nonlinear corrections (B9)–(B10). Reassuringly, the ‘monochromatic terms’ for each wave (i.e. those not multiplied by $\epsilon _1^2 \epsilon _2^2$
) exactly match the results found above for purely monochromatic waves (4.35). However, there are also interesting interaction terms which are best interpreted through certain limiting examples.
$\epsilon _1^2 \epsilon _2^2$
) exactly match the results found above for purely monochromatic waves (4.35). However, there are also interesting interaction terms which are best interpreted through certain limiting examples.
In the case where $k_2 \gg k_1$
, such that we are considering the dynamics of a short wavelength wave riding atop a long wavelength wave, we see from (B9) that the modification to the phase speed of the long wave from the short wave is negligible. However, the phase speed of the short wave is modified by the long wave, precisely by the surface mean Lagrangian drift of the long wave, indicating that the short wave is mainly advected by the surface mean Lagrangian drift of the long wave, which varies much more slowly with depth and as such acts as a constant external current. The mean Lagrangian drift for this limit can be written
$k_2 \gg k_1$
, such that we are considering the dynamics of a short wavelength wave riding atop a long wavelength wave, we see from (B9) that the modification to the phase speed of the long wave from the short wave is negligible. However, the phase speed of the short wave is modified by the long wave, precisely by the surface mean Lagrangian drift of the long wave, indicating that the short wave is mainly advected by the surface mean Lagrangian drift of the long wave, which varies much more slowly with depth and as such acts as a constant external current. The mean Lagrangian drift for this limit can be written
 \begin{equation} \langle x_\tau \rangle = \epsilon _1^2c_1e^{2 k_1\beta } + 2\epsilon _1^4 e^{4 k_1 \beta }\sqrt {\frac {g}{k_1}} + \epsilon _2^2c_2 e^{2 k_2\beta } + 2\epsilon _2^4 e^{4 k_2 \beta }\sqrt {\frac {g}{k_2}}, \end{equation}
where, interestingly, the interaction terms not connected to shifts in the phase speed vanish in this limit, which matches very well with the idea that nonlinear wave–wave interactions are strongest between waves of similar wavenumbers (Hasselmann Reference Hasselmann1962). Therefore, the total mean Lagrangian drift in this long–short wave system can be expressed as a sum of an unmodified long wave drift and a short wave drift whose phase speed is Doppler shifted by the surface drift of the long wave.
Next we can consider the limit where $k_2 = k_1 + \delta k$
, where
$k_2 = k_1 + \delta k$
, where $\delta k$
is small and positive, so that the wave field appears as a series of groups. To lowest order,
$\delta k$
is small and positive, so that the wave field appears as a series of groups. To lowest order, $k_1/k_2 \approx 1$
and the Doppler shift of each wave is symmetric, with the drift given by
$k_1/k_2 \approx 1$
and the Doppler shift of each wave is symmetric, with the drift given by
 \begin{align} \langle x_\tau \rangle = \epsilon _1^2 \left(1 + \frac {1}{2}\epsilon _1^2\right) e^{2 k_1 \beta }\sqrt {\frac {g}{k_1}} +\epsilon _2^2 \left(1 + \frac {1}{2}\epsilon _2^2\right) e^{2 k_1 \beta }\sqrt {\frac {g}{k_1}}+ 2 \big( \epsilon _1^4 +\epsilon _2^4\big) e^{4 k_1 \beta }\sqrt {\frac {g}{k_1}} \nonumber \\ +\epsilon _1^2 \epsilon _2^2 \big (16 e^{4k_1\beta } - 2 e^{2 k_1 \beta }\big )\sqrt {\frac {g}{k_1}} + O(\delta k ). \end{align}
Here, we see that, in addition to the standard fourth-order monochromatic drift of each wave, there is a fourth-order interaction term which is positive near the surface, zero at $k_1\beta \gt ({1}/{2})\ln (1/4)$
, and negative below, analogous to what was found for wave packets via a narrow-banded approach in § 4.
$k_1\beta \gt ({1}/{2})\ln (1/4)$
, and negative below, analogous to what was found for wave packets via a narrow-banded approach in § 4.
In both of these limits, the two waves interact to produce fourth-order positive corrections to the near surface mean Lagrangian drift, which match the results presented in this paper. However, given the analytical difficulty of deriving a higher-order mean Lagrangian drift for even this relatively simple system, it is unlikely that such a direct approach will prove useful for more complex wave configurations.


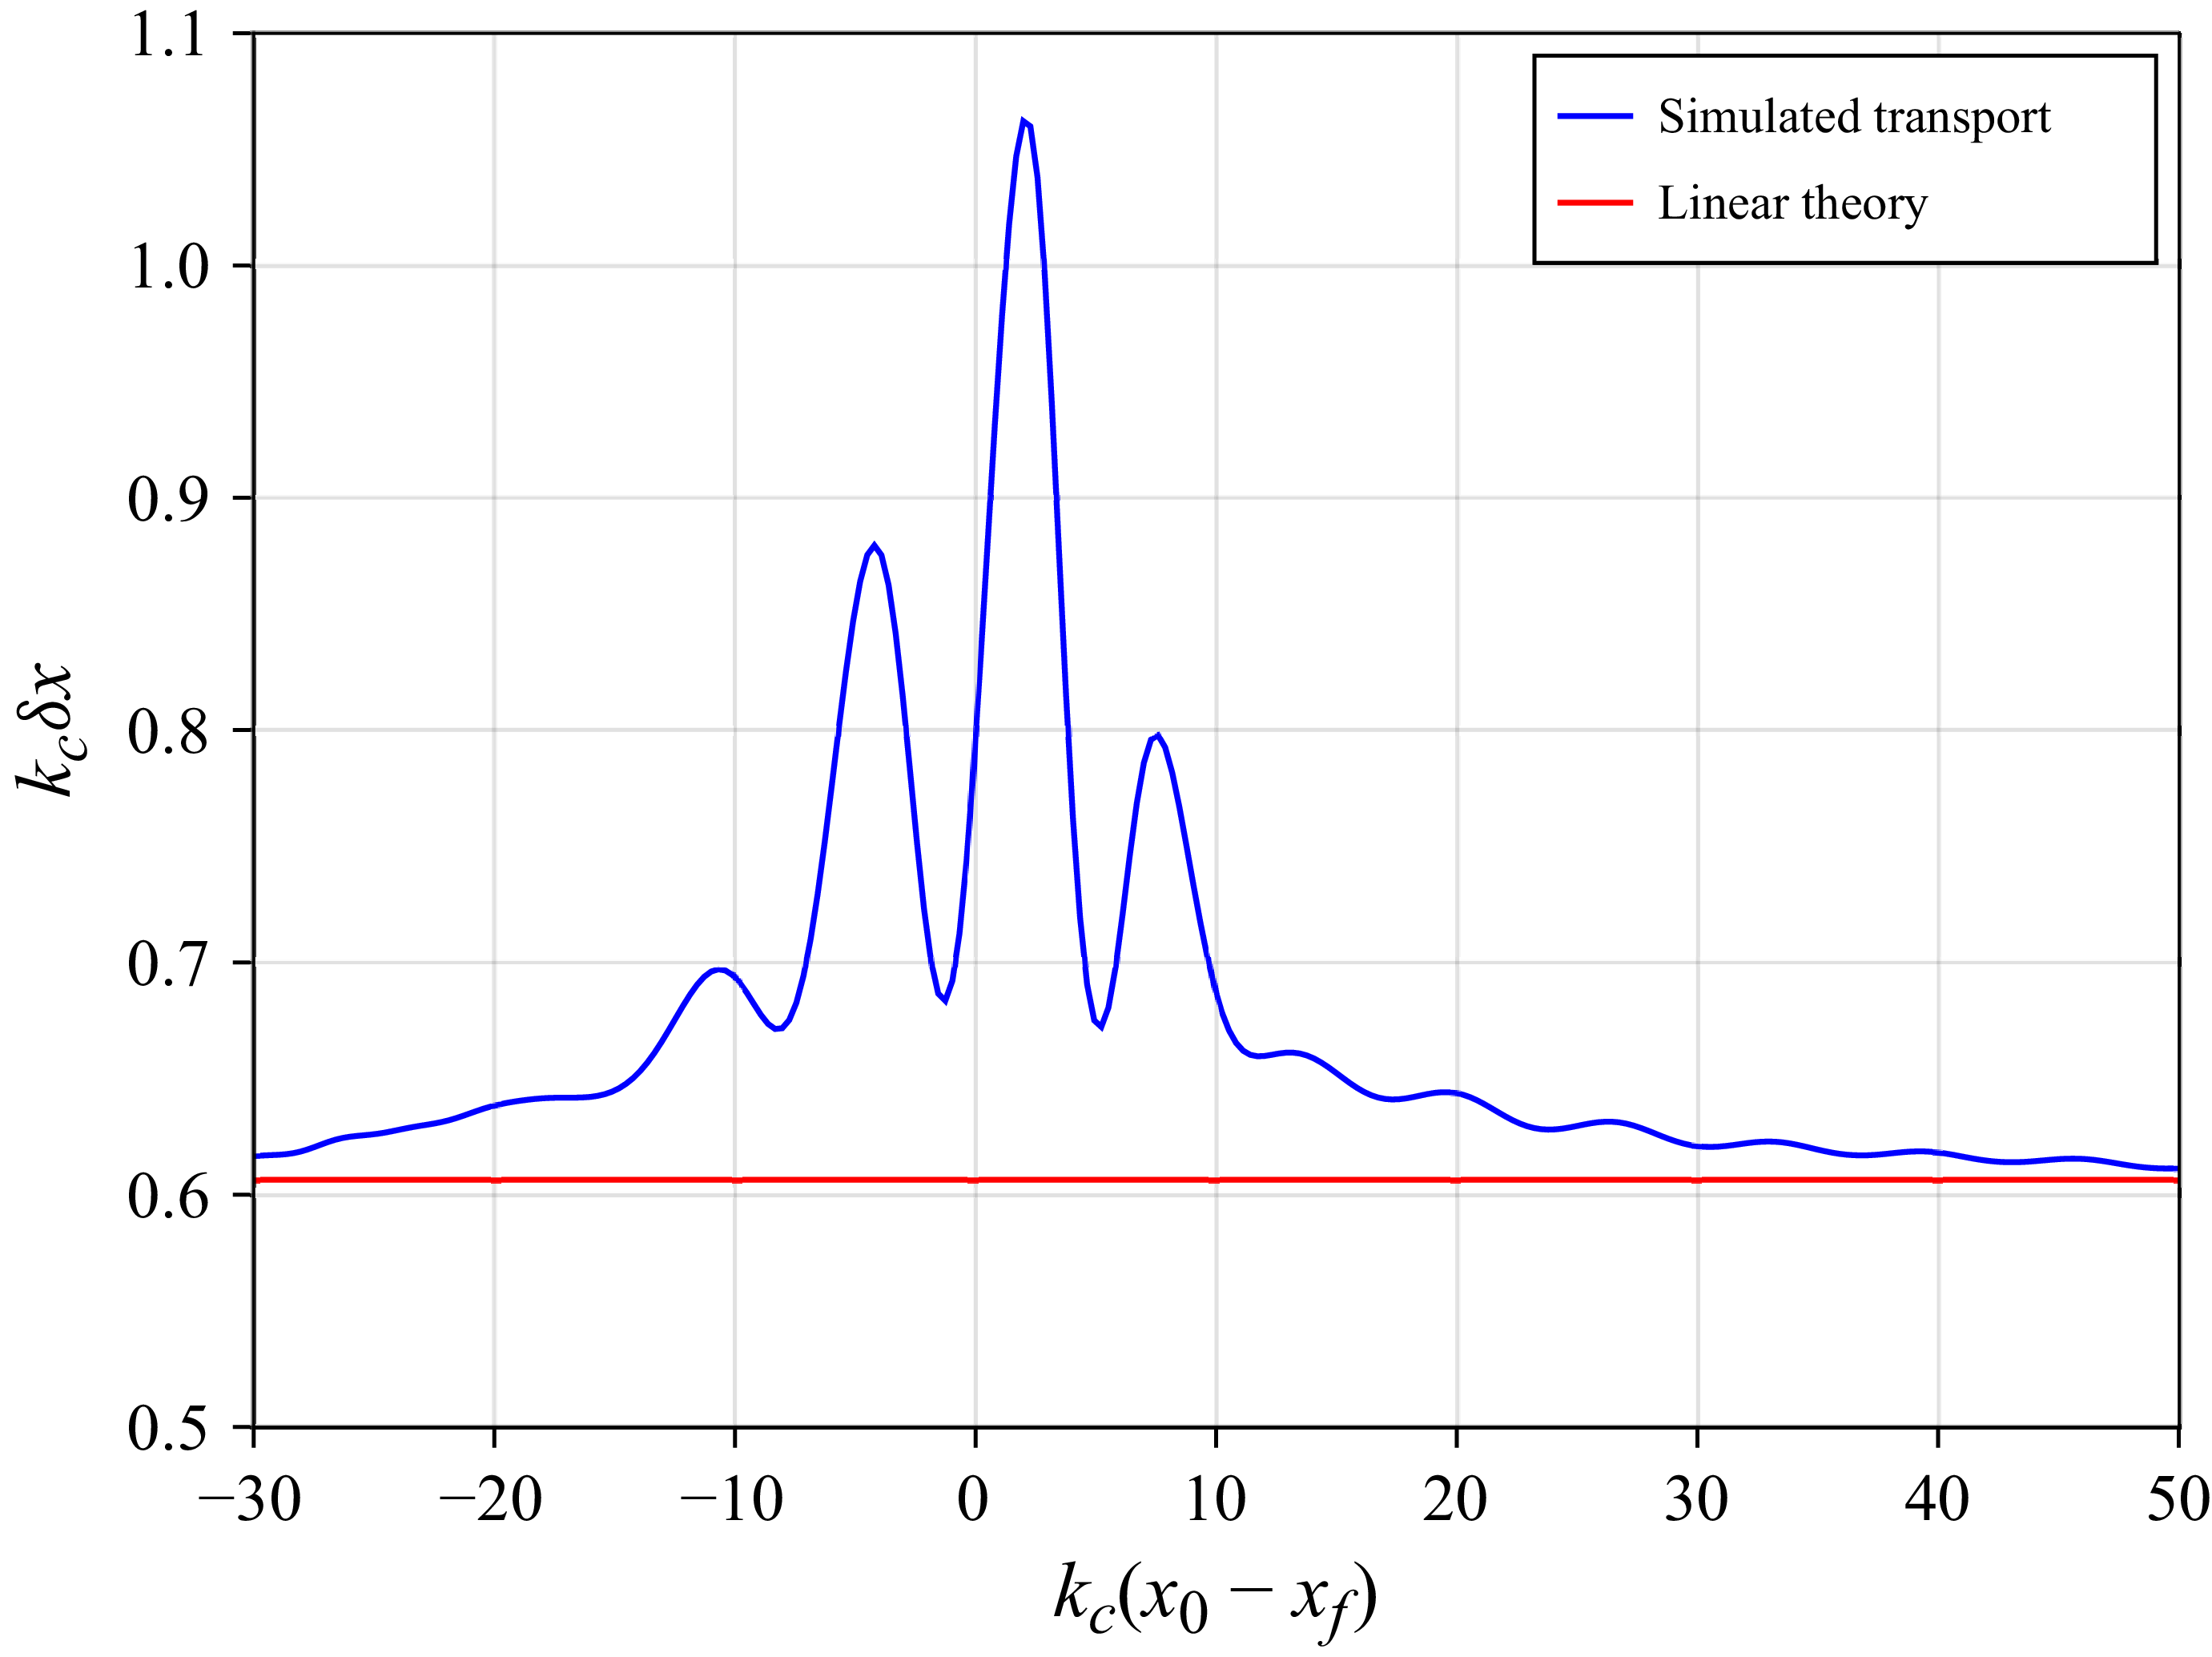


 Open access