


Introduction
The minimum wage (MW) can be assessed from different points of view. It can be considered in terms of its consequences for such factors as poverty, wage distribution, gender pay equity, labour productivity, and capital substitution. In this paper, we study only the potential consequences of a substantial rise in in the MW on employment in Spain. The relationship between the MW and employment has been extensively examined in the literature, but the consequences of an increase in the MW on the labour market are by no means unanimously agreed upon.
The many theoretical models that seek to explain the effects of the MW on the labour market can be broadly classified into two streams. The first stream comprises those predicting a reduction in labour demand in response to an increase in wage costs due to the increase in the MW. In the second stream are models that other predict that rising wages translates into an increase in domestic consumption and aggregate demand, which, in turn, will increase the need for labour. This paper aims to provide empirical evidence on the effect of an increase in the MW on employment. Raising the MW has an impact on many variables, such as inequality, poverty, and productivity. The literature on this topic is huge, so this paper focuses its analysis on the impact of the MW on employment, specifically in the case of Spain, where the nominal MW rised by 22.3% (21.6% in real terms) in 2019. This increase was double that of the previous increase and four times the average rate of growth over the previous 25 years. Employment will be measured using the EUROSTAT Labour Force Survey (LFS), which provides homogenised data for all EU member states. Quarterly data on the gross number of employees are used, and their annual rate of change is calculated for each quarter.
The method adopted here is impact evaluation, which aims to determine the effect attributable to a shock. Specifically, this study uses the synthetic control method (SCM), which is based on the difference in differences technique. Difference in differences compares the outcomes for individuals who are the recipients of a policy or who have suffered an exogenous shock (the treatment group) with another set of individuals not affected by this shock (the control group). In this comparison, the aim is to ensure that the two groups are identical on all relevant variables other than whether or not they have been affected by the policy. The peculiarity of the SCM is that the control unit is composed of a weighted configuration of possible elements, improving the similarity between the two groups for all variables other than the shock under study.
In Spain, there was an unprecedented increase in the MW in 2019. A descriptive analysis suggests that there were no evident effects on employment. The present contribution tests a hypothesis based on this suggestion that:
“No effect on employment was caused by the 2019 22% increase in the minimum wage.
Robust testing requires rigorous impact analysis, hence the SCM was chosen to quantify the changes in the number of people employed after the implementation of the policy. This is particularly important because there is now the political will in Spain to continue raising the MW until it reaches 60% of the average wage. To this end, a commission of experts, together with the Ministry of Labour and Social Economy, is enacting a plan to achieve this objective (Ministerio de Trabajo y Economía Social 2021). It will, therefore, be vitally important to have obtain evidence that can support future increases in the MW.
The second part of this paper reviews the theoretical and empirical approaches to the relationship between the MW and employment, while part three reviews the MW in Spain. The methodology and the empirical data are outlined in part four, followed by the main results in part five, and a robustness analysis is carried out using various tests, in part six. Finally, part seven outlines conclusions.
Relationship between minimum wage and employment
The relationship between the MW and employment is frequently addressed from a theoretical point of view in the literature, the most analysed issue being the effect of the MW on the workers potentially affected by it. However, studies are inconclusive on the possible causality involved in MW regulation (Lacuesta Reference Lacuesta2019). An increase in the MW does not have an unequivocal impact on the labour market. This is because the labour market is pulled in two opposing directions: between, on the one hand, the possibility of rising unemployment resulting from a reduction in labour demand due to rising labour costs, and on the other hand, rising labour demand to increase production, resulting from the rise in domestic consumption stimulated by rising population incomes.
The impact of a nominal MW increase on employment has been widely discussed in the literature (Barrera Lozano Reference Barrera Lozano2018), as have the employment adjustment mechanisms after its implementation (Fernández Kranz Reference Fernández Kranz2020) and the specific labour market characteristics (Azar et al Reference Azar, Huet-Vaughn, Marinescu, Taska and Von Wachter2019). The impact of the MW on variables other than employment has also been extensively studied. For example, Glasner (Reference Glasner2023) argues that raising the MW would reduce entrepreneurship by reducing the number of self-employed with no employees. Wye and Bahri (Reference Wye and Bahri2021) found that, regardless of whether there is an increase in employment following an increase in the MW, there is an increase in GDP per capita and a decrease in foreign direct investment. Jung et al (Reference Jung, McFarlane and Das2021) studied the effect of MW on consumption finding that a 1% increase in MW leads to a 0.5% increase in consumption. Mitre-Becerril and Chalfin (Reference Mitre-Becerril and Chalfin2021), using the SCM to assess the impact of a 60% increase in the MW over two years in Seattle, found a slight increase in unemployment for low-wage workers and young people.
Increases in the MW are also linked in the literature with the underreporting of wages. An analysis of the relationship between the MW and tax evasion finds that small firms are more prone to tax evasion. In addition, workers with a wage slightly above the new MW suffer more unemployment after the policy than those between the previous and the new MW (Gavoille and Zasova Reference Gavoille and Zasova2023).
The SCM has been used to assess the effects of the MW in the United States. Powell uses the SCM to determine the elasticity of jobs in the United States. The paper provides evidence of the advantage of the SCM for the impact of the MW, compared with the parallel trend technique, which is widely used in the literature (Powell Reference Powell2022).
Several empirical analyses have been conducted on the impact of MWs on employment. Some systematic literature reviews from the United States and European countries are presented. For example, Cengiz and coauthors estimate the effect of 138 major changes in the MW between 1979 and 2016 in the United States. The authors set a post-treatment analysis period of 5 years to observe the effect of the policy. They conclude that these MW increases do not reduce the employment of the affected workers (Cengiz et al Reference Cengiz, Dube, Lindner and Zipperer2019).
By contrast, Paun et al (Reference Paun, Nechita, Patruti and Topan2021) analyse the impact of MWs in 22 European countries between 1999 and 2016. The study finds that, in the cases analysed, increases in the MW have a negative impact on employment, affecting young workers and women to a greater extent, whereas the employment of workers over 55 years of age is most resilient (Paun et al Reference Paun, Nechita, Patruti and Topan2021).
The results of introducing the MW for the first time in contrast to where an increase in the MW is evaluated are relevant. In Germany, the MW was introduced in 2015 and set at €8.50 per hour. At its introduction, 15% of German workers had wages below this new minimum. This increase in the wage cost translated into higher wages for low-income earners without leading to a reduction in employment. The main consequence of this measure is that workers were reallocated from low-wage jobs to higher-paying jobs after the introduction of the MW (Dustmann et al Reference Dustmann, Lindner, Schönberg, Umkehrer and Vom Berge2022).
The Hungarian MW almost doubled in nominal terms between 2000 and 2002, although it should be noted that inflation in Hungary was then close to 10% per year. Of the 290,000 employees affected by the MW increase, an estimated 30,000 jobs were lost, less than 0.1 per cent of the total number of workers in the country. On the other hand, the rest of the workers affected by the wage increase experienced a 60% increase in wages (Harasztosi and Lindner Reference Harasztosi and Lindner2019).
Among the methods used to analyse the effects of MW are quasi-experiments comparing a group affected by the policy with another group unaffected. The aim here is to compare the evolution of employment in the area where the MW has been introduced or increased with the outcome that would have occurred in the absence of the measure. Most studies use the difference-in-difference technique, which allows the treatment group to be compared with a control group or counterfactual, which is essential for evaluating the impact of the MW (Dube Reference Dube2019). The SCM performs a similar difference-in-differences analysis by improving the selection of the control group. It becomes a more appropriate technique for our analysis because it reduces selection bias.
The first empirical case study of the difference in differences impact evaluation technique studied the effect of the MW on employment, evaluating an increase in New Jersey’s MW in 1992 in which no effect on employment was found (Card and Krueger Reference Card and Krueger1993).
Dube (Reference Dube2019) reviewed empirical studies at the international level of the effects of a relevant increase in the MW, that is, one whose increase can be determined as a shock to the labour market. According to Dube, most experiments relating MWs and employment find results close to zero, although in contrast, Neumark and Shirley (Reference Neumark and Shirley2022) found that most empirical exercises showed some negative employment effects, particularly for young, low-paid, and low-educated workers.
A limitation of differences in differences is the selection bias of the counterfactual. To overcome this problem, the SCM gives us the best counterfactual available. Identifying states and their delimitation is essential to obtain a robust analysis (Neumark et al Reference Neumark, Ian Salas and Wascher2014). In a review of 29 case studies analysing the impact of the MW on employment using this method, none were found to have negative effects on employment in the three years following the implementation of the measure (Dube and Zipperer Reference Dube and Zipperer2015).
In Mexico, the MW was doubled in 2019 in cities bordering the United States. An impact evaluation was carried out using the SCM and creating a control group from the rest of the country where the policy was not implemented. The study found a positive effect on wages and no significant impacts on employment. In this case, the increase in the MW did not lead to an increase in unemployment (Campos-Vazquez and Esquivel Reference Campos-Vazquez and Esquivel2021).
The minimum wage in Spain
The MW is a crucial variable for the labour market and is used as a reference in the development of a range of policies (Aguilar-Hendrickson and Arriba González Reference Aguilar-Hendrickson and Arriba González2020). Spain has had MW regulation since 1963. There, it is defined as the minimum monthly wage for a full-time worker, regardless of the work performed. For part-time workers, the amount is proportional to the number of hours worked. The MW is revised periodically (at least, once a year). In so doing, the government must consult trade unions and employers’ associations on the annual increase in the MW, although these consultations are not binding (Pérez del Prado Reference Pérez del Prado2017). Ultimately, the determination of the MW in Spain is left to the government’s discretion and will consider factors such as inflation, productivity, the share of labour in national income, and the economic situation.
The 22% increase in the nominal MW in 2019 resulted in an agreement between trade unions, employers’ organisations, and the government. This increase led to a major social debate about its consequences as it was the largest ever percentage increase in the MW in both nominal and real terms. Many newspapers highlighted the expected massive loss of employment among lower-paid workers and posited a consequent increase in unemployment. Those favouring the increase based their arguments on notions of equity and redistribution.
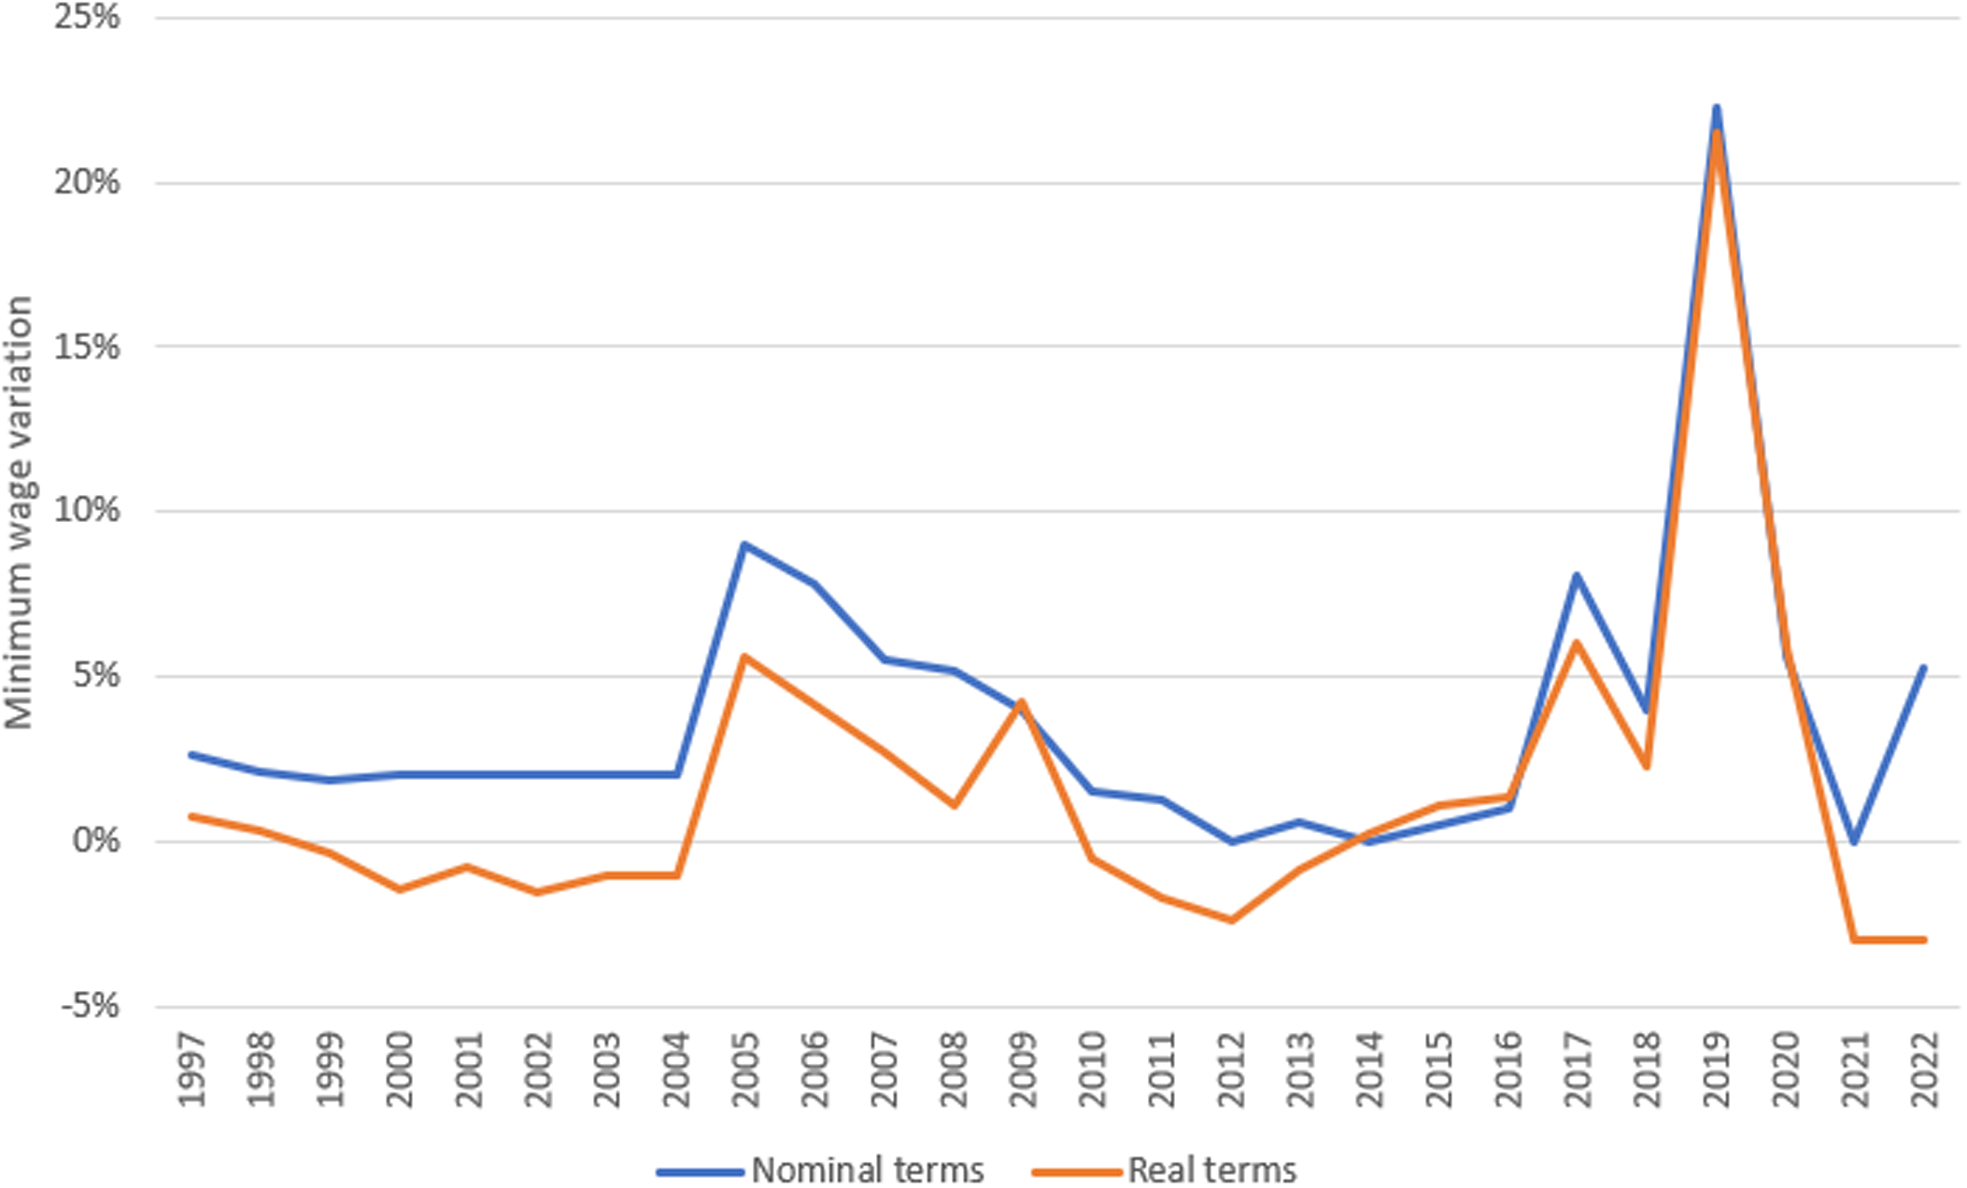
The increase from €735.90 to €900 in the monthly MW can be seen in Figure 1, which shows both the nominal MW and the changes in the real MW over the last forty years. It was an unprecedented increase of over 20%, twice as much as the previous highest percentage increase (2005) and four times the average annual increase over the previous 25 years, when the average annual rate of increase of the MW in Spain was 5% (Barceló et al Reference Barceló, Izquierdo, Lacuesta, Puente, Regil and Villanueva2021). This measure positioned Spain as the country with the second highest Kaitz index (ratio of the MW to the average wage), among European Union countries. In contrast, in 2018, Spain had been the country with the third lowest rate. Undoubtedly, this rise in MW represents a shock to national labour costs.
Evolution of the nominal MW in Spain and its annual variation.
Source: Prepared by the authors based on data from the INE [Instituto Nacional de Estadística (Spanish National Statistical Institute)].
The increase in the MW in 2019 directly affected 7% of employees. The main beneficiaries were women, young people, immigrants, and workers with primary or secondary education. In terms of employment sectors, the impact of the wage increase was greatest in shopping, hotels and restaurants, and agriculture and fishing (Granell et al Reference Granell, Fuenmayor and Savall2022).
The important question, then, is what impact, if any, did this increase in the MW have had on employment and the labour market. Descriptive data following the increase in the MW do not appear to show significant changes in employment, as can be seen in the following figures.
Figure 2 shows the unemployment rate in Spain between the first quarter of 2010 and the fourth quarter of 2022 according to data from the LFS produced by the Spanish National Statistical Institute (INE). After the increase in the MW was implemented, there was no increase in the unemployment rate; indeed, unemployment mainly followed the downward trend that had been seen in previous years. However, it is worth noting that the increase in the unemployment rate during 2020 was largely due to measures adopted to prevent the spread of the COVID-19 pandemic. These included the closure of economic sectors, which caused an increase in the unemployment rate. In the findings of this article, attention will be paid to the impact of COVID-19 on employment.
Unemployment rate 2010–2022.
Source: Prepared by the authors based on the INE Labour Force Survey.
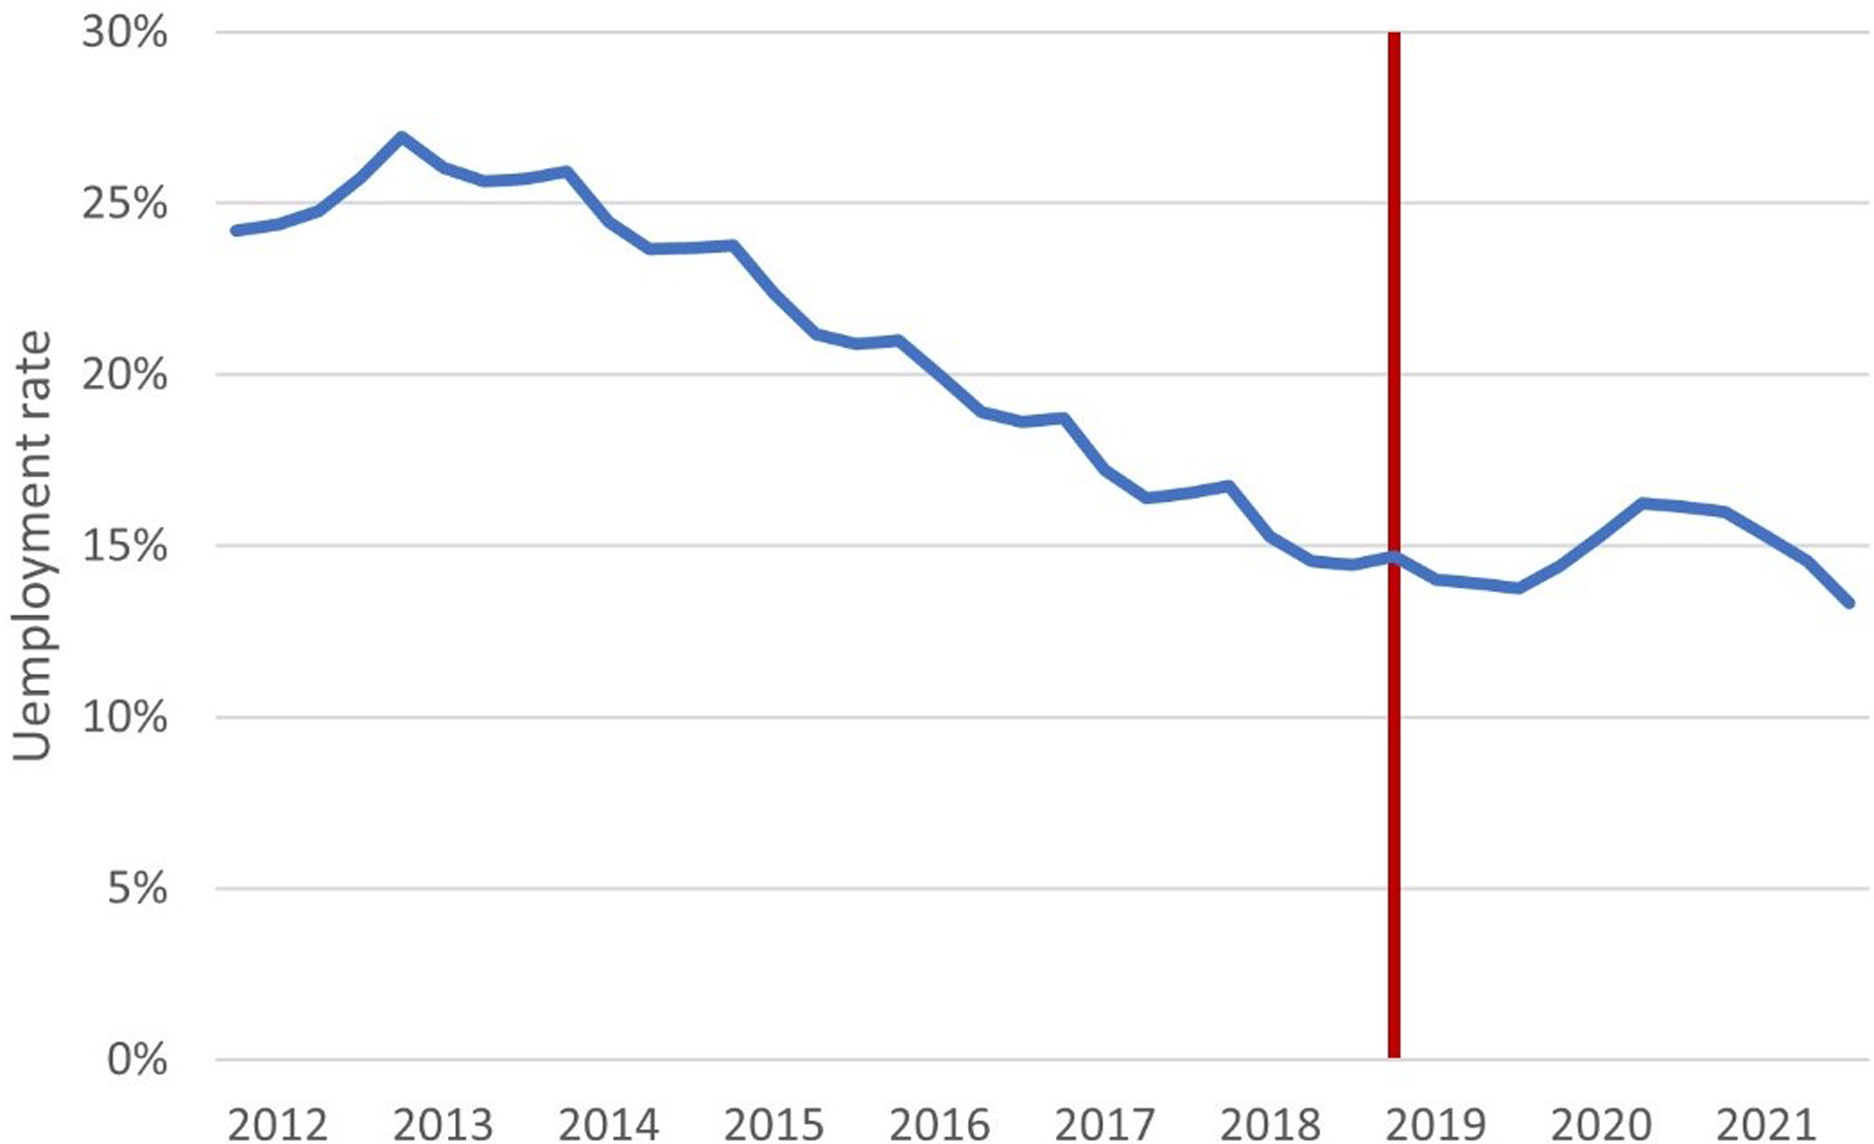
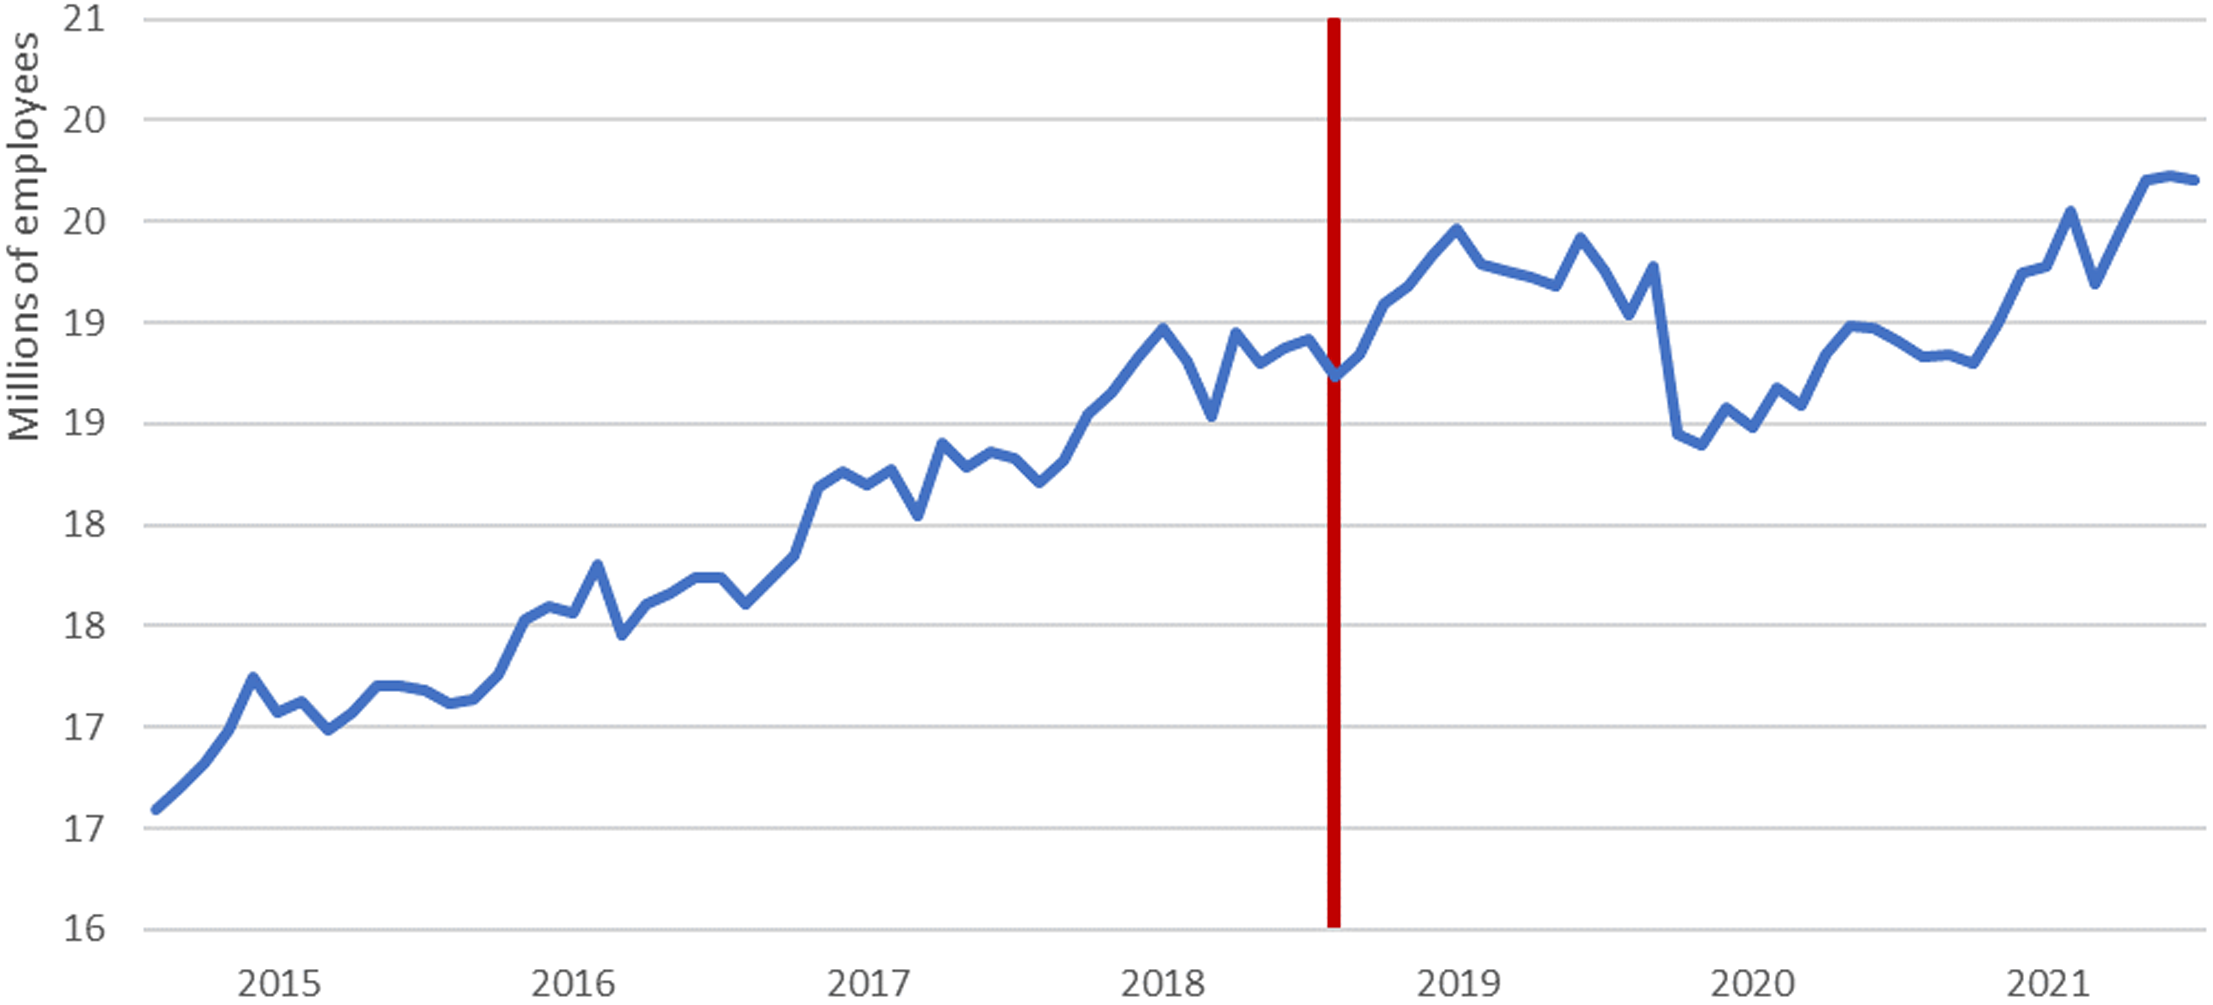
Nevertheless, the increase in the MW does not appear to have influenced the unemployment rate. Rather, unemployment has been affected by a range of other factors, including an increase in the labour force, so the effect on the unemployment rate is indeterminate. For this reason, in addition to the unemployment rate, it is relevant to visualise the changes in the numbers of social security contributors; the number of active workers in the country is shown in Figure 3, with a monthly periodicity between 2015 and 2022. Whereas the LFS gives us the percentage of jobseekers out of the total active population, social security affiliation shows the actual number of active workers in Spain from administrative data, given that the social security enrolment statistics show the number of active employees in each month. This register, however, does not include civil servants and excludes unemployed contributors. Trends in the unemployment rate and the number of social security contributors have not apparently been affected by increased labour costs. However, the annual cyclical component of these indicators should be taken into account. These changes occur over a short period, and the question of how these effects are related to the measure implemented will need to be studied carefully. Like Figure 2, the impact of the lockdown is reflected in Figure 3, where there is a steep decline in the number of social security contributors in the first half of 2020.
Number of Social Security Contributors 2015–2022.
Source: Prepared by the authors based on data from the Ministry of Inclusion, Social Security and Migration, 2021.
Therefore, a first descriptive analysis shows no increase in unemployment after the 22% increase in the MW. However, this paper aims to go beyond descriptive analysis by attempting to establish an empirically demonstrable causal relationship between wage cost increases and the unemployment rate by using impact evaluation techniques.
The Spanish labour market has peculiarities that make it an exception among European countries. According to Eurostat’s Labour Source Survey, both the Spanish unemployment rate and the temporary employment rate are considerably higher than in most other EU Member States. Only Greece has similar data to Spain.
Several ex-post evaluations of the 2019 MW increase have been published. The first evaluation of the increase of the MW in 2019 was undertaken by the Spanish trade union “Comisiones Obreras”. According to this study, there was no decrease in employment during the first quarter of the implementation of this measure. Moreover, the groups most affected by this increase had also not experienced a decline in employment (Comisiones Obreras 2019).
Another study carried out by AIReF (Autoridad Independiente de Responsabilidad Fiscal [Spanish Independent Authority for Fiscal Responsibility]) determined that 2019 would see a slower pace of employment growth than the previous year. The negative effect on the number of social security contributors was estimated at between 0.13% and 0.23%, implying a loss of between 19,000 and 33,000 members in 2019. These results were obtained by comparing changes in the numbers of social security contributors in 2018 and 2019 (AIReF 2020).
Barceló et al (Reference Barceló, Izquierdo, Lacuesta, Puente, Regil and Villanueva2021), basing their study on the Continuous Sample of Employment Histories (Muestra Continua de Vidas Laborales, MCVL), estimated a net employment loss for workers directly affected by the increase in the MW of between 6 and 11 percentage points and a probability of job loss for affected workers of between 2 and 3 percentage points.
In some contrast, De La Rica et al (Reference De la Rica, Gorjón, de Lafuente and Romero2021), also using the MCVL, pointed to a null effect on employment in the first months of implementation of the 2019 MW but suggested there might be a gradual negative impact towards the end of the year. The results for men and women were projected to be similar although some loss of employment and a decrease in employment intensity was projected for young workers.
Using the difference in differences impact evaluation technique on the MCLV, Fernández-Baldor Laporta (Reference Fernández-Baldor Laporta2022) estimated an increase of between 0.38 and 0.44 percentage points in the probability of finding a job. Their results show an elasticity in line with that obtained by Barceló et al (Reference Barceló, Izquierdo, Lacuesta, Puente, Regil and Villanueva2021)
Other evaluations of the impact of the MW increase in 2019 focus on the workers affected by the wage increase. This paper seeks results for all workers. Also, whereas the control groups used in the studies discussed above are unaffected workers in the same labour market the analysis and evaluation conducted for this paper uses a control group whose labour market has not experienced a high increase in its MW. The SCM will create a control group that is empirically comparable with Spain. Once the control group has been designed, the evolution of the real variation in the employment rate in Spain and in synthetic Spain will be analysed to determine the possible impact of the increase in the MW.
Data and methodology
In view of the unusual growth in workers’ pay described in Section 3, the analysis of the evolution of the employment rate used here is the SCM, which consists of creating a control unit empirically comparable with the treated unit, Spain. Once the control group has been designed, the changes in the employment rates will be compared to determine the possible impact of the increase in the MW.
Impact evaluation techniques are used in this paper, the purpose of which is to isolate the effect directly attributable to a measure, independently of other circumstantial factors that may affect the outcome. For example, if an increase in the MW occurs in a period of strong economic growth, employment may be compensated by the second factor, offsetting the presumably negative effects of public regulation.
The first impact evaluation of an increase in the MW dates back to the 1990s. Card and Krueger (Reference Card and Krueger1993) studied the effect of an increase in the MW on employment in New Jersey in 1992. New Jersey was the treatment subject, and it was compared with the state of Pennsylvania, which was remarkably similar, except there was no increase in the MW. The analysis found no relevant effect of an increase in the MW on employment.
This paper, therefore, continues this literature, but it differs from Card and Krueger in that it uses the SCM to determine the treatments and control groups. This method constructs the control group as a combination of different units, weighted according to their similarity to the treatment group, so that this combination generates a unit identical to the treatment group. In this way, it overcomes the difficulty of finding a specific territory similar to the treatment unit (Craig Reference Craig2015). This method is especially useful when there is a set of similar countries to be compared. The control unit is formed by a combination of different countries, instead of having just one.
Comparison requires a pre-shock period where the treatment group and the control unit are statistically comparable. In the post-treatment period, a possible divergence between these groups will be observed, allowing us to establish a causal relationship and quantify the impact of the analysed measure.
The first application of the SCM can be found in Abadie and Gardeazabal (Reference Abadie and Gardeazabal2003), where the impact of the emergence of terrorism in the Basque Country on the region’s GDP per capita is studied. Years later, Abadie et al (Reference Abadie, Diamond and Hainmueller2010) generalised the use of the technique by applying it to a tobacco control measure in California, measuring its effect on tobacco sales. Following these applications, the method has been used in various situations to evaluate a shock affecting a specific territory. These developments of the SCM have been described by Ben-Michael et al (Reference Ben-Michael, Feller and Rothstein2021).
The sequence for this methodology is as follows. Having an exogenous shock (a substantial rise in MW), we compare what happened in real Spain (the treatment) in comparison with a similar country where this shock had not taken place (the control, or the counterfactual). What is specific in synthetic control is that a mixed country is constructed by combining real countries. For this reason, information from a set of similar countries needs to be considered as the data base. The design of this technique is based on a response variable, on which the impact of the exogenous shock is to be measured (in this case, the employment rate). A set of predictors is used: those variables that theory determines may be related to the response variable and are available. The comparison of reality with this counterfactual will enable us to establish whether the measure has led to significant changes in the response variable and, if so, to quantify its impact.
Creating the synthetic control group requires a combination of territories in (matrix W) and a weighting of the predictor variables in (matrix V). The root mean square prediction error (RMSPE) is used for this combination, that is, the difference between the values of the outcome variable for Spain and those of the possible control group at all time points in the pre-treatment period. The SCM tests all combinations of predictor variable weights and all candidate areas. The resulting control groups are compared and the option that minimises the RMSPE is selected: that is, of all the possible combinations, the one with the greatest similarity to Spain in the pre-treatment period is selected as the control group. This methodology seeks a control group in which the response variable and the treatment group are as similar as possible when comparing its response variable with that of the treatment group (Abadie Reference Abadie2021).
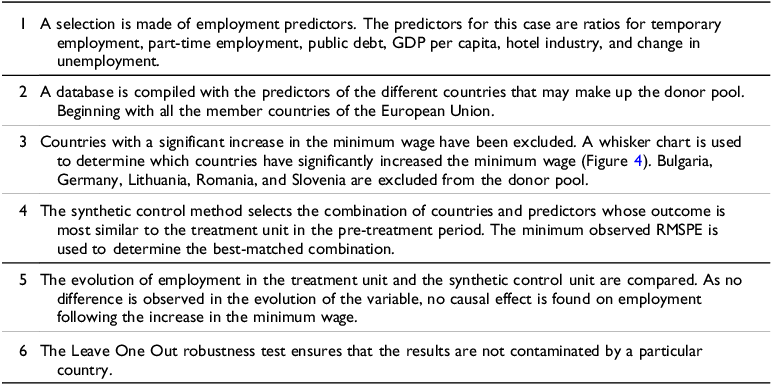
In this type of analysis, applying robust methods is essential to reinforce the validity of the results obtained. First, the so-called Leave One Out process will be applied: that is, each of the potential donor countries from those selected to be part of the control group is eliminated, in turn. The exercise is repeated to replicate the model in each case without one of the chosen countries. This neutralises the possible influence of a single country on the final results of the model. On the other hand, the model will be replicated for specific population groups, differentiated by gender and age, in order to test the evolution of the employment rate in these groups. Table 1 explains the step-by-step methodological process for obtaining the synthetic control unit applied in this case.
Synthetic control method development process. Source: Prepared by the authors
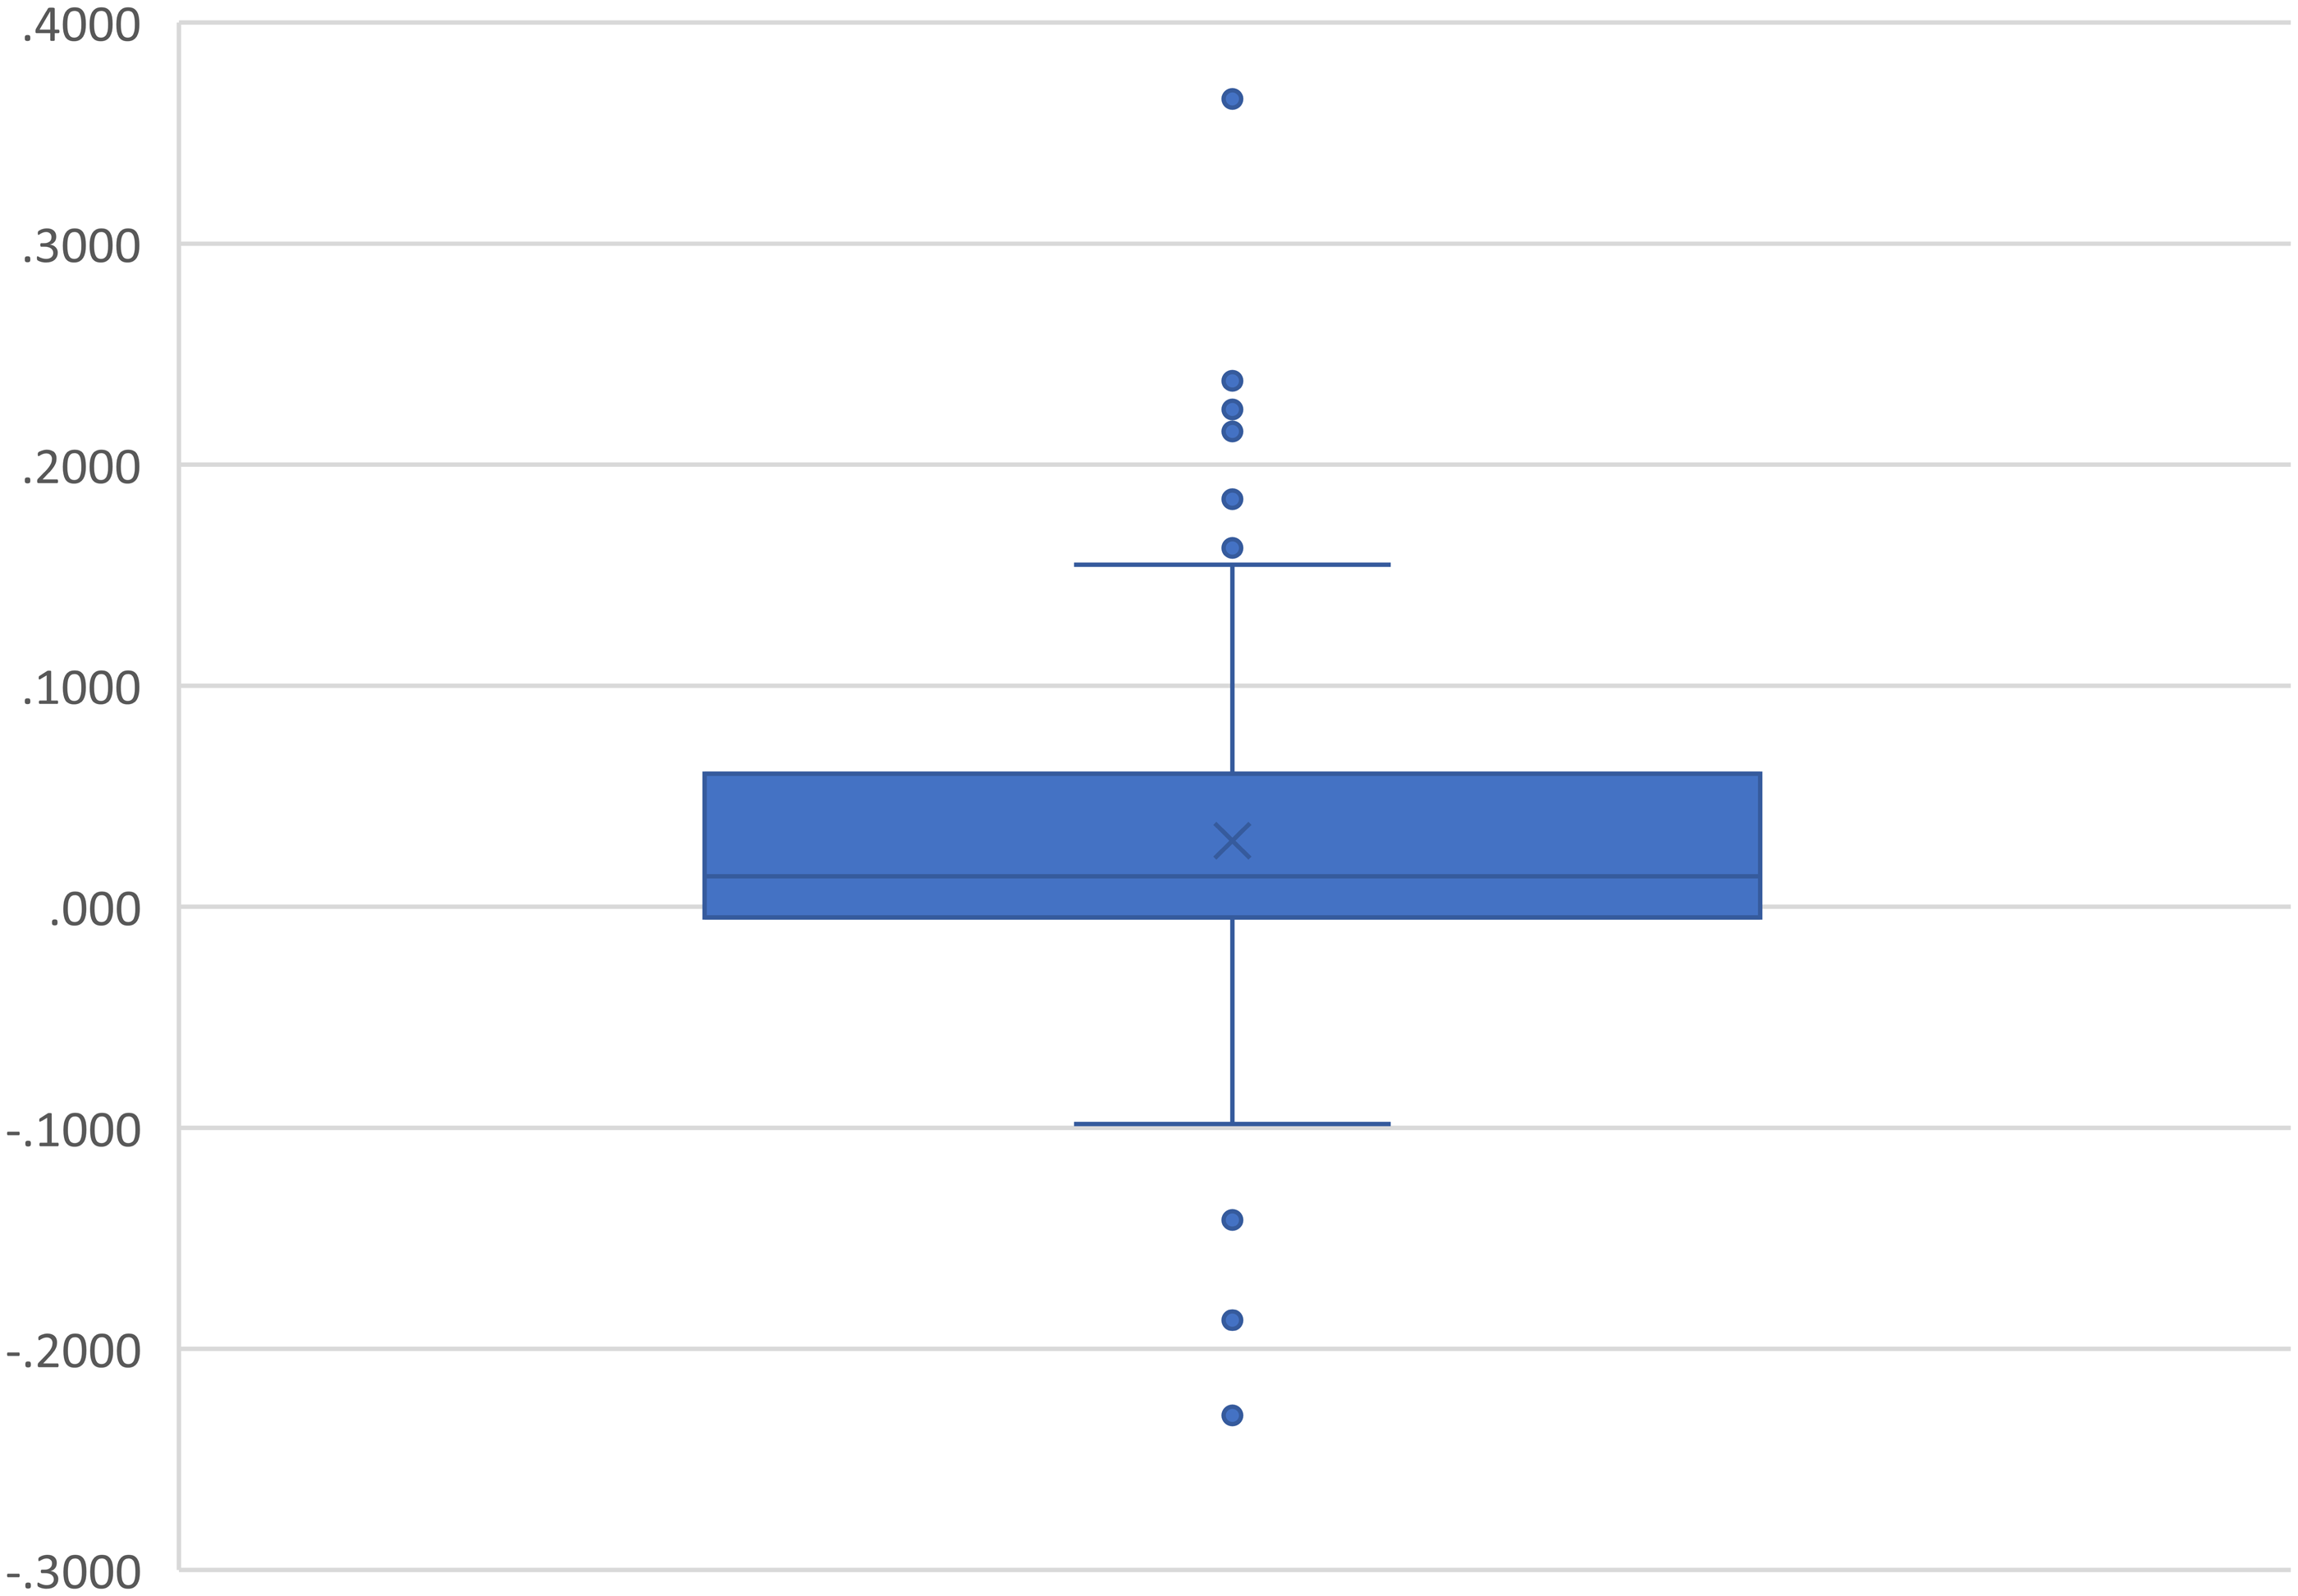
This application of the SCM is based on macroeconomic time series obtained from Eurostat. In this study, the effect of a shock on the response variable is measured on the basis of so-called predictor variables. A database is generated that includes all EU member countries. Among these countries, those that have applied an increase in their MW similar to that of Spain in the pre-treatment period are discarded. After identifying all annual increases, inflation is subtracted, so that we look for those countries that in have increased their real MW more than usual in a single year. These real MW increases have been plotted as outliers (those where an annual increase in their real MW exceeded 15%) in Figure 4. Bulgaria, Lithuania, Romania, and Slovenia are therefore excluded from the donor pool, while Germany is also excluded because it first introduced its MW in 2015.
Box-and-whisker plot of annual minimum wage increases in EU member countries.
Source: Prepared by the authors.
The period to be studied is from 2010 to 2021. This period includes a 9-year pre-treatment period in which the difference between the treatment group and the control group on the response variable is minimised, and a 4-year post-treatment period that will show the causal effect of an increase in the MW on employment. Special caution should be exercised with the data for the first quarter of 2020 (the first to reflect the effect of COVID-19) as not all European countries implemented their lockdown measures simultaneously.
The selected response variable will be the annual change in the employment rate because it captures the change in the number of employed people between one quarter and the same quarter of the previous year. The data were collected in the LFS. This is a quarterly LFS, which provides data on the labour market in member countries.
The predictor variables that determine the change in employment include the share of temporary employment, the share of part-time workers, the share of public debt in GDP, GDP per capita, the share of workers in the hotel and accommodation sector, and the change in unemployment. In the SCM, it is standard practice to include the lagged response variable (Ayala et al Reference Ayala, Martín-Román and Navarro2023). In this paper, variation in unemployment is also used as a predictor and, although it is not exactly the response variable, it maintains a correlation and reduces the RMSPE to a greater extent. This is standard practice in this type of analysis.
The configuration of the control group is based on the premise of minimising the mean square error. That is, we seek the weighted configuration of potential donor countries whose difference in the response variable (annual change in employment) is as small as possible with respect to the treatment country (Spain). The validity of the model is assured by obtaining the minimum RMSPE in the pre-treatment period: that is, achieving a weighted cluster with the smallest possible difference from the evolution recorded by the treatment unit. This RMSPE should be lower in the donor pool than in any of the individual donors.
Results
In order to obtain the synthetic control group, the focus should be on the pre-treatment period, where the trend of the control group is expected to be close to the trend set by the treatment (Spain). Weights are given to the various donor countries (EU states) and to the predictor variables (temporary employment rate, part-time employment rate, public debt, GDP per capita, employment in the accommodation and hospitality sectors, and change in unemployment) so that the difference between the treatment and the synthetic control minimises the mean squared error. This is achieved by configuring the synthetic control with 32% for Portugal, 28% for Ireland, 28% for Cyprus, 6% for Poland, and 6% for Croatia, as shown in Table 2.
Weighted composition of donor pool countries. Source: Prepared by the authors
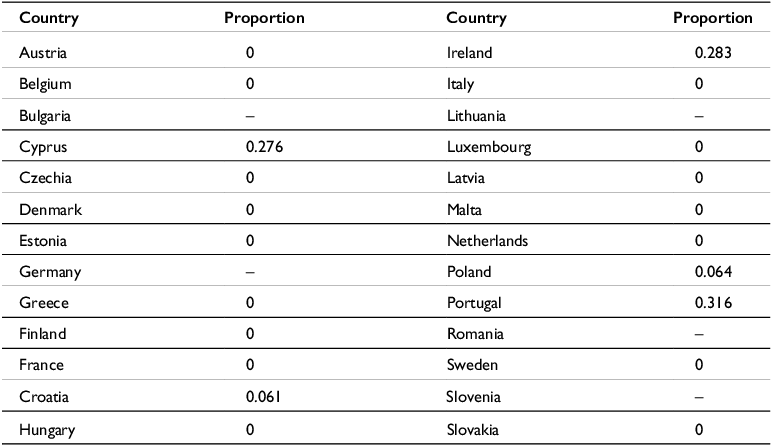
Table 3 sets out the assumed proportion of each predictor to minimise the RMSPE. The greatest weight is given to GDP per capita (in logarithms), with more than 30%; then the variation in unemployment, just under 23%; then hotels and accommodation, and public debt over GDP, each approximately 18%. The proportion of temporary employment and the percentage of part-time employment are less important in the weighting.
Balance of predictors. Source: Prepared by the authors
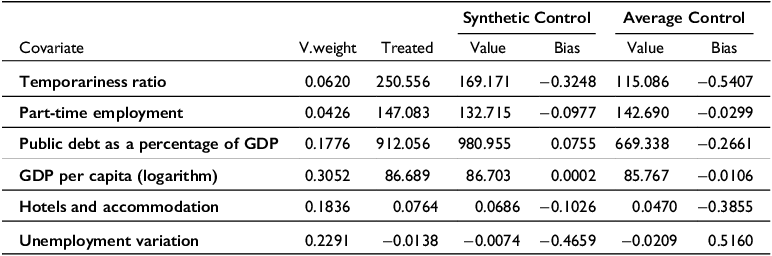
The values of the predictors for the treatment unit and the control unit resulting from these weightings are shown in Table 3. This technique aims to minimise the differences in these predictors between the two units.
Table 3 shows that the mean values of the synthetic control predictors maintain a difference with respect to the treatment unit that is smaller than the arithmetic mean of the donor pool. The exception is part-time employment, which will be corrected with the lowest weight found in the control group configuration, contributing only 4.3%. The high deviations in the proportion of temporary employment and the change in unemployment are noteworthy. Both the temporary employment rate and the unemployment rate in Spain are the highest average values of all the countries in the European Union; only Greece had higher unemployment than Spain, and both countries have much higher values than the rest. Therefore, no combination of countries will adequately replicate Spain’s values for these variables. In the case of unemployment, the rate of change has been chosen to correct the deviation of Spain with respect to the other countries. This variable may have positive or negative values, which could compensate for each other. However, in choosing the combination that best fits the real data for Spain, the squared difference is used, so that absolute values are compared.
Based on these choices of donors and predictor weights, a comparison of ‘real Spain’ and ‘synthetic Spain’ can now be made Thus, the effect of the increase in the MW in Spain will be compared with what would have happened if this measure had not been implemented (which is represented by the evolution of the control).
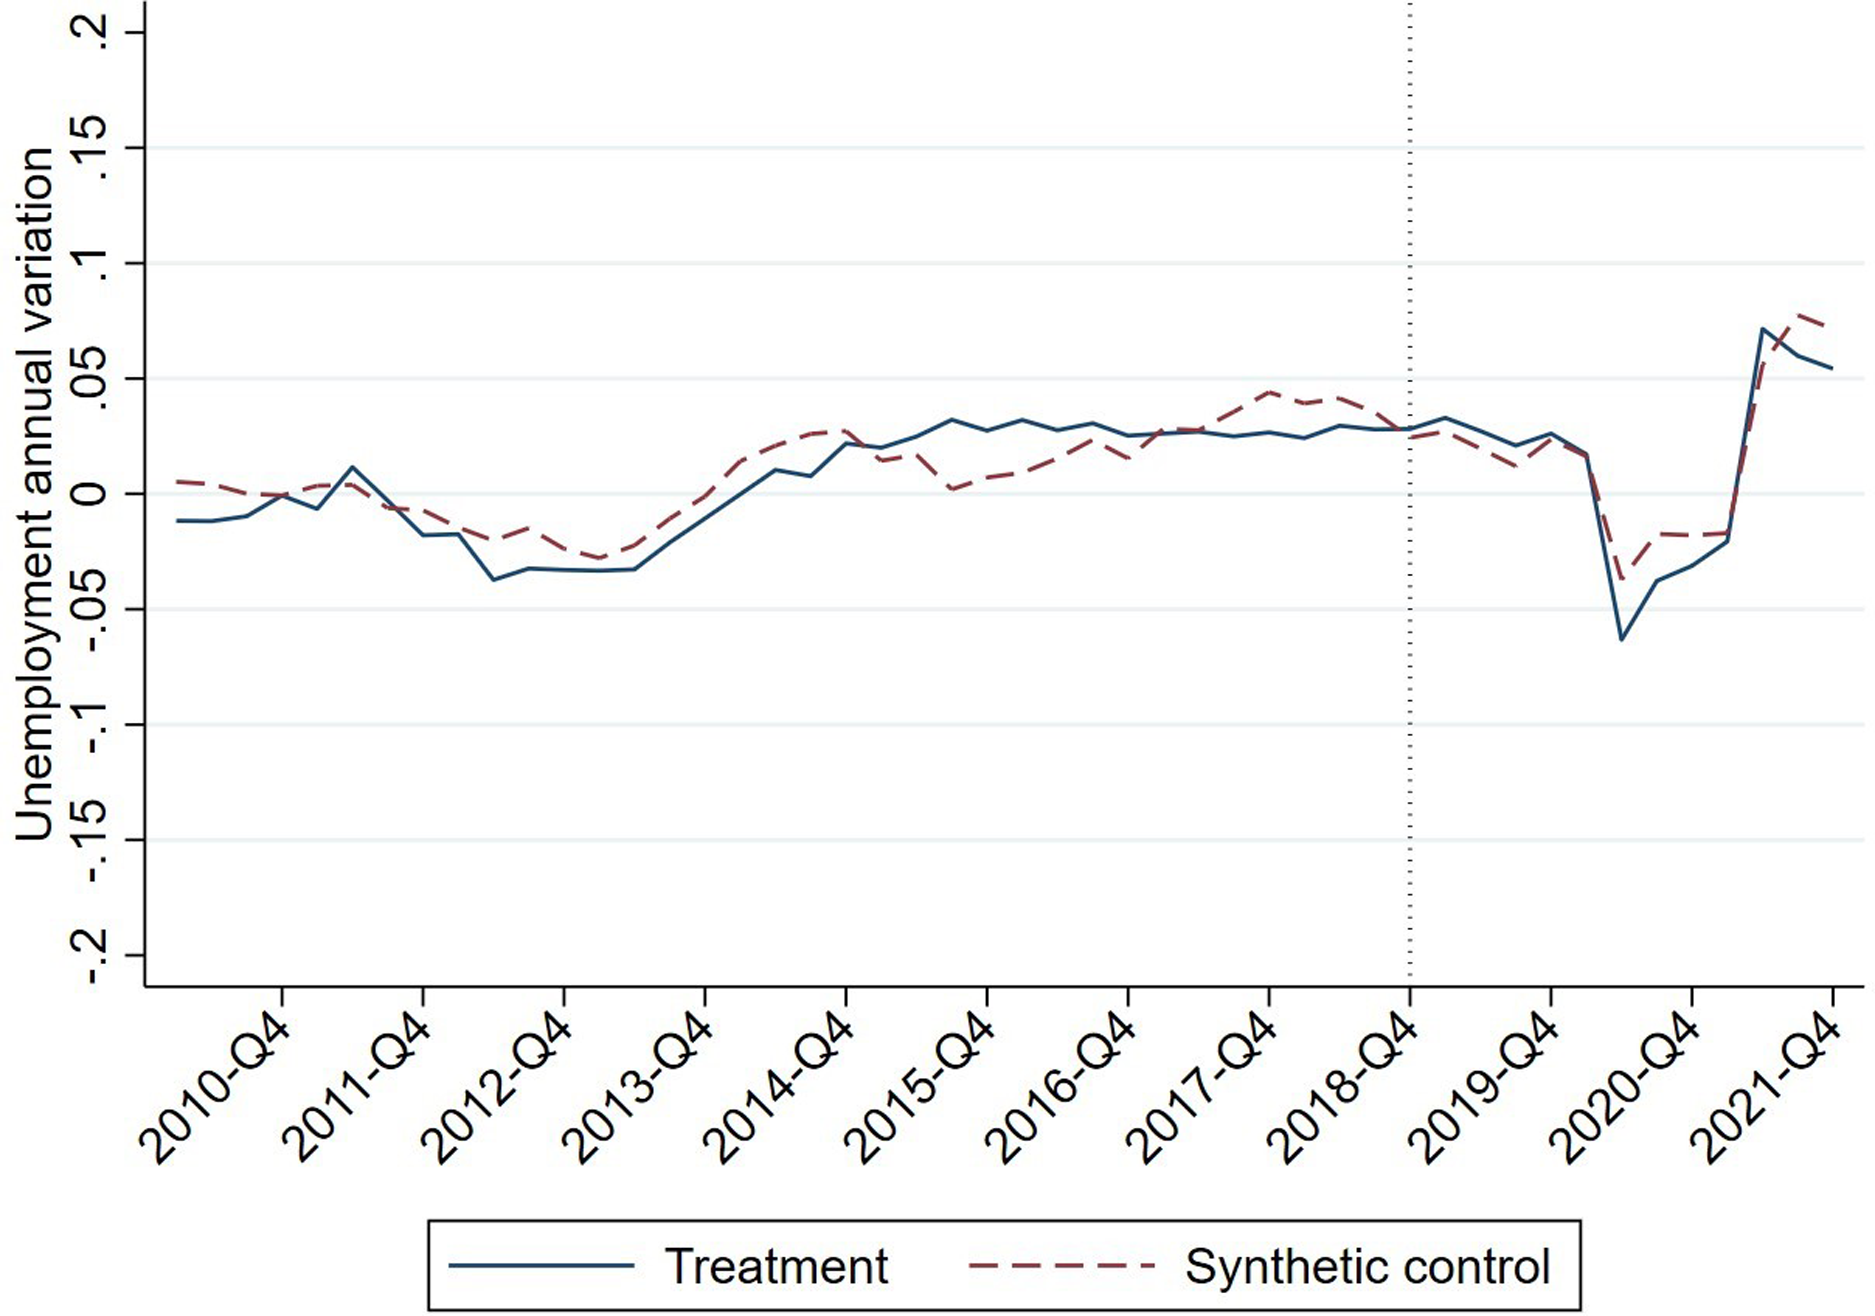
Figure 5 shows the evolution over time of the difference between the change in employment of the control unit and that of the treatment unit. That is, it reflects the distance between the real evolution of the rate of change of employment in Spain and the evolution of synthetic Spain. In Figure 5, the solid line shows the evolution of the variation in the use of the treatment (real Spain), and the dashed line shows that of the control unit, resulting from the application of the SCM. The vertical dashed line marks the point when the increase in the MW came into force, 1 January 2019.
Evolution of the variation in employment in the treatment and control unit.
Source: Prepared by the authors.
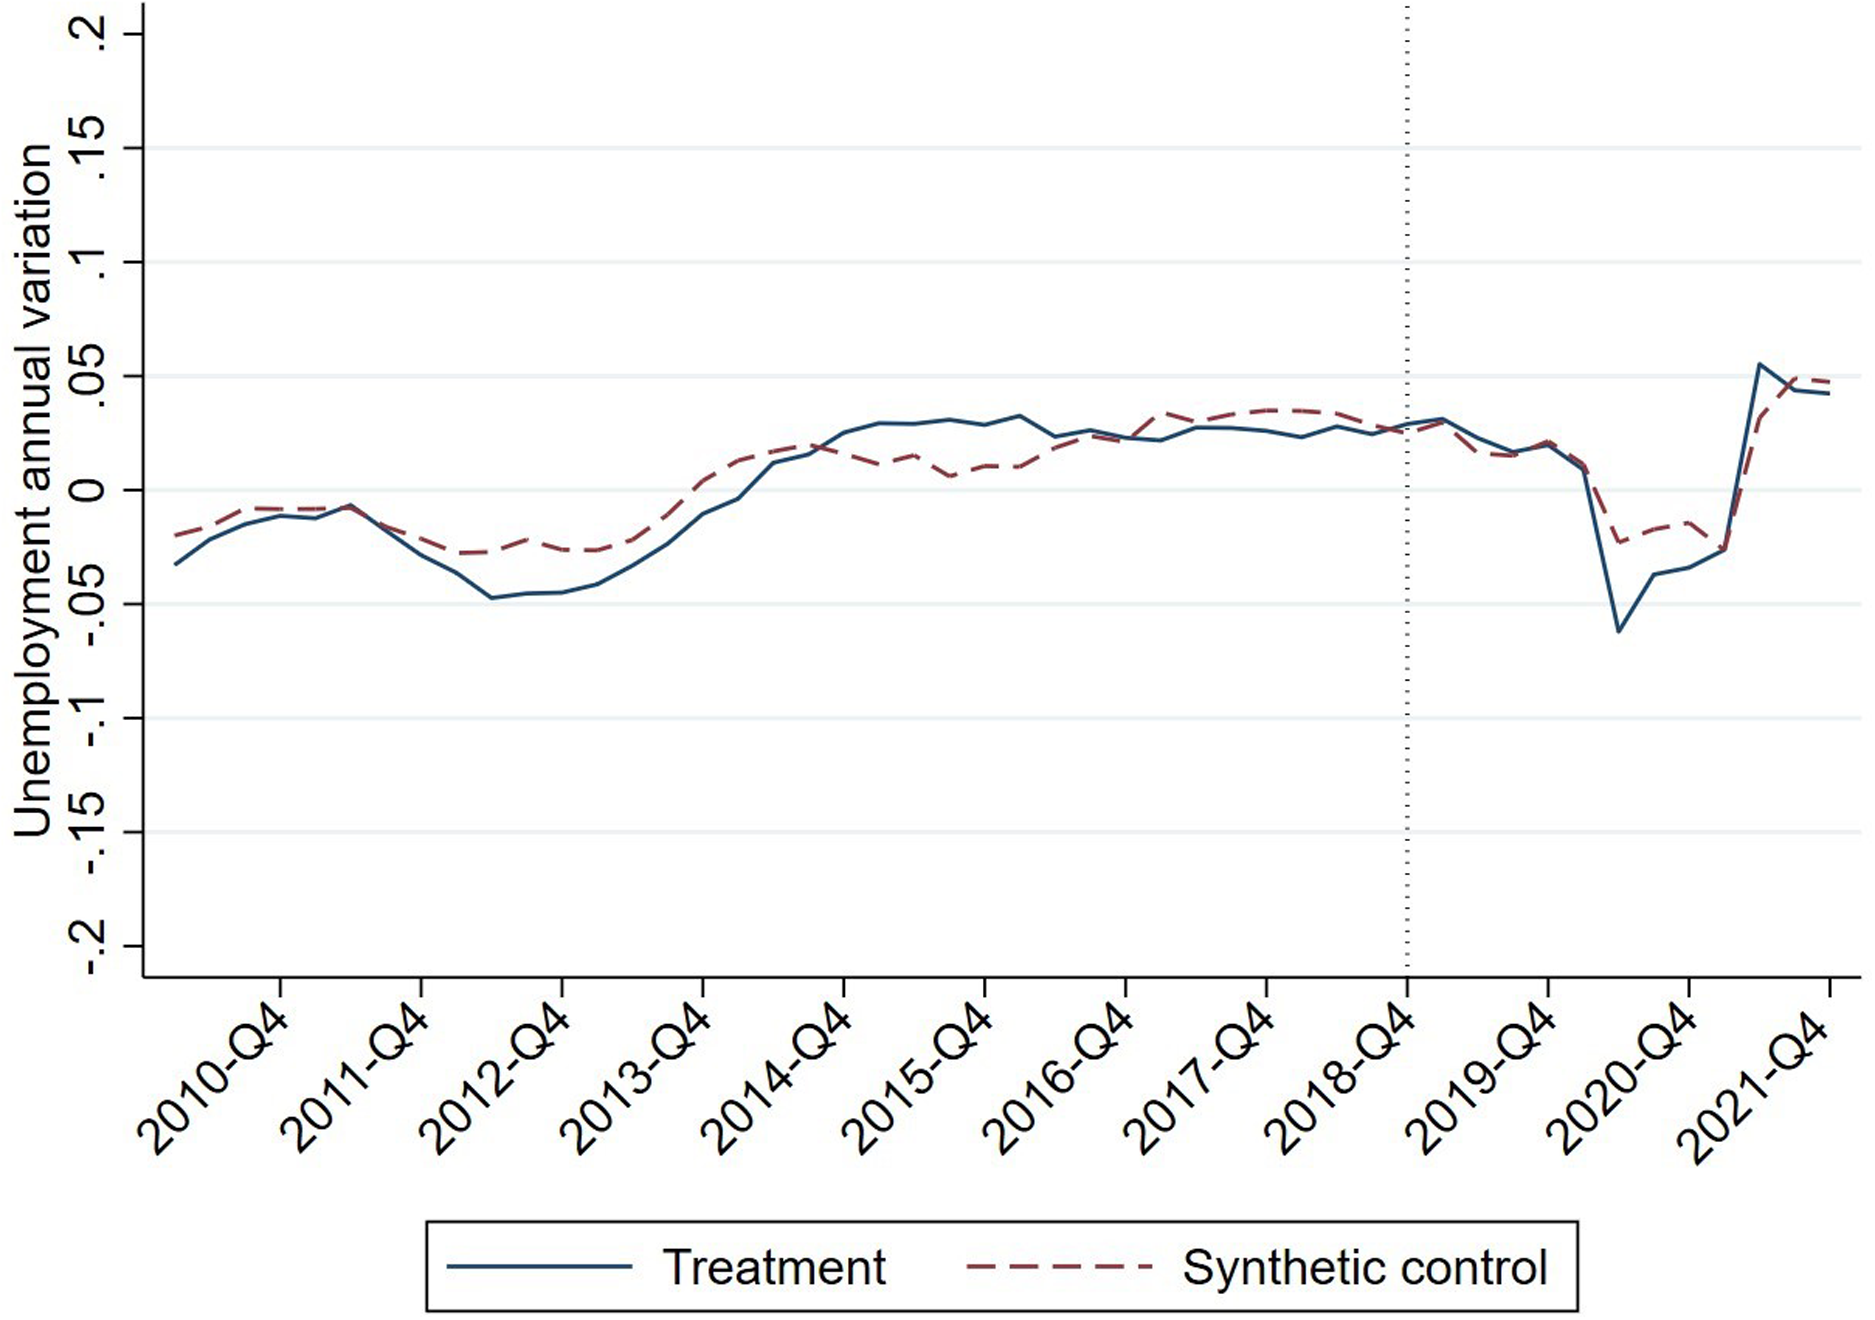
As expected from the end of 2016 until the arrival of the shock (2019), the change in employment in the control unit practically coincides with the data for Spain (note that a very small scale has been used on the ordinate axis of ± 0.2%). This is the aim of the synthetic control: before the exogenous shock, the behaviour of the treatment and the control should differ minimally.
In the post-treatment period, however, no significant differences between treatment and control are observed. We can observe a clear common trend between treatment and control group. The employment shock resulting from the restrictions imposed by the COVID-19 pandemic affected all countries, both Spain and the donor countries clearly reducing employment. In 2020, this negative shock is balanced, as the economic recovery from COVID-19 takes place.
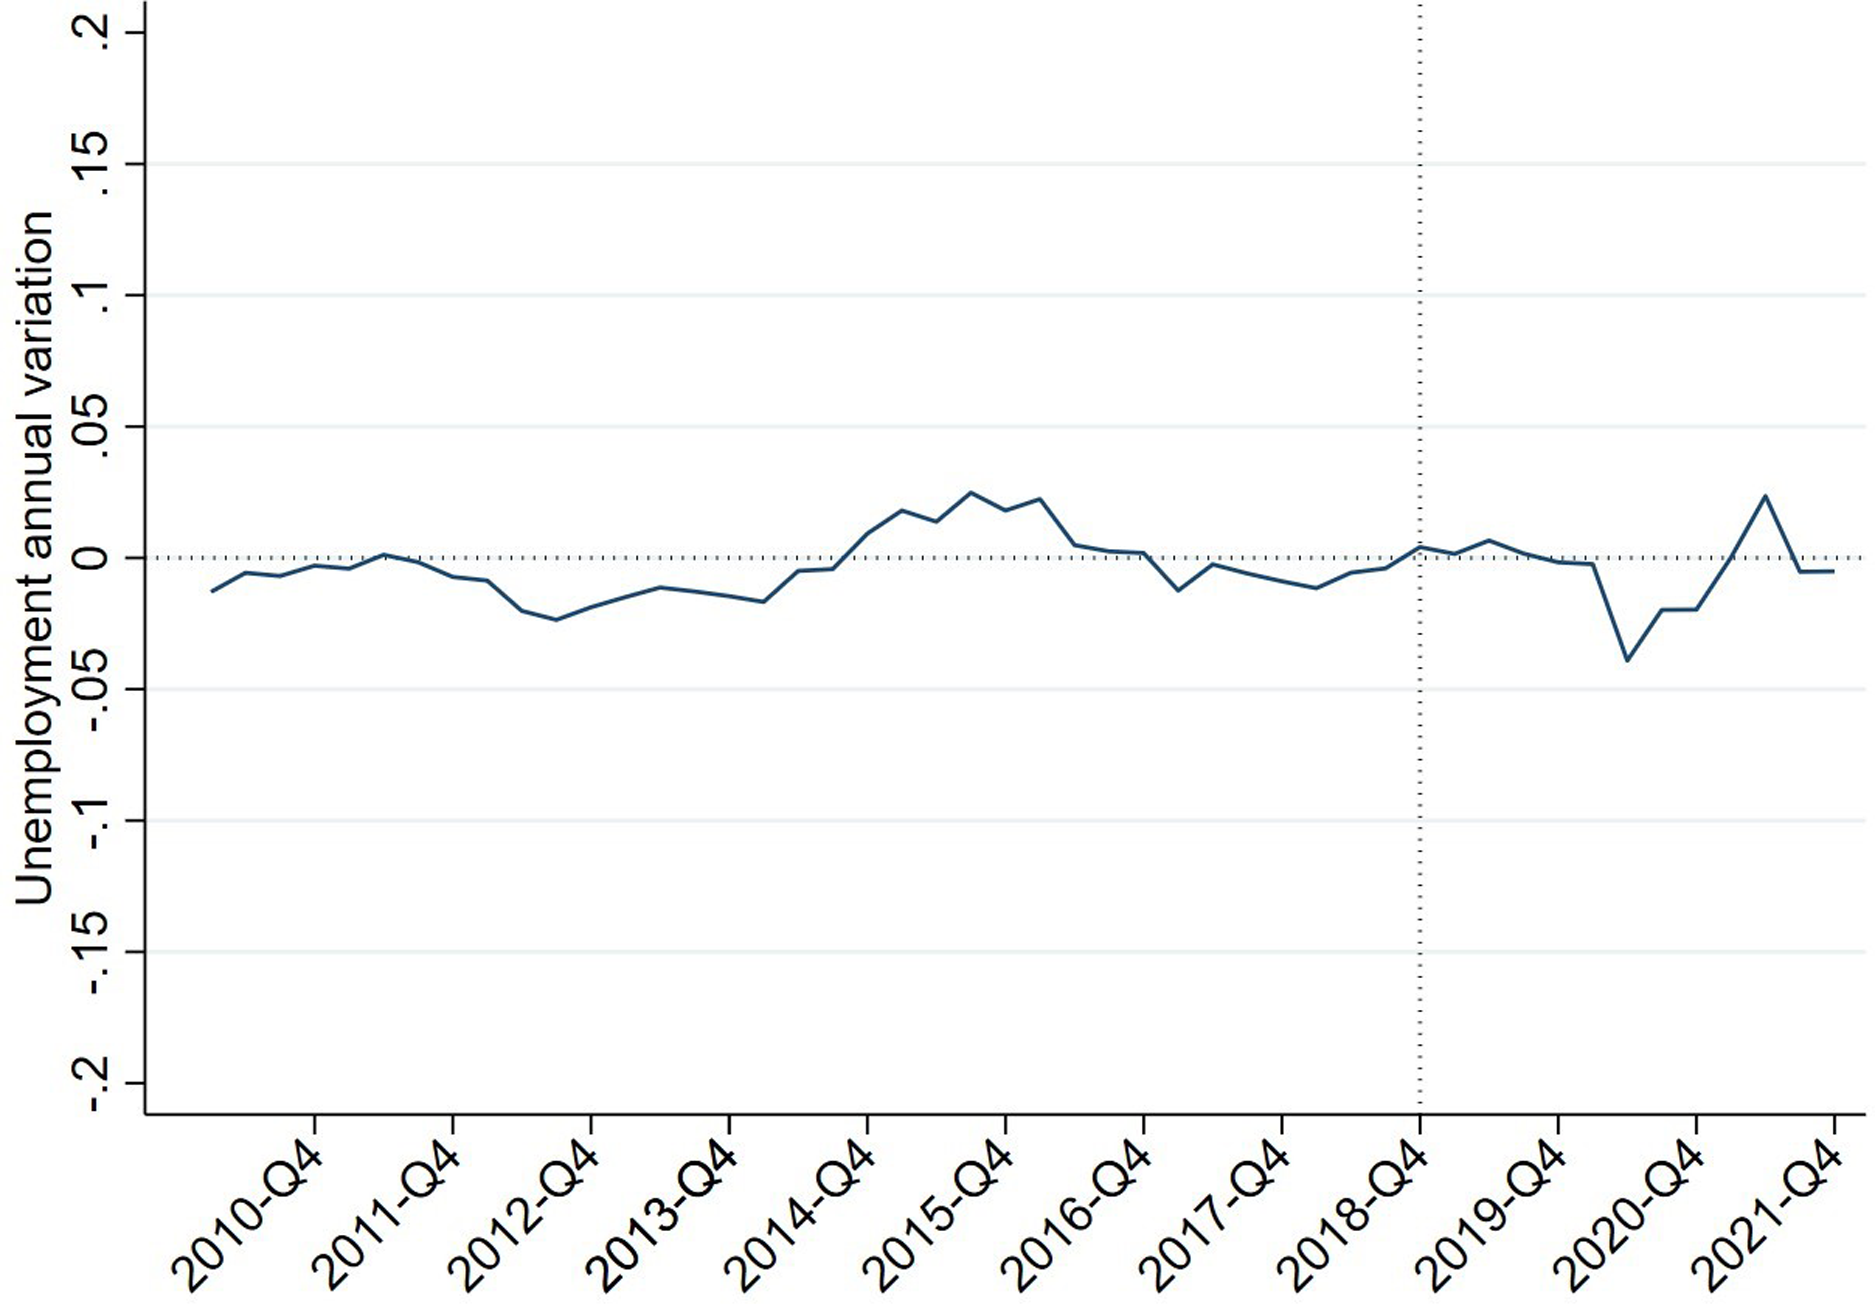
This is the main result of this paper: in Spain, the 2019 substantial increase in MW does not affect employment. Hence, this analysis provides empirical evidence about an issue that, as we have seen, is subject to vigorous theoretical discussion from a theoretical point of view. Figure 6 displays the same information as Figure 5, but it stresses the difference in the variation in employment between the treatment unit and the control group, which in the pre-treatment period is between −0.02 and 0.02. After the 22% increase in the MW come into force, this difference remains similar in 2019 to previous years and within the levels of the pre-treatment period, and even the short-term effect is lower than in previous years. For the 2019 period, these figures do not show any differences in the trends seen in the pre-treatment period. That is, the main result is clearly maintained during 2019, when there were no additional shocks to the labour market. Therefore, the causal effect of the increase in the MW in Spain was null.
Difference in variation between control unit and treatment unit.
Source: Prepared by the authors.
During 2020, the effect of restrictions due to the pandemic implied a generalised reduction in employment across Europe. The data for the first quarter of 2020 should be treated with caution as the interviews from which the EU-LFS (European Union LFS) data are obtained were conducted in March 2020 when the restrictions started in various European countries and may lead to confusion between countries that implemented the restrictive measures before the interviews and those that implemented after the interviews took place. For this reason, the change in employment was not uniform among countries.
Once the pandemic has affected all areas in the first half of 2020, the employment evolution of Spain and synthetic Spain converge again. So, the difference between the fall in employment due to the restrictions on economic activity and the fall not due to the increase in the MW in 2019 disappears.
That is, these differences are smoothed out in 2021, maintaining a remarkably similar behaviour to that of 2019. Since the countries in the donor pool have not implemented significant increases in their MW, the 22% increase in the MW in Spain had no impact on employment change.
Robustness testing
To validate the above model, some robustness tests are carried out. Firstly, the Leave One Out robustness test is conducted. Secondly, the same process is carried out by differentiating the level of employment by gender. Finally, the process is repeated for different age brackets.
Leave one out
The Leave One Out robustness test consists of eliminating from the donor group, one by one, each country selected for the control group and repeating the analysis again. This avoids the bias in the results due to the influence of one or two countries that may contaminate the final result.
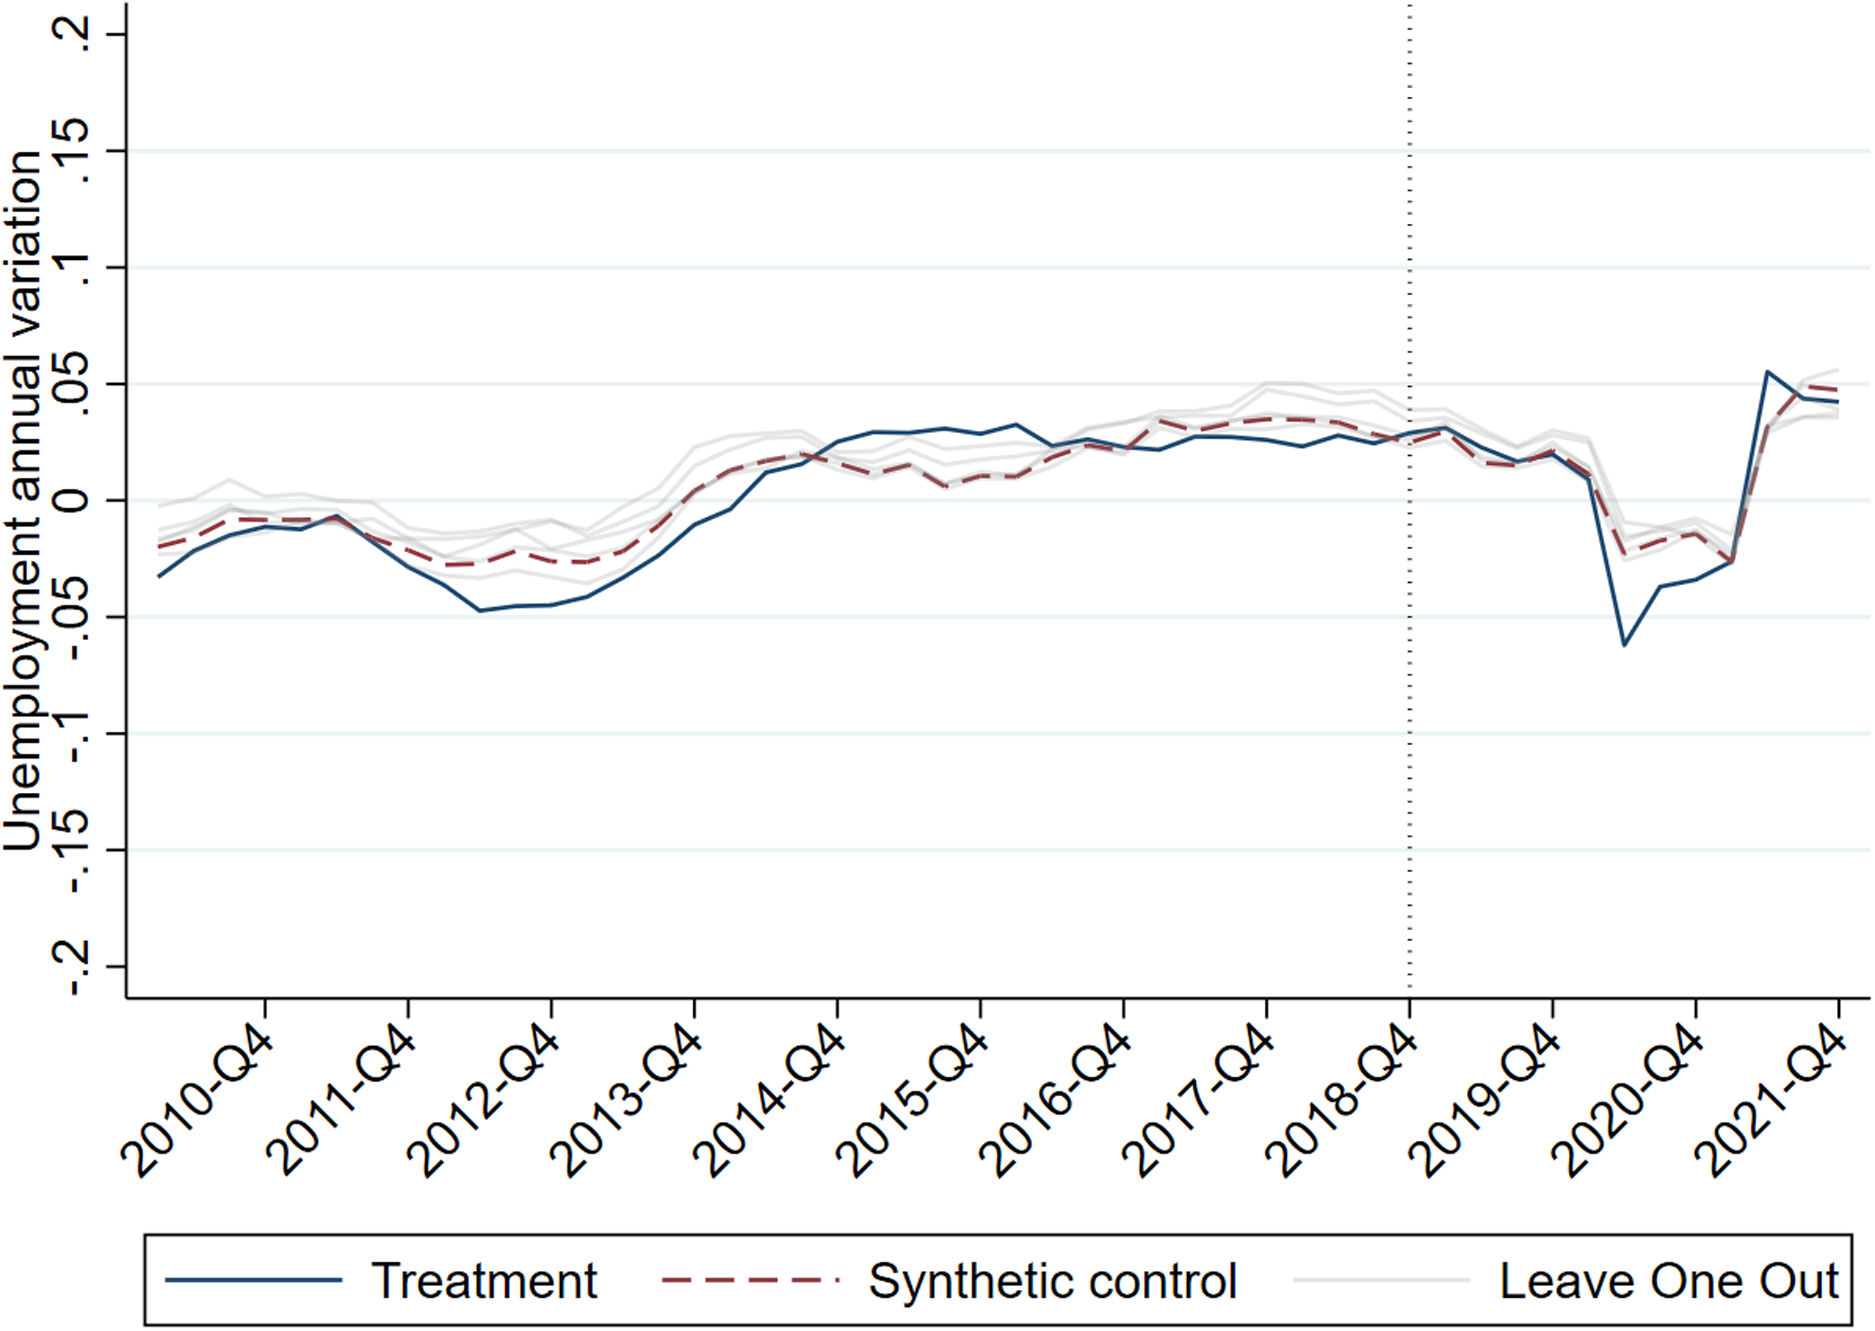
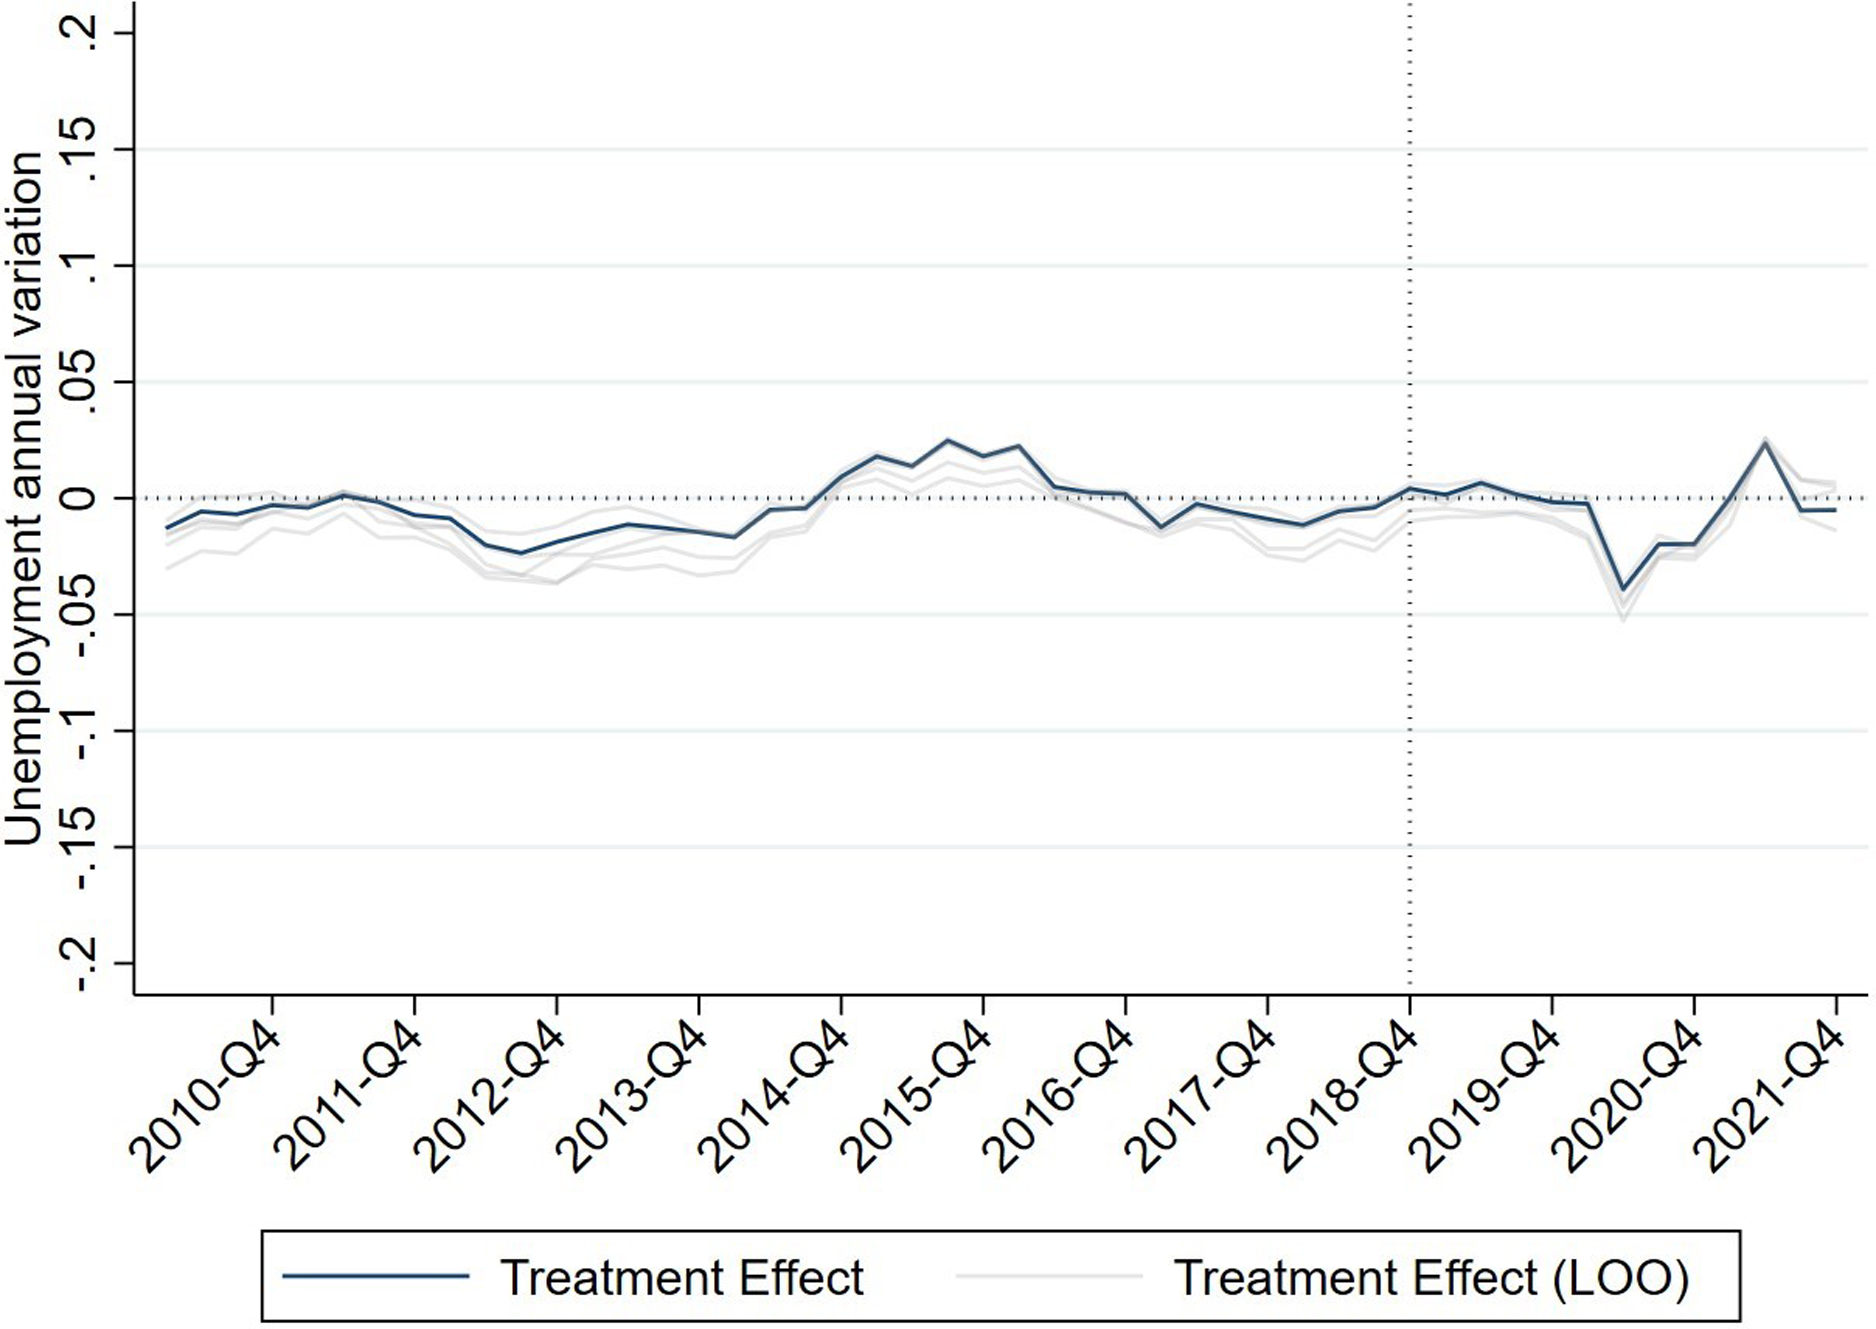
In Figures 7 and 8, results similar to those in Figures 4 and 5 may be seen, applying the Leave One Out technique, removing one of the donor countries in each case. These are represented by the weaker grey lines. The trend of the effect is maintained, and there are no differences between the pre-treatment period and the post-treatment period. This test strengthens the hypothesis of a null effect of the increase in the MW in 2019 on employment.
Leave One Out Robustness test.
Source: Prepared by the authors.
Effect of the Leave One Out Robustness test.
Source: Prepared by the authors.
Gender-differentiated effects
The literature on gender differences in the labour market maintains that in general women experience worse working conditions in various parameters, such as wage levels, temporariness, or part-time work (Kasearu et al Reference Kasearu, Maestripieri and Ranci2017). This is why women may be particularly affected by a measure such as the increase in the MW. In this robustness test, the same empirical exercise will be carried out separately for men and women. The response variable will now be the annual change in women’s or men’s employment, and the predictor variables for part-time, temporary, and unemployment change will also use gender-specific data. The variables GDP per capita, public debt, and the share of the accommodation and hospitality sector will remain unchanged. The results of these tests appear in Figures 9 and 10.
Evolution of the female employment rate in the treatment and control unit.
Source: Prepared by the authors.
Evolution of the male employment rate in the treatment and control unit.
Source: Prepared by the authors.
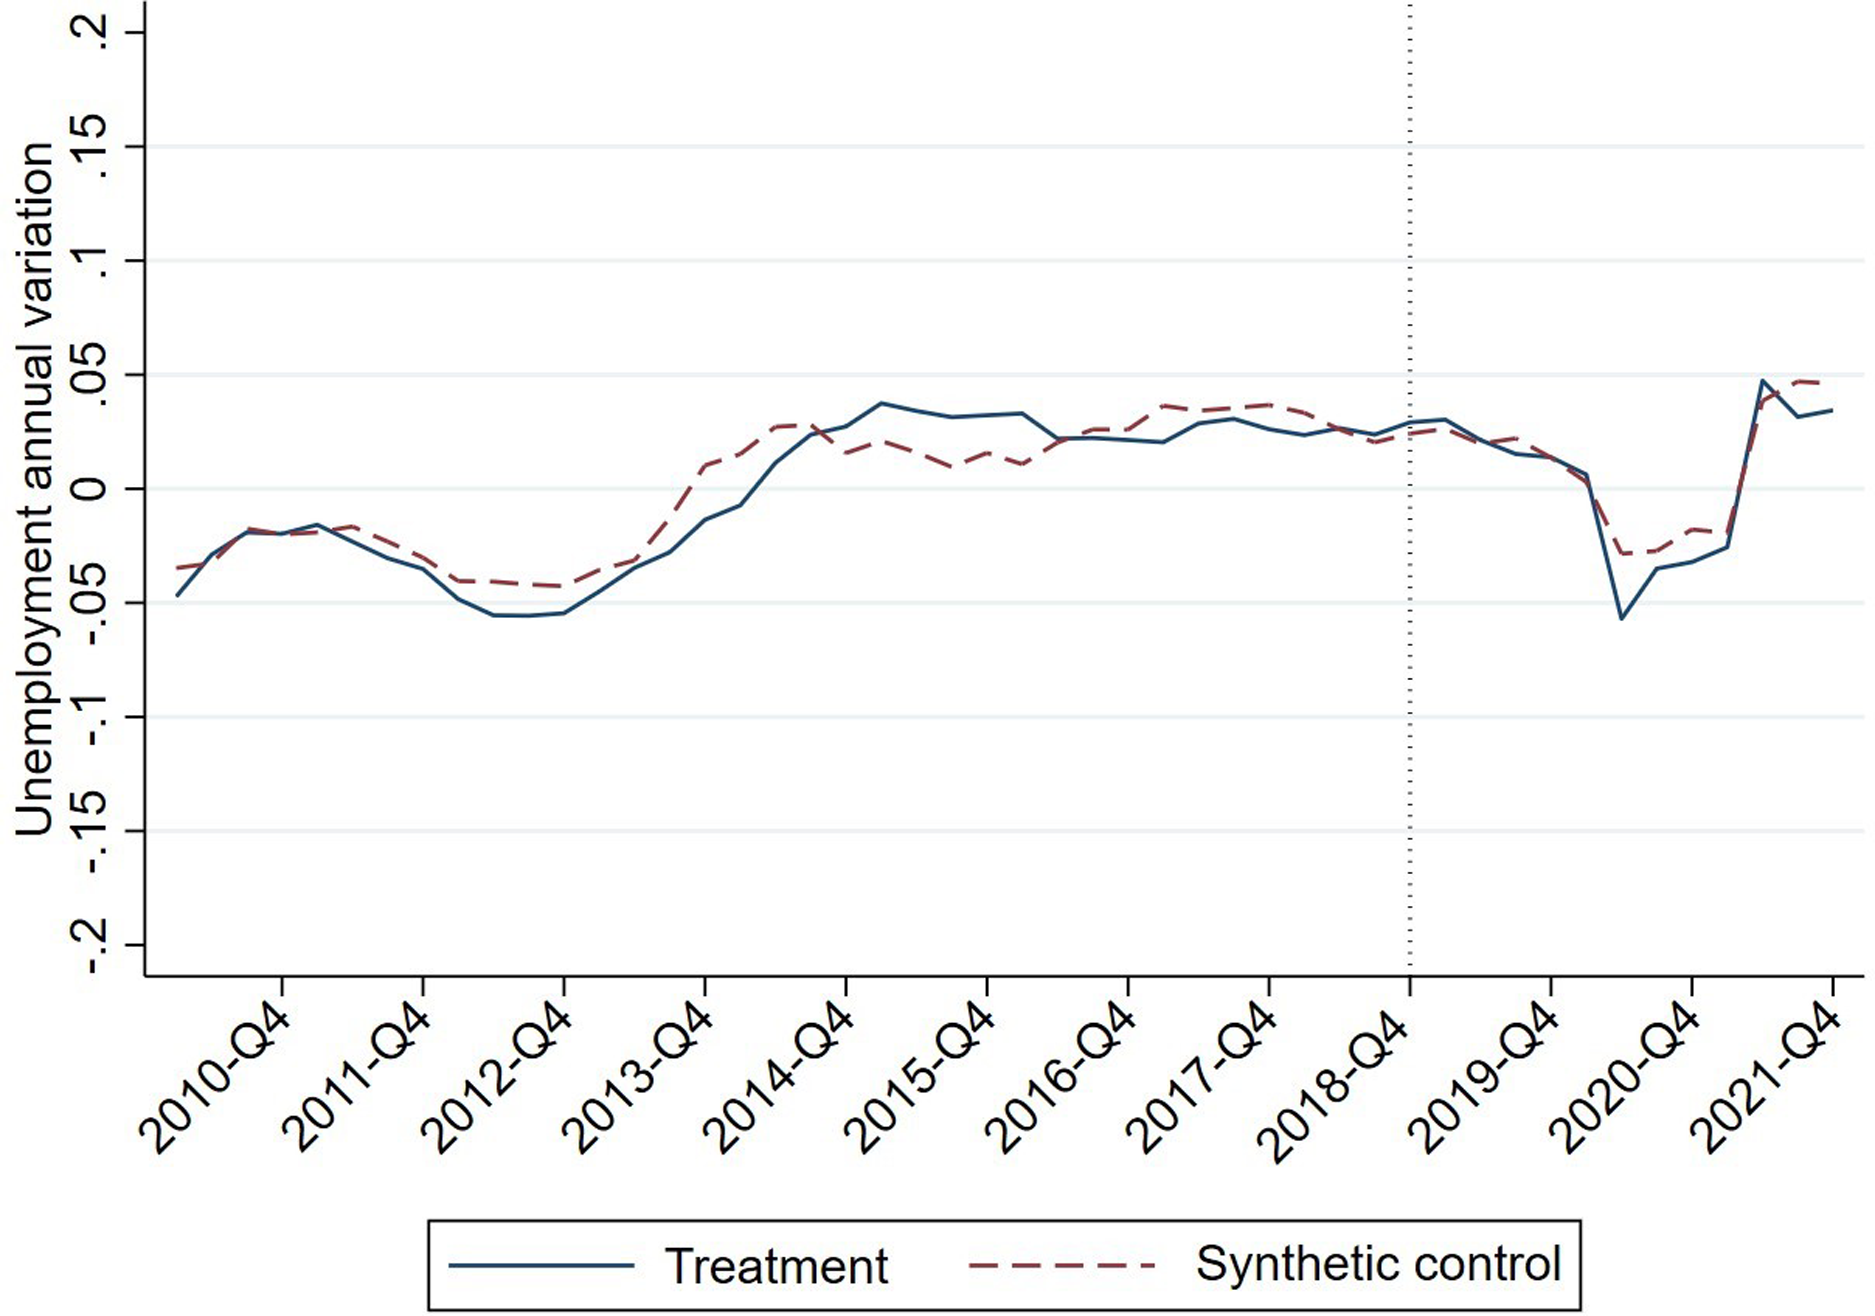
In Figure 9, the experiment has been replicated with data on female employment. As can be seen, there are no differences with respect to the main model. In the first year, the effect on employment is null; in 2020, there is a slight deviation attributable to pandemic restrictions, and in 2021, we see a return to alignment with the control group.
In Figure 10, the empirical exercise is repeated, taking data limited to male employment. The results obtained for the male employment data are similar to the main model and the female employment data. This allows us to confirm that the increase in the MW in Spain in 2019 has not had a gender-differentiated impact.
Effects differentiated by age
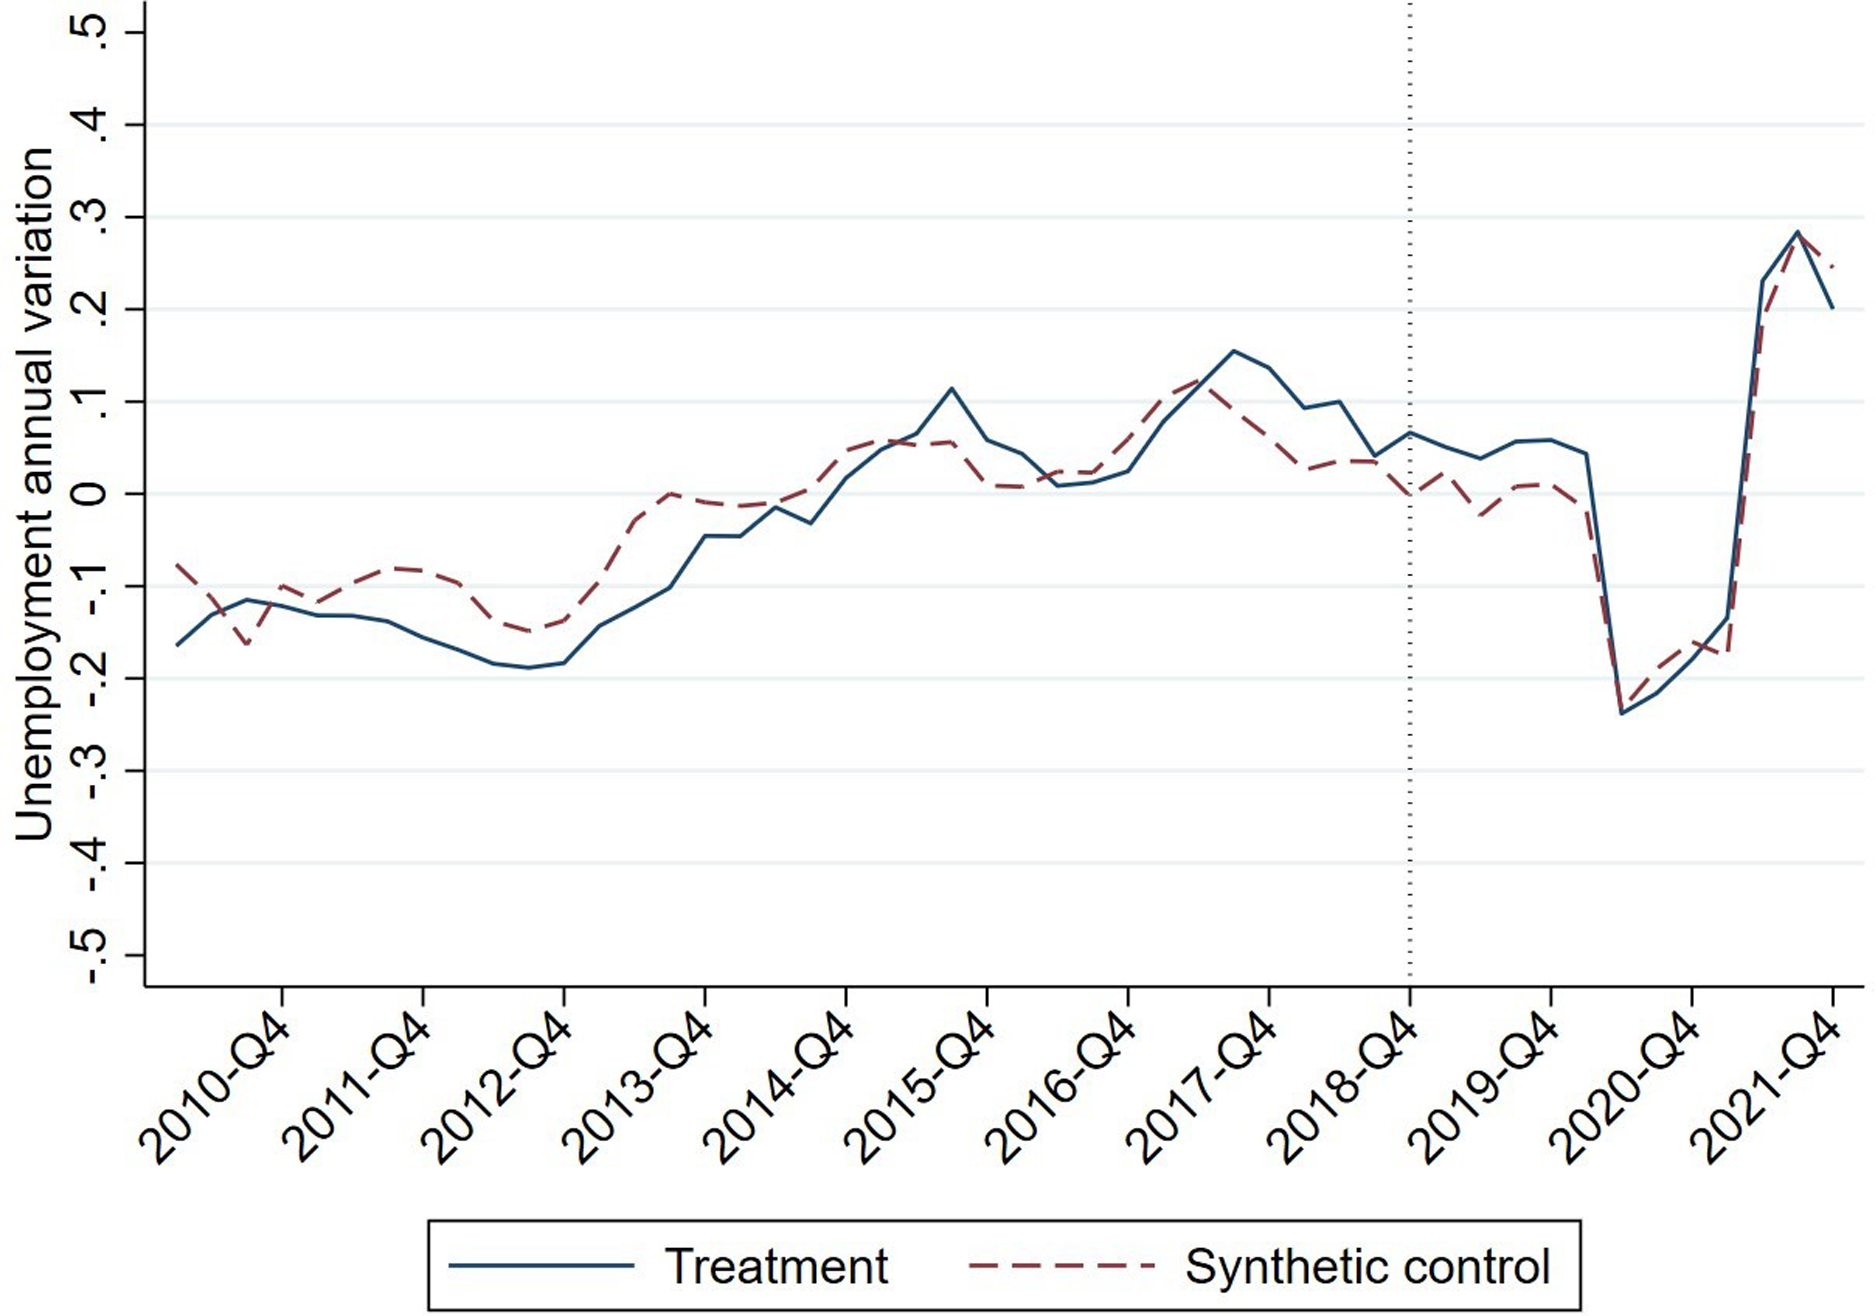
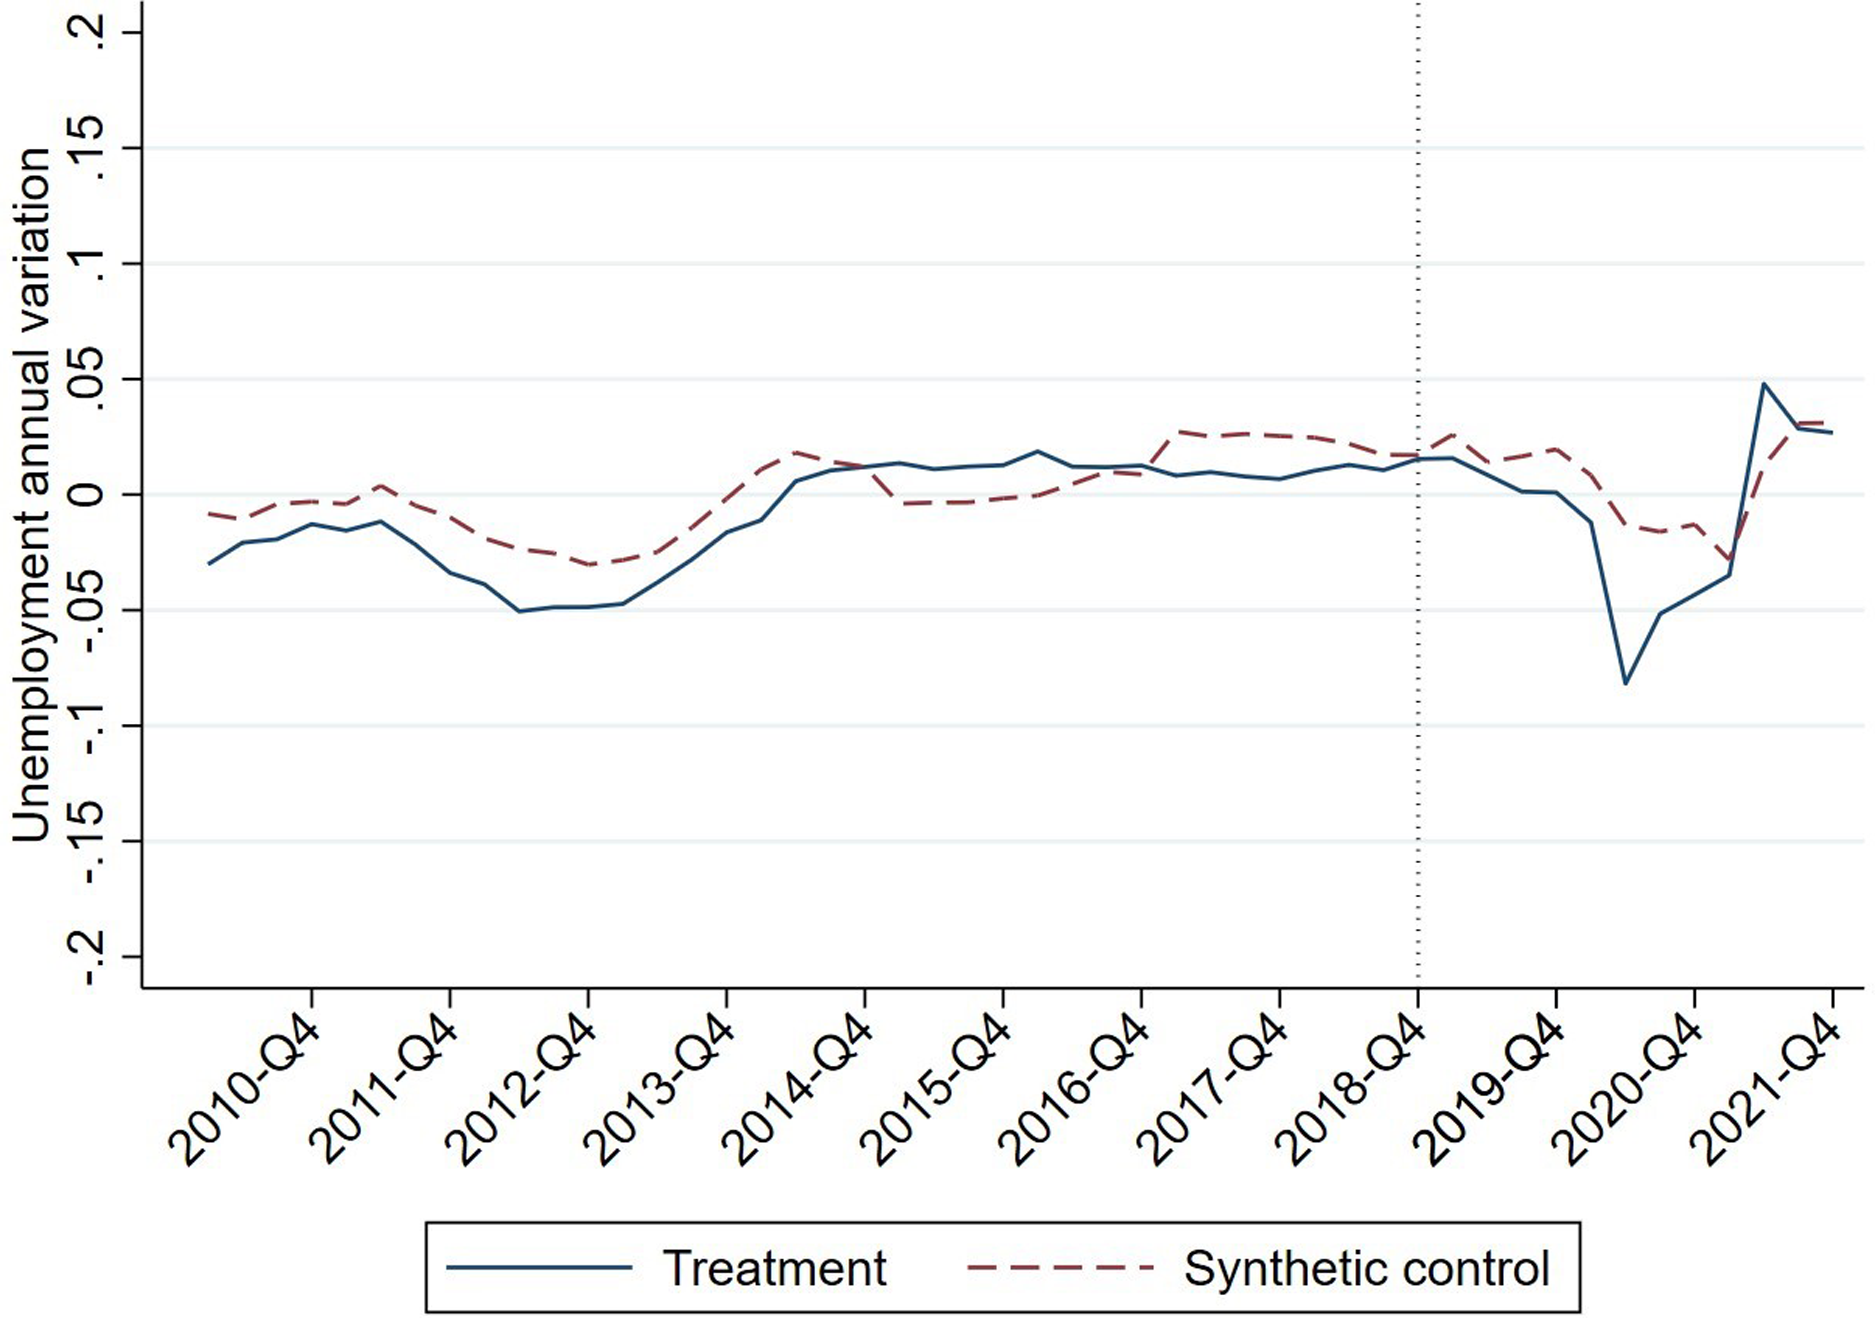
Age is another characteristic that can make a difference in the labour market. This robustness test repeats the experiment for three different age groups. Firstly, it will be applied to people between 15 and 24 years of age, then, separately, to those between 25 and 49 and, finally, those between 50 and 64. As in the case of gender differentiation, some of the predictor variables will be adapted to the population with the age restricted to their age group. The response variable will be the annual change in employment for the particular age group. The predictor variables adjusting for the age of the group will be seasonality, part-time employment and change in unemployment. Per capita income, public debt, and the weight of the hotel and accommodation sector are not disaggregated by age. The results are presented in Figures 11, 12 and 13.
Evolution of the employment rate for those aged 15–24 years in the treatment and control unit.
Source: Prepared by the authors.
Evolution of the employment rate for those aged 25–49 years in the treatment and control unit.
Source: Prepared by the authors.
Evolution of the employment rate for those aged 50–64 years in the treatment and control unit.
Source: Prepared by the authors.
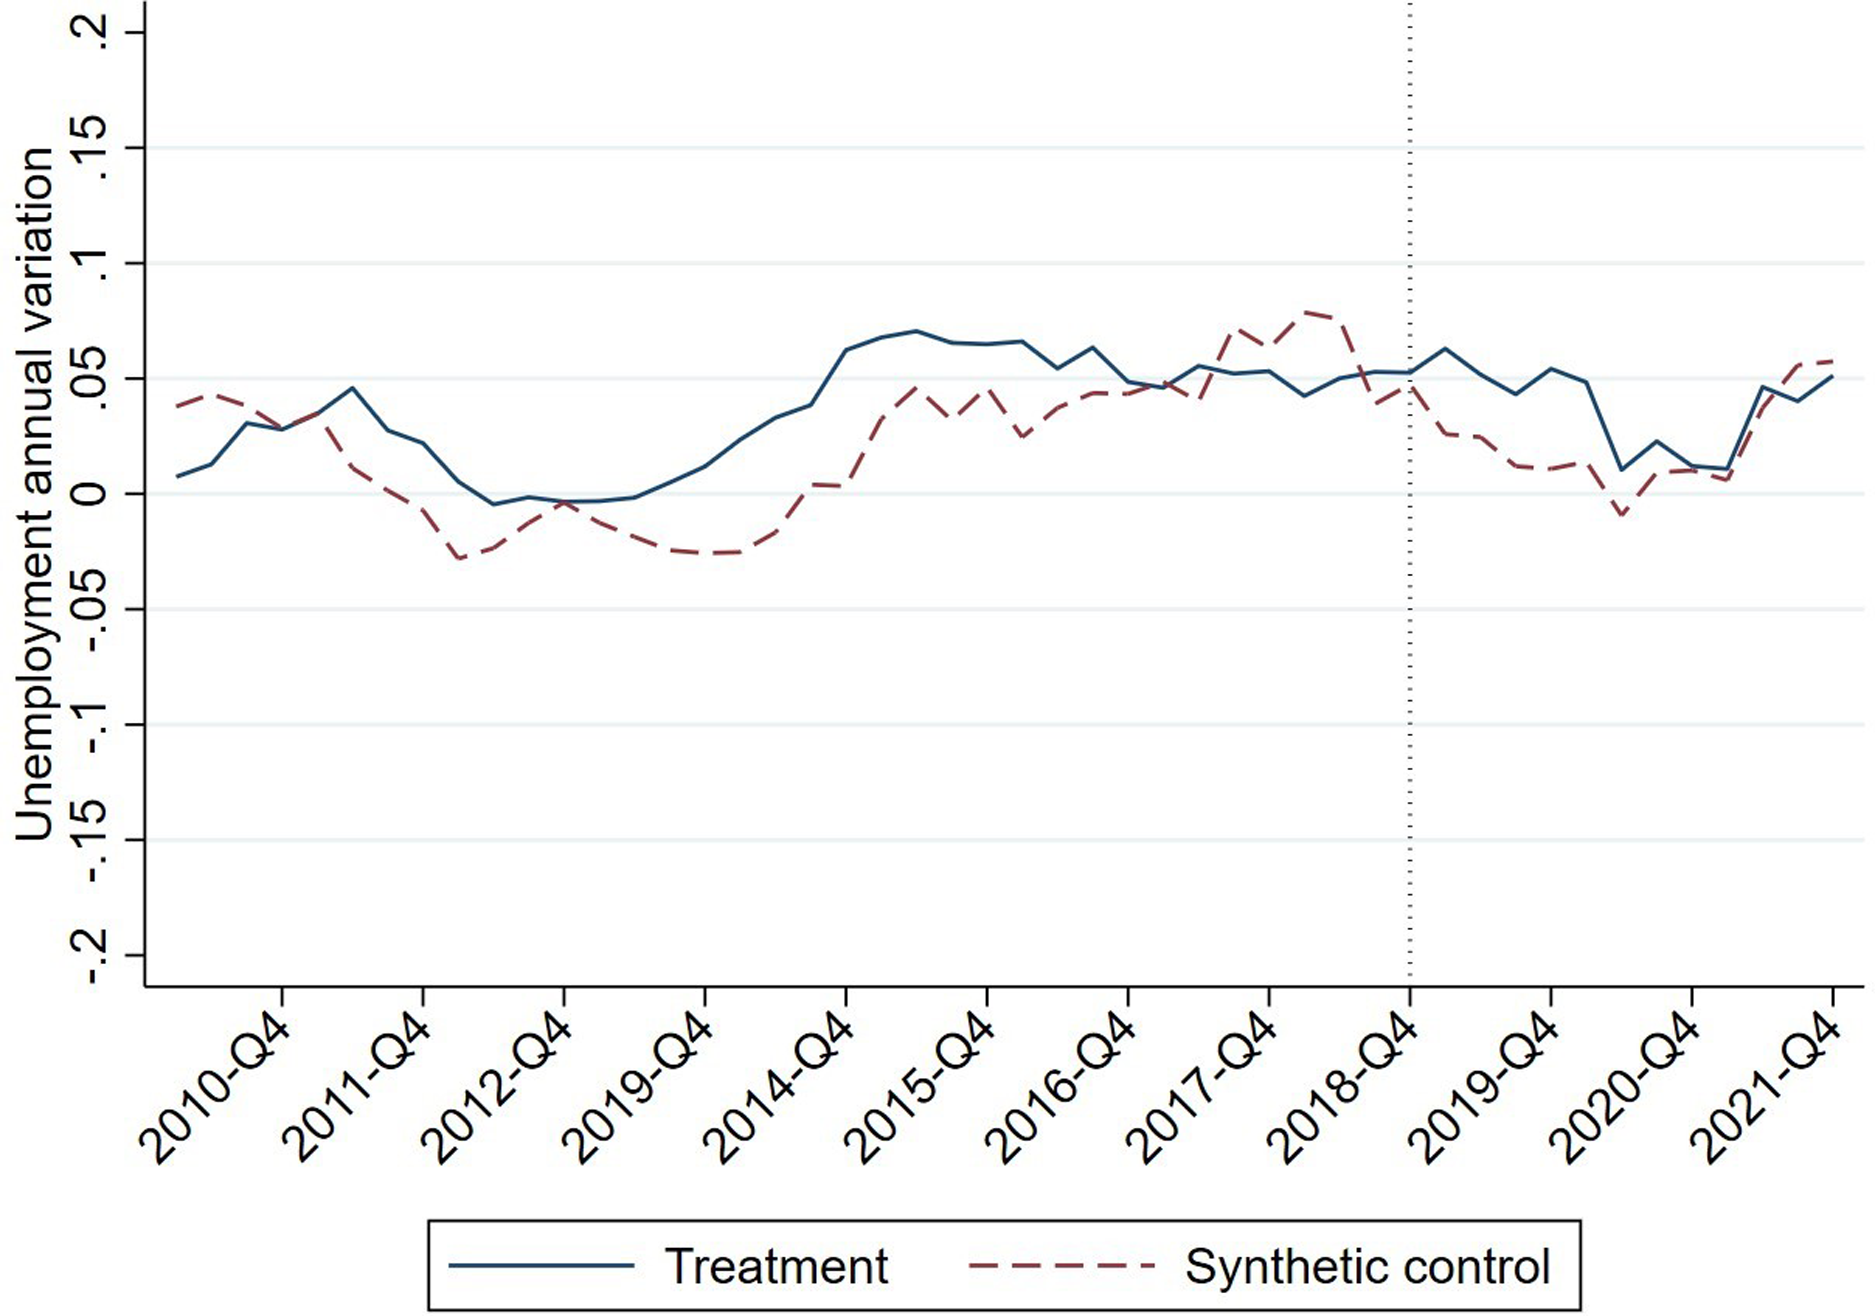
Figure 10 shows that the difference between treatment group and control group in youth employment after the increase in the MW remains similar to the pre-treatment period. In fact, the data for Spain are slightly better than the control group until the arrival of the pandemic restrictions, when their evolution adjusts better than in the pre-treatment period. No effects were observed for this age group.
Figure 12 replicates the empirical exercise for the population between 25 and 50. In this age group, the evolution in employment is more stable than for young people, and a better adjustment is observed in the pre-treatment period between the treatment unit and the control unit. The results for the post-treatment period are similar to those obtained in the general case. As in other population groups, the lockdown led to a decrease in employment that is corrected in 2021.
The empirical exercise is replicated for people aged between 50 and 64 years. Again, there is no discernible employment effect from the increase in the MW. Figure 13 shows how the treatment and control groups converge more after the sock than before it.
After applying the model to the three groups, we can conclude that age is not a determining factor in the employment effects of MW regulation. While the trends in the variation in the number of employed people vary with the age group considered, the increase in labour costs caused by the increase in MW did not produce reactions differentiated by age, resulting in a null effect.
Conclusions
The main objective of this paper was to provide empirical evidence on the effect on employment directly attributable to an increase in the MW. The literature offers a range of theoretical and empirical views of the possible employment effects of an increase in the MW.
Impact evaluation makes it possible to establish a causal relationship between the effects of a particular shock on the target variables or, as in this case, to anticipate whether there are unintended effects. This technique is particularly useful in cases using macroeconomic variables, such as the predictors included in this paper. The SCM improves on previous impact evaluation techniques by allowing the identification of a control group that is more closely matched to the treatment unit than any of the individual donors.
This paper has found no substantial effect in the variation in employment trend in Spain following the increase of the MW by 22% in January 2019. This result is common in the literature; increases in the MW do not usually imply lower employment (Neumark et al Reference Neumark, Ian Salas and Wascher2014). But, by using the Leave One Out technique, the robustness of the results is confirmed, since they are not due to the resemblance of the Spanish evolution with that of another specific country, but rather to the fact that the European Union labour market maintains a similar trend to that of Spain after the shock.
Moreover, by replicating the model in data segregated by gender and age, we demonstrate the null impact of the measure, not only on the entire labour market but also on several vulnerable groups such as women and young people.
It is, therefore, safe to conclude that the increase in the MW in 2019 has not had any undesirable effects on employment, but rather that employment has remained on the same trend as other European economies without any differences following the increase in labour costs. Companies were probably paying the MW even though the productivity of their workers was higher. According to Azar et al (Reference Azar, Huet-Vaughn, Marinescu, Taska and Von Wachter2019), when wages are below the marginal productivity of workers, they can be increased without resulting in new unemployment.
The hypothesis posed by this paper was “No effect on employment was caused by the 2019 22% increase in the MW”. This empirical exercise has confirmed the hypothesis. However, it remains for future research to identify the adjustment mechanisms triggered by the increase in the MW, knowing that it did not affect employment. Since the analysis in this paper has been carried out at the macroeconomic level, it would be of great interest to continue the research at the micro level to see if any economic sector or income level has been affected by the increase in the MW. The literature reviewed on the case of Spain in 2019, with microeconomic analysis, shows contradictory results.
Funding statement
This work was supported by the Conselleria de Hacienda y Modelo Económico [UNIECPU/2021/02-PT2].
Competing interests
There are no potential or perceived conflicts of interest.
Juan J. Arnadillo is a Research Fellow in the Department of Applied Economics at the University of Valencia and a student in the PhD programme in Economics at the University of Valencia. His doctoral thesis is supervised by Professors Amadeo Fuenmayor and Rafael Granell. His line of research is based on Public Economics, specifically on impact evaluation and microsimulation of taxes and benefits. He is a collaborator of the research group Public Economic Evaluation (EvalPub) and collaborator of the Chair of Autonomic Taxation. He holds a Master’s degree in Economic Policy and Public Economics from the University of Valencia and a degree in Economics and International Business from the University of Alcalá.
Amadeo Fuenmayor, PhD in Economics, Associate Professor of the Department of Applied Economics, and director of the Autonomous Taxation Chair at the University of Valencia. He is a member of the Public Economic Evaluation research group (EvalPub), of the Commission for the Study of Tax Reform in the Valencian Community and a researcher at RIFDE. He has participated in various contracts and research projects in: Generalitat Valenciana; M. Labour and Social Affairs; Ins. Estudios Fiscales; U. de Valencia; LARES CV; La Caixa Foundation, Berklee College of Music. He has published in reviews such ICE, Estudios Economía Aplicada, Revista de Educación, Impuestos, Cuadernos Información Económica, Boletín ICE, Revista Estudios Regionales, Presupuesto y Gasto Público, Service Industries Journal, International Journal of Innovation and Regional Development, Revista Española Geriatría y Gerontología, Review of Economics of the Household; Hacienda Pública Española; Papers. Book chapters at McGraw-Hill, Institute de Estudios Fiscales, Civitas-Thomson Reuters, Edward Elgar; books in Ariel and Tirant lo Blanch. He is currently directing three doctoral theses. He has been a member of the Scientific Committee (2006-2010; 2014-2019) and President (2019-2022) of the Public Economy Meetings; Scientific Committee of the Project ‘Review of the minimum income systems in Spain’, D.G. Services for the Family and Children (M. of Health, Social Services and Equality). Referee at Service Industries Journal, e-pública, Revista de Economía Crítica, Estudios Fronterizos, Revista de Estudios Regionales, Hacienda Pública Española, Review of Economics of the Household, Social Science Journal. His area of research focuses on public economics, highlighting the following lines: economics of taxation, microsimulation of taxes and benefits, regional economics, fiscal federalism, poverty and inequality, economics of education and public economic evaluation.
Rafael Granell, PhD in Economics and Associate Professor at the Department of Applied Economics of the University of Valencia. He is the Director of the Public Economic Evaluation research group (EvalPub), a member of the Chair of Regional Taxation and of the Commission for the Study of Tax Reform in the Valencian Region and a researcher at RIFDE. His area of research focuses on Public Economics, highlighting the following lines: economics of taxation, regional economics, fiscal federalism, poverty and inequality, economics of education and public economic evaluation. He has published numerous articles in scientific journals, such as Journal of Policy Modeling, Review of Economics of the Household, Service Industries Journal, Ageing & Society, Education Economics, Journal of Regional Research and Review of Public Economics. He has been a researcher in projects and contracts with several entities such as Spanish Ministry of Science and Innovation, Spanish Social Security, Spanish Institute of Fiscal Studies, Generalitat Valenciana, IVIE and La Caixa Foundation.


 Open access