


The diets of most Americans are not consistent with dietary guidance( Reference Krebs-Smith, Guenther and Subar 1 ); this is particularly true for low-income and minority populations( Reference Kirkpatrick, Dodd and Reedy 2 , Reference Kumanyika and Krebs-Smith 3 ). Increasingly, attention has been focused on the influence of foods prepared outside the home, and particularly foods offered and consumed at fast-food restaurants, on consumption patterns( Reference Bowman and Vinyard 4 – Reference French, Harnack and Jeffery 7 ). National survey data from 2007–2008 suggest that food and beverages from fast-food sources accounted for 10 % of the total energy consumed by 2–11-year-olds, 17 % of the energy consumed by 12–19-year-olds and 13 % of the energy consumed by 20–65-year-olds( Reference Powell, Nguyen and Han 8 ). Fast-food consumption has been shown to be inversely associated with dietary quality among adults and children( Reference Bowman and Vinyard 4 – Reference French, Harnack and Jeffery 7 ) and positively associated with body weight( Reference French, Harnack and Jeffery 7 , Reference Duffey, Gordon-Larsen and Jacobs 9 , Reference Duffey, Gordon-Larsen and Steffen 10 ) and negative metabolic outcomes, including insulin resistance and metabolic syndrome, among adults( Reference Duffey, Gordon-Larsen and Steffen 10 , Reference Pereira, Kartashov and Ebbeling 11 ).
Previous studies have examined particular aspects of the nutritional quality of fast-food offerings, such as energy and fat( 12 , Reference Wu and Sturm 13 ). A recent analysis examined the nutrient profile, total energy and sodium content of each item sold by popular fast-food restaurants, including kids' meals and items marketed on dollar or value and healthy menus( 12 ). The study authors concluded that relatively few items (5 % of lunch/dinner main items and 12 % of lunch/dinner side dishes) could be classified as healthy, although there was variation among the outlets examined. The current analysis utilized data collected as part of that study( 12 ) to further evaluate the nutrition quality of fast-food environments. Specifically, the congruence between the overall mix of menu offerings at the five top fast-food restaurants and dietary guidance was assessed using the Healthy Eating Index-2005 (HEI-2005), a measure of diet quality( Reference Guenther, Reedy and Krebs-Smith 14 ). In addition to the full array of offerings at each restaurant, subsets of items marketed on ‘dollar’ or ‘value’, ‘kids’, and ‘healthy’ or ‘nutritious’ menus were examined. It was hypothesized that although fast-food offerings would rate poorly overall, items marketed to kids and as healthy or nutritious would fare better. The current analysis adds to earlier work by relating menu offerings to dietary guidance and enabling an examination of several specific aspects of dietary quality.
Methods
Based on US sales in 2008 and 2009, the top five quickserve restaurant chains (hereafter referred to as ‘fast-food chains’) with a full food menu were selected for evaluation( 12 ). These were Burger King, McDonald's, Subway, Taco Bell and Wendy's. Details on menu offerings were obtained from the nutrition information posted on restaurant websites as of 15 January 2010 (the term ‘menu’ is used hereafter to refer to the set of foods for which nutrient information was provided online). Items promoted on dollar or value, kids’, and healthy or nutritious menus (if any) on the restaurants’ websites in March 2010 were also identified.
At the time that the data were collected, federal dietary guidance was communicated by the 2005 Dietary Guidelines for Americans and MyPyramid( 15 , Reference Britten, Marcoe and Yamini 16 ). Adherence of each chain's menus to this guidance was assessed using the HEI-2005, a measure of diet quality made up of twelve components( Reference Guenther, Reedy and Krebs-Smith 14 ). Although the HEI has traditionally been used as a measure of the quality of individual diets, the HEI-2005 may be used to assess any mix of foods, including the food supply( Reference Krebs-Smith, Reedy and Bosire 17 ) or foods offered or sold in various settings( Reference Reedy, Krebs-Smith and Bosire 18 ). This novel feature of the HEI is particularly useful since it allows for a comparable metric to be used across various levels (e.g. individual, environmental) and settings (e.g. schools, stores, restaurants).
Because recommendations typically vary in relation to energy requirements, scores for all components of the HEI-2005 are calculated on a density basis (e.g. amount per 4184 kJ (1000 kcal)) rather than on the basis of absolute amounts of foods or nutrients. As a result, the HEI-2005 captures the overall quality of, or balance among different foods and nutrients in, a diet or menu. Each component is scored up to a maximum of 5, 10 or 20 points, with the maximum overall score totalling to 100; the components and maximum scores are listed in Tables 1–3. Nine of the components assess adequacy of amounts of food groups and oils in relation to MyPyramid recommendations, whereas the remaining three are referred to as moderation components because they measure constituents that should be limited in the diet (i.e. Saturated Fat, Sodium, Calories from Solid Fats and Added Sugars). The HEI-2005 also considers energy from alcohol but none of the chains offered alcoholic beverages. For the purposes of interpretation, the moderation components are reverse scored such that a high score indicates lower densities; as a result, a higher score indicates higher concordance with dietary guidance for all HEI-2005 components.
HEI-2005 component and total scores for full menus, by fast-food restaurant
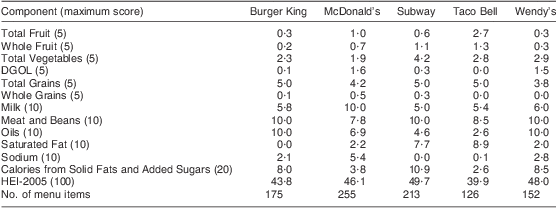
HEI-2005, Healthy Eating Index-2005; DGOL, Dark Green and Orange Vegetables and Legumes.
HEI-2005 component and total scores for dollar/value menus, by fast-food restaurant
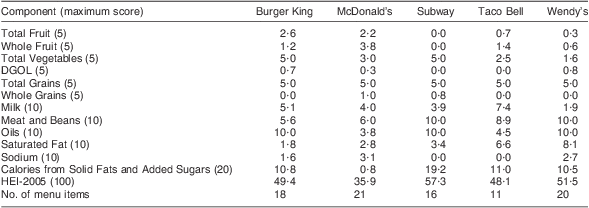
HEI-2005, Healthy Eating Index-2005; DGOL, Dark Green and Orange Vegetables and Legumes.
HEI-2005 component and total scores for kids’ menus, by fast-food restaurant
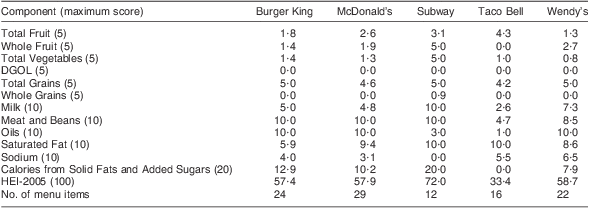
HEI-2005, Healthy Eating Index-2005; DGOL, Dark Green and Orange Vegetables and Legumes.
Operationalizing the set of foods to be analysed for each restaurant
The analysis focused on the menu offerings of each fast-food chain, and did not consider sales data. Each unique item was counted once to provide a sense of the overall quality of each chain's offerings. All menu items were considered, including calorie-free items such as diet sodas, because they could contain sodium, one of the components in the HEI-2005( Reference Guenther, Reedy and Krebs-Smith 14 ).
Online menus varied in terms of the details provided. For example, some chains listed nutrition information for each flavour and size of an item whereas others gave ranges across flavours and sizes. To provide comparability across chains, standardization criteria were applied. For individual menu items, each size, flavour and variety (e.g. regular and diet soda) offered was counted as a unique menu item. Beverages (e.g. lattés) offered either hot or cold but that were otherwise identical were counted once. For combination meals containing multiple items (such as an entrée, side dish and beverage), each flavour or variety's inclusion was weighted according to the proportion of choices it represented (e.g. if a meal included soda offered in five varieties, one of which was diet, diet soda was assumed to account for one-fifth of the beverage). Subway's online menu assumed wholegrain bread and vegetable toppings but no cheese or sauce on most sandwiches. To better reflect the choices available at Subway, it was assumed that sandwiches were prepared on wholegrain bread in proportion to the types of bread offered and that half of all sandwiches included all vegetables offered. Further, it was assumed that half of all sandwich options that did not already include cheese had cheese added and that half of all sandwich options that did not already include sauce (e.g. mayonnaise) had sauce added.
A similar approach was taken for the analysis of the dollar or value, kids’, and healthy or nutritious menus, with each item on the respective menu counted once. The assumptions noted above for Subway's full menu were not applied since items on special menus were described in greater detail (e.g. on Parmesan bread with cheese and mayonnaise) and our interest was in capturing these items as promoted by the chain.
Coding menu items, deriving HEI-2005 variables and scoring each component
For the calculation of HEI-2005 scores, data on energy, saturated fat and sodium for each menu item were derived from the chains’ online menus. Calculating HEI-2005 scores also requires data on amounts of food groups (e.g. total fruit, dairy), oils and energy from added sugars and solid fats in units consistent with dietary guidance. Because the chains’ menus did not include this latter information, it was calculated using the MyPyramid Equivalents Database (MPED)( Reference Bowman, Friday and Moshfegh 19 ) and the US Department of Agriculture Center for Nutrition Policy and Promotion fruit database( 20 ). To allow linkage with the MPED and fruit database, each menu item was first coded by a professional coder using the Food and Nutrient Database for Dietary Studies (FNDDS), version 2·0( 21 ). For some items (e.g. French fries), a one-to-one match was possible, whereas others (e.g. multi-ingredient foods, such as sandwiches) required multiple codes per menu item. Determination of best fit matches was based on the item description and nutrient profile from the chains’ websites. The FNDDS codes were then used to link the menu database to the MPED and fruit database in order to derive values for each of the components in the HEI-2005 (other than energy and the nutrients, saturated fat and sodium, as noted above). One limitation of using FNDDS and the corresponding MPED for this purpose is that these databases lack brand-specific data for many foods. For example, nutrient and food group values for a food code may be based on a composite of similar items (e.g. fast-food hamburger) and not a specific chain's item (e.g. McDonald's hamburger). To account for this limitation, values obtained from MPED were calibrated using the chains’ online nutrition information. Specifically, values for food groups, oils and energy from added sugars and solid fats were adjusted up or down proportionately according to the difference between the energy reported by the chain and the energy according to FNDDS. Once final values for each component of the HEI-2005 were obtained, the HEI-2005 scoring algorithm was applied to derive component and total scores for each menu.
Results
The menus at McDonald's, Wendy's and Burger King reflect traditional fast food, i.e. mainly hamburgers, French fries and sodas. In contrast, Taco Bell offers tacos, burritos and other Mexican-inspired foods, whereas Subway specializes in sub sandwiches. Additional details on the composition of each menu are available elsewhere( 12 ).
Of 100 possible points, total HEI-2005 scores for the full menus ranged from 39·9 (Taco Bell) to 49·7 (Subway; Table 1). The components generally receiving the lowest scores were Total Fruit, Whole Fruit, Dark Green and Orange Vegetables and Legumes, Whole Grains, and Sodium. Maximum scores were assigned to three of the twelve components for Burger King (Total Grains, Meat and Beans, Oils). Two components received maximum scores for Subway (Total Grains, Meat and Beans) and Wendy's (Meat and Beans, Oils), whereas McDonald's and Taco Bell received maximum points for Milk and Total Grains, respectively. Taco Bell was the only chain to receive zero points for two components: Dark Green and Orange Vegetables and Legumes, and Whole Grains. Burger King, Subway and Wendy's each received zero points for one component: Saturated Fat, Sodium and Whole Grains, respectively. There was variation across chains in scores for Saturated Fat, ranging from zero (Burger King) to 8·9 (Taco Bell) out of 10 possible points. The highest score out of 20 possible points for Calories from Solid Fats and Added Sugars was 10·9 (Subway).
All five chains offered dollar or value and kids’ menus, and three identified healthy or nutritious menu items. For dollar or value menus, total scores were higher than the scores for the overall menu for all chains except McDonald's (Table 2). Subway's value menu ($5 Footlongs), which received the highest total score (57·3 points) among this subset of menus, included several varieties of sandwiches but no beverages or snacks/desserts and scored full points for Total Vegetables, Total Grains, Meat and Beans, and Oils, and 19·2 out of 20 possible points for Calories from Solid Fats and Added Sugars.
For four of the five fast-food chains, items marketed as part of kids’ menus received higher total HEI-2005 scores (range 57·4–72·0 points; Table 3) compared with the restaurant chains’ overall offerings (range 43·8–49·7 points). However, compared with a score of 39·9 points for the full menu, the Taco Bell kids’ menu received a score of 33·4 (the lowest score for any menu or subset of menu items), with 0 points for Whole Fruit, Dark Green and Orange Vegetables and Legumes, Whole Grains, and Calories from Solid Fats and Added Sugars. The Subway kids’ menu received the highest score (72·0 points) for any menu or subset of menu items, receiving full points for Whole Fruit, Total Vegetables, Total Grains, Milk, Meat and Beans, Saturated Fat, and Calories from Solid Fats and Added Sugars.
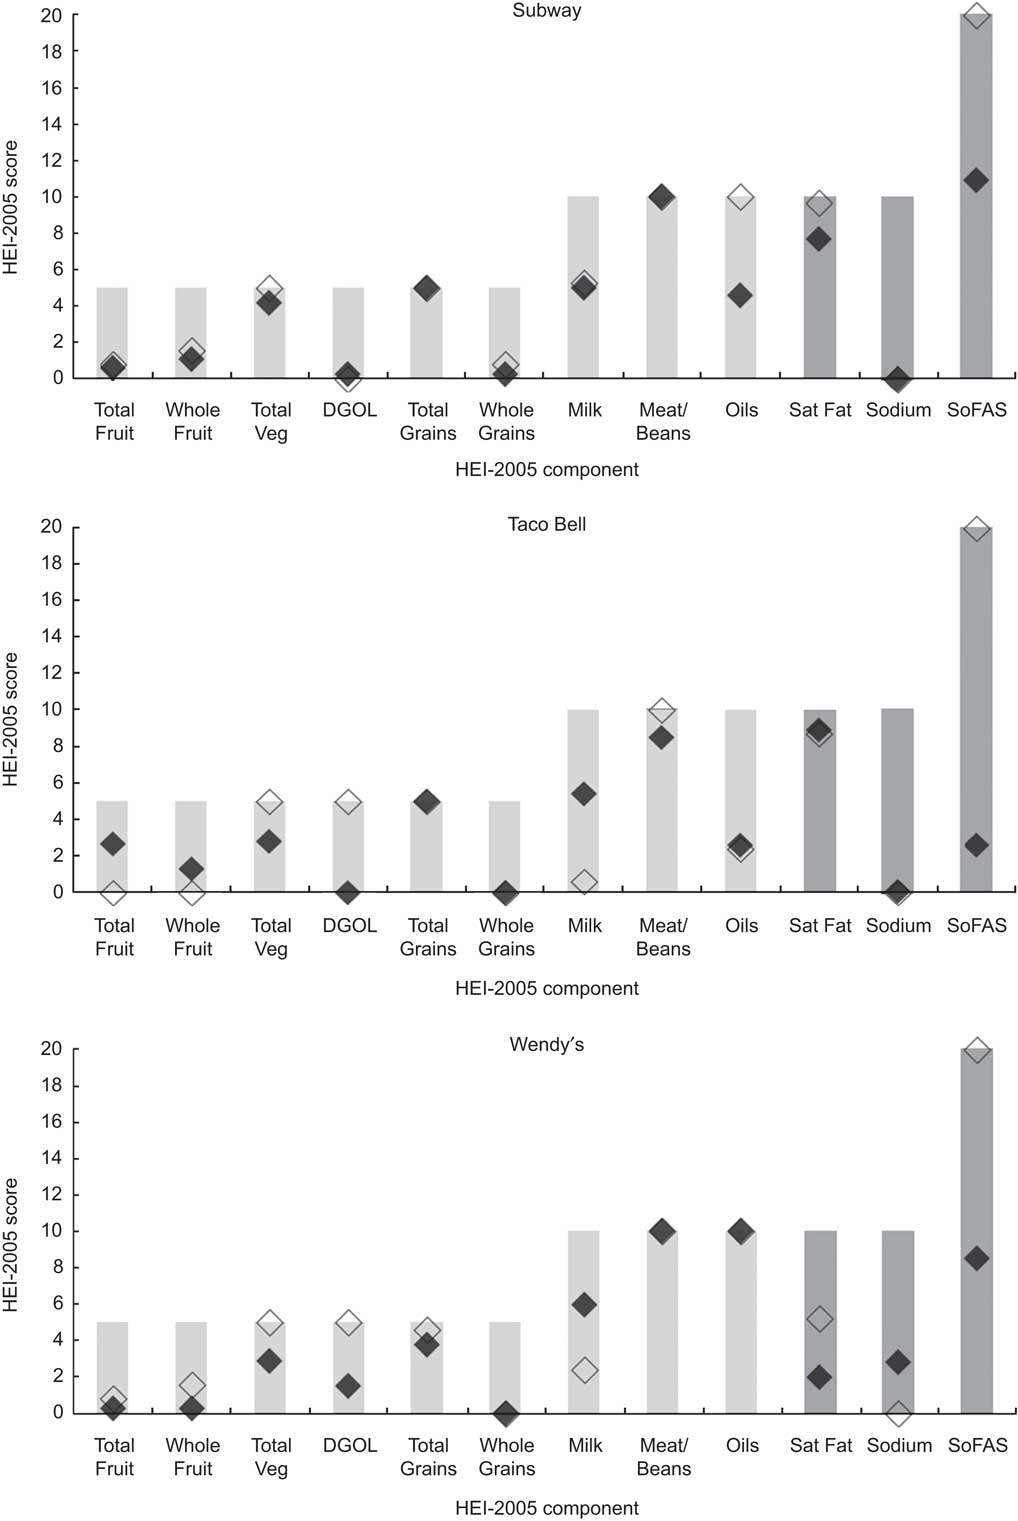
Subway and Taco Bell marketed subsets of their menu items as healthy, and Wendy's identified nutritious items. These menus received scores that were on average 17 points higher than the scores for the full menus. All three scored the maximum for Total Vegetables, Meat and Beans, and Calories from Solid Fats and Added Sugars (Fig. 1). The healthy menus received low scores for Total Fruit, Whole Fruit, Whole Grains, Milk, and Sodium.
Healthy Eating Index-2005 (HEI-2005) component scores (bars indicate maximum score for each component:  , higher score = higher availability;
  , higher score = lower availability) and for full menus (
 ) and menu items described as healthy or nutritious (
 ), by fast-food chain. Subsets of menu items were identified as healthy by Subway (total score: 68·0 v. 49·7 points for the full menu) and Taco Bell (total score: 56·8 v. 39·9 points for the full menu), and as nutritious by Wendy's (total score: 64·6 v. 48·0 points for the full menu). Abbreviations: Total Veg = Total Vegetables; DGOL = Dark Green and Orange Vegetables and Legumes; Meat/Beans = Meat and Beans; Sat Fat = Saturated Fat; SoFAS = Calories from Solid Fats and Added Sugars
Discussion
The present study demonstrates that the overall offerings of popular fast-food restaurants rate poorly in relation to dietary guidance. Each restaurant's full menu scored fewer than 50 points on the HEI-2005 relative to a maximum of 100 points, which would indicate perfect alignment with dietary guidance. Although the discordance between fast-food offerings and dietary guidance is not a surprise, the study pinpoints aspects for which fast-food menus are particularly poor and provides insights into steps that chains might take to improve the quality of their menus. The components that scored the poorest were generally those for which intakes among the US population are furthest from dietary guidance( Reference Krebs-Smith, Guenther and Subar 1 ), including Whole Fruit, Dark Green and Orange Vegetables and Legumes, Whole Grains, and Calories from Solid Fats and Added Sugars. In contrast, all five restaurants scored relatively well on the Total Grains and Meat and Beans components, components for which intakes are less divergent from guidance( Reference Krebs-Smith, Guenther and Subar 1 ). The scores observed for the overall menus are consistent with those of Hearst et al., who examined the HEI-2005 of eight fast-food restaurants using data for 1997/1998 to 2009/2010 from the University of Minnesota Nutrition Coordinating Center Food and Nutrient Database (MO Hearst, L Harnack, KW Bauer et al., unpublished results). In that study, the average HEI-2005 score for the eight restaurants examined (including four of the five restaurants assessed in the present analysis) was 47 points in 1997/1998 and 50 points in 2009/2010.
A unique aspect of the present study is the examination of subsets of menu items marketed on dollar or value, kids’, and healthy or nutritious menus. Scores on dollar or value menus were higher than those for the overall menus except at McDonald's, with a higher score indicating a more appropriate balance of different types of foods on a particular menu. Further, with the exception of Taco Bell, scores on kids’ menus were higher than those for the overall menus. Interestingly, the lowest (33 points at Taco Bell) and highest (72 points at Subway) scores observed across all menus were for kids’ menus. For the four restaurant chains that received higher scores for their kids’ menus compared with their overall menus, the higher total scores tended to be driven by better component scores for Total Fruit, Whole Fruit, Saturated Fat, and Calories from Solid Fats and Added Sugars. However, kids’ menus were devoid of dark green and orange vegetables and legumes, and whole grains. Although the kids’ menus were of somewhat higher quality than the overall menus, substantial changes are needed to shift the menus towards closer alignment with dietary recommendations, consistent with earlier analyses that found relatively few menu items at the top twelve fast-food restaurants (including the five analysed here) could be described as healthy in relation to criteria for young people's dietary intakes( 12 ). It is noteworthy that three restaurant chains identified items as healthy or nutritious and that these subsets of menu items received higher scores than the overall menus, although the scores were still low compared with the maximum possible score of 100 points.
The HEI-2005 has previously been used to assess the US food supply, with a total score for 2005 food supply data of 55 points( Reference Krebs-Smith, Reedy and Bosire 17 ). It is thus not only the healthfulness of the offerings of fast-food chains but also of other venues, including supermarkets, convenience stores and cafeterias, that requires attention. However, fast-food chains deserve special attention given their popularity, as indicated by their contribution to energy intakes and their sales volume( 12 ); their aggressive marketing practices, particularly to children, adolescents and minority groups( 12 , Reference Powell, Szczypka and Chaloupka 22 ); and indications of their disproportionate concentration relative to other food sources in low-income and minority areas( Reference Larson, Story and Nelson 23 ). Further, recent analyses provide little evidence to suggest that fast-food restaurants engage in practices aimed at encouraging selection of healthier options even when they are available( 12 ). For example, although McDonald's and Burger King display healthy side dishes and beverages in their advertising to children, outlets have been found to automatically serve French fries and soda with kids’ meals the majority of the time( 12 ). Improving the quality of the foods served and promoted within fast-food restaurants is clearly needed. Until that occurs, efforts to reduce exposure to fast-food restaurants, both physically and through advertising, seem warranted.
Some restaurant chains have recently pledged action to improve the quality of their offerings, as well as to promote healthier defaults. For example, McDonald's announced in 2012 that Happy Meals will automatically include apple slices and a new kid-size fry, as well as a choice of fat-free milk or apple juice( 24 ). In addition, menu items being explored by McDonalds for introduction in 2013 incorporate food groups encouraged by dietary guidance, such as seasonal fruit and vegetables and a breakfast sandwich made with a wholegrain English muffin( 25 ). Numerous other restaurants have committed to the Kids LiveWell programme, which was launched by the National Restaurant Association in July 2011 and aims to help parents and children choose healthier menu options( 26 ). As of February 2012, sixty-eight restaurant brands representing over 20 000 locations were participants in this voluntary programme( 27 ), which entails offering and promoting a selection of items that meet qualifying nutrition criteria based on expert recommendations, including the 2010 Dietary Guidelines.
Although changes such as those under consideration by McDonald's and promoted by Kids LiveWell may represent a step in the right direction, an outstanding question is whether the traditional model of fast food, typified by restaurants serving hamburgers, fries and soda, can be consistent with health. As noted by Reedy et al. in their earlier analysis of the McDonald's dollar menu, switching to wholegrain for most bread products could improve the total HEI-2005 score by nearly 5 points whereas offering exclusively sugar-free beverages could add 3 points to the total score( Reference Reedy, Krebs-Smith and Bosire 18 ). Given the volume of food sold by fast-food chains, these small changes could have a positive effect on the quality of dietary intakes at the population level. However, major improvements to the quality of fast-food menus as quantified by HEI-2005 scores would require chains to make significant shifts in their offerings, by not only introducing more healthy options but also removing or reformulating items that are major sources of sodium, solid fats and added sugars.
The current study is not without limitations. We examined the top fast-food chains in terms of US sales; a broader analysis examining different types of restaurant chains, such as pizza and fried chicken outlets, could shed further light on fast-food offerings. However, because such chains do not offer many fruits, vegetables and whole grains for example, we would not expect them to receive markedly higher HEI-2005 scores than those reported here. As noted, FNDDS does not include brand-specific data for all foods. To address this, chain-specific energy and nutrient (saturated fat and sodium) data were used and the chains’ energy values were used to calibrate food group values. This procedure resulted in total scores for overall menus that were 0·04 points lower on average (range −1·4 to +1·3 points) compared with using uncalibrated food group values from MPED. Although the accuracy of the chains’ data was not assessed, a previous study suggested that the stated energy contents of quickserve restaurant foods were accurate overall( Reference Urban, McCrory and Dallal 28 ). Enhanced databases with brand-specific data would improve our capacity to monitor the quality of a variety of food environments.
The components of the HEI-2005 are scored on a density basis, which allows its use to assess any mix of foods, including restaurant menus. One caveat is that the inclusion of energy-dense items increases the denominator (total energy) for each component. For example, Saturated Fat scores might be inflated (indicating a lower density) due to items such as sweetened beverages that contribute energy but not saturated fat. Within the HEI-2005 algorithm, higher densities of adequacy components result in higher scores and there is no consideration of whether these components are present in excess amounts. This may be a concern for components for which there is evidence of overconsumption among the US population, such as Total Grains and Meat and Beans( Reference Kirkpatrick, Dodd and Reedy 2 ). If the presence of these components in excess amounts resulted in a reduction in points, fast-food menus, which tend to be dominated by items such as hamburgers and other sandwiches, would likely receive lower overall scores.
Standardization criteria were applied to improve comparability across outlets. Choices made in developing these criteria, such as assuming cheese and sauce on a proportion of Subway sandwiches, may not accurately reflect common practices within outlets but were intended to enable a balanced assessment of restaurant offerings. Despite the steps taken to standardize the menus, caution is warranted in making comparisons across chains given that the differences, at least in part, may reflect our reliance on menus obtained from company websites that provided nutrition information in varying ways, as well as assumptions made for menu items at some chains. For example, Subway's score for Total Vegetables reflects the assumptions made about optional vegetable toppings on sandwiches.
We did not attempt to address differences in approaches to special menus (e.g. the number and types of items included). The scores for the special menus reflect only the nutritional quality of the items that restaurants chose to promote on these menus, not the full array of offerings available within the outlet. For example, the Subway kids’ menu did not include sweetened beverages, cookies or potato chips. However, once inside a Subway outlet, children are exposed to a broader array of menu offerings, as well as in-store marketing promoting items not included on the kids’ menu.
A previous examination of the McDonald's dollar menu using data collected in 2009 yielded a score of 43 points( Reference Reedy, Krebs-Smith and Bosire 18 ) compared with 36 points in the present analysis. The earlier analysis considered the dollar menu at a single McDonald's location as opposed to the online menu for the full chain. As well, in the previous analysis, all foods available for lunch and dinner were counted twice since the same menu was posted for both meals. Research showing that breakfast items score the most poorly in terms of nutrition quality( 12 ) is consistent with the lower score observed in the present analysis, in which breakfast items were weighted more heavily (each item was counted only once in the current analysis regardless of whether it was offered at multiple meals, in contrast to the earlier analysis in which lunch and dinner items were counted twice). According to either analysis, the McDonald's dollar menu rates poorly in relation to dietary guidance. Nevertheless, the contrasting results highlight the need for careful attention to data collection procedures and the comparability of metrics across studies.
Conclusions
The present study demonstrates significant gaps between the menu offerings of five popular fast-food restaurants and recommendations for healthy eating. Menus fared most poorly for food groups that tend to be problematic in the American diet, especially among low-income and minority groups( Reference Krebs-Smith, Guenther and Subar 1 , Reference Kirkpatrick, Dodd and Reedy 2 ). While industry has engaged in some initiatives aimed at improving the healthfulness of its offerings, particularly in relation to children, ongoing monitoring is needed to assess the effects of such initiatives and to determine the need for additional interventions. The HEI-2005 may be a useful metric for such monitoring, as demonstrated by Hearst et al.'s analysis in which HEI-2005 scores of several restaurants were examined over a 12-year period, highlighting the fact that there has been little improvement in the dismal scores that fast-food restaurant menus receive relative to dietary guidance since the mid-1990s (MO Hearst, L Harnack, KW Bauer et al., unpublished results). The present analysis illustrates the potential for variation in the scores of subsets of items promoted on special menus, such as dollar or value and kids’ menus, highlighting the need for attention not only to the full array of offerings but also those targeted at particular subgroups of consumers.
Acknowledgements
Sources of funding: This research was funded in part by the Robert Wood Johnson Foundation and the Rudd Foundation. Conflicts of interest: There are no conflicts of interest to report. Ethics: Ethical approval was not required. Authors’ contributions: All authors participated in the design of the study. J.L.H. oversaw data collection; P.O.-V. provided advice on data collection; S.I.K., J.R. and S.M.K.-S. developed the analytic strategy and oversaw coding and analysis; and L.L.K. conducted the analysis. S.I.K. led the development of the manuscript. All authors provided critical feedback and contributed to the interpretation of the results. All authors read and approved the final manuscript. Acknowledgements: The authors are grateful to Yeeli Mui, Jackie Thompson and the other Rudd Center staff who collected and organized the data; to Thea Zimmerman, Westat, for menu coding; and to Carmita Signes, NOVA Research Company, for creating the figure.



