




1. Introduction
Over the last century, a profound historiographical debate has been taking place regarding the evolution of the standards of living of the working class during the industrialization process and has referred to many demographic, economic, anthropometric, and well-being indicators. Within this general framework, an increasing amount of attention has been given to the evolution of food consumption patterns and the changes in dietary structure. In fact, over the last century, an abundance of historical studies have been conducted on the diet of the working class, particularly in the English-speaking world (Hobsbawm, Reference Hobsbawm1957; Oddy, Reference Oddy1970; Fogel, Reference Fogel1993; Clark et al., Reference Clark, Huberman and Lindert1995; Logan, Reference Logan2006a, Reference Logan2006b, Reference Logan2009; Floud et al., Reference Floud, Fogel, Harris and S.c2011; Horrell and Oxley, Reference Horrell and Oxley2012; Gazeley and Horrell, Reference Gazeley and Horrell2013; Gazeley and Newell, Reference Gazeley and Newell2013, Reference Gazeley and Newell2015; Gazeley et al., Reference Gazeley, Newell, Reynolds and Rufrancos2022, Reference Gazeley, Holmes, Newell, Reynolds and Gutierrez Rufacos2023; among others).
On a theoretical level, this process has been defined as the nutrition transition, which examines the impact of industrialization and economic growth on standards of living based on the analysis of dietary changes. Within this framework, the changes in dietary structure over the last few centuries in Europe and other parts of the world have been determined. These changes consist of an overall increase in calorie and protein intake and the shift from a diet of predominantly cereals to one with other types of food, particularly of animal origin. In the eighteenth and nineteenth centuries, Europe shifted away from chronic malnutrition with recurrent episodes of famine toward a new phase characterized by the reduction in hunger and better diets (Fogel, Reference Fogel1993, Reference Fogel2004; Popkin, Reference Popkin1993; Grigg, Reference Grigg1995).
The principal explanatory factor of this process considered by the literature was the changes in income, but other factors could also have intervened, related to the economic, environmental, social, and cultural conditions, together with the role of the institutions. For example, Logan (Reference Logan2006a, Reference Logan2006b, Reference Logan2009) measured the impact of income and prices by calculating the elasticity of demand of food to changes in these two variables for North America and Britain at the end of the nineteenth century, finding that both were relevant, particularly income. Gazeley and other authors note how the inequality in the level of income intensely affected the diet of British households and other parts of Europe, although other factors also intervened, such as public policies, the structure of the households and changes in the production and distribution of food (Gazeley and Horrell, Reference Gazeley and Horrell2013; Gazeley and Newell, Reference Gazeley and Newell2013, Reference Gazeley and Newell2015; Gazeley et al., Reference Gazeley, Newell, Reynolds and Rufrancos2022, Reference Gazeley, Holmes, Newell, Reynolds and Gutierrez Rufacos2023). Collantes (Reference Collantes2015b, Reference Collantes2019) and Delgado Perea (Reference Delgado Perea2024) also highlighted the role of income, together with changes in tastes and preferences, in order to understand the growth and transformation of the consumption of meat and dairy products in Spain during the second half of the twentieth century. Studies focused on more recent periods ratify the fundamental role of income for large samples of countries, considering that other factors such as public policies, access to international markets and cultural and social aspects (education, urbanization, etc.) also played a relevant role in dietary change (Gil et al., Reference Gil, Pérez and Gracia1995; Gossard and York, Reference Gossard and York2003; Gerbens-Leenes et al., Reference Gerbens-Leenes, Nonhebel and Krol2010; Kearney, Reference Kearney2010; Rask and Rask, Reference Rask and Rask2011; Vranken et al., Reference Vranken, Avermaete, Petalios and Mathijs2014; Clonan et al., Reference Clonan, Roberts and Holdsworth2016; Cardoso Marques et al., Reference Cardoso Marques, Fuinhas and D.f2018; McCullough et al., Reference McCullough, Chantaprasopsuk, Islami, Rees-Punia, Um, Wang, Leach, Sullivan and Patel2022; among others).
The principal objective of this study is to determine and quantify the role that certain explanatory factors had in the dietary change, such as income and prices, and other determining factors that could intervene, that are more difficult to quantify, such as the tastes and preferences of the population. All of this seeks to gain a better understanding of the nutrition transition model and the mechanisms that drove it. In order to fulfil this objective, a case study of a Mediterranean European country, Spain, has been conducted. This country experienced the nutrition transition process with a delay compared to other countries of central and northern Europe. The methodology comprises a panel data model with random effects for 28 food items that group consumption per capita data of 65 foods for the period between 1926 and 1980. By the early 1980s, the nutritional transition had concluded with the homogenization of the Spanish diet with respect to its European neighbors, despite ongoing geographical and social inequalities. This has enabled us to calculate the elasticity of the demand for these foods to changes in income and prices, both of the total sample and the different food groups established in accordance with their characteristics and the historical evolution of consumption: traditional foods (cereals, wine, and olive oil); animal products (meat, milk, eggs, fish); and fruit and vegetables.
The text is structured as follows: after this introduction, a literature review is conducted, analyzing the nutrition transition from a historical point of view in the case of Spain. Section 3 describes the database constructed and the methodology applied for conducting the quantitative exercise. Section 4 descriptively presents the first findings, and Section 5 presents the results of the aforementioned exercise. Section 6 conducts a discussion with the literature, and the final section draws the main conclusions.
2. Literature review
In the case of Mediterranean Europe, the nutrition transition occurred more slowly and with a delay with respect to other areas and with distinctive characteristics. This was the case of Spain. The advances made in historiography have enabled us to clearly establish the chronology of the nutrition transition. It began in the last third of the nineteenth century and was temporarily interrupted during the Spanish Civil War (1936–1939) and the early years of the Franco dictatorship, with the resulting deterioration in standards of living, and then resumed during the 1950s and, particularly, the 1960s. The process was completed in the 1980s with the definitive westernization of the Spanish diet. The specific features of this country can also explain the emergence of new consumption patterns, which displayed a greater weight of proteins, calories, and vegetable fats than in Atlantic Europe, at least during the first phases of the nutrition transition. Moreover, it seems that it was not a homogeneous process as there were considerable geographical, social, gender and generational differences (Simpson, Reference Simpson1989; Moreno et al., Reference Moreno, Sarría and Popkin2002; Cussó Segura, Reference Cussó Segura2005; Nicolau-Nos and Pujol-Andreu, Reference Nicolau-Nos and Pujol-Andreu2005, Reference Nicolau-Nos and Pujol-Andreu2006; Cussó Segura and Garrabou Segura, Reference Cussó Segura and Garrabou Segura2007; González de Molina et al., Reference González de Molina, Soto, Aguilera and Infante2014; Pujol-Andreu and Cussó Segura, Reference Pujol-Andreu and Cussó Segura2014; Gallego Martínez, Reference Gallego Martínez2016; García Gómez and Trescastro López, Reference García Gómez and Trescastro López2017; Germán and Langreo, Reference Germán and Langreo2018; Medina-Albaladejo and Calatayud, Reference Medina-Albaladejo and Calatayud2020, Reference Medina-Albaladejo and Calatayud2021; Cussó Segura et al., Reference Cussó Segura, Gamboa, Pujol-Andreu, Albaladejo, Carrión and Calatayud2023; Medina-Albaladejo et al., Reference Medina-Albaladejo, Calatayud, Nicolau-Nos, Pujol-Andreu, Albaladejo, Carrión and Calatayud2023; among others).
Studies have also been published on certain foods of animal origin that were particularly important in the nutrition transition process. An example is milk, which, at the end of the nineteenth century, was a food that was not highly valued and only consumed in a soft-food diet prescribed for medical reasons. Therefore, consumption levels were very low in Spain, particularly in the Mediterranean area. However, at the end of the nineteenth century, the calcium, phosphorous and vitamin content of milk became known, and its consumption increased during the first decades of the twentieth century, although with large regional variations, with the leaders being the cities (Nicolau-Nos et al., Reference Nicolau-Nos, Pujol-Andreu and Hernández2010; Hernández Adell and Pujol-Andreu, Reference Hernández Adell and Pujol-Andreu2017; Hernández Adell et al., Reference Hernández Adell, Muñoz Pradas and Pujol-Andreu2019; Calatayud and Medina-Albaladejo, Reference Calatayud and Medina-Albaladejo2017).
The cases of milk and meat have been studied in depth for the second half of the twentieth century in recent years as an essential part of the nutrition transition and the shift toward a westernized diet in Spain, with a more industrialized and processed dietary model. In the first case, it has been shown how the dissemination and adoption of the mass consumption of dairy products took place during the second half of the twentieth century, in a non-homogeneous process marked by geographical and social inequalities (Collantes, Reference Collantes2015a, Reference Collantes2015b, Reference Collantes2019; Delgado Perea and Pinilla, Reference Delgado Perea, Pinilla, Albaladejo, Carrión and Calatayud2023). Meanwhile, meat consumption shifted from being meagre in the 1950s to excessive thirty years later, particularly that of processed meats, with the presence of intense socioeconomic inequalities (Delgado Perea, Reference Delgado Perea2023, Reference Delgado Perea2024; Delgado Perea and Espinosa-Gracia, Reference Delgado Perea and Espinosa-Gracia2023; Delgado Perea and Pinilla, Reference Delgado Perea, Pinilla, Albaladejo, Carrión and Calatayud2023).
With respect to the causes that the literature has analyzed to explain the changes in the dietary structure, it is commonly believed that the growth in income is the principal explanatory factor, and there is an abundance of studies that adopt this approach. However, the importance of other factors that help to explain this phenomenon in addition to income has also been underlined. In the case of Spain, on a theoretical level, Nicolau-Nos and Pujol-Andreu (Reference Nicolau-Nos and Pujol-Andreu2008) called into question the single role of income, particularly in the long term, defending the importance of other factors, such as scientific knowledge in nutrition and its social dissemination; the environmental and technological conditions of food production and distribution; and other aspects related to standards of living, such as the characteristics of housing, the existing domestic infrastructures and available energy, the distribution of time in households, the duration of the working day, the composition of families and the age structure of the population and its state of health. On an empirical level, the best studied cases are the aforementioned dairy products and meat. In both processes economic factors intervened, such as income or prices, but also others such as medical recommendations, changes in supply, the perception of quality that the product had or the new preferences of consumers, as noted by authors such as Collantes (Reference Collantes2015b; Reference Collantes2016, Reference Collantes2017a, Reference Collantes2017b, Reference Collantes2019, Reference Collantes2018, Reference Collantes2020, Reference Collantes2025); Delgado Perea (Reference Delgado Perea2024); Delgado et al. (Reference Delgado, Pinilla and Belloc2024). Other, more general studies have also indicated the importance of income, considering that low wages could be one of the principal obstacles to the progression of the nutrition transition in Spain at the beginning of the twentieth century. However, both the internal and external trade structures of the country could have also played an important role, with high tariffs, high transport costs and a poor development of the food distribution sector (Gallego Martínez, Reference Gallego Martínez2016). The elimination of these obstacles, the development of the agri-food industry, and the change in preferences contributed to the dietary change in the second half of the twentieth century (Germán and Langreo, Reference Germán and Langreo2018).
Therefore, this study advances the knowledge in this aspect for the Spanish case based on a quantitative exercise that enables us to broadly address the role of economic factors, such as income and prices, in the nutrition transition and other elements, which undoubtedly intervened in the dietary change throughout the twentieth century. In other words, it establishes the principal determinants of the nutrition transition in the very long term in a country of Mediterranean Europe, and quantifies, for the first time, the real impact of the changes in income and prices on this historical process.
3. Data and methodology
In Spain, similarly to many other countries, there are no consumer surveys available before the mid-twentieth century. Therefore, for the analysis of the nutrition transition on a historical level, it is common practice to use aggregated indicators (average estimates on a country, regional or municipal scale) that are indirect (with production and trade or relative price data) due to the scarcity of primary sources (Simpson, Reference Simpson1989; Cussó Segura, Reference Cussó Segura2005; Nicolau-Nos and Pujol-Andreu, Reference Nicolau-Nos and Pujol-Andreu2005, Reference Nicolau-Nos and Pujol-Andreu2006; González de Molina et al., Reference González de Molina, Soto, Aguilera and Infante2014; Cussó Segura et al., Reference Cussó Segura, Gamboa, Pujol-Andreu, Albaladejo, Carrión and Calatayud2023). In recent years, the use of institutional diets, particularly those of hospitals, has become widespread as a more direct estimate of the dietary intake among the most disadvantaged segments of the population (García Gómez and Trescastro López, Reference García Gómez and Trescastro López2017; Medina-Albaladejo and Calatayud, Reference Medina-Albaladejo and Calatayud2020, Reference Medina-Albaladejo and Calatayud2021; Medina-Albaladejo et al., Reference Medina-Albaladejo, Calatayud, Nicolau-Nos, Pujol-Andreu, Albaladejo, Carrión and Calatayud2023).
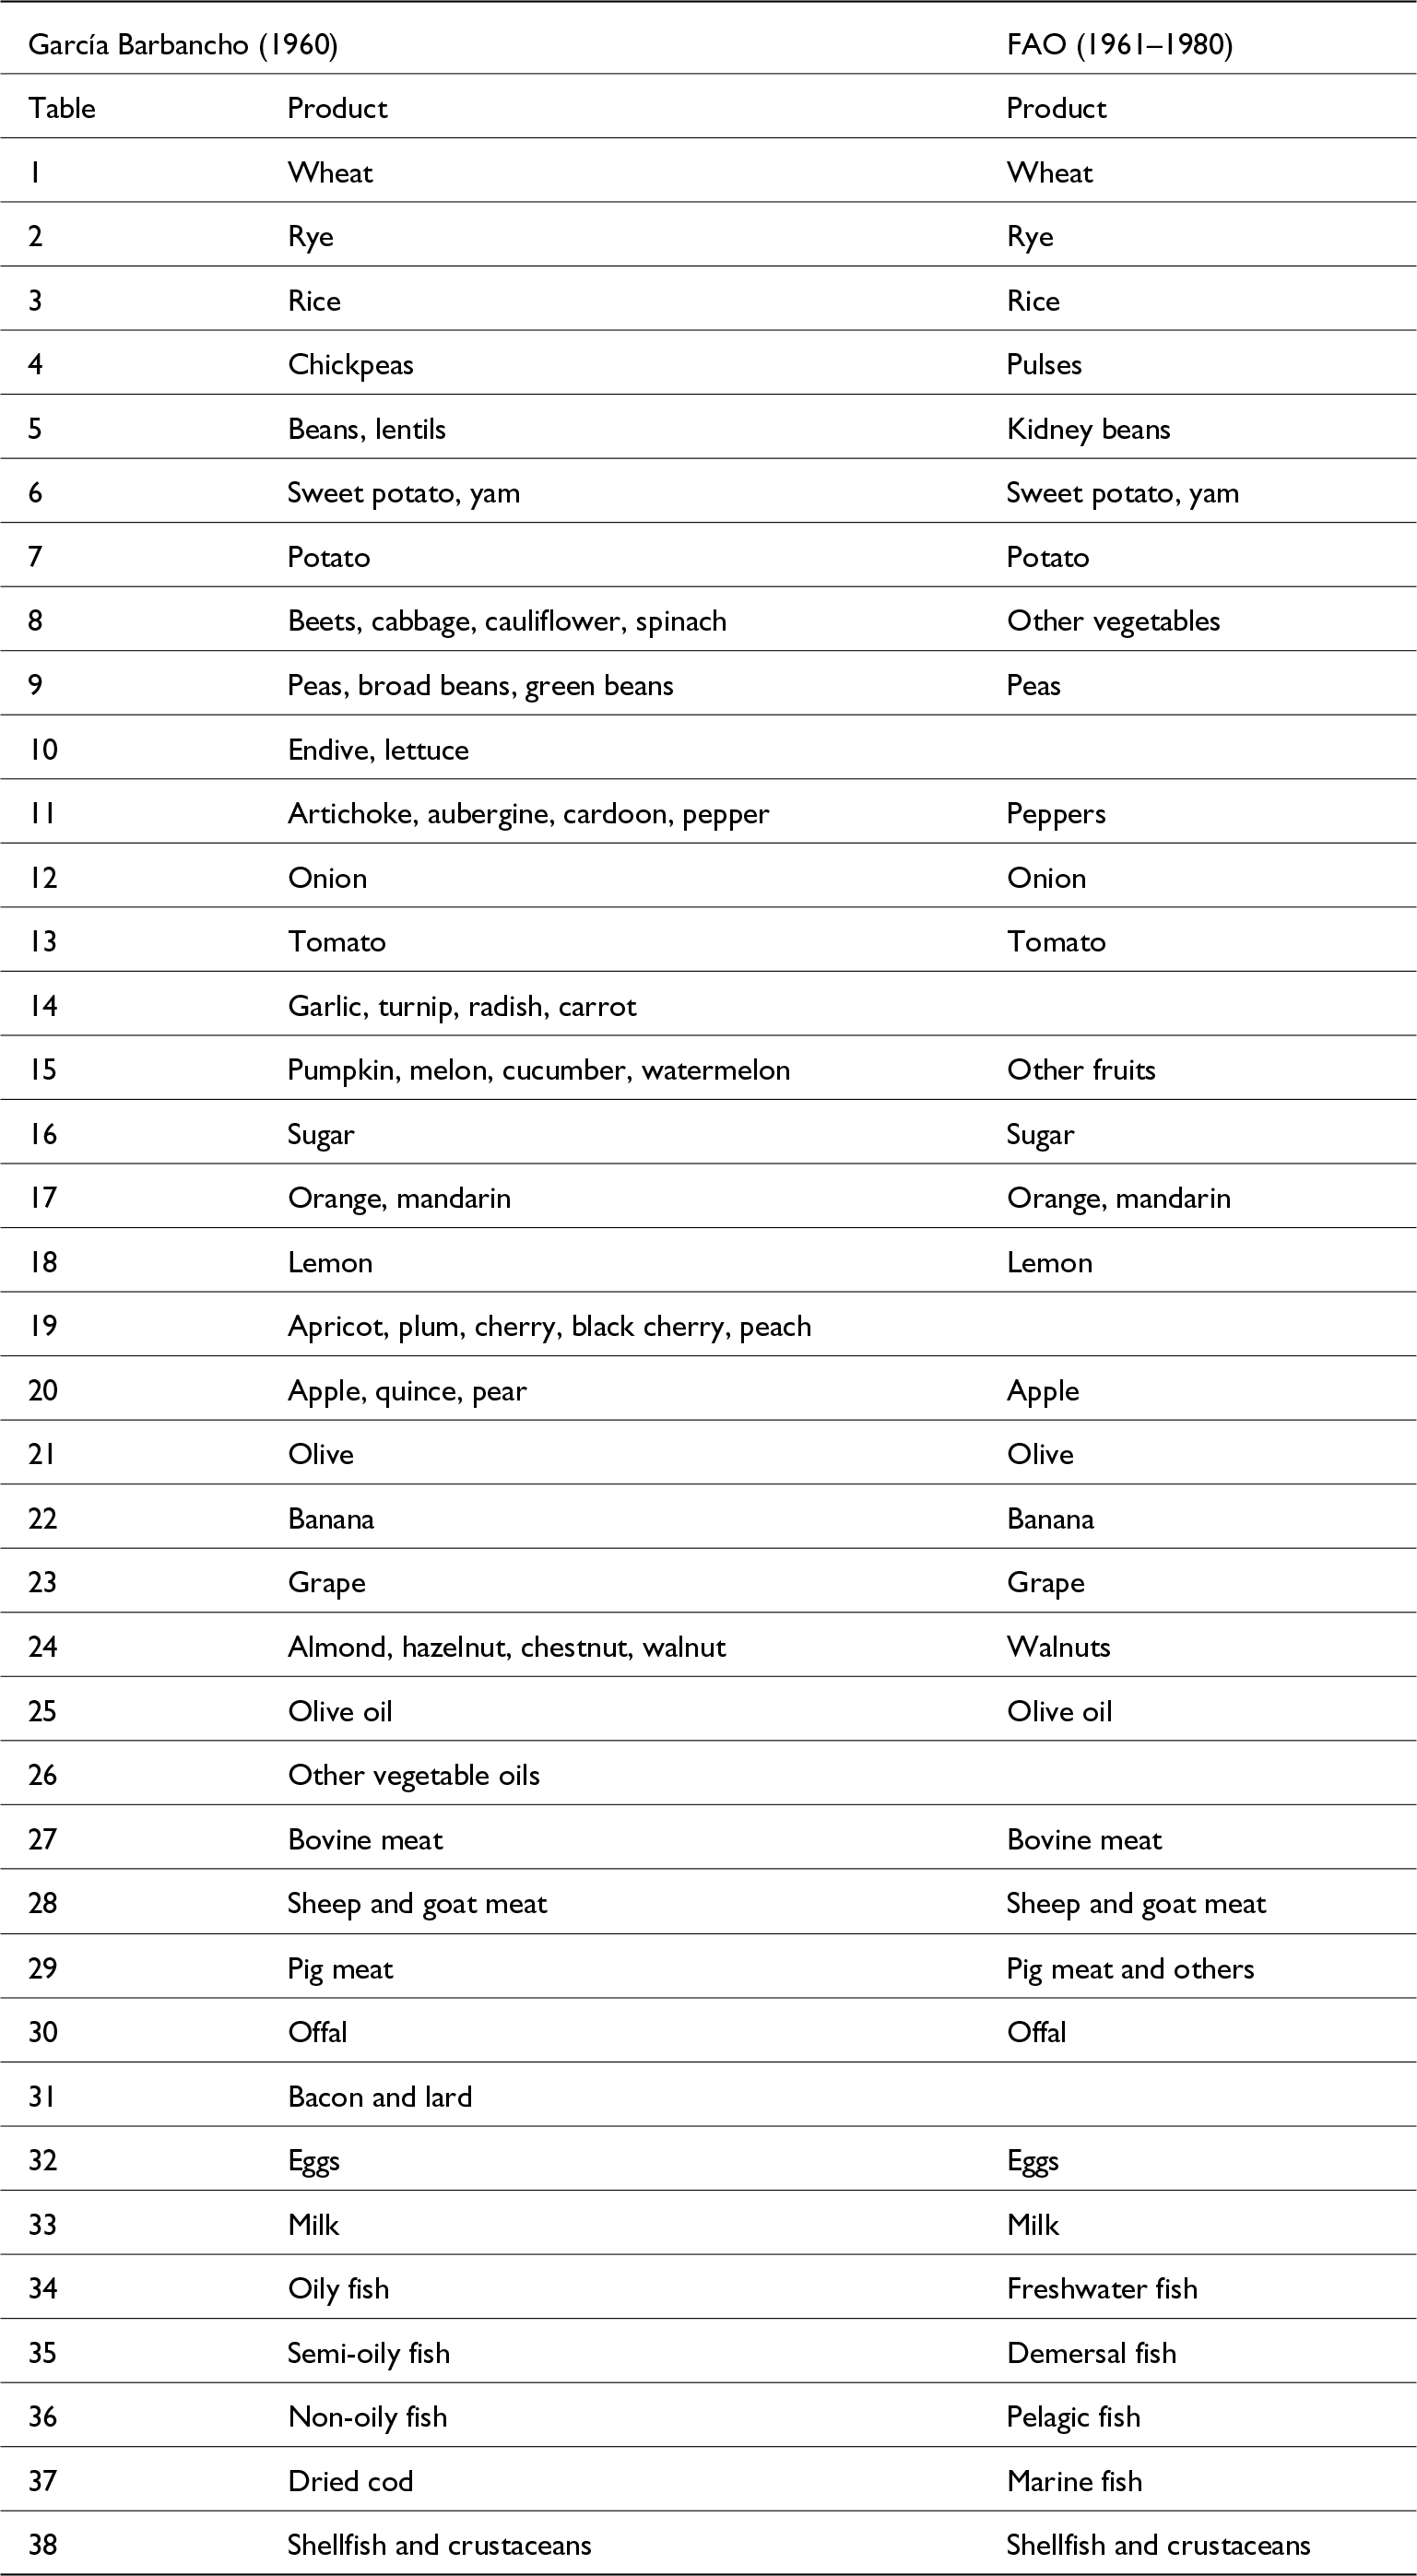
For this study, a database of consumption and prices has been constructed for 28 food items on an aggregate level in Spain for the period 1926–1980, grouping together a total of 65 food products. All of them have been classified into three large categories: traditional foods (9 items), fruit and vegetables (13), and products of animal origin (6), which, in turn, have been divided into six sub-categories (see annex). The sources used are: García Barbancho (Reference García Barbancho1960), Spain’s yearbooks of agricultural statistics (Ministerio de Agricultura, 1928-1980), and the FAO food balance sheets (Food and Agriculture Organization of the United Nations (FAO), 1961-1980). The chronological framework has been determined in accordance with the available consumption and price data in these sources, which, in both cases, begin in 1926. The study period ends in 1980, when the nutrition transition process and the westernization of the diet were completed, according to the literature, after which other explanatory factors came into play, which do not fall within the scope of this study.
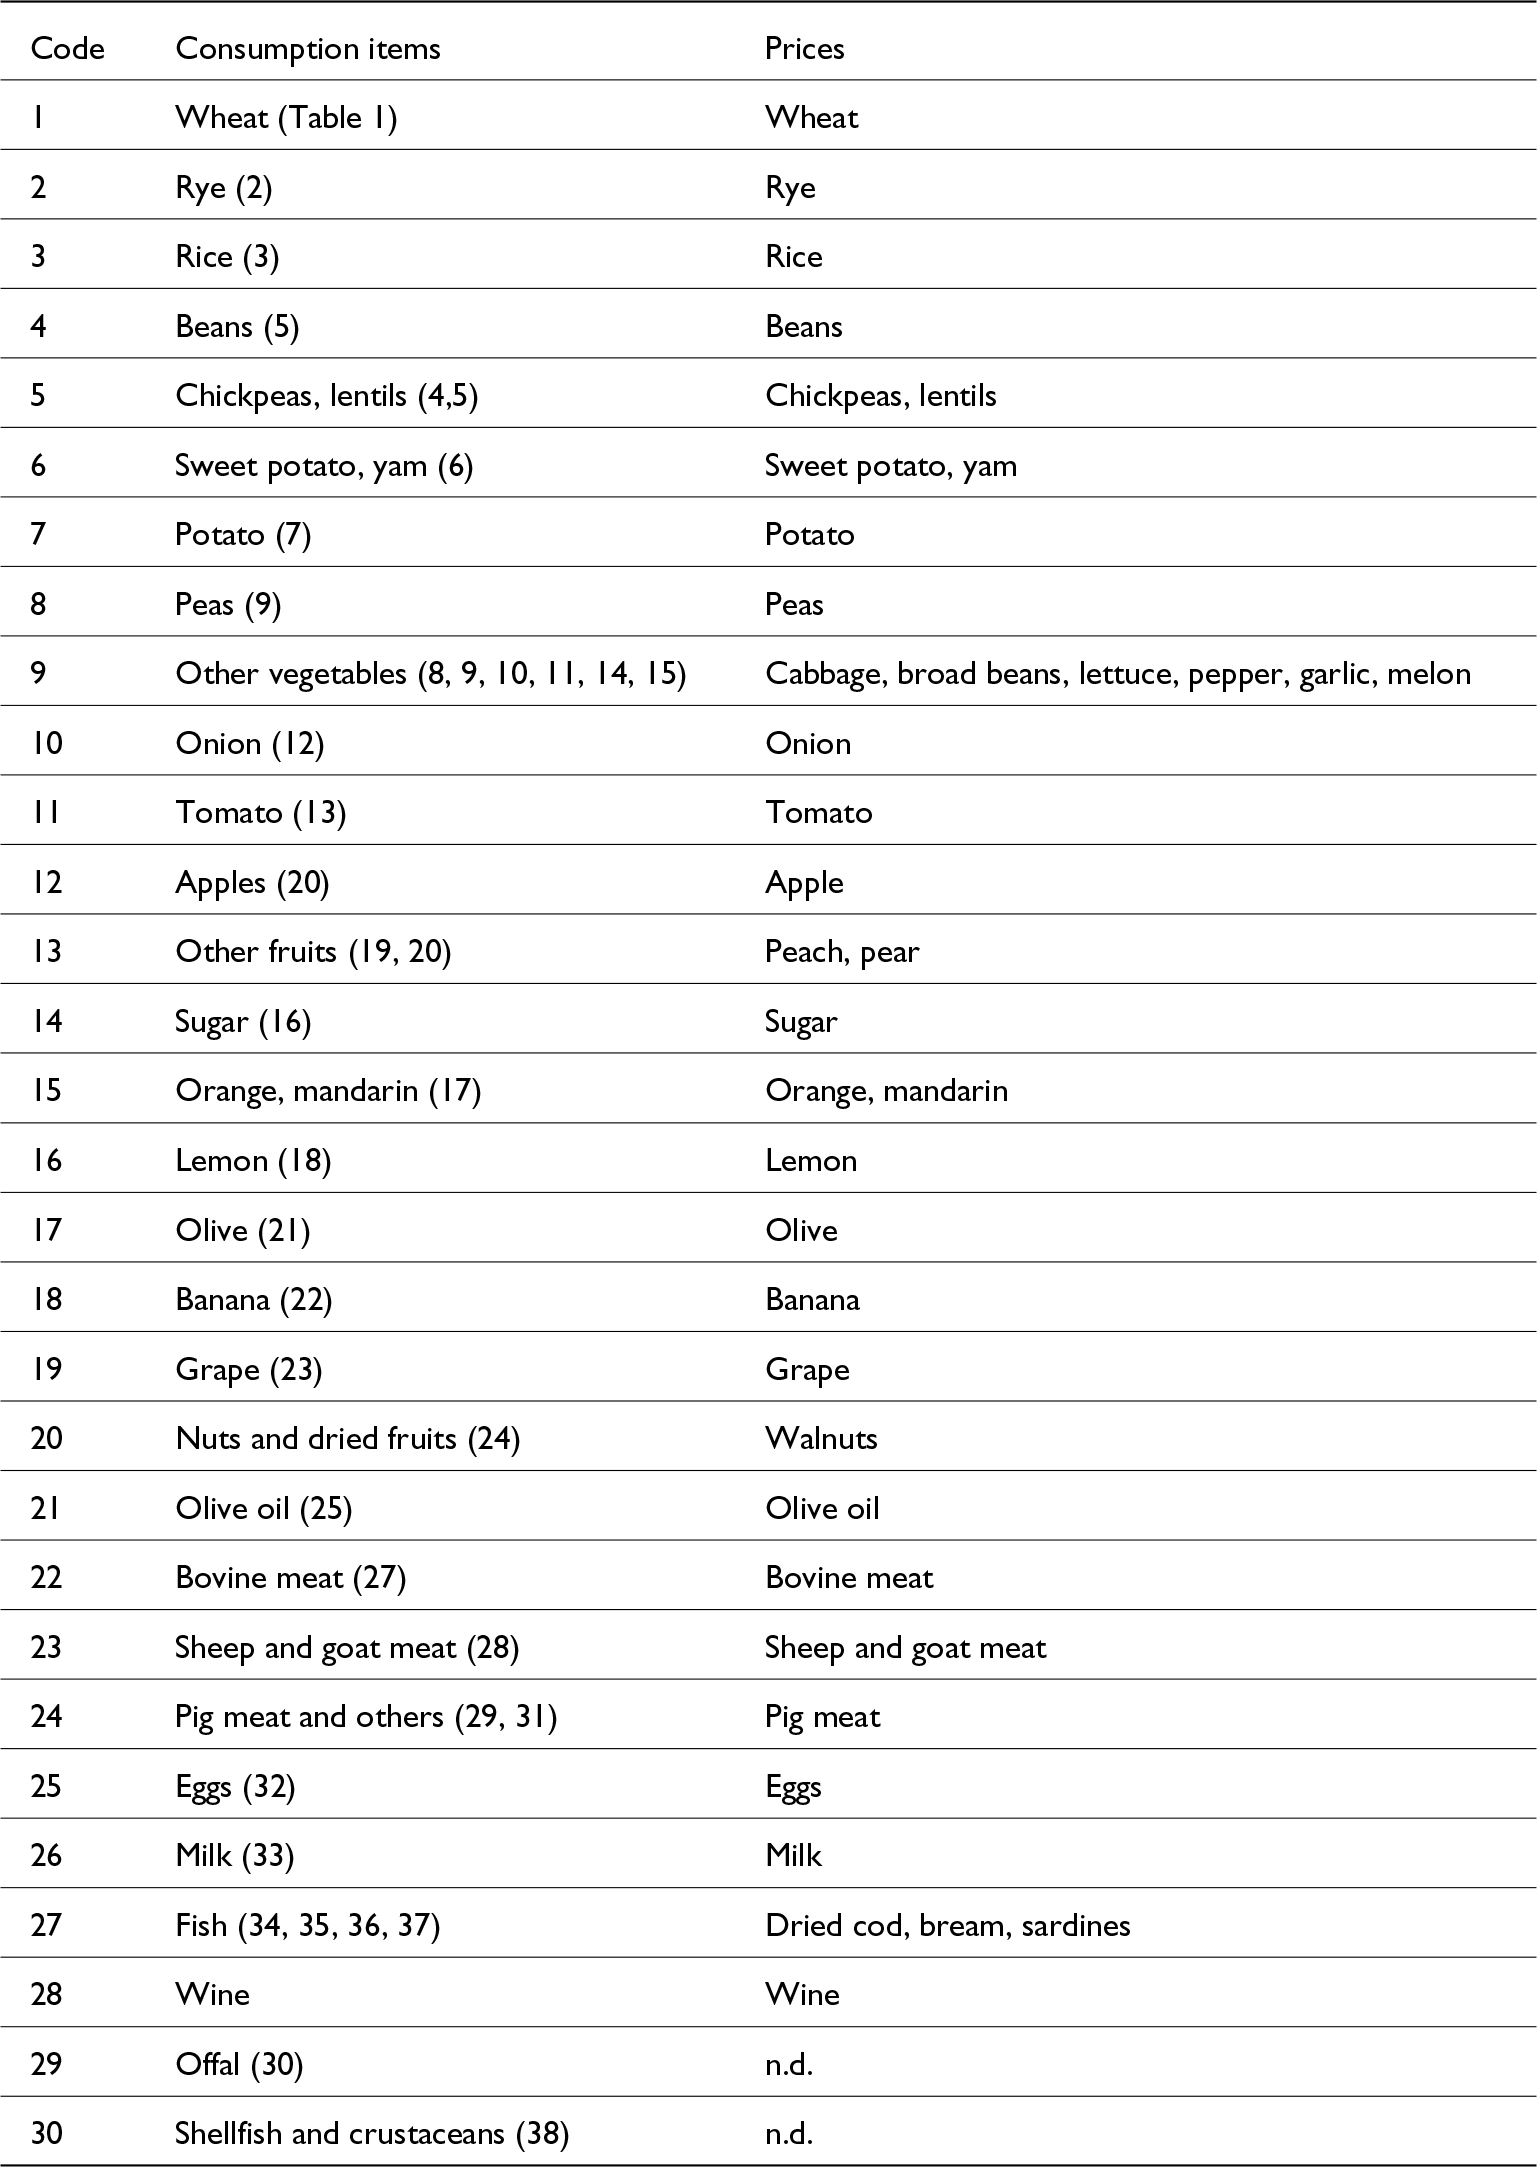
The price series of the 28 items analyzed has been constructed based on the unit values contained in the yearbooks of agricultural statistics (Ministerio de Agricultura, 1928-1980). In other words, they are not market prices, but the prices earned by the farmers, as they are the result of dividing the total annual value of the production of each of the products by the volume produced, obtaining nominal prices. Real prices have been obtained from this information using the Consumer Price Index of Maluquer de Motes (Reference Maluquer de Motes2013), constructing the independent variable Real price, which is expressed in constant pesetas per kilogram of each food item. In the case of the items that include different products, weighted averages have been calculated of the prices of the most representative foods depending on their volume of production and consumption. In the item “other vegetables,” the prices of cabbage, broad beans, lettuce, peppers, garlic, and melon have been selected. In the ‘other fruits’ item, peaches and pears have been selected. In “nuts and dried fruits,” walnuts and in “fish” salted cod, bream, and sardines have been selected.
For consumption between 1926 and 1956, the data from “Análisis de la alimentación española” published by the economist Alfonso García Barbancho (Reference García Barbancho1960) have been used, except for the interval of the Spanish Civil War (1936–39), as this source does not provide reliable information for this period. This source includes the consumption data expressed in kilograms per inhabitant and year for 68 food products grouped into 38 tables for the period mentioned. Meanwhile, the FAO food balance sheets (Food and Agriculture Organization of the United Nations (FAO), 1961-1980) provide consumption data from 1961 to the present day. In order to link the consumption series of García Barbancho (Reference García Barbancho1960) with the data available in the FAO food balance sheets (Food and Agriculture Organization of the United Nations (FAO), 1961-1980), the number of items has been reduced to 29, of which two have been discarded: “offal” and “shellfish and crustaceans” as there is no information on the prices of these products in the sources. The wine series has also been added.Footnote 1 This is a basic product in Mediterranean countries and does not appear in García Barbancho (Reference García Barbancho1960). Finally, the database included a total of 28 food items (see Annex). In order to complete the gap between 1957 and 1960 in the consumption series, the data from the yearbooks of agricultural statistics have been used (Ministerio de Agricultura, 1928-1980). The variable consumption has been calculated for the abovementioned 28 food items in the period 1926–80, expressed in kilograms consumed per person and day.
All of these sources show consumption through the calculation of food balance sheets, due to the lack of consumption records before the 1950s. This methodology provides an indirect estimate of consumption based on the supply of foods and is currently used by the FAO and the literature on an international level (Gerbens-Leenes et al., Reference Gerbens-Leenes, Nonhebel and Krol2010; Kearney, Reference Kearney2010; Rask and Rask, Reference Rask and Rask2011; Clonan et al., Reference Clonan, Roberts and Holdsworth2016; Cardoso Marques et al., Reference Cardoso Marques, Fuinhas and D.f2018; Vranken et al., Reference Vranken, Avermaete, Petalios and Mathijs2014; among others), which is obtained as follows:
 \begin{align}{\text{Consumption}} =& \left( {{\text{production}} + {\text{stocks}} + {\text{imports}} - {\text{exports}}} \right)\nonumber\\
&\quad - {\text{feed use}} - {\text{losses}} - {\text{seed}} - {\text{other uses}}\end{align}
\begin{align}{\text{Consumption}} =& \left( {{\text{production}} + {\text{stocks}} + {\text{imports}} - {\text{exports}}} \right)\nonumber\\
&\quad - {\text{feed use}} - {\text{losses}} - {\text{seed}} - {\text{other uses}}\end{align}That is, the stocks of previous years and imports are added to production from which exports, losses, and the part allocated to inputs, such as seeds and fodder, and other uses, such as industry, are subtracted. This method is used by the Food and Agriculture Organization of the United Nations (FAO) (1961-1980) and by García Barbancho (Reference García Barbancho1960), although, as indicated by Cussó Segura (Reference Cussó Segura2005), the latter did not take losses and industrial uses into account. The result is the consumption of all the available foods, which tends to be overestimated, as it is assumed that households and the catering industry do not waste anything. Some publications have been able to ratify the problems of this methodology. For example, Delgado Perea (Reference Delgado Perea2023:235) compares the results of meat consumption obtained with this method by the FAO with other, more reliable official sources, such as family budget surveys or food consumption panels, showing a considerable overestimation in the food balance sheets from the 1980s. However, until then, the levels of consumption of the balance sheets were similar to those of the consumption surveys, so given the chronology of this study, this comparison ratifies that the methodology applied is appropriate. The source of García Barbancho (Reference García Barbancho1960) has been widely used in the literature (Cussó Segura, Reference Cussó Segura2005; Borderías et al., Reference Borderías, Muñoz-Abeledo and Cussó Segura2022; Cussó Segura et al., Reference Cussó Segura, Gamboa, Pujol-Andreu, Albaladejo, Carrión and Calatayud2023), applying a similar method based on official production and foreign trade data, although with the aforementioned drawbacks and therefore receiving criticism. For example, Cussó Segura (Reference Cussó Segura2005) also points out that it does not include important foods such as corn, alcoholic drinks, or certain animal products. Anyway, with the sample of products included in this study, we consider that the dietary intake of the Spanish population is sufficiently covered in the period analyzed, particularly with the inclusion of wine. Other important products have been excluded, such as corn, as its consumption is concentrated in certain specific areas of the country, and it was decided not to incorporate it in the database.Footnote 2
With the available data and the objective of determining the factors that explain the process of change in the dietary structure and the nutrition transition, we conducted an exercise similar to a demand function, in which the dependent variable is the amount demanded of each product, which in this case is the volume of consumption per inhabitant and day of each of the 28 food items throughout the whole period of study. The explanatory variables are the prices of each food and the income of the consumer, considering that the part unexplained by these variables must correspond to changes in tastes and preferences. The analysis does not include the prices of the substitute or complementary goods due to the difficulty of establishing them for 65 generic products (grouped into 28 items). Their inclusion would mean conducting a highly arbitrary and complex process that would not easily capture the reality of food consumption in a period of structural change in the diet, particularly in a country with a wide and geographically diverse gastronomical culture.
In the case of prices, the analysis uses the real price series of each of the 28 items whose construction has been previously explained. In order to quantify consumer income, the GDP per capita series has been used at constant 2010 prices of Prados de la Escosura (Banco de España, 2021).
The change in tastes or preferences cannot be quantified with the available data, so it is assumed that the part of the variation that is not explained of the dependent variable with respect to the independent variables corresponds to this aspect. We have attempted to quantify it by constructing proxy variables that show changes in the lifestyle habits of the population that could affect the tastes and preferences of the consumer. For example, changes in the age structure of the population, in healthcare conditions through height, urbanization, educational level, rate of female activity, or hours worked. Other economic aspects, such as inequality or the different economic structure, have also been tested following the hypotheses contemplated by the literature and the role of the institutions or changes in supply (productivity of the agricultural sector, improvement in transport infrastructures, degree of trade openness). All of these variables have been excluded from the analysis due to their high correlation with income and with each other, which generates an overall problem of multicollinearity that reduces the reliability of the results.
Due to the nature of the data, the quantitative analysis consists of a linear panel data model with random effects, in which the units of observation are the 28 food items in the period 1926–1980. With this method, we seek to observe how income and prices determined the changes in food consumption, without taking into account other aspects that could influence each of the items on an individual level. On a theoretical level, it may seem more appropriate to select a model with fixed effects. However, the Hausmann test indicates that the unobservable individual effects are not correlated with the explanatory variables, so random effects are more appropriate. The 28 food items group a total of 65 foods, with highly diverse characteristics, which suggests that the unobservable individual effects can vary between products, and the random effects model can better capture this without restricting each food to a fixed behavior. Nevertheless, both methods have been applied, and the results are very similar.
Furthermore, the model has problems of heteroskedasticity and autocorrelation, so an estimate with clustered standard errors has been applied on a food item level, and the variables have been transformed on a logarithmic scale. As well as better reflecting the elasticity of demand of the different foods with respect to changes in income and prices, this latter estimate helps to transform the variables into percentage terms. The model used is the following:
 \begin{equation}{{log\,\,Consumptio}}{{{n}}_{{{it}}}} = {{\alpha }} + {{{\beta }}_{1{ }}}\,\log {\text{GDP}}\_{\text{p}}{{\text{c}}_{\text{t}}} + {{{\beta }}_{2{ }}}\,\log {\text{Real}}\_{\text{pric}}{{\text{e}}_{{\text{it}}}} + {{\mu }_{\text{i}}} + {{{\varepsilon }}_{{\text{it}}}}{ }\end{equation}
where  ${\text{log Consumptio}}{{\text{n}}_{{\text{it}}}}$ is the consumption per capita of food item i in year t, expressed in kilograms per inhabitant and day (on a logarithmic scale); ${{\alpha }}$is the constant term of the model; ${{{\beta }}_{1{ }}}$is the coefficient associated with variable $\log {\text{GDP}}\_{\text{p}}{{\text{c}}_{\text{t}}}$ for each time observation t; ${{{\beta }}_{2{ }}}$is the coefficient associated with variable $\log {\text{Real}}\_{\text{pric}}{{\text{e}}_{{\text{it}}}}$ of each item i in time t; ${{{\mu }}_{\text{i}}}$ represents the specific individual effects of each food item i, capturing unobservable factors that can influence demand but do not vary over time, such as the intrinsic characteristics of each food or structural consumption patterns; and ${{{\varepsilon }}_{{\text{it}}}}$ is the random error term, corresponding to the variables unexplained by the variables included in the model and which could be due to transitory or idiosyncratic factors, and which vary between food items i and time t.
Finally, we should mention that the possibility of calculating the elasticity of demand of nutrients has also been contemplated instead of the volume of each food item, in response to changes in income and prices. Logan (Reference Logan2006a, Reference Logan2006b, Reference Logan2009) did this a few years ago by applying the conversion factors that enable the intake of calories, proteins, vitamins, or minerals to be obtained based on the amount of food consumed. However, it was decided to maintain the volume of items consumed as the dependent variable, as it seems questionable that the consumers were fully aware of the nutritional value of the foods that they purchased, particularly in the initial period of the sample. Therefore, it is considered that this would not be a determining factor in their final decision when purchasing one product or another. Moreover, this overcomes a major problem in nutrition transition studies on a historical level, that of the appropriateness of using contemporary conversion factors to obtain the food nutrients produced before the Green Revolution (Davis et al. Reference Davis, Epp and Riordan2004; Davis, Reference Davis2009), a topic that has generated certain debate (Gazeley et al., Reference Gazeley, Newell and Bezabih2015; Logan, Reference Logan2015). Similarly, an analogical exercise has been conducted using calorie intake as a dependent variable instead of the volume consumed based on the conversion factors of the Spanish Food Composition Database (BEDCA)Footnote 3, and the results are very similar.
4. The nutrition transition in Spain
A preliminary descriptive interpretation of the data confirms the dietary change that took place in Spain in the period analyzed, as defined by the literature. Figure 1 shows how, in the first years of the period of study, there was a high consumption of wheat, potatoes, and, to a lesser extent, olive oil and pulses, the latter two with higher prices, and, therefore, the power of Spaniards to purchase them was lower. This shows the late predominance of the traditional diet (cereals) in Spain. The first phase of the nutrition transition also took place during the first third of the twentieth century, with the increase in weight of other products of vegetable rather than animal origin, typical of Mediterranean Europe and unlike the transition on the Atlantic side of the continent (Cussó Segura and Garrabou Segura, Reference Cussó Segura and Garrabou Segura2007; González de Molina et al., Reference González de Molina, Soto, Aguilera and Infante2014; Pujol-Andreu and Cussó Segura, Reference Pujol-Andreu and Cussó Segura2014). At the same time, we can observe indicators of the beginning of the second phase of this process, such as the growing importance of certain animal products traditionally consumed in Spain, such as pork products (bacon, lard) or milk. The latter was cheaper for families with respect to other products of animal origin, therefore its consumption increased during the first decades of the twentieth century, and rather than being a medical remedy recommended only for the infirm, it became a product for the whole population due to its nutritional value. Although it was still far below the standards of Atlantic Europe, with a highly unequal dissemination depending on the region or social stratum (Nicolau-Nos et al., Reference Nicolau-Nos, Pujol-Andreu and Hernández2010; Hernández Adell and Pujol-Andreu, Reference Hernández Adell and Pujol-Andreu2017; Hernández Adell et al., Reference Hernández Adell, Muñoz Pradas and Pujol-Andreu2019; Medina-Albaladejo and Calatayud, Reference Medina-Albaladejo and Calatayud2021). The consumption of meat or eggs was still very low, although it was increasing.
Consumption (in black) and purchasing power (PPF, in grey) of the principal foods in Spain, 1926–1980 (hgs./kgs. per person and day in a logarithmic scale). (a) Wheat (1), (b). Legumes (4, 5), (c) Potato (7), (d) Olive oil (21), (e) Bovine meat (22), (f) Pig meat and others (24), (g) Eggs (25), (h) Milk (26).
Source: García Barbancho (Reference García Barbancho1960), Food and Agriculture Organization of the United Nations (FAO) (1961-1980), Ministerio de Agricultura (1928-1980), Banco de España (2021).
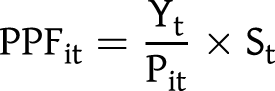
Note: For the construction of the purchasing power for food (PPF) variable, the nominal GDP per capita has been divided by the nominal price per kilogram of each of the 28 food items (Banco de España, 2021), obtaining the number of kilograms of each item that could be purchased with the given level of income each year. In order to adjust the latter and ensure that the indicator is more reliable and robust, the data of the percentage of income spent on food for the whole period has been used (Maluquer de Motes, Reference Maluquer de Motes, Carreras and Tafunell2005), which allows us to observe the amount of each item that can be purchased, taking into account the percentage of income that is spent on food at any given moment. The formula is the following:
 \begin{equation*}{\rm{PP}}{{\rm{F}}_{{\rm{it}}}} = {{{\rm{Y}_{\rm{t}}}} \over {{{\rm{P}}_{{\rm{it}}}}}} \times {{\rm{S}}_{\rm{t}}}\end{equation*}
where PPPit is the purchasing power for food for food item i in year t; Yt is the nominal GDP per capita in year t; Pit is the nominal price per capita of food item i in time t; and St is the percentage of income spent on food in year t.

Figure 1 Long description
The graphs depict consumption (black line) and purchasing power (grey line) of various foods in Spain from 1926 to 1980, measured in hgs./kgs. per person per day on a logarithmic scale. Graph A: Wheat (1) - The x-axis shows years from 1926 to 1980. The y-axis is logarithmic, ranging from 0.1 to 100. The consumption line remains mostly stable between 10 and 100, while purchasing power starts below 10 and rises towards 100 by 1980. Graph B: Legumes (4, 5) - The x-axis shows years from 1926 to 1980. The y-axis is logarithmic, ranging from 0.1 to 100. Both lines fluctuate between 1 and 10, with purchasing power rising slightly by 1980. Graph C: Potato (7) - The x-axis shows years from 1926 to 1980. The y-axis is logarithmic, ranging from 0.1 to 100. Consumption remains between 10 and 100, while purchasing power rises from below 10 to above 10 by 1980. Graph D: Olive oil (21) - The x-axis shows years from 1926 to 1980. The y-axis is logarithmic, ranging from 0.1 to 100. Consumption fluctuates between 1 and 10, while purchasing power rises slightly by 1980. Graph E: Bovine meat (22) - The x-axis shows years from 1926 to 1980. The y-axis is logarithmic, ranging from 0.1 to 100. Both lines start near 1 and rise towards 10 by 1980. Graph F: Pig meat and others (24) - The x-axis shows years from 1926 to 1980. The y-axis is logarithmic, ranging from 0.1 to 100. Both lines rise from near 1 to between 1 and 10 by 1980. Graph G: Eggs (25) - The x-axis shows years from 1926 to 1980. The y-axis is logarithmic, ranging from 0.1 to 100. Both lines rise from near 1 to between 1 and 10 by 1980. Graph H: Milk (26) - The x-axis shows years from 1926 to 1980. The y-axis is logarithmic, ranging from 0.1 to 100. Consumption remains between 10 and 100, while purchasing power rises from below 10 to above 10 by 1980. Overall, the graphs illustrate changes in consumption and purchasing power for various foods, highlighting dietary shifts in Spain over the period. Notable trends include rising purchasing power for most foods, indicating increased affordability and consumption changes.
As widely indicated by the literature, the Spanish Civil War and the 1940s suddenly interrupted the nutrition transition in Spain, with an overall reduction in the consumption of food and the purchasing power of families. The process resumed with the end of the years of poverty, hunger, and autarchy, in the 1950s and intensified with the economic development of the 1960s. Initially, the improvement in the purchasing power of families gave rise to an overall increase in consumption, both of traditional products and those of animal origin. However, from the 1960s, the intake of traditional foods or those pertaining to the first phase of the nutrition transition declined, particularly that of wheat and pulses, despite the growth in income and fall in real prices. This trend continued until the end of the period analyzed, with a simultaneous general increase in the intake of animal products, the consumption of which until then had been low. This constituted a structural change in the diet of the Spanish population and its definitive westernization in the 1980s.
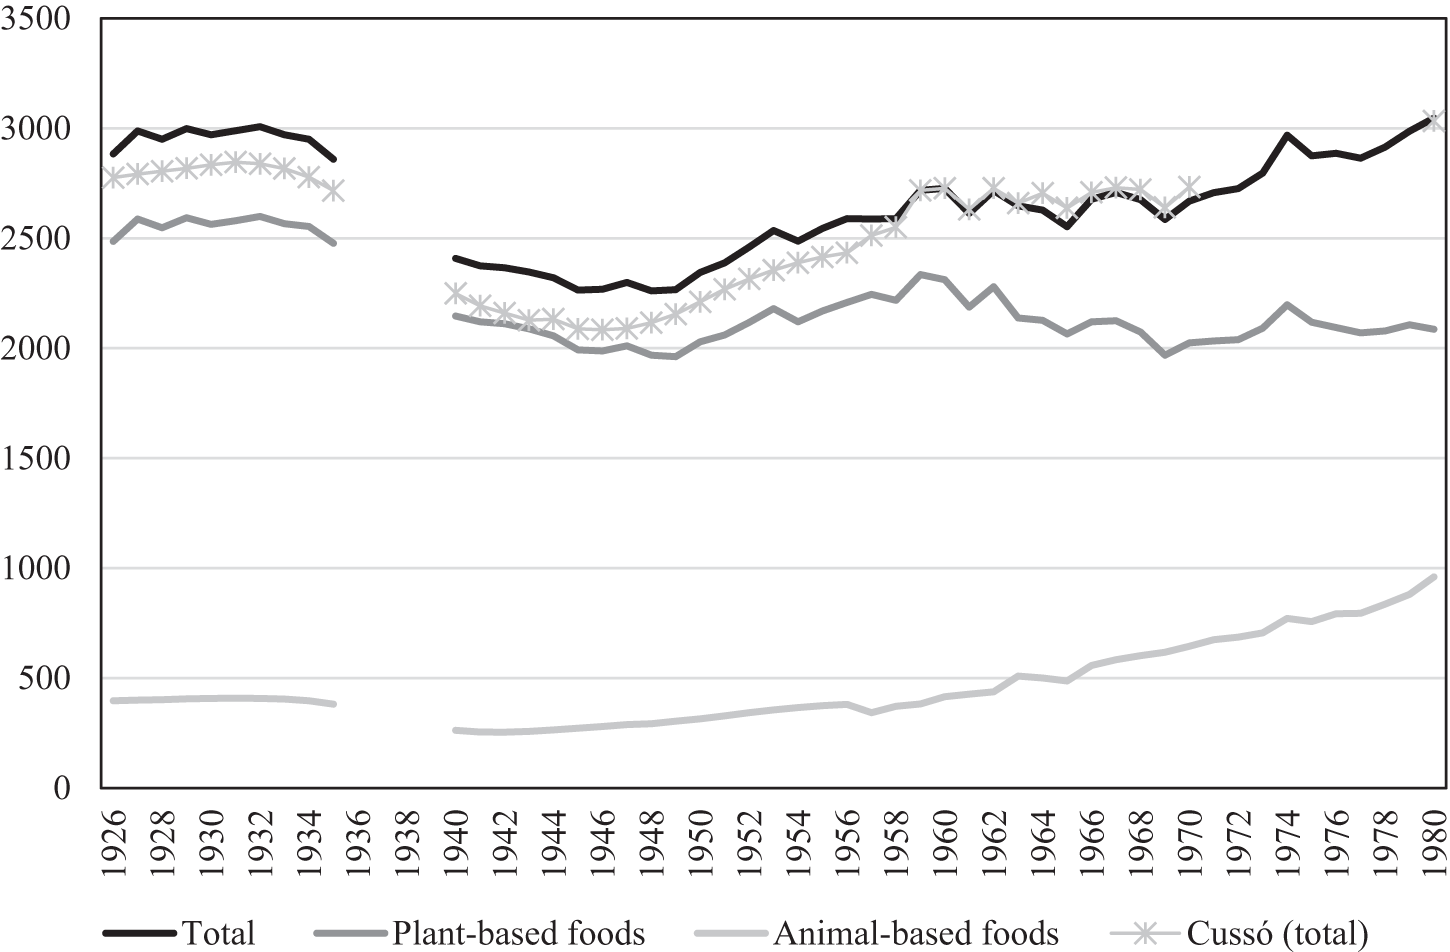
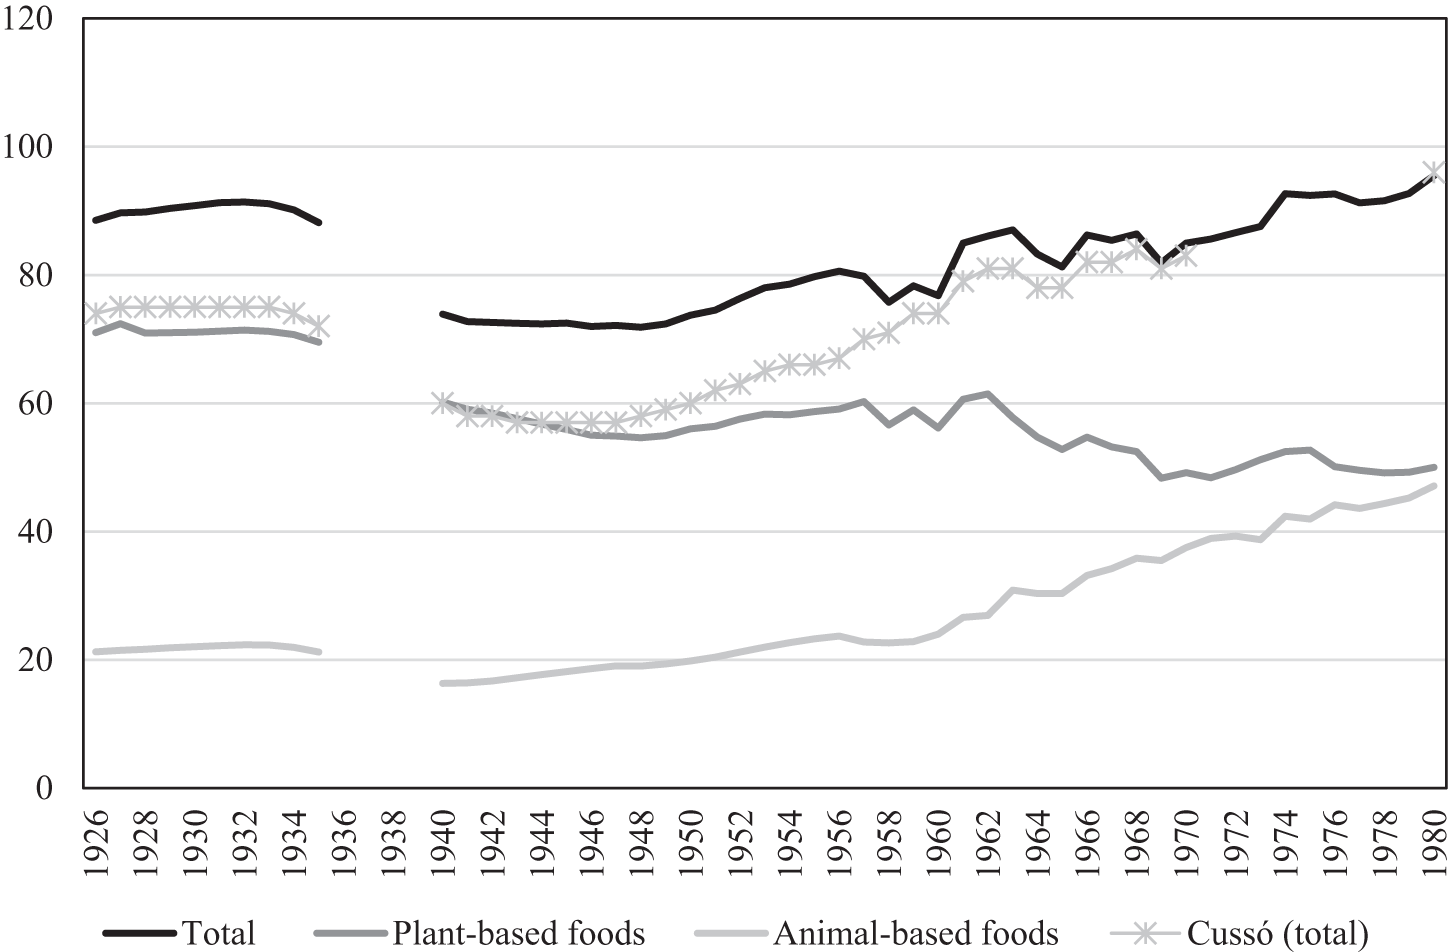
A summary of the result of this process can be observed in Figures 2 and 3. The calculation of energy and protein intake and that of other nutrients based on the estimates of García Barbancho (Reference García Barbancho1960) and the Food and Agriculture Organization of the United Nations (FAO) (1961-1980) has already been made by Graciani Pérez-Regadera (Reference Graciani Pérez-Regadera1994) and Cussó Segura (Reference Cussó Segura2005). The data are similar to those presented in this study, although they vary to some extent due to certain methodological differences.Footnote 4 In the case of energy intake, the predominance of products of plant origin at the beginning of the period can be confirmed, together with the deterioration of diets due to the war and post-war years. The 1950s saw the recovery of consumption and, finally, the economic development stage fostered the general increase in the calories consumed, particularly those of animal origin, with the reduction in those of plant origin. This trend continued until the definitive westernization of the Spanish diet in 1980 and was reinforced in the case of nutrients such as proteins and fats, with a growing prominence of animal products, particularly in the second case, as animal fats greatly exceeded vegetable fats from the end of the 1960s.
Energy intake in Spain, 1926–1980 (calories per person and day).
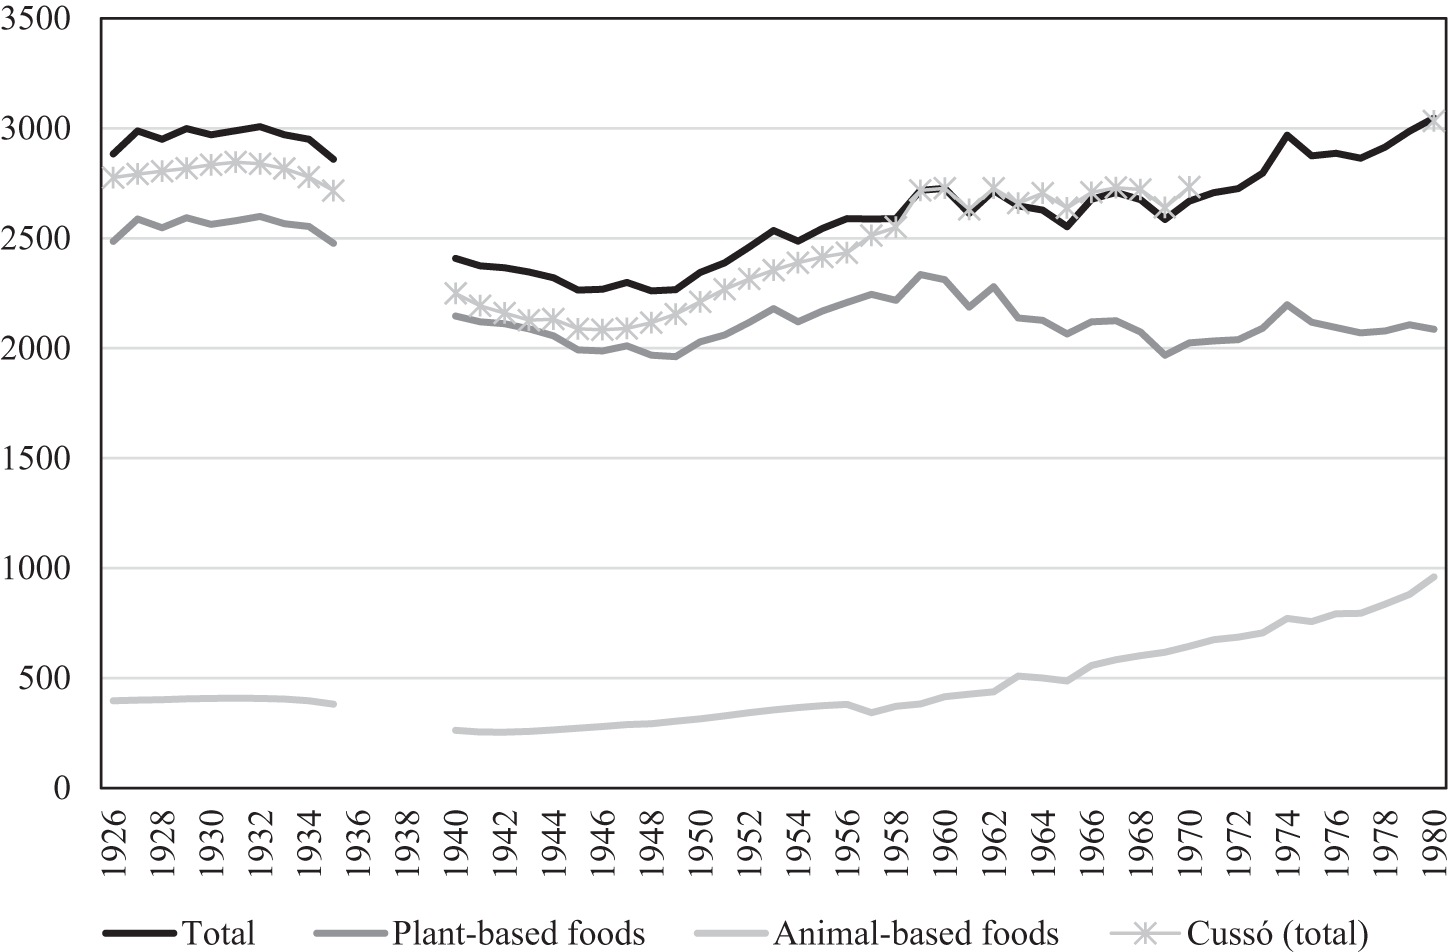
Figure 2 Long description
The graph displays energy intake in Spain from 1926 to 1980, measured in calories per person per day. The x-axis represents years from 1926 to 1980 and the y-axis shows daily energy intake ranging from 0 to 3500 calories. Four lines are present: Total intake (black solid line), Plant-based foods (medium-gray line), Animal-based foods (light-gray line) and Cussó total (x-marked line). Total intake starts around 3000 calories, dips in the mid-1940s to approximately 2250 calories and rises steadily to about 3000 calories by 1980. Plant-based foods show a general decline from mid-2000s calories to near 2000 calories by the late 1960s and 1970s. Animal-based foods increase significantly from around 250–400 calories to nearly 1000 calories by 1980. The Cussó total line closely follows the Total intake line, converging around the early 1960s and ending slightly above the Total intake by 1980. Notable points include the lowest Total intake around the mid-1940s at approximately 2250 calories and the highest near 1980 at about 3000 calories. The lines are visually distinguished by style: Total intake is a black solid line, Plant-based foods are represented by a medium-gray line, Animal-based foods by a light-gray line and Cussó total by an x-marked line.
Protein intake in Spain, 1926–1980 (grams per person and day).

Figure 3 Long description
Protein intake in Spain, 1926–1980 (Grams per person and day). The horizontal axis label is years, with tick labels: 1926, 1928, 1930, 1932, 1934, 1936, 1938, 1940, 1942, 1944, 1946, 1948, 1950, 1952, 1954, 1956, 1958, 1960, 1962, 1964, 1966, 1968, 1970, 1972, 1974, 1976, 1978, 1980. The vertical axis shows values from 0 to 120. Legend labels: Total; Plant-based foods; Animal-based foods; Cussó (total). Visual distinction: Cussó (total) is drawn with a line that has asterisk markers at the data points. The other three series are drawn as continuous lines without markers. Data points as coordinate pairs. Total: (1926, 89), (1928, 90), (1930, 91), (1932, 91), (1934, 90), (1936, 88), (1940, 74), (1942, 73), (1944, 73), (1946, 72), (1948, 72), (1950, 73), (1952, 77), (1954, 79), (1956, 80), (1958, 76), (1960, 78), (1962, 85), (1964, 87), (1966, 82), (1968, 86), (1970, 84), (1972, 87), (1974, 93), (1976, 92), (1978, 93), (1980, 96) Plant-based foods: (1926, 71), (1928, 70), (1930, 71), (1932, 71), (1934, 71), (1936, 70), (1940, 59), (1942, 58), (1944, 57), (1946, 55), (1948, 54), (1950, 55), (1952, 57), (1954, 59), (1956, 60), (1958, 56), (1960, 58), (1962, 61), (1964, 55), (1966, 53), (1968, 54), (1970, 49), (1972, 48), (1974, 51), (1976, 50), (1978, 49), (1980, 50) Animal-based foods: (1926, 21), (1928, 21), (1930, 22), (1932, 22), (1934, 22), (1936, 21), (1940, 16), (1942, 17), (1944, 18), (1946, 19), (1948, 19), (1950, 20), (1952, 21), (1954, 23), (1956, 24), (1958, 23), (1960, 24), (1962, 28), (1964, 31), (1966, 30), (1968, 34), (1970, 36), (1972, 39), (1974, 40), (1976, 43), (1978, 44), (1980, 46) Cussó (total): (1926, 74), (1928, 75), (1930, 75), (1932, 75), (1934, 75), (1936, 72), (1940, 60), (1942, 58), (1944, 57), (1946, 56), (1948, 57), (1950, 60), (1952, 63), (1954, 66), (1956, 67), (1958, 71), (1960, 74), (1962, 81), (1964, 79), (1966, 82), (1968, 83), (1970, 82), (1972, 85), (1980, 96) Major highs and lows from the plotted values. Total: lowest value 72 at 1946 and 1948; highest value 96 at 1980. Plant-based foods: lowest value 48 at 1972; highest value 71 at 1926, 1930, 1932 and 1934. Animal-based foods: lowest value 16 at 1940; highest value 46 at 1980. Cussó (total): lowest value 56 at 1946; highest value 96 at 1980. Overall pattern described using the plotted values. Total decreases from 89 at 1926 to 72 at 1946 and 1948, then increases to 96 at 1980. Plant-based foods decreases from 71 at 1926 to 54 at 1948, increases to 61 at 1962, then decreases to 48 at 1972 and ends at 50 at 1980. Animal-based foods increases from 21 at 1926 to 24 at 1960, then increases to 46 at 1980. Cussó (total) decreases from 74 at 1926 to 56 at 1946, then increases to 85 at 1972 and reaches 96 at 1980. Relative ordering at selected years using the plotted values. At 1926: Total 89, Cussó (total) 74, Plant-based foods 71, Animal-based foods 21. At 1940: Total 74, Plant-based foods 59, Cussó (total) 60, Animal-based foods 16. At 1962: Total 85, Cussó (total) 81, Plant-based foods 61, Animal-based foods 28. At 1980: Total 96, Cussó (total) 96, Plant-based foods 50, Animal-based foods 46.
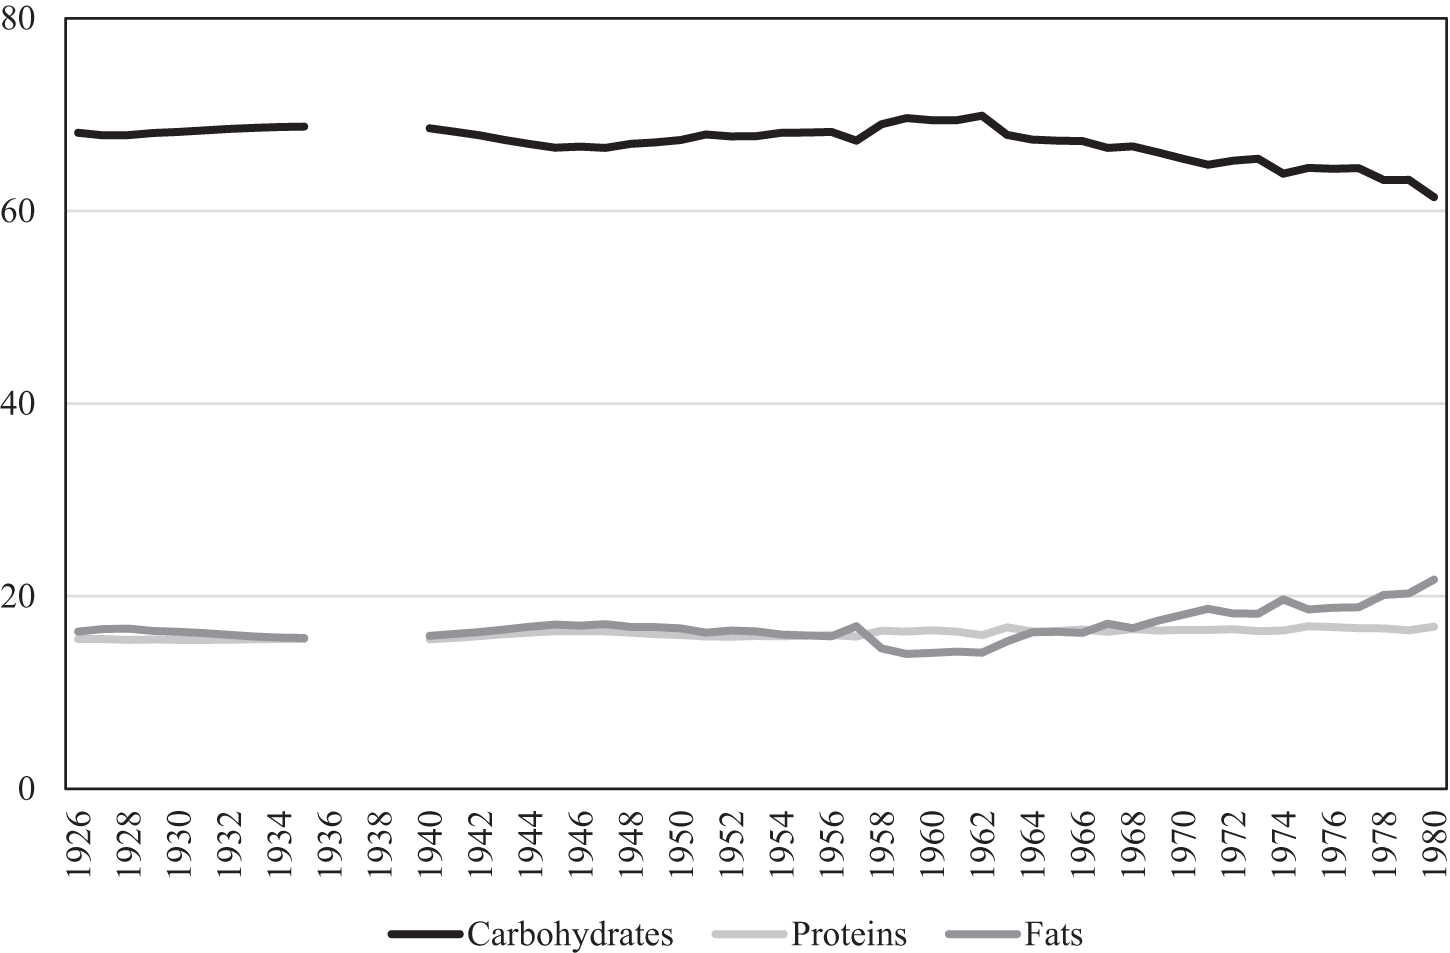
The principal consequence of all of this was the change in the nutritional composition of the average diet of the Spanish population. As we can observe in Figure 4, until the beginning of the 1960s, almost 70% of nutrient intake was dominated by carbohydrates mainly from the consumption of cereals. However, from then on, the weight of this nutrient reduced while the consumption of proteins and, particularly, fats gained more prevalence. In both cases, products of animal origin explain the majority of their growing trend in this period.
Percentage distribution of macronutrient intake in Spain, 1926–1980 (%).

Figure 4 Long description
The vertical axis shows values from 0 to 80. The horizontal axis shows years from 1926 to 1980. Legend labels: Carbohydrates, Proteins, Fats. Carbohydrates: (1926, 68), (1928, 68), (1930, 68), (1932, 68), (1934, 68), (1936, 68), (1940, 68), (1942, 67), (1944, 66), (1946, 66), (1948, 66), (1950, 66), (1952, 67), (1954, 67), (1956, 67), (1958, 67), (1960, 69), (1962, 69), (1964, 67), (1966, 67), (1968, 66), (1970, 65), (1972, 65), (1974, 64), (1976, 64), (1978, 63), (1980, 61) Proteins: (1926, 15), (1928, 15), (1930, 15), (1932, 15), (1934, 15), (1936, 15), (1940, 15), (1942, 16), (1944, 16), (1946, 16), (1948, 16), (1950, 16), (1952, 16), (1954, 16), (1956, 16), (1958, 15), (1960, 15), (1962, 16), (1964, 16), (1966, 16), (1968, 16), (1970, 16), (1972, 16), (1974, 16), (1976, 16), (1978, 16), (1980, 16) Fats: (1926, 16), (1928, 16), (1930, 16), (1932, 16), (1934, 16), (1936, 15), (1940, 16), (1942, 16), (1944, 17), (1946, 17), (1948, 17), (1950, 16), (1952, 16), (1954, 16), (1956, 16), (1958, 14), (1960, 14), (1962, 16), (1964, 16), (1966, 16), (1968, 17), (1970, 18), (1972, 19), (1974, 18), (1976, 19), (1978, 19), (1980, 21).
Now that the principal characteristics of the change in the dietary structure during the second half of the twentieth century have been presented descriptively, the following section presents the principal results of the quantitative exercise that seeks to determine the importance of income, prices, and changes in tastes and preferences in the nutrition transition process.
5. Results
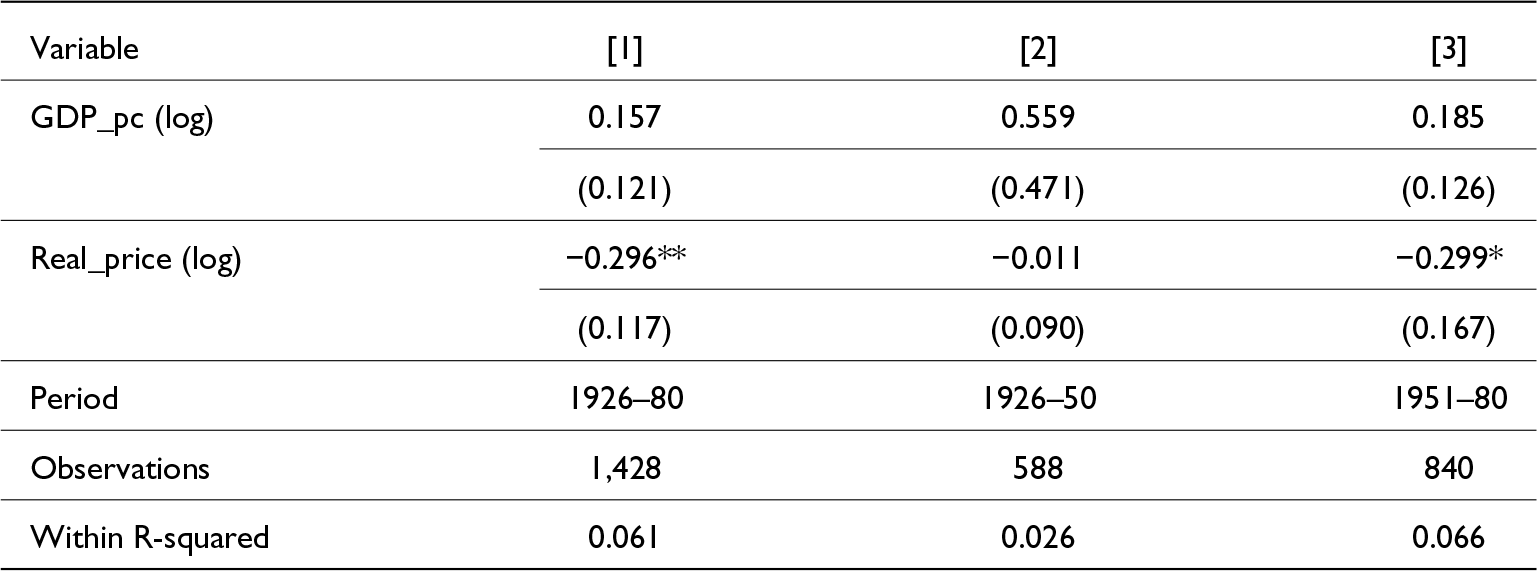
The overall results of the exercise carried out can be observed in Table 1. The first column shows that the relationship of the consumption of the 28 food items selected with income and real prices is as expected, positive with the former and negative with the latter in all of the columns. However, this relationship is weak, particularly in the case of income, in which it is not statistically significant, with a model that barely explains 7% of the variation in consumption within each food item. We should take into account the intense heterogeneity of the items analyzed, with diverse products and different elasticities that react very differently to changes in income and prices. This relationship was particularly weak in the period 1926–50, as we can see in column 2, with the predominance of the consumption of basic plant-based foods at a low cost and low elasticity to changes in income and price, especially cereals and potatoes. These constituted the principal source of energy and protein of Spaniards (see Figures 1a, 1c, and 2). However, in the subsequent period, the process of change in the dietary structure intensified within the context of intense economic development. The weight of staple products reduced, and the consumption of others became more sensitive to variations in income and price increases (column 3).
Determinants of change in the dietary structure in Spain, 1926–1980 (total sample)

Table 1 Long description
The table reports regression results on factors associated with changes in Spain’s dietary structure, estimated in three model specifications covering different time spans. GDP per person (logged) has positive coefficients in all three models, but none are marked as statistically significant. Real price (logged) has a negative and statistically significant association in model 1 and a negative, marginally significant association in model 3, suggesting higher prices are linked to less change in dietary structure in those samples. In model 2, real price is near zero and not statistically significant, indicating the relationship is not consistent across periods. Model 1 covers 1926 to 1980 with 1,428 observations and a within R-squared of 0.061; model 2 covers 1926 to 1950 with 588 observations and a within R-squared of 0.026; model 3 covers 1951 to 1980 with 840 observations and a within R-squared of 0.066. Standard errors are shown in parentheses, and significance markers indicate conventional thresholds, so results should be interpreted with attention to uncertainty and model fit.
Source: See Figure 1.
Standard error in parentheses ***p < 0.01, **p < 0.05, *p < 0.1
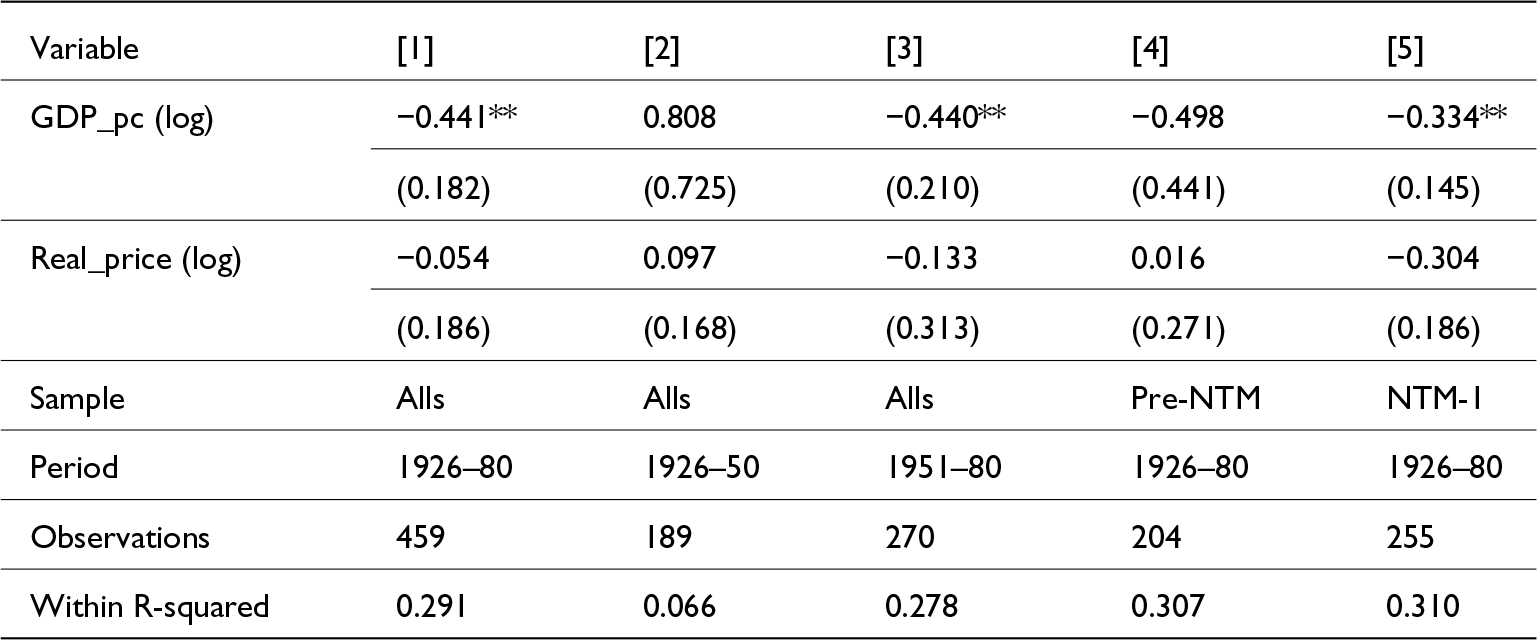
In light of these results, it is necessary to conduct a more segmented analysis by type of food. Table 2 shows the results of the exercise focusing solely on the traditional foods of the Spanish diet at the beginning of the period analyzed, cereals, pulses, potatoes, olive oil and wine. In column 1, we can observe a more intense relationship between consumption and income, but with a negative sign and a less intense relationship with real prices, as they are staple foods with a low price elasticity to demand. In other words, for each 1% increase in income, ceteris paribus, the consumption of traditional foods fell by 0.44%. This relationship is not random as it is statistically significant and shows that they were inferior goods. Therefore, the nutrition transition process occurring in Spain, particularly in the second half of the twentieth century, can be ratified with a model that improves its explanatory capacity by almost 30% of the variation in consumption for each of the items composing this group of foods. The remaining 70% would correspond to changes in habits, tastes, and preferences of the Spanish population, driven by phenomena inherent in economic development, such as changes in the economic structure and the population, the improvement in food supply, the higher cultural and educational level, the urbanization process, the incorporation of women into the labor market, or the role of the institutions. Another aspect is the changes in the prices of complementary and substitute goods.Footnote 5
Determinants of change in the dietary structure in Spain, 1926–1980 (traditionals)
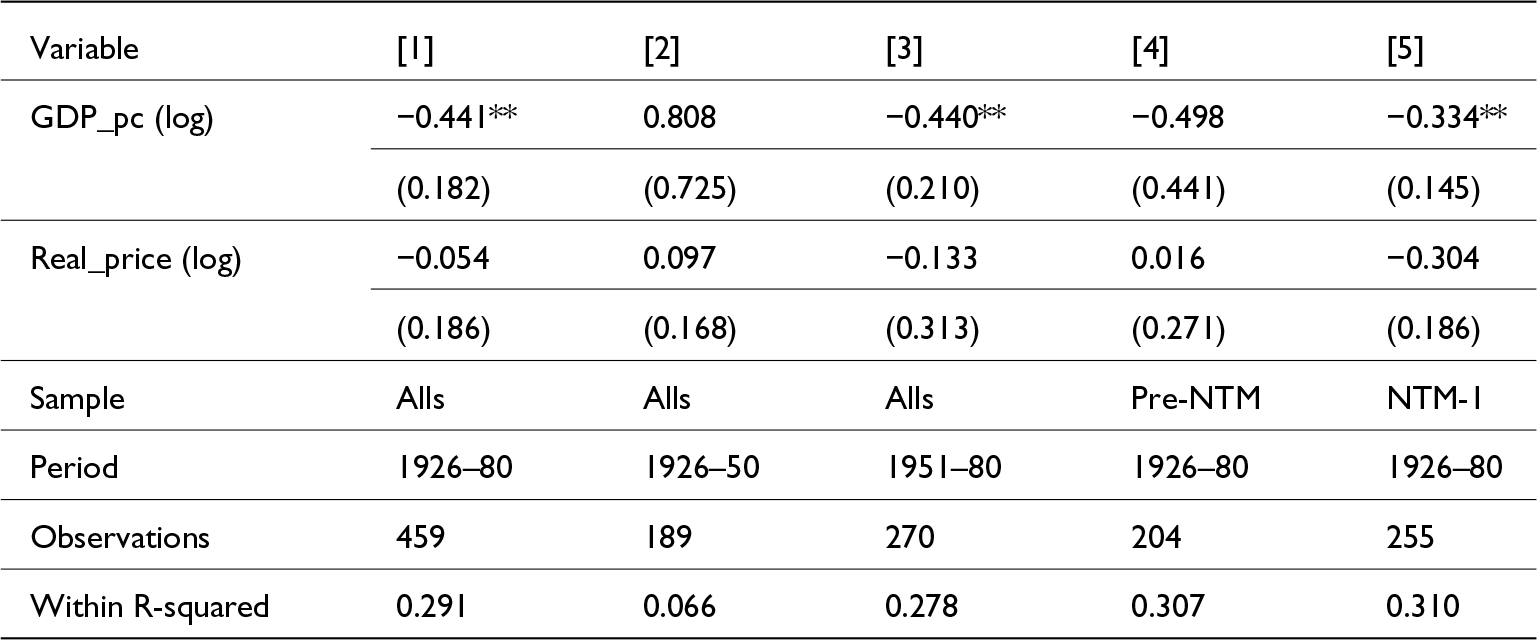
Table 2 Long description
The table reports regression results for changes in Spain’s traditional dietary structure from 1926 to 1980, using five model specifications with different time windows and samples. GDP per person is generally associated with declines in the traditional component: it is negative and statistically significant in models 1, 3, and 5, while it is not statistically significant in models 2 and 4. The estimated GDP effect is strongest in model 1 and remains negative in the post 1951 to 1980 period (model 3) and in the NTM minus 1 sample (model 5). Real price estimates vary in sign across models and are not statistically significant in any specification, suggesting no robust relationship in these results. Model fit is modest, with within R-squared values around 0.29 to 0.31 in models 1, 3, 4, and 5, but much lower in model 2. Sample sizes range from 189 to 459 observations, with the pre NTM and NTM minus 1 subsamples splitting the full 1926 to 1980 period. Interpret results cautiously because statistical significance differs by specification and the price variable lacks consistent evidence across models.
Source: See Figure 1.
Standard error in parentheses ***p < 0.01, **p < 0.05, *p < 0.1
Columns 2 and 3 show that this dietary change process was particularly intense in the 1950s, with the recovery of income levels after the Civil War and autarchy period. In the previous years, the relationship between consumption and income was positive, although not statistically significant. Meanwhile, columns 4 and 5 segment the sample by type of product, showing that both the consumption of the more traditional products (Pre-NTM, cereals, and wine), and the main products of the first phases of the nutrition transition (NTM-1, pulses, potatoes, and olive oil) had a negative relationship with income, particularly robust in the latter case. Cereals were a low-cost product, historically constituting the basis of the Spanish diet, including the period analyzed. Therefore, their elasticity with respect to price or income was lower, and other social and cultural factors must have been more important in the reduction of their consumption. On the other hand, the consumption of NTM-1 products was lower and more recent, and their cost was higher, particularly pulses and olive oil, so they were more sensitive to the improvement in wealth, as they did not constitute the basis of the country’s diet.
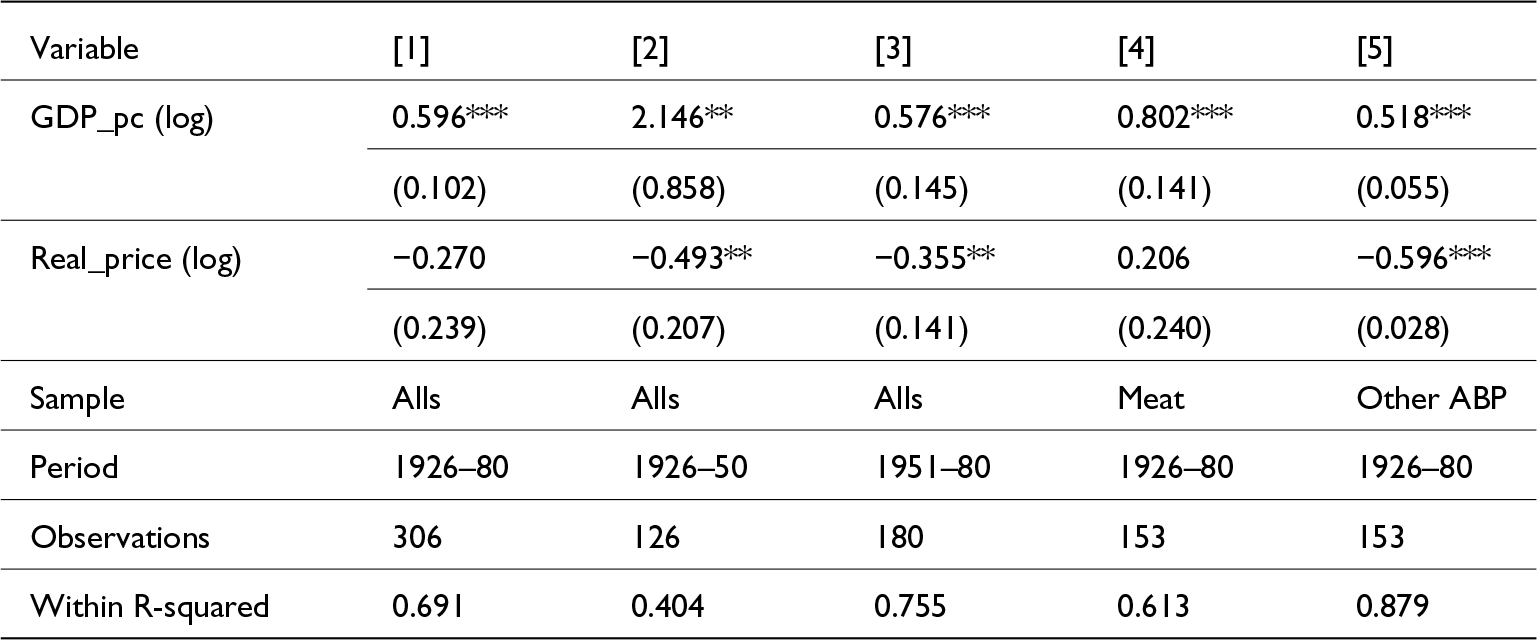
As we can observe in Figures 1–3, the reduction in the consumption of traditional foods was replaced by the increase in that of products, calories, and proteins of animal origin, giving rise to a more diversified intake that was characteristic of the nutrition transition and westernization process of the diet. This is confirmed in column 1 of Table 3, which shows an intense positive relationship between the consumption of animal products and changes in income and a negative relationship with prices. For every 1% growth in GDPpc, ceteris paribus, consumption increased by almost 0.6%, with the model explaining almost 70% of the variation in the intake of each type of product. In other words, they were initially luxury goods with a high cost, whose consumption was low and had a high elasticity to changes in income, particularly, but also to prices. This was already the case in the period 1926–50 (column 2) and remained more or less moderate from the 1950s, when the economic conditions improved and the consumption of these products began to grow in a sustained way, increasing their weight in the calorie and protein intake of the Spanish population. However, we can also observe certain differences if the analysis focuses on the historically more traditional animal products in the Spanish diet, such as meat, with respect to others that began to be consumed later, such as milk, eggs, and fresh fish (Medina-Albaladejo et al., Reference Medina-Albaladejo, Calatayud, Nicolau-Nos, Pujol-Andreu, Albaladejo, Carrión and Calatayud2023). The first group of products was much more sensitive to changes in income and not so much to those in prices. This behavior is typical of the more basic foods in the diet. Meanwhile, the second group was highly sensitive to both variables, with the model explaining almost 88% of the growth in consumption, which shows the ever-increasing importance of products that, until then, were considered as luxury products due to the improvement in the purchasing power of families.
Determinants of the change in the dietary structure in Spain, 1926–1980 (animal-based products)
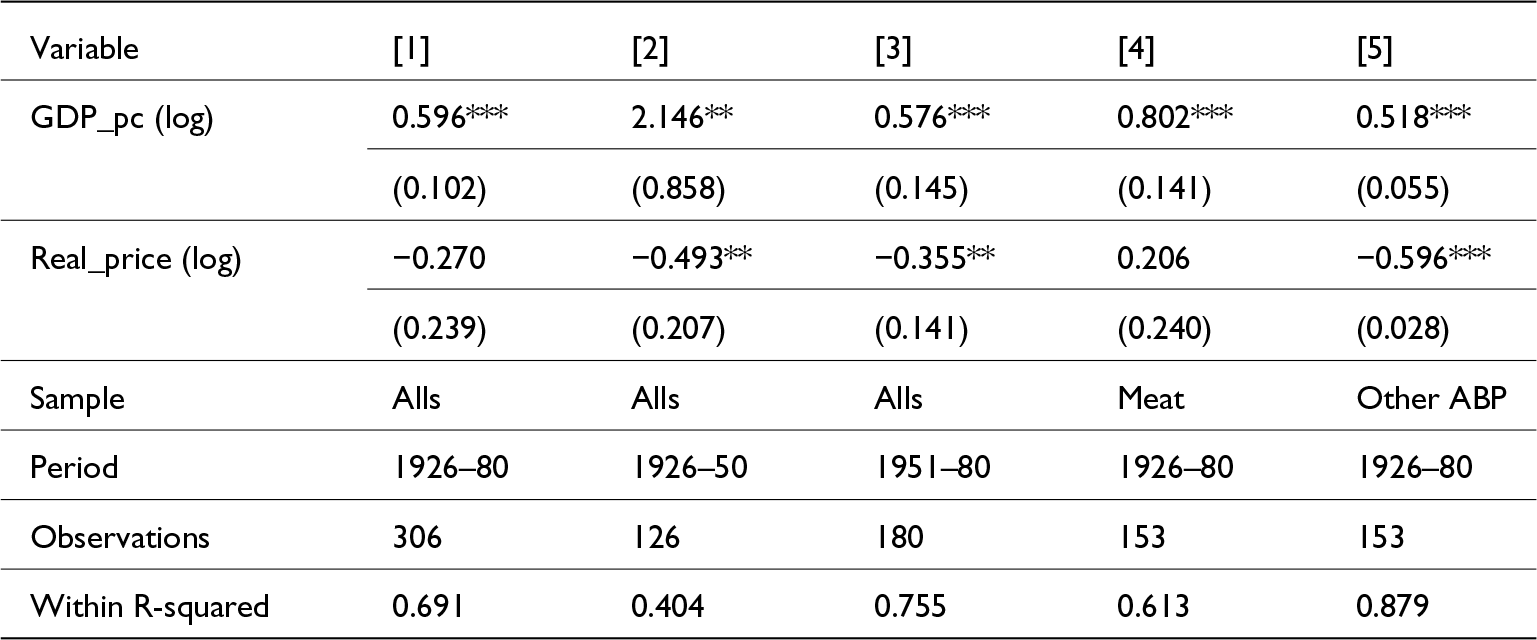
Table 3 Long description
The table reports regression results linking changes in Spain’s animal-based food consumption to income per person and real prices, using five model specifications and time spans. Income per person has a positive and statistically reliable association in every column, ranging from about 0.52 to 2.15, including the full period and the meat-only and other animal-based product splits. Real prices are generally associated with lower consumption: the effect is negative and statistically reliable in the full sample for 1926 to 1950 and 1951 to 1980, and it is strongly negative for other animal-based products over 1926 to 1980. The meat-only model is the exception, where the price estimate is positive but not statistically reliable. Model fit varies, with within R-squared values from about 0.40 to 0.88, highest for other animal-based products. Sample sizes range from 126 to 306 observations depending on period and product group. Standard errors are shown in parentheses, so estimates with larger standard errors are less precise and should be interpreted more cautiously.
Source: See Figure 1.
Standard error in parentheses ***p < 0.01, **p < 0.05, *p < 0.1
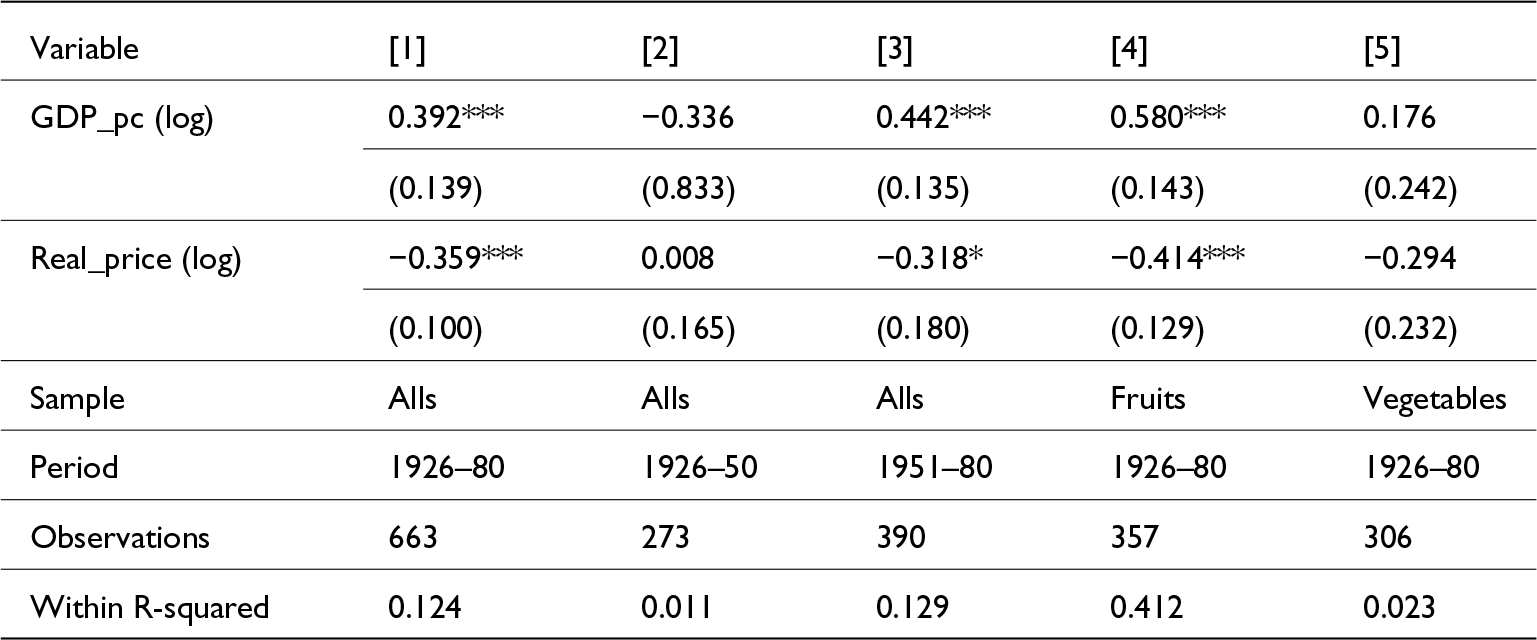
Finally, the products of animal origin were not the only products whose consumption grew due to improvements in income and the fall in real prices. Fruits and vegetables followed a similar trend, although not so intensely, particularly fruits. Column 1 of Table 4 shows that both income and real prices had a statistically significant relationship with consumption, positive for the former and negative for the latter. This was especially after the 1950s, not before, in the case of fruits. The specific circumstances of these types of foods should be taken into account, as they have historically high levels of self-consumption. This explains why the relationship in the period 1926–50 is not significant, as part of the population did not go to the market to purchase these products. The arrival of economic development led to a change in these circumstances from the 1950s. A differentiation should also be made between fruits and vegetables. The latter do not seem to have a relationship with income and prices, displaying a more erratic behavior as they are more prone to self-consumption. Fruit is different as its consumption was fairly sensitive to both the growth in income and prices, as it was a more market-oriented product and not considered as a staple food, with a model that explains more than 40% of the variation in its intake. The improvement in the purchasing power of families and the growing concern for a healthier diet led to an increase in the consumption of fruit and the advance toward a more diversified diet.
Determinants of the change in the dietary structure in Spain, 1926–1980 (fruits and vegetables)
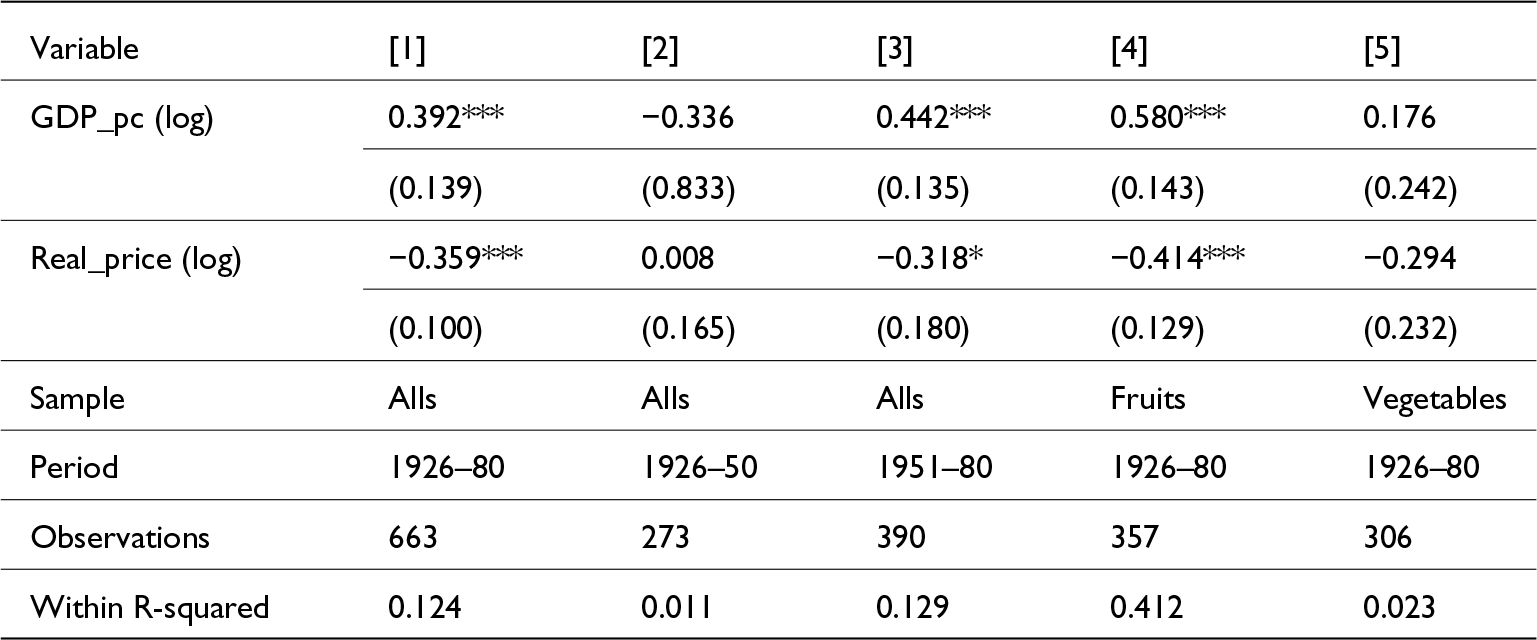
Table 4 Long description
The table reports regression results linking changes in Spain’s fruit and vegetable dietary share to income per person and real prices across five model specifications. In the full sample for 1926 to 1980, higher logged income per person is associated with a higher share, while higher logged real prices are associated with a lower share; both effects are statistically significant. Splitting the period, the income and price effects are not statistically clear for 1926 to 1950, but income is positive and significant for 1951 to 1980, and prices are weakly negative. In the fruit-only model for 1926 to 1980, income shows a strong positive association and prices show a strong negative association, with the highest within-model fit among the columns. In the vegetable-only model, neither income nor prices are statistically clear, and the within-model fit is low. Sample sizes range from 273 to 663 observations depending on the period and food group, so comparisons should consider differences in coverage and model fit.
Source: See Figure 1.
Standard error in parentheses ***p < 0.01, **p < 0.05, *p < 0.1
6. Discussion
The results presented in the previous section provide a novel overall perspective in the study of the nutrition transition in Spain, but also partially corroborate certain conclusions drawn by previous studies, both on a historical and contemporary level. For example, Logan (Reference Logan2006a, Reference Logan2006b) observed the importance of income to explain the better diets of North American families with respect to their British counterparts at the end of the nineteenth century, but also that of prices. To do this, the author used the elasticities of demand of nutrients, finding that incomes explained 60% of the differential of this indicator between the two countries, while prices caused the remaining 40%. The studies by Gazeley and other authors ratify that incomes were a fundamental element for explaining the higher calorie and protein consumption of animal origin in the nineteenth and twentieth centuries, both in North American and British households and in other parts of Europe. Similarly, other factors were important, such as the structure of the households or the public policies to improve diets. Consumption was also sensitive to changes in prices, particularly in periods of difficulties such as the inflationary shock of the First World War, when the consumption of products whose prices suffered a greater increase, as they were not subject to state regulation, plummeted, especially fruit and vegetables (Gazeley and Newell, Reference Gazeley and Newell2013, Reference Gazeley and Newell2015; Gazeley et al., Reference Gazeley, Holmes, Newell, Reynolds and Gutierrez Rufacos2023).
In the case of dairy products, Collantes (Reference Collantes2015b, Reference Collantes2019) considered that in the 1960s and 1970s, the growth in income was the key factor for understanding the massification of the consumption of milk in Spain and the rest of Western Europe. The industrialization of the sector also helped, allowing the reduction of production costs and the greater availability of these types of products at lower prices, although this did not seem to have any real importance until the 1980s. The results presented in this study confirm this. Column 5 Table 3 shows that the consumption of other animal products, such as eggs, milk, and fish, was highly sensitive to changes in both income and prices. However, if the analysis is limited to the case of milk in the period 1926–80, the effect of prices is more moderate, with income being the principal explanatory factor. Delgado Perea (Reference Delgado Perea2024) recently conducted a similar exercise for the case of meat, with similar results, at least in the case of beef and lamb. The reduction in prices acquired greater importance in the dissemination of the consumption of chicken and pork, as confirmed in this study, when only pork meat is studied.
Studies focused on more contemporary periods also ratify the results presented here, particularly for animal products, and show that the Spanish case was integrated within the changes in global dietary trends (Gerbens-Leenes et al., Reference Gerbens-Leenes, Nonhebel and Krol2010; Kearney, Reference Kearney2010; Rask and Rask, Reference Rask and Rask2011; Clonan et al., Reference Clonan, Roberts and Holdsworth2016; among others). In the case of Spain, the study by Gil et al. (Reference Gil, Pérez and Gracia1995) is noteworthy. It finds that income had a direct impact with an increase in the consumption of calories and foods of animal origin and processed products in 15 European countries between 1970 and 1990, including Spain, with all of them converging toward a common diet, although in the Mediterranean area at a slower pace. Cardoso Marques et al. (Reference Cardoso Marques, Fuinhas and D.f2018) analyzed the consumption of meat and products of plant origin in a sample of 77 countries with different levels of income between 1995 and 2013, relating it to income and prices. The results once again show that economic growth gave rise to the increase in meat consumption and also the fall in that of plant foods, with levels very similar to those presented in this study (increase of 0.6% for every 1% increase in income in the case of meat and between .0.3–0.4% less in the case of plant foods).
Another important point is that this study has been able to verify how the income elasticity was initially high in the period 1926–50, when Spain had a low level of economic development. This was especially the case of animal products with a higher price. In subsequent periods, income elasticity moderated again when household incomes improved, and the consumption of these products increased as they were no longer considered as luxury goods. In this period, prices began to play an important role, particularly those of certain animal products (milk, eggs, fresh fish). Logan (Reference Logan2006a, Reference Logan2006b) found this for the 1880s in the United States, when income elasticity was lower in wealthier households. Studies for more recent periods also show this (Gil et al., Reference Gil, Pérez and Gracia1995). In fact, Vranken et al. (Reference Vranken, Avermaete, Petalios and Mathijs2014) analyzed the consumption of meat in 120 countries in the period 1961–2007, observing a clear inverted U relationship with respect to income. When the countries initiated their economic development processes, the consumption of this product grew and later reduced during what these authors call a second nutrition transition. Cardoso Marques et al. (Reference Cardoso Marques, Fuinhas and D.f2018) also show that the consumption of meat was more sensitive to changes in income, particularly in the poorer countries, and to prices only in higher-income countries, with a negative relationship. Collantes (Reference Collantes2015b, Reference Collantes2019) did the same in the case of dairy products for Western Europe, finding a high correlation between income and liquid milk consumption during the 1960s and 1970s. However, from then, this author also observed how this relationship became weaker and how the consumption of liquid milk reduced, and that of other more processed and diversified dairy products increased, particularly among the higher income population segments. This was similar in the case of meat (Delgado Perea, Reference Delgado Perea2024). The change in tastes and preferences gained more relevance from this moment in both types of food.
This study also shows that the nutrition transition gave rise to a change in the structure of nutrients, with an increase in the intake of fats and, to a lesser extent, proteins and a reduction in the consumption of carbohydrates (Figure 4). Logan (Reference Logan2006a, Reference Logan2006b) observed that households with higher incomes replaced plant-based products and nutrients with those of animal origin, although the percentage distribution of each type of nutrient remained the same and the elasticities were similar. However, this was the case because this author conducted a static analysis, a snapshot in time in the 1880s. A dynamic analysis would have shown structural changes in the intake of macronutrients, as indicated by the abundance of literature on the topic (Cussó Segura, Reference Cussó Segura2005; Floud et al., Reference Floud, Fogel, Harris and S.c2011; Gazeley and Newell, Reference Gazeley and Newell2013, Reference Gazeley and Newell2015; Medina-Albaladejo and Calatayud, Reference Medina-Albaladejo and Calatayud2020; Gazeley et al., Reference Gazeley, Newell, Reynolds and Rufrancos2022; Medina-Albaladejo et al., Reference Medina-Albaladejo, Calatayud, Nicolau-Nos, Pujol-Andreu, Albaladejo, Carrión and Calatayud2023; among others).
In the future, new lines of research beyond the scope of this article should further explore the role of other economic, environmental, scientific and technological, social, institutional, and cultural factors that accompanied income and prices in the process of dietary change. Differences in tastes and preferences must have been important, as the literature has already shown for the cases of milk and meat (Collantes, Reference Collantes2015b, Reference Collantes2016, Reference Collantes2017a, 2017b, Reference Collantes2019, Reference Collantes2018, Reference Collantes2020, Reference Collantes2025; Delgado Perea, Reference Delgado Perea2024, Reference Delgado Perea2024), as well as the evidence presented here on the limited explanatory power of income and prices for the evolution of consumption of certain products, such as cereals or fruit and vegetables. Some studies have also demonstrated this through estimates of real consumption, such as rural food surveys conducted during the years of strongest economic growth under Francoism in the 1960s, highlighting that the rural population of Andalusia or inland Spain exhibited micronutrient deficiencies due to their low consumption of dairy products. Contemporary testimonies indicate that this was largely voluntary and related to customs, lack of knowledge, and prevailing dietary habits in rural Spain at the time (Berbaneu-Mestre et al., Reference Berbaneu-Mestre, Galiana-Sánchez, Tormo-Santamaria, Trescastro-López, Albaladejo, Carrión and Calatayud2023). Improvements in food distribution in a context of urbanization and urban expansion (Gallego Martínez, Reference Gallego Martínez2016; Campos Posada, Reference Campos Posada, Carvajal and de Miguel Salanova2021), as well as changes in the food industry (Germán and Langreo, Reference Germán and Langreo2018), were also important, as they enabled an expansion of supply that made dietary change possible. All of this was accompanied by advances in scientific and technological knowledge and by institutional policies oriented toward food and public health, aimed at preventing fraud and improving the dietary habits of the most disadvantaged social groups (Barona Reference Barona, Bernabeu-Mestre and Barona2011; Berbaneu-Mestre, Reference Berbaneu-Mestre, Bernabeu-Mestre and Barona2011; Guillem-Llobat, Reference Guillem-Llobat, Bernabeu-Mestre and Barona2011; Bernabeu-Mestre et al., Reference Bernabeu-Mestre, Tormo-Santamaria, Trescastro-López, Otero Carvajal and de Miguel Salanova2021; Guillem-Llobat and Perdiguero-Gil, Reference Guillem-Llobat, Perdiguero-Gil, Carvajal and de Miguel Salanova2021; Muñoz Pradas, Reference Muñoz Pradas, Carvajal and de Miguel Salanova2021).
7. Conclusions
From a theoretical point of view, the nutrition transition model formalized the changes experienced in the diet of Europeans during the industrialization process of the nineteenth and twentieth centuries, with a profound impact on standards of living. The completion of this transition marked the end of hunger and the homogenization of dietary consumption in Europe and other parts of the world, due to the increase in calorie intake and the shift from a consumption based predominantly on cereals to one that included more animal products. In order to explain this process, the literature has frequently referred to economic development and the growth in income as a principal explanatory factor. However, few studies on a historical level have been able to truly quantify the role of the evolution of income, prices, and other factors in the dietary change. Therefore, this study has sought to advance in this direction by conducting a quantitative exercise that has allowed us to observe the elasticity of demand of 28 food items to changes in income and prices in the case of a country in the Mediterranean area, namely Spain, between 1926 and 1980. The objective is to better understand this process and the determining factors that drove the dietary change.
The results obtained confirm the characteristics of the nutrition transition model in the country, within a delayed process that was interrupted by the Spanish Civil War. The transition did not resume until the second half of the 1950s, intensified in the 1960s, driven by economic growth, and concluded twenty years later. Within this process, particularly noteworthy was the fall in the consumption of traditional products, pushed by the growth in income and the changes in tastes and preferences, and their replacement with animal products, whose consumption was highly elastic and sensitive to improvements in income, with a clearly positive and statistically significant relationship that explains a good part of the rise in consumption during these years. This meant that they were no longer considered a luxury product but a staple food. At the end of the period studied, the role of income had moderated, and prices had a greater influence, in line with the international studies that indicate the inverted U relationship between economic development and the consumption of products of animal origin.
Therefore, it can be proven that income played a key role in the evolution of dietary consumption. In the early decades of the twentieth century, the income elasticity of demand was more moderate due to the prevalence of low-cost staple products. However, from the 1950s, and particularly the 1960s, economic growth enabled a greater dietary diversification. Real food prices also influenced the change in diet, although to a lesser extent. It can be observed that the products with a greater price elasticity were those whose consumption expanded more in the second half of the twentieth century, principally of animal origin. This suggests that the fall in relative prices of these products also facilitated their widespread adoption.
Finally, it should be noted that in the future it will be necessary to study in greater depth methodologies that enable the quantification of the role of the changes in tastes and preferences of the population in the process dietary change and other factors that contributed to this that went hand in hand with the growth of income, such as urbanization, the improvement in agricultural productivity or changes in lifestyle habits.
Acknowledgements.
I should like to thank Salvador Calatayud, José Miguel Martínez Carrión, Fernando Collantes, Alfonso Díez Minguela, Carolina Román, the editors and journal’s referees, whose comments have contributed to improve the manuscript. All errors remain my own.
Funding.
This work was supported by the projects PID2023-148959NB-I00 and PID2020-113793GB-I00, funded by MCIN/AEI/10.13039/501100011033 and ERDF (EU), and project CIPROM/2023/39 funded by Generalitat Valenciana.
Annex
Description of the products contained in the principal sources
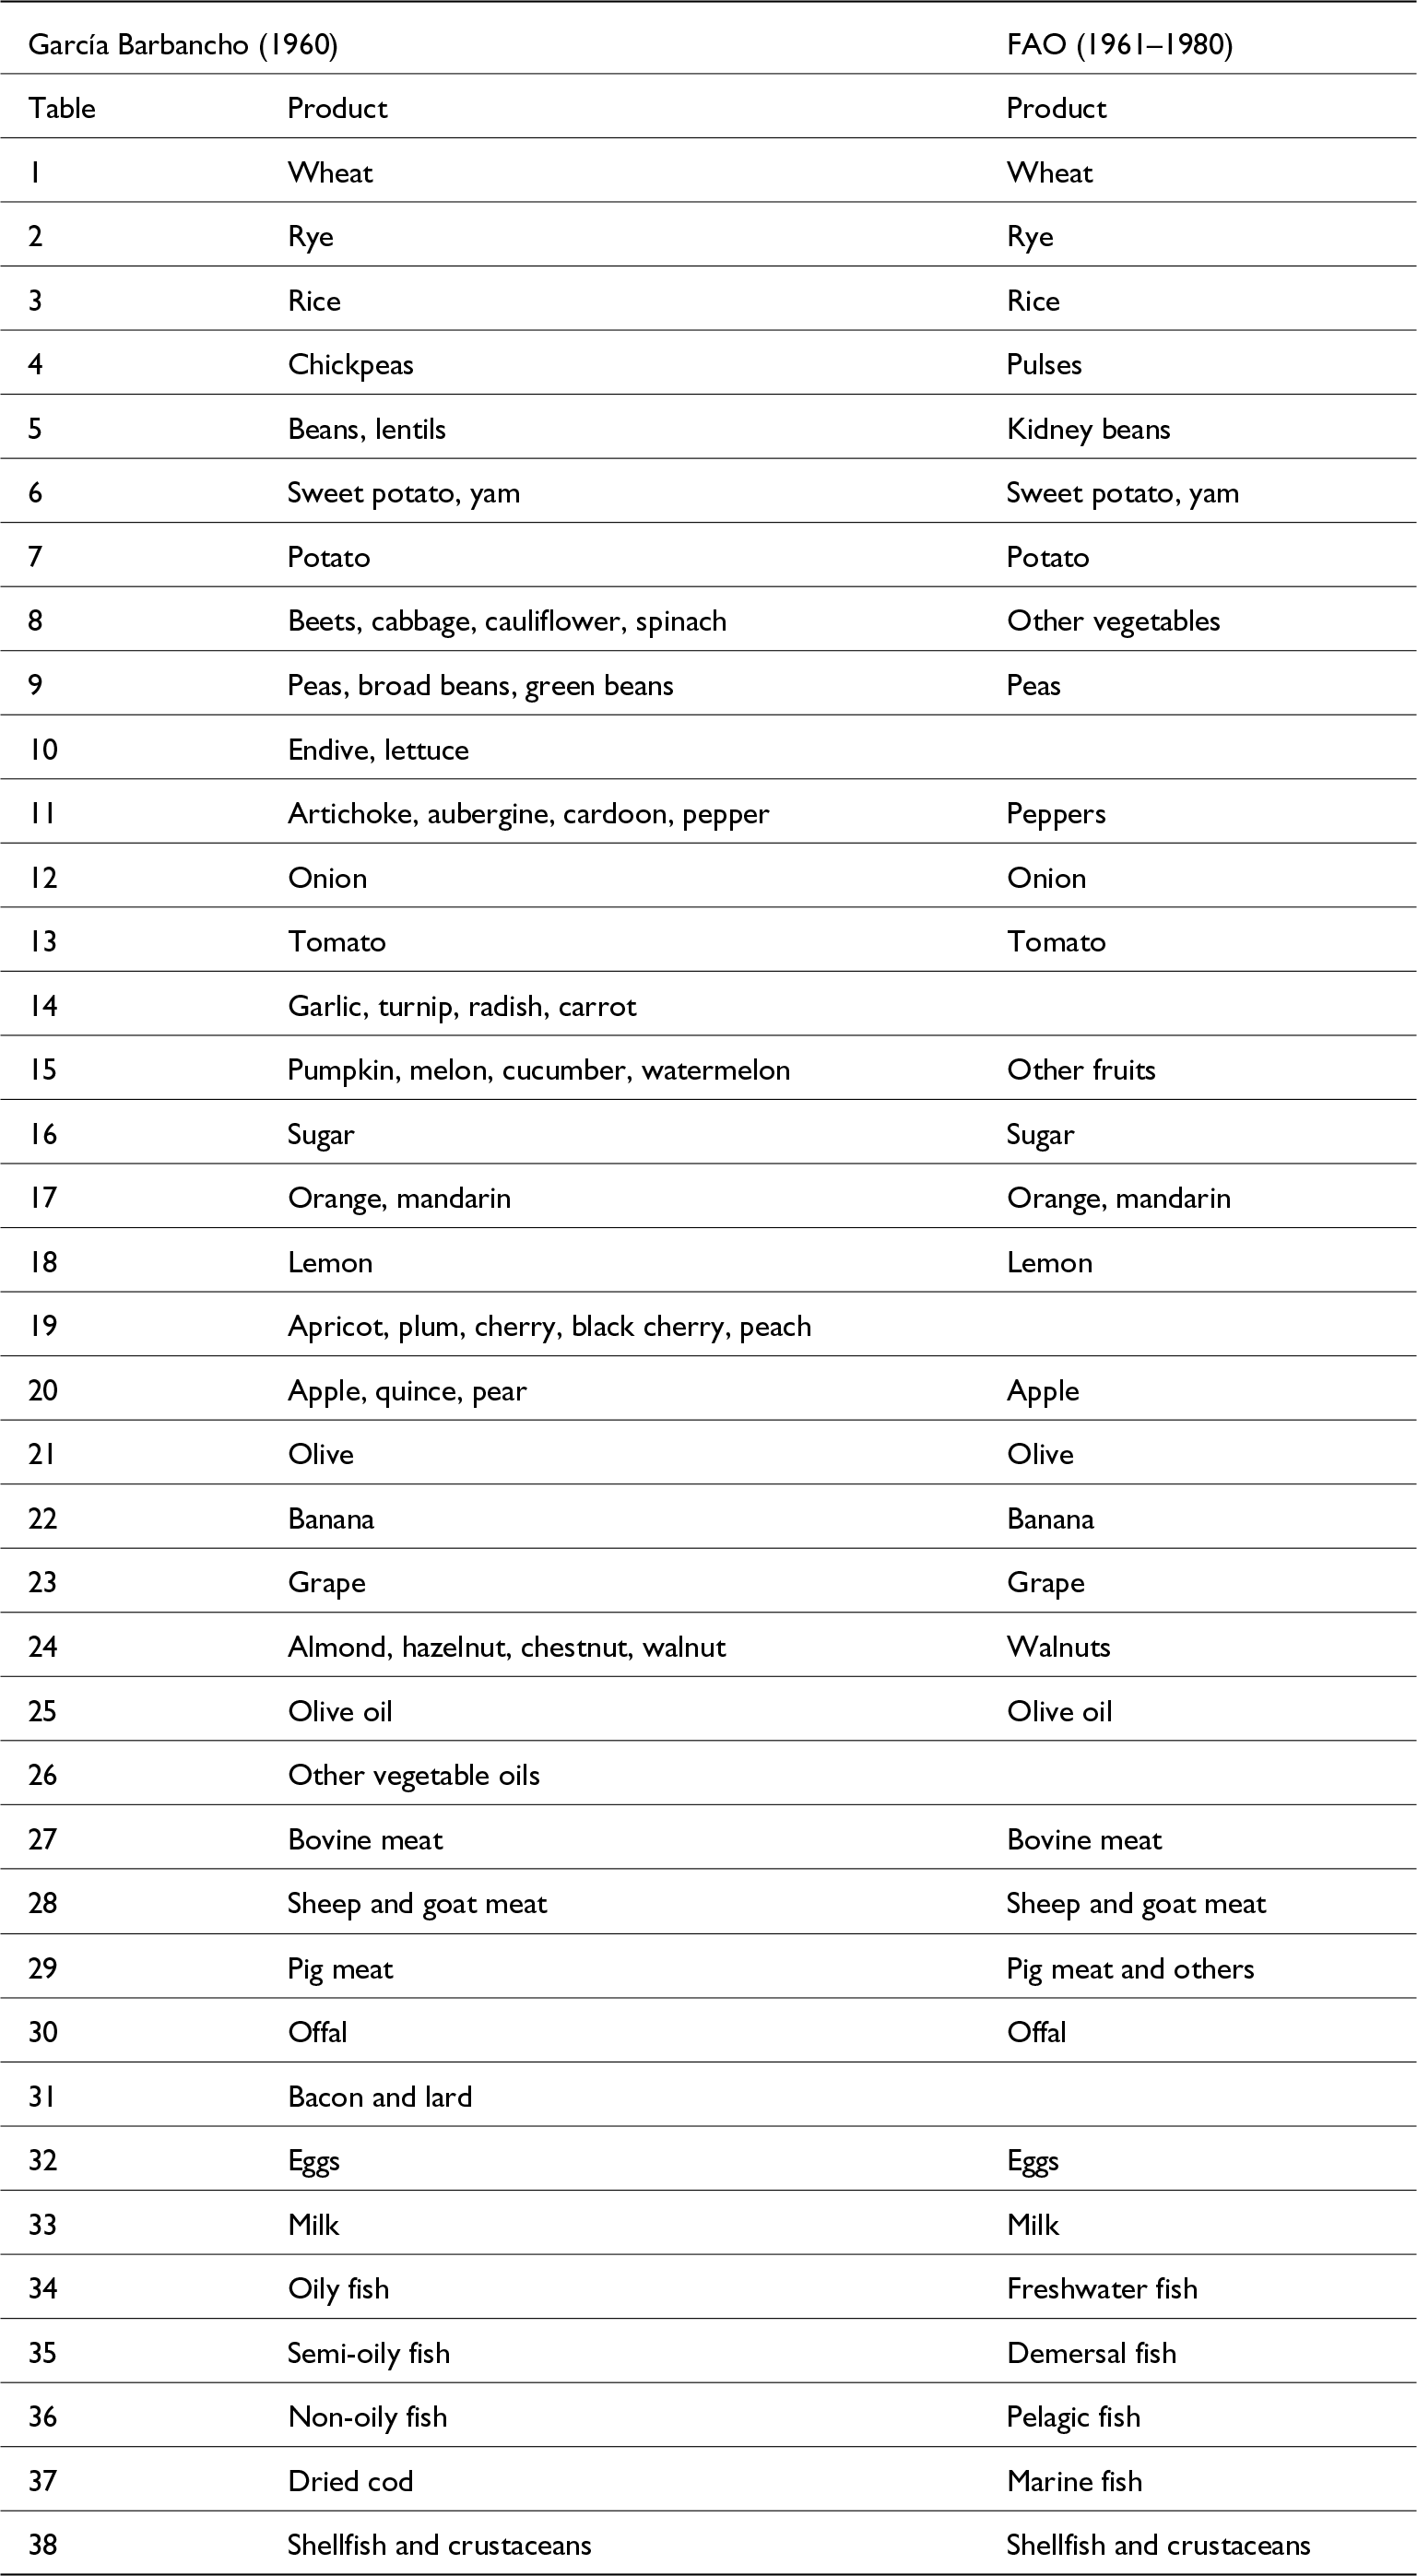
Table A1 Long description
The table maps each numbered product in García Barbancho (1960) to the closest FAO product label used for the 1961 to 1980 series. Many staples match directly, including wheat, rye, rice, potato, sugar, citrus, olive, grape, olive oil, and major meats, eggs, and milk. Several García Barbancho entries are consolidated into broader FAO groups, such as chickpeas to pulses, mixed vegetables to other vegetables, and pumpkin, melon, cucumber, and watermelon to other fruits. Some items shift to a specific representative FAO label, for example beans and lentils to kidney beans, peas and broad beans to peas, and mixed nuts to walnuts. Fish types are reclassified into FAO groupings, with oily fish to freshwater fish, semi-oily fish to demersal fish, non-oily fish to pelagic fish, and dried cod to marine fish. A number of García Barbancho products have no FAO counterpart listed in the table, including endive and lettuce, garlic and root vegetables, stone fruits, other vegetable oils, and bacon and lard. Because several mappings aggregate multiple foods into a single FAO category or leave blanks, the correspondence is approximate rather than a perfect one-to-one match.
Source: Own elaboration
Constructed series
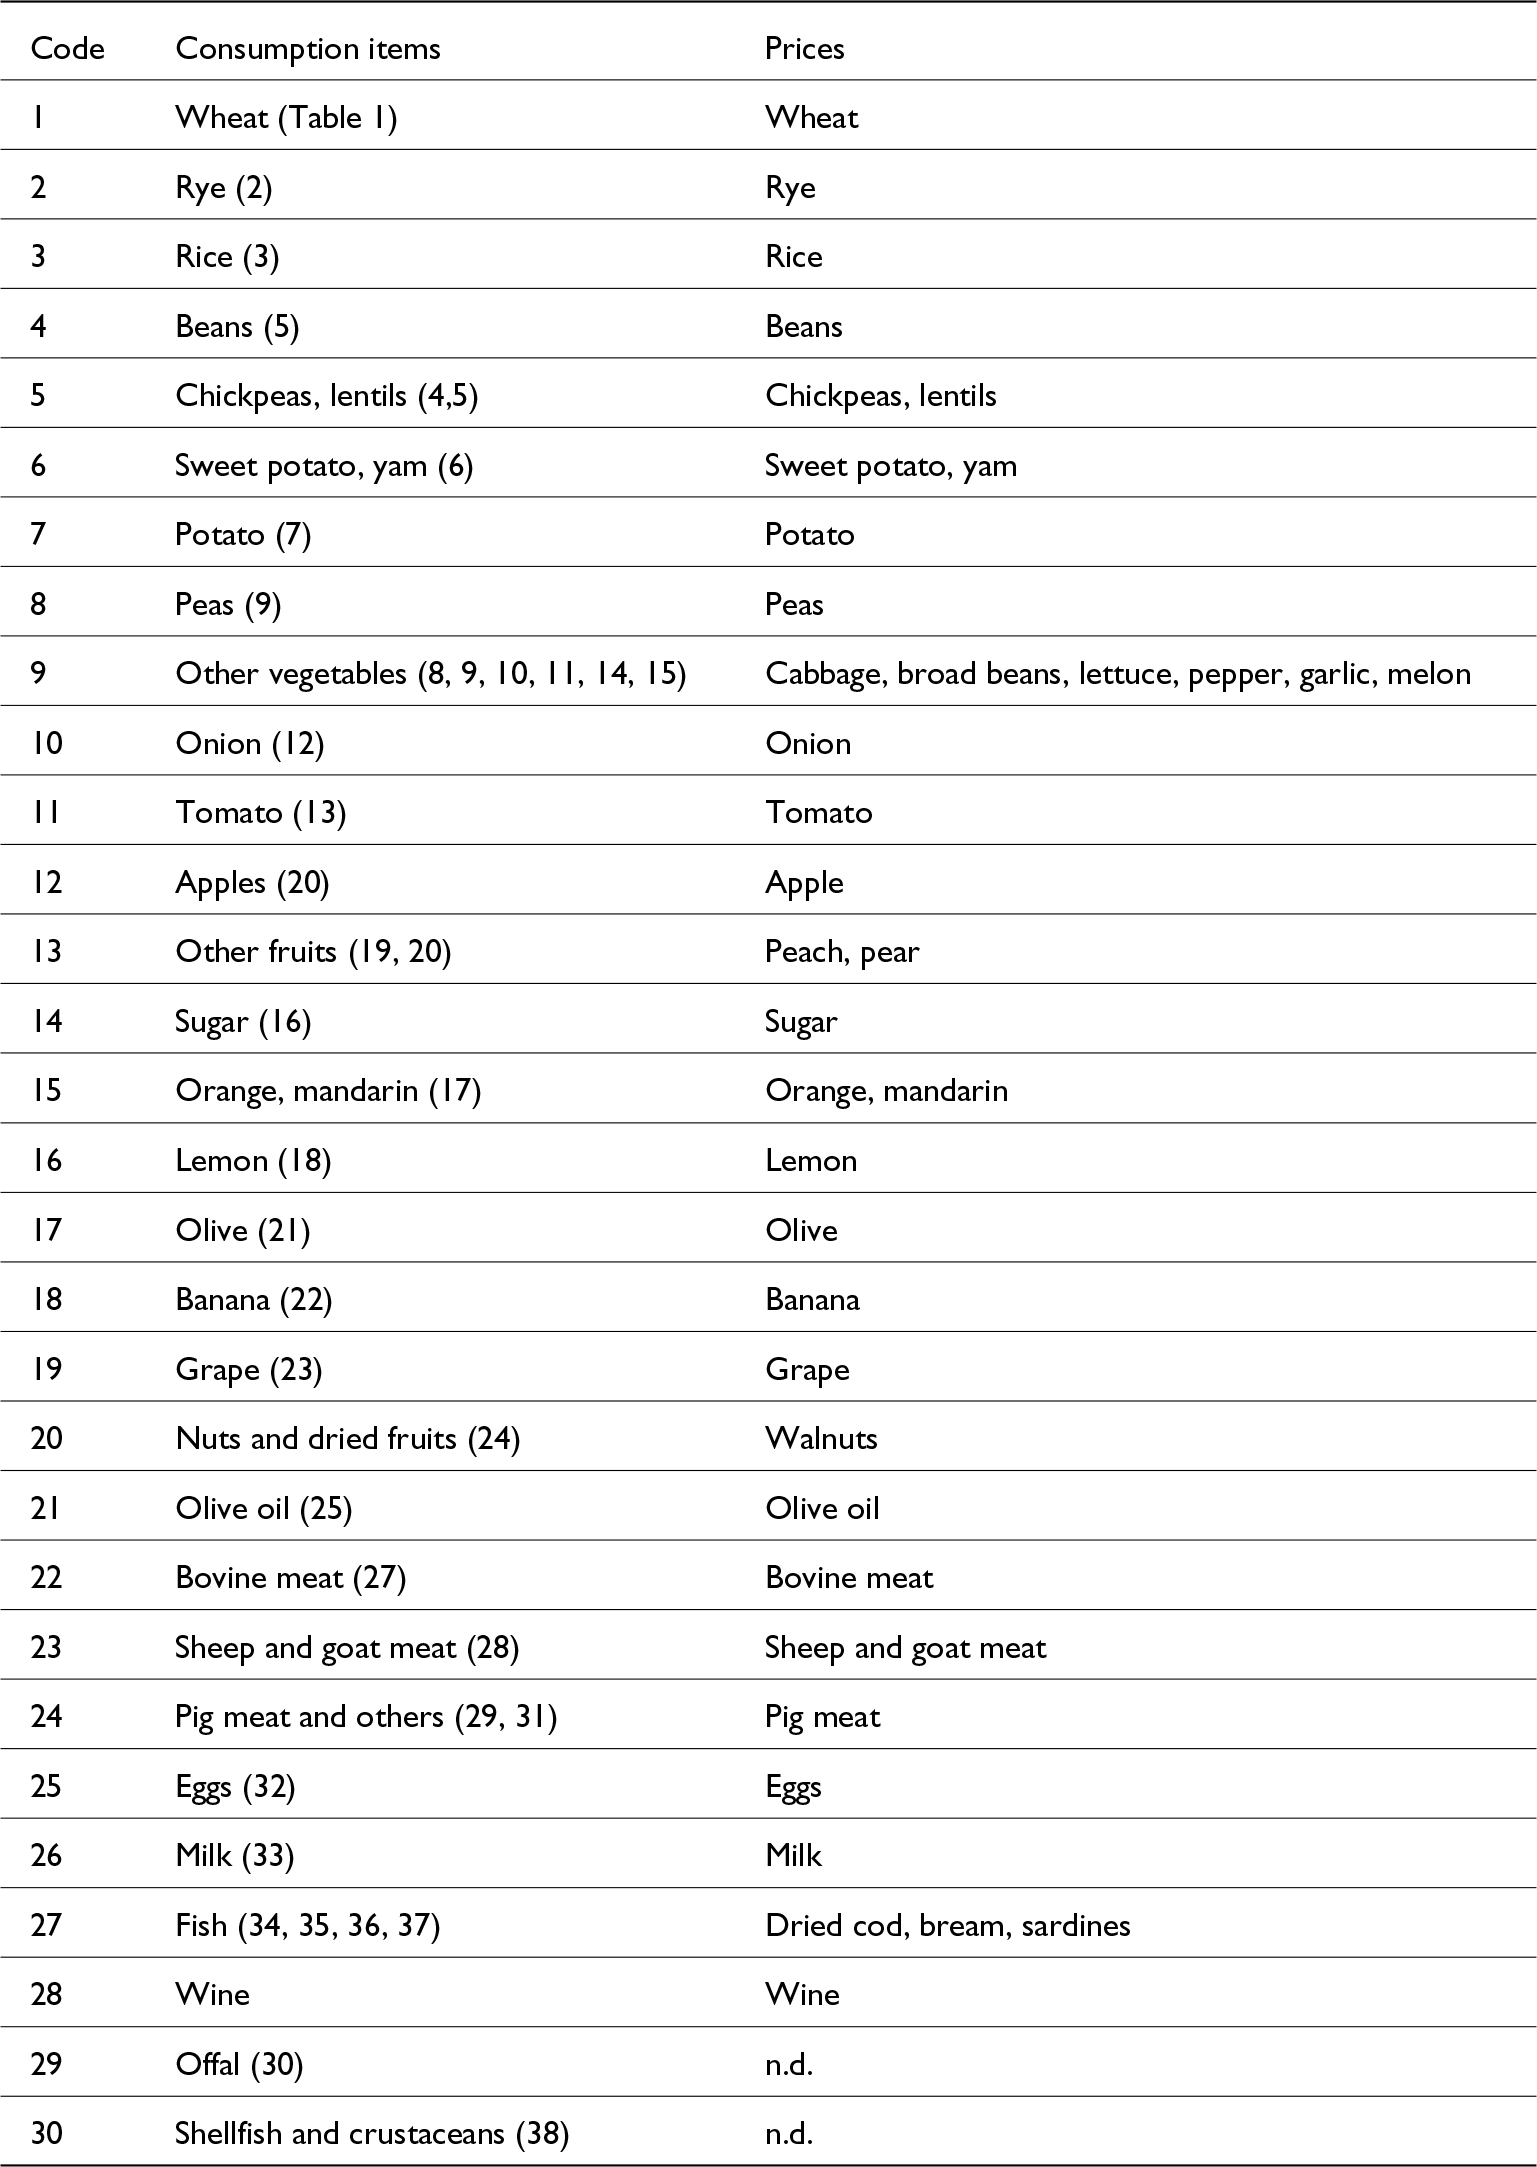
Table A2 Long description
The table links 30 coded consumption categories to the price series used to construct each category. Most items have a direct one to one match between the consumption item and its price series, such as wheat, rye, rice, sugar, olive oil, meats, eggs, milk, and wine. Several categories combine multiple underlying items for consumption while using a grouped price list, including other vegetables and fish. Some price series list representative products rather than a single item, for example other vegetables uses cabbage, broad beans, lettuce, pepper, garlic, and melon, and fish uses dried cod, bream, and sardines. Fruit is split into specific items like apple, orange and mandarin, lemon, banana, and grape, plus an other fruits group priced with peach and pear. Two categories have no price data available: offal and shellfish and crustaceans. Item references in parentheses indicate the underlying source tables used to build the consumption series, so the mapping reflects construction choices rather than a complete market basket.
Source: Own elaboration
Note: In the Items column, the tables of García Barbancho (Reference García Barbancho1960) are specified in parentheses and are those from which the consumption series have been constructed (see Table 5).
Groups of items
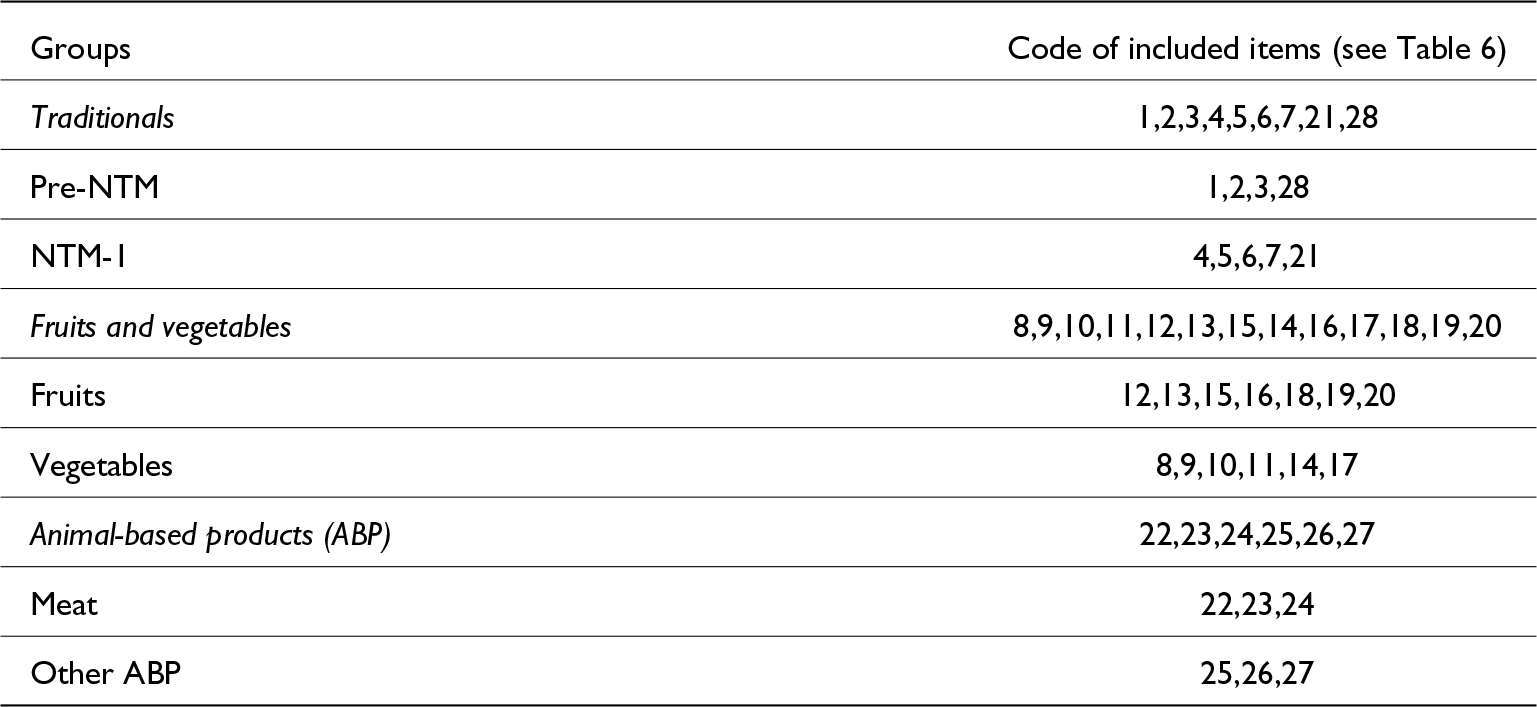
Table A3 Long description
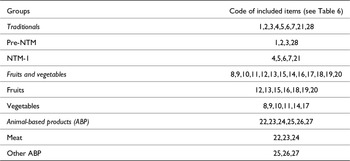
The table maps each item group to the code numbers that belong to it. Traditionals includes codes 1, 2, 3, 4, 5, 6, 7, 21, and 28, while Pre-NTM is a smaller subset with 1, 2, 3, and 28. NTM minus 1 contains 4, 5, 6, 7, and 21, separating those codes from the Pre-NTM set. Fruits and vegetables spans codes 8 through 20, and is split into Fruits with 12, 13, 15, 16, 18, 19, and 20, and Vegetables with 8, 9, 10, 11, 14, and 17. Animal-based products includes 22 through 27, divided into Meat with 22, 23, and 24, and Other ABP with 25, 26, and 27. Several groups are nested subsets of broader categories, so codes can appear in both a parent group and its subgroups.
Source: Own elaboration

 Open access

