

N efficiency in dairy cows is generally low( Reference Kohn, Dinneen and Russek-Cohen 1 ), and optimisation of the diet, with focus on dietary N in the form of protein, amino acids and urea, has only led to minor improvements in the utilisation of N in ruminants( Reference Reynolds and Kristensen 2 – Reference Firkins 6 ). The importance of other N-containing compounds such as microbial nucleic acids (NA) in the nutritional physiology of ruminants has so far been sparsely investigated, regardless of the fact that they correspond to more than 20 % of the total microbial N synthesised in the rumen( Reference Fujihara and Shem 7 – Reference Smith and McAllan 9 ). The amount of microbial DNA/RNA entering the intestine has been estimated to be 15–35 g/kg DM digesta. Thus, an improved understanding of the quantitative absorption and intermediary metabolism of different NA components (nucleotides (NT), nucleosides (NS), bases (BS) and degradation products (DP)) in the portal-drained viscera (PDV), hepatic and peripheral tissues may be of importance in order to discover new ways to improve N efficiency in dairy cows.
N from the feed undergoes different processes in ruminants before absorption. In the rumen, dietary N is degraded and reused by the microbial population for the synthesis of not only microbial protein (75–85 %) but also microbial NA (15–25 %)( Reference Fujihara and Shem 7 , Reference McDonald, Edwards and Greenhalgh 8 , Reference McDonald, Edwards and Greenhalgh 10 ). NA are the main constituents of DNA and RNA, and they are derived from and degraded to, first, purine and pyrimidine NS, then purine and pyrimidine BS and, finally, purine and pyrimidine DP. There are five main types of purines and pyrimidines, namely adenine (Ade), guanine (Gua), cytosine (Cyt), thymine (Thy) and uracil (Ura). Purines and pyrimidines are further divided into two subgroups, the purines (Ade and Gua) and the pyrimidines (Cyt, Thy and Ura), and each subgroup has a distinctive metabolic pathway( Reference McDonald, Edwards and Greenhalgh 8 ) (Figs. 1 and 2). The resynthesised microbial NA flow into the small intestine where they are digested before subsequent absorption takes place( Reference Fujihara and Shem 7 , Reference McAllan 11 , Reference McAllan and Smith 12 ).
Degradation pathways of purine metabolism. The illustration is modified from the KEGG: Kyoto Encyclopedia of Genes and Genomes, purine metabolism( 46 ). Metabolites: dAMP, 2′-deoxyadenosine 5′-monophosphate (deoxyadenosine monophosphate); AMP, 5′-adenylic acid (adenosine monophosphate); IMP, 5′-inosinic acid (inosine monophosphate); XMP, 5′-xanthylic acid (xanthosine monophosphate); GMP, 5′-guanidylic acid (guanosine monophosphate); dGMP, 2′-deoxyguanosine 5′-monophosphate (deoxyguanosine monophosphate). Enzymes: 1. 5′-nucleotidase (EC 3.1.3.5); 2. AMP deaminase (EC 3.5.4.6); 3. IMP dehydrogenase (EC 1.1.1.205); 4. GMP synthase (EC 6.3.5.2); 5. deoxyguanosine kinase (EC 2.7.1.113); 6. purine-nucleoside phosphorylase (EC 2.4.2.1); 7. adenosinedeaminase (EC 3.5.4.4); 8. guanosinephosphorylase (EC 2.4.2.15); 9. adeninedeaminase (EC 3.5.4.2); 10. xanthine oxidase (EC 1.17.3.2); 11. xanthine dehydrogenase (EC 1.17.1.4); 12. guaninedeaminase (EC 3.5.4.3); 13. urate factor-independent hydroxylase (EC 1.7.3.3) or uricase; 14. hydroxyisourate hydrolase (EC 3.5.2.17) (or spontaneous reaction).

Degradation pathways of pyrimidine metabolism. The illustration is modified from the KEGG: Kyoto Encyclopedia of Genes and Genomes, pyrimidine metabolism( 47 ). Metabolites: CMP, 5′-cytidylic acid (cytidine monophosphate); UMP, 5′-uridylic acid (uridine monophosphate); dUMP, 2′-deoxyuridine 5′-monophosphate (deoxyuridine monophosphate); dCMP, 2′-deoxycytidine 5′-monophosphate (deoxycytidine monophosphate); dTMP, thymidine 5′-monophosphate. Enzymes: 1. 5′-nucleotidase (EC 3.1.3.5); 2. thymidine kinase (EC 2.7.1.21); 3. dCMP deaminase (EC 3.5.4.12); 4. cytidinedeaminase (EC 3.5.4.5); 5. ribosylpyrimidinenucleosidase (EC 3.2.2.8); 6. uridinenucleosidase (EC 3.2.2.3); 7. purine-nucleoside phosphorylase (EC 2.4.2.1); 8. thymidinephosphorylase (EC 2.4.2.4); 9. cytosinedeaminase (EC 3.5.4.1); 10. dihydrouracil dehydrogenase (EC 1.3.1.1); 11. dihydropyrimidine dehydrogenase (EC 1.3.1.2); 12. dihydropyrimidinase (EC 3.5.2.2); 13. β-ureidopropionase (EC 3.5.1.6).

Quantitative analysis of purines and pyrimidines in dairy cattle research has almost solely focused on purine derivatives in the urine and milk, where the excretion of the purine DP uric acid (Uac) and allantoin (Alo) has been used as an indirect marker of rumen microbial synthesis( Reference Boudra, Doreau and Noziere 13 – Reference Gonda and Lindberg 18 ). Hence, data concerning the absorption and hepatic metabolism of other purines and pyrimidines than Uac and Alo are at present very limited.
Of the purine and pyrimidine metabolic pathways, purine metabolism has mainly been examined( Reference Fujihara and Shem 7 , Reference Chen and Gomes 14 ). In short, it is known that purine NT are hydrolysed into purine NS and BS in the small intestine and absorbed from the intestinal lumen across the intestinal mucosa( Reference McDonald, Edwards and Greenhalgh 8 , Reference Smith and McAllan 9 , Reference McAllan 11 , Reference Chen and Gomes 14 ). Dairy cows have a high activity of the enzyme xanthine oxidase (EC 1.17.3.2) in most tissues, and especially in the small-intestinal mucosa and the blood, which converts large amounts of purines into the purine DP Uac( Reference Chen, Orskov and Hovell 19 , Reference Verbic, Chen and Macleod 20 ). It is also well known that endogenous purine DP resulting from the degradation of tissue NA, and exogenous purine DP originating from the microbes, in the form of Uac and Alo, are rapidly cleared from the blood by the kidneys( Reference Chen, Orskov and Hovell 19 , Reference Verbic, Chen and Macleod 20 ). Thus, large amounts of purine DP are lost in the urine and are unavailable for recycling into tissue NA (salvage) or protein. It has been speculated that the conversion of Uac to Alo probably takes place in the hepatic tissue, as uricase (EC 1.7.3.3) is present in only trace amounts in the blood. The inability to use microbial purine N for the synthesis of amino acids contributes considerably to N loss in dairy cows( Reference Boudra, Doreau and Noziere 13 – Reference Verbic, Chen and Macleod 20 ).
Presumably the pyrimidines are metabolised during absorption, in the blood, and in the hepatic tissue in much the same manner as the purines. However, it is known that the pyrimidine DP β-alanine (β-ala) and β-aminoisobutyric acid (β-ami) can be incorporated into other intermediate products as part of N metabolism( Reference Loffler, Fairbanks and Zameitat 21 – 23 ). This could indicate that the degradation pathways of the pyrimidines differ from those of the purines in dairy cows; however, the salvage or excretion mechanisms involved during pyrimidine degradation has not been well described. Purine and pyrimidine metabolic pathways have at least one thing in common; during degradation, small amounts of NH3 are released, possibly available for urea recycling( Reference Røjen, Theil and Kristensen 24 ). Thus, some N is reusable following incorporation into microbial NA.
The objective of the present study was to describe and give a quantitative picture of the metabolism and degradation of purines and pyrimidines by studying the postprandial patterns of net PDV and net hepatic metabolism so as to evaluate purine and pyrimidine N in this context. We hypothesised that the purines (Ade and Gua) and the pyrimidines (Cyt, Thy and Ura), in the form of either a NS, a BS, a DP or a combination of these, are absorbed from the small intestine of dairy cows and undergo degradation across the intestinal wall and hepatic tissue. Furthermore, we hypothesised that the purines and pyrimidines and the N they contain ultimately largely are lost following the excretion of DP across the kidneys.
Materials and methods
The present experiment complied with the Danish Ministry of Justice Law No. 382 (10 June 1987), Act No. 726 (9 September 1993), concerning experiments with animals and care of experimental animals.
Animals, experimental design and sampling
A detailed description of the experiment has been provided in a preceding paper( Reference Røjen, Theil and Kristensen 24 ). Briefly, eight ruminally cannulated Danish Holstein cows in second lactation were permanently catheterised in the gastrosplenic vein as well as in a mesenteric or intercostal artery, mesenteric vein, hepatic portal vein and hepatic vein, as described previously( Reference Larsen and Kristensen 25 ). Cows were randomly allocated to a triplicate incomplete 3 × 3 Latin square design for a 14 d period. Treatments were ventral ruminal infusion of tap water (water infusion, 10 litres/d), 4·1 g feed urea/kg DM intake (DMI), and 8·5 g feed urea/kg DMI. For the present experiment, four cows assigned to the 8·5 g feed urea/kg treatment of DMI were evaluated. The a priori criteria for selection were a functional gastrosplenic catheter, i.e. all gastrosplenic vein plasma samples were available in the sample set, and at least two cows from each square. All cows were fed the same basal total mixed ration, formulated using the Nordic feed evaluation system (NorFor)( Reference Volden 26 ). The basal total mixed ration supplied 80 % of requirements for metabolisable protein. To obtain 8·5 g feed urea/kg DMI, the average voluntary DMI for each cow was determined during the 1st week of each experimental period, and for the remaining of the period, each cow was fed at 95 % of voluntary DMI. Cows were fed three equal portions at 8 h intervals, and orts were removed and weighed. Infusion lines were inserted through the ruminal cannula and anchored in the ventral ruminal sack. Cows were sampled on the last day of each experimental period. Blood was sampled to obtain eight hourly sample sets beginning at 30 min before feeding at 08.00 hours, resulting in samples obtained at 0·5 h before feeding, and at 0·5, 1·5, 2·5, 3·5, 4·5, 5·5 and 6·5 h after feeding. Overall, eight samples of urine were collected at the same time points as blood sampling by stimulating the cow to urinate in a cup by sweeping the supra mammary region by hand. Blood was stabilised in sodium heparin vacuettes (Greiner Bio-One GmbH) immediately after sampling and placed on crushed ice. Plasma was harvested after centrifugation at 3000 g at 4°C for 20 min and stored in polystyrene tubes at − 20°C. Urine samples were stored at − 20°C and pooled within cow and period. For external calibration and quality control, a number of 5 ml aliquots of heparinised plasma were prepared from 2 litres of venous blood drawn from a Danish Holstein dairy cow fed a traditional total mixed ration. Splanchnic blood plasma flows were determined by downstream dilution of p-aminohippuric acid (pAH) infused (28 (se 2) mmol/h) continuously into the mesenteric vein( Reference Katz and Bergman 27 ).
Analytical procedures
Heparinised plasma was deacetylated before pAH determination by combining with an equal amount of 20 % TCA (v/v) (Sigma-Aldrich Denmark A/S) and incubating the supernatant for 1 h at 100°C. pAH concentration in plasma and urine was determined by the method described by Harvey & Brothers( Reference Harvey and Brothers 28 ) using a continuous flow analyser (Autoanalyzer 3, method US-216-72 Rev. 1; Seal Analytical Limited). Urine concentrations of xanthine (Xan), hypoxanthine (Hyp), Uac and Alo were determined by using an in-house routine procedure based on HPLC according to Thode( Reference Thode 29 ).
The concentration of key purine and pyrimidine metabolites was determined in heparinised plasma samples using a validated HPLC-based technique coupled to electrospray ionisation tandem MS combined with individual matrix-matched calibration standards and stable isotopically labelled reference compounds (SIL), as described by Stentoft et al. ( Reference Stentoft, Vestergaard and Løvendahl 30 ). Quantification was performed by external calibration by applying standard plasma spiked with a 2-fold serial dilution of purine and pyrimidine standard mixtures. To fit within the actual experimental calibration ranges, three to five concentration levels were used for calibration. All samples were analysed in duplicate and a standard curve and quality controls were analysed at the beginning and at the end of each sequence. Exploratory data from the analyses are summarised in Table 1.
Abbreviation, type and calibration range of the investigated purine and pyrimidine metabolites
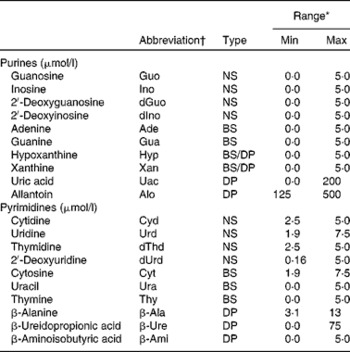
Min, minimum concentration; Max, maximum concentration; NS, nucleoside; BS, base; DP, degradation product.
* External calibration was performed with five concentrations, and bottom points were excluded to fit the concentration range in actual samples.
† Abbreviations were obtained from the IUPAC( 45 ).
Calculations and statistical procedures
Purine and pyrimidine concentrations were determined from their responses calculated as the chromatographic peak area. Matrix-matched linear calibration curves (start and end) were obtained by correcting for the inherent purine and pyrimidine and by the regression of log(area) against log(concentration). The resulting linear correlations were used to determine purine and pyrimidine concentrations (mean). Preceding quantification, purine and pyrimidine responses were normalised by employing the following factor: mean SIL area/SIL area for each sample. Calculation of net PDV flux, net hepatic flux, net splanchnic flux and hepatic extraction ratios of metabolites was performed as described by Kristensen et al. ( Reference Kristensen, Storm and Larsen 31 ). A positive net flux indicated a net release from a given tissue bed to the blood. A negative net flux indicated a net uptake by the tissue bed. The hepatic fractional removal of purine and pyrimidine metabolites was estimated as the percentage of net PDV release (NP%) and the percentage of total influx (TI%). NP% indicated the proportion of the metabolite removed by the hepatic tissue from the PDV. TI% indicated the proportion of the metabolite removed by the hepatic tissue from the PDV and all the other body tissue. Renal plasma flow was calculated as the infusion rate of pAH divided by arterial concentration, assuming complete renal extraction of pAH. Diuresis was calculated as the infusion rate of pAH divided by the urinary concentration of pAH. Renal influx was calculated as renal plasma flow times the arterial concentration of the purine and pyrimidine metabolite. The net urine flux was calculated as diuresis times the urine concentration of the purine and pyrimidine metabolite. The urine:renal ratio and the urine:splanchnic ratio were estimated as the net urine flux divided by the renal influx and as the net urine flux divided by the net splanchnic flux, respectively. Metabolite clearance (volume of blood metabolites cleared by the kidney per unit of time) was calculated as urinary concentration divided by arterial concentration times diuresis.
The total amount of purine N and pyrimidine N entering the small intestine was estimated to be 60 g/d from the flow of microbial crude protein to the small intestine, assuming 20 % of the total microbial N to be bound in NA using the NorFor( Reference Fujihara and Shem 7 , Reference McDonald, Edwards and Greenhalgh 8 , Reference McDonald, Edwards and Greenhalgh 10 , Reference Volden 26 ). Microbial purine N and pyrimidine N entering the small intestine was estimated to be 40 and 20 g/d, respectively, assuming two-thirds purine N and one-third pyrimidine N (5 N/purine and 2·5 N/pyrimidine) of NA N. The metabolite N flux absorbed from the PDV, removed/produced across the hepatic tissue, removed/produced across the total splanchnic bed, and excreted in the urine was calculated from the metabolite net flux and the metabolite N content for each specific metabolite by multiplying the net flux with N molecules in the given metabolite, the molecular weight of N, 24 h and 10− 6.
Data were subjected to the ANOVA using the MIXED procedure in SAS (Statistical Analysis System version 9.1 (TS1M3); SAS Institute, Inc.). The model included the fixed effect of sampling time, and cow within square was considered as a random effect. Time was considered as a repeated measure using the autoregressive order 1 covariance structure. Denominator degrees of freedom were estimated using the Kenward–Roger method. Data are presented as least-squares means and standard deviations or standard errors of the mean. Significance was declared at P≤ 0·05 and tendencies were considered at P≤ 0·1. The effects of linear and quadratic orthogonal polynomial contrasts of time relative to feeding were tested.
Results
The total N supply of cows with feed plus infused urea N was equivalent to a dietary crude protein concentration of 15·0 % of DM, corresponding to a moderate supply. The four cows used were 69 (se 8) d in lactation at the first sampling day, and DMI, energy-corrected milk yield and body weight averaged 19 (se0·58) kg/d, 32 (se1·0) kg/d and 577 (se14) kg, respectively.
Plasma variables
All the twenty purine and pyrimidine metabolites were identified in all the four types of experimental plasma samples (Table 2). The concentration ranges of the purines (guanosine (Guo) 0·021–1·1 μmol/l, inosine (Ino) 0·040–0·79 μmol/l, 2′-deoxyguanosine (dGuo) 0·015–0·29 μmol/l and 2′-deoxyinosine (dIno) 0·0056–0·32 μmol/l) were higher than those of the purine BS (Ade 0·15–0·16 μmol/l, Gua 0·0045–0·015 μmol/l, Hyp 0·041–0·059 μmol/l and Xan 0·011–0·015 μmol/l). The concentration ranges of the purine DP were even higher (Uac 71–78 μmol/l and Alo 117–133 μmol/l). Only in the case of the purine NS (Guo, Ino, dGuo and dIno), a large difference in concentration between the types of plasma was observed, with notably higher concentration levels in the hepatic portal vein than those in the artery, hepatic vein and gastrosplenic vein.
Concentrations of purine and pyrimidine metabolites in plasma samples from lactating dairy cows (Mean values and standard deviations; minimum (min) and maximum (max) concentration values)

* For a description of the abbreviations of purines and pyrimidines, refer to Table 1.
As with the purines, the concentration ranges of the pyrimidine NS (cytidine (Cyd) 2·4–4·8 μmol/l, uridine (Urd) 2·1–6·0 μmol/l, thymidine (Thd) 1·1–1·8 μmol/l and 2′-deoxyuridine (dUrd) 0·65–1·0 μmol/l) were higher than the corresponding concentration ranges of the pyrimidine BS (Cyt 0·0 μmol/l, Ura 0·19–0·24 μmol/l and Thy 0·022–0·042 μmol/l). The concentrations of the pyrimidine NS were generally higher than those of the purine NS; in contrast, the concentrations of the pyrimidine BS (Cyt, Ura and Thy) were in the same range as those of the purine BS (Ade, Gua, Hyp and Xan). The concentration ranges of the pyrimidine DP (β-ala 13–14 μmol/l, β-ureidopropionic acid (β-ure) 3·7–4·6 μmol/l and β-ami 0·28–0·35 μmol/l) were considerably lower than those of their purine counterparts.
The differences in the concentrations of purine and pyrimidine metabolites between the hepatic portal vein and the artery (ΔPA), the hepatic vein and the artery (ΔHA), the hepatic portal vein and the hepatic vein (ΔPH) and the gastrosplenic vein and the artery (ΔGA) are presented in Table 3. All purines except Ade and Xan had one or more ΔPA, ΔHA, ΔPH or ΔGA values that differed from zero (P≤ 0·05). Most of the pyrimidines also had ΔPA, ΔHA, ΔPH or ΔGA values that were different from zero (P≤ 0·1). However, as for Ade and Xan, Cyt, Thy and Ura did not demonstrate differences from zero for neither ΔPA, ΔHA, ΔPH or ΔGA values (P>0·1).
Concentration differences between each of the four blood veins and artery of purine and pyrimidine metabolites in lactating dairy cows (Mean values with their standard errors; n 4)

ΔPA, concentration difference between the hepatic portal vein and the artery; ΔHA, concentration difference between the hepatic vein and the artery; ΔPH, concentration difference between the hepatic portal vein and the hepatic vein; ΔGA, concentration difference between the gastrosplenic vein and the artery.
* Significantly different from zero (P≤ 0·05; t test).
† Marginally significantly different from zero (P≤ 0·1; t test).
‡ P values for the main effect of time relative to feeding. Significance declared when P≤ 0·05, tendency when P≤ 0·1 (F test).
§ For a description of the abbreviations of purines and pyrimidines, refer to Table 1.
Net portal-drained viscera fluxes
Given that neither the ΔPA, ΔHA, ΔPH nor ΔGA values for Ade, Xan, Cyt, Thy and Ura were different from zero (P>0·1), the net PDV fluxes of these metabolites could not be assessed. This was also the case for β-ure, which only demonstrated a concentration difference different from zero for the ΔGA values (P≤ 0·01). The net PDV fluxes of the remaining fifteen purine and pyrimidine metabolites (Guo, Ino, dGuo, dIno, Gua, Hyp, Uac, Alo, Cyd, Urd, Thd, dUrd, β-ala, β-ure and β-ami) were all positive (net release) (Table 4). The net PDV releases of the purine NS Guo (1·3 mmol/h), Ino (0·85 mmol/h), dGuo (0·33 mmol/h) and dIno (0·35 mmol/h) and the purine BS Gua (2·3 μmol/h) and Hyp (18 μmol/h) occurred, as well as the net PDV releases of the purine DP Uac (7·0 mmol/h) and Alo (7·8 mmol/h). The net PDV release of Alo increased over time in a quadratic manner (P= 0·03), and the release of Guo and Ino tended towards a cubic effect (P= 0·08 and P= 0·09, respectively).
Blood plasma flows and net fluxes of purine and pyrimidine metabolites in lactating dairy cows (Mean values with their standard errors)

Lin, linear; Quad, quadratic; PDV, portal-drained viscera; TSP, total splanchnic tissue; HA, hepatic artery; HEP, hepatic tissue.
* Significant (P≤ 0·05; t test).
† Marginally significant (P≤ 0·1; t test).
‡ Hourly samples (time) were collected during an 8 h period, 0·5 h before feeding, and at 0·5, 1·5, 2·5, 3·5, 4·5, 5·5 and 6·5 h after feeding, on day 14 of the experimental period.
§ P values for Lin, Quad and cubic time effects.
∥ Overall mean and sem (n 4, across the four cows).
¶ sem (n 4, across the four cows within each sampling time).
** For a description of the abbreviations of purines and pyrimidines, refer to Table 1.
The net PDV releases of the pyrimidine NS Cyd (1·9 mmol/h), Urd (2·8 mmol/h), Thd (0·77 mmol/h) and dUrd (0·30 mmol/h) were notably higher than those of the pyrimidine DP β-ala (0·77 mmol/h) and β-ami (0·047 mmol/h). In the case of dUrd and β-ala, linear time effects could be observed (P= 0·07 and P≤ 0·01, respectively). The remaining metabolites did not demonstrate any time dependence relative to feeding (0·39 ≤ P≤ 0·79).
Net hepatic fluxes
For the same reason as for the net PDV fluxes, net hepatic fluxes for Ade, Xan, Cyt, Thy, Ura and β-ure could not be assessed. Except for Uac, the net hepatic fluxes of the remaining fifteen purine and pyrimidine metabolites were negative (net uptake) (Table 4). The following net hepatic uptakes occurred for the purine NS: Guo − 1·3 mmol/h; Ino − 0·86 mmol/h; dGuo − 0·32 mmol/h; dIno − 0·36 mmol/h. The net hepatic uptake of the purine BS Gua ( − 20 μmol/h) and Hyp ( − 21 μmol/h) was lower. In the case of Gua, a tendency towards a quadratic time effect could be observed (P= 0·09). The only purine with a positive net hepatic flux (net release) was Uac (0·63 mmol/h). The purine DP Alo ( − 16 mmol/h) had a net negative hepatic flux (net uptake).
As with the net PDV release, the net hepatic uptake of the pyrimidines was different from that of the purines. The pyrimidine NS and BS had the following net hepatic uptakes: Cyd − 1·4 mmol/h; Urd − 5·0 mmol/h; Thd − 1·0 mmol/h; dUrd − 0·52 mmol/h. These were, again, higher than those of the pyrimidine DP β-ala ( − 0·22 mmol/h) and β-ami ( − 0·095 mmol/h). Apart from Gua, none of the metabolites demonstrated any time dependence (0·13 ≤ P≤ 0·94).
Hepatic fractional removal
Hepatic fractional removal was estimated as NP% (the proportion of the metabolite removed by the hepatic tissue from the PDV) and TI% (the proportion of the metabolite removed by the hepatic tissue from the PDV and all the other body tissue) of individual purine and pyrimidine metabolites (Table 5). The very small concentration levels of Gua gave rise to very imprecise estimations, and hepatic fractional removal was, therefore, not calculated for this metabolite. The NP% of the purine NS and BS was approximately 100 %: Guo 99 %; Ino 98 %; dGuo 98 %; dIno 104 %; Hyp 117 %. In contrast, the purine DP resulted in a NP% of about 0 %: Uac − 32 % and Alo 0·4 %. The same results were obtained for the TI% of the purine NS and BS (97, 87, 85 and 97 %) and the purine DP (0·2 and 9 %). The only exception was with Hyp, with a TI% of only 20 % compared with a NP% of 117 %. Only in the case of Uac, a TI% quadratic time effect was observed (P= 0·02); the remaining purines demonstrated no effects of time for either NP% or TI% (0·27 ≤ P≤ 0·93).
Hepatic fractional removal as a percentage of net portal-drained viscera (PDV) release (NP%) and as a percentage of total influx (TI%) of purine and pyrimidine metabolites (Mean values with their standard errors)

Lin, linear; Quad, quadratic.
* Significant (P≤ 0·05; F test).
† Marginally significant (P≤ 0·1; F test).
‡ P values for Lin, Quad and cubic time effects.
§ Overall mean and sem (n 4, across the four cows). Only the overall mean and not individual time estimates are given since almost no effects of time were detected.
∥ For a description of the abbreviations of purines and pyrimidines, refer to Table 1.
As with the purines, the NP% of the pyrimidine NS and BS was also roughly 100 %: Cyd 74 %; Urd 191 %; Thd 123 %; dUrd 181 %. The following NP% of the pyrimidine DP occurred: β-ala 16 % and β-ami 173 %. It should be noted that the sem of the pyrimidines when calculating the NP% was large (Table 5). The TI% of the pyrimidine NS and BS was lower than the NP%: Cyd 21 %; Urd 62 %; Thd 49 %; dUrd 33 %. The pyrimidine DP β-ala and β-ami demonstrated the same difference, with a TI% of − 2 and 16 % compared with their NP% of 16 and 173 %. None of the metabolites demonstrated any time dependence (0·29 ≤ P≤ 0·99).
Net splanchnic fluxes
The net splanchnic fluxes of the purines and pyrimidines differed between the metabolites (Table 4). The net splanchnic fluxes of the purine NS were close to zero (Guo 0·0072 mmol/h, Ino 0·0014 mmol/h, dGuo 0·0085 mmol/h and dIno − 0·0069 mmol/h) as was the splanchnic fluxes of the purine BS (Gua − 17 mmol/h and Hyp − 1·1 mmol/h). Only Gua demonstrated a quadratic time effect (P< 0·01). In the case of the purine DP, a net release was observed across the splanchnic tissues (PDV+hepatic tissue): Uac 7·9 mmol/h. In contrast, the net splanchnic flux of the purine DP Alo ( − 6·1 mmol/h) was negative.
The net splanchnic flux of the pyrimidine NS Cyd (0z.ccirf; or 0·49 mmol/h) was positive (net release). In contrast, the net splanchnic fluxes of the pyrimidine NS Urd ( − 2·2 mmol/h), Thd ( − 0·30 mmol/h) and dUrd ( − 2·0 mmol/h) were negative (net uptake). The net splanchnic fluxes of the pyrimidine DP β-ala (0·37 mmol/h) and β-ami ( − 0·032 mmol/h) were low compared with the rest of the pyrimidines and the purine DP Uac and Alo. None of the metabolites demonstrated time dependence (0·55 ≤ P≤ 0·99), except for dUrd (P= 0·06).
Renal variables
Renal variables were estimated for the purine DP Uac and Alo (Table 6). Given that the arterial concentration of Xan (0·011 μmol/l) and Hyp (0·043 μmol/l) was very low and the urinary concentration level was below the detection limits, renal calculations of these two metabolites were not performed. The urinary excretion of Uac and Alo was, respectively, equivalent to 47 and 25 % of renal influx. Urinary excretion of Uac was equivalent to 13 % of the net splanchnic release. Due to the net splanchnic removal of Alo, the urine:splanchnic ratio could not be determined. Renal clearance (volume of blood metabolites cleared by the kidneys per unit of time) was 15 litres/h for Uac and 89 litres/h for Alo. Unfortunately, there was no analytical method available for determining the pyrimidine DP in the urine.
Renal purine variables in lactating dairy cows (Mean values with their standard errors, n 4)
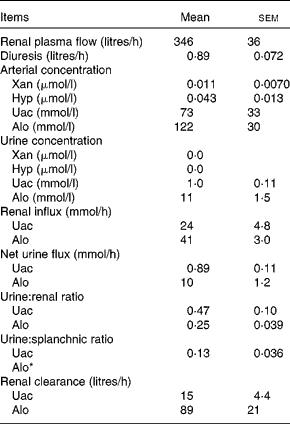
Xan, xanthine; Hyp, hypoxanthine; Uac, uric acid; Alo, allantoin.
* The net splanchnic flux of Alo was negative hence, a urine:splanchnic ratio could not be determined.
Purine and pyrimidine nitrogen metabolism
Microbial NA N was estimated to be 60 g/d entering the small intestine. Microbial purine N and pyrimidine N entering the small intestine was estimated to be 40 and 20 g/d, respectively. The metabolite N fluxes of the purines and pyrimidines mirrored the net PDV, hepatic and splanchnic fluxes as the calculations of N fluxes were simply added the N dimension (Fig. 3). The total purine N PDV flux was 27 g/d equal to 67 % of purine N assumed to be absorbed from the small intestine. In the case of the pyrimidine N, the total 4·7 g/d pyrimidine N PDV flux only corresponded to 24 % of the pyrimidine N assumed to be entering the intestine.
Purine nitrogen and pyrimidine nitrogen intestinal absorption and intermediary metabolism in the portal-drained viscera, hepatic and total splanchnic tissue in lactating dairy cows. Purine-N, purine nitrogen; pyrimidine-N, pyrimidine nitrogen; NS-N, purine or pyrimidine nucleoside nitrogen; BS-N, purine or pyrimidine base nitrogen; Uac-N, uric acid nitrogen; Alo-N, allantoin nitrogen; β-ala-N, β-alanine nitrogen; β-ami-N, β-aminoisobutyric acid nitrogen; N-outlet, nitrogen outlet into β-alanine metabolism( 22 ) and the valine, leucine and isoleucine metabolism, and the citric acid cycle( 23 ); NH3, ammonia release during degradation available for urea recycling( Reference Røjen, Theil and Kristensen 24 ). The purine nitrogen and pyrimidine nitrogen were estimated from the microbial crude protein in the small intestine and the notion that when degraded dietary nitrogen is reused by the microbial population, 75–85 % (80 %) nitrogen goes to microbial protein and 15–25 % (20 %) nitrogen to microbial nucleic acids( Reference Fujihara and Shem 7 Reference McDonald, Edwards and Greenhalgh 8 –, Reference McDonald, Edwards and Greenhalgh 10 ). Values are means with their standard errors (n 4). (A colour version of this figure can be found online at http://www.journals.cambridge.org/bjn).

Discussion
By employing a novel liquid chromatography–electrospray ionisation-MS/MS technique for quantifying purine and pyrimidine metabolites in arterial and hepatic portal, hepatic and gastrosplenic plasma from lactating dairy cows, we quantified net PDV absorption and net hepatic metabolism of the ten main metabolites of purine metabolism (Fig. 1) and the ten main metabolites of pyrimidine metabolism (Fig. 2)( Reference Stentoft, Vestergaard and Løvendahl 30 ). The purines and pyrimidines were found to be absorbed and metabolised differently, and they are discussed as two distinct groups.
Ideally, all of the purine metabolites would have been investigated. However, since the purine NT as well as adenosine and 2′-adenosine were not identified during the method development, and since no standards/SIL were available for xanthosine monophosphate and xanthosine, these were excluded from the analysis. The absence of purine NT agreed with the notion that NT is rapidly degraded in the small intestine before absorption and endogenous NT was probably degraded before and/or in the blood( Reference McDonald, Edwards and Greenhalgh 8 , Reference Smith and McAllan 9 , Reference McAllan 11 , Reference Chen and Gomes 14 , Reference Verbic, Chen and Macleod 20 , Reference Carver and Allan Walker 32 , Reference Berg, Tymoczko and Stryer 33 ). The purine and pyrimidine method has a broad application range at low concentration levels( Reference Stentoft, Vestergaard and Løvendahl 30 ). Unfortunately, the broad range also resulted in a method unable to quantify Alo as precisely as hoped for since the within-day and across-day variations in this concentration range ended up being equal to the splanchnic concentration differences. Consequently, the estimated net fluxes of Alo should be interpreted with caution throughout. Preferably, all of the pyrimidines would have been considered but the pyrimidine NT were, as with the purine NT, not identified in plasma( Reference McDonald, Edwards and Greenhalgh 8 , Reference Smith and McAllan 9 , Reference McAllan 11 , Reference Chen and Gomes 14 , Reference Verbic, Chen and Macleod 20 , Reference Carver and Allan Walker 32 , Reference Berg, Tymoczko and Stryer 33 ). Of the pyrimidines, the intermediates dihydrouracil and dihydrothymine were most probably not present, and, consequently, they were excluded from the analysis due to limits in method capacity( Reference Campbell 34 – Reference Campbell 36 ). In the case of β-ure, no standards/SIL were available.
Splanchnic metabolism of purines
Portal-drained viscera metabolism of purines
The low net PDV release of the purine BS compared with the purine NS suggests a more effective degradation of the BS than of the NS in the enterocytes. The considerable net PDV release of Uac and Alo, compared with the purine NS and BS, is in line with previous observations of high activity of xanthine oxidase (EC 1.17.3.2) in the intestinal mucosa and the blood in cattle( Reference Chen and Gomes 14 , Reference Chen, Orskov and Hovell 19 , Reference Verbic, Chen and Macleod 20 ). The xanthine oxidase enzyme, in cooperation with additional degradation enzymes, such as adenine deaminase (EC 3.5.4.2), guanine deaminase (EC 3.5.4.3), purine-nucleoside phosphorylase (EC 2.4.2.1) and uricase (EC 1.7.3.3), produces Uac and Alo and removes the purine BS and NS (Fig. 1). When such substantial amounts of Uac and Alo were released into the hepatic portal vein, it must be assumed that equimolar amounts of the purine NS and BS have to be degraded either in the intestinal mucosa or before absorption or, alternatively, the purine DP was absorbed directly( Reference McDonald, Edwards and Greenhalgh 10 ). Some of the Uac and Alo may also be of endogenous origin, i.e. the turnover of mucosal enterocytes and other parts of the PDV tissue. Actually, mucosal enterocytes are thought to have limited capacity for de novo purine synthesis; hence, these cells are the only cells thought to be able to salvage exogenous purines( Reference Chen and Gomes 14 ).
With the use of ΔGA, a distinction between the purine flux from the forestomach and the intestine could be made. Presuming that the gastrosplenic plasma flow was about 20 % of hepatic portal plasma flow, a net gastrosplenic flux could be estimated as ΔGA × 0·2 × PDV blood plasma flow( Reference Remond, Chaise and Delval 37 , Reference Storm, Hanigan and Kristensen 38 ). Under these presumptions, Alo was the only purine with a net gastrosplenic flux that contributed to the net PDV flux with more than 1 % (approximately 40 %). As no evidence of ruminal absorption of Alo exists in the literature, further investigations are needed to clarify the gastrosplenic contribution of Alo.
When studying how the postprandial patterns affect the net PDV metabolism, only the net PDV flux of Alo increased over time. A time-dependent absorption profile could have been observed if studying N components such as urea/NH3 with a simple digestion and absorption itinerary( Reference Røjen, Theil and Kristensen 24 ). Purine digestion is more complex and time demanding; first, the feed DNA and RNA has to be broken down in the rumen, second, the microbes have to resynthesise new DNA and RNA, third, the microbes have to pass from the rumen to the small intestine, and finally, a second mode of digestion has to happen before final absorption( Reference Fujihara and Shem 7 ). Thus, postprandial absorption profiles could be hard to detect. Also, the effects of postprandial patterns were most probably easiest to detect for metabolites with considerable levels of net fluxes, such as Alo. The effects would be harder to trace when passing the hepatic tissue because of the endogenous contribution.
Hepatic and splanchnic metabolism and urinary excretion of purines
The observed net hepatic uptake of the purine NS Guo, Ino, dGuo and dIno ( − 0·32 to 1·3 mmol/h) and the purine BS Gua and Hyp ( − 20 and − 21 μmol/h, respectively) supports the anticipation of a further purine absorption/degradation in the hepatic tissue. The considerable amounts of Uac and Alo excreted by dairy cows most probably originate from degradation before or during absorption, further degradation in the hepatic tissue and endogenous losses( Reference Chen and Gomes 14 , Reference Verbic, Chen and Macleod 20 ). The hepatic uptake of the purine NS and BS and the release of Uac (0·63 mmol/h) were in agreement with this. Surprisingly, a final degradation of Uac to Alo does not seem to take place in the hepatic tissue ( − 16 mmol/h). This could suggest that Alo was either degraded in the hepatic tissue or that Alo was excreted via biliary secretion. Both of these hypotheses seem unlikely, even though Alo has been reported in the bile of dogs( Reference Yoshimura 39 ) and rats( Reference Tay, Papp and Timoszyk 40 ), it should be the terminal DP of purine metabolism and large amounts of Alo is excreted in the urine( Reference Boudra, Doreau and Noziere 13 – Reference Tas and Susenbeth 17 , Reference Chen, Orskov and Hovell 19 ).
The hepatic fractional removal of the purine NS and BS was approximately 100 %, indicating that the purine-degrading enzymes in the hepatic tissue were capable of degrading all of the entering purine NS and BS, not only from the PDV but also from the peripheral tissues (Fig. 1). The only exception was with Hyp, where the hepatic fractional removal was only 20 % of total. The efficiency of the hepatic enzymes may reflect the fact that the main part of the purine NS and BS was already degraded before absorption, during absorption and/or in the blood. The hepatic fractional removal of the purine DP Uac and Alo was approximately 0 %, demonstrating that degradation in the hepatic tissue of these products does not take place as expected.
In consequence of the 100 % fractional hepatic removal of the purine NS and BS, the net splanchnic release was essentially zero. When it comes to Uac, an overall splanchnic release (7·9 mmol/h), again, demonstrated the degradation of the purine NS and BS to Uac in the PDV. As a result of the limitations of Alo analysis, a splanchnic uptake of Alo instead of a release, as was expected, was observed.
Purine DP in the urine and milk has been examined extensively as purine DP excretion can be used as an indirect measure of rumen microbial synthesis( Reference Boudra, Doreau and Noziere 13 – Reference Gonda and Lindberg 18 ). The present study showed, in full agreement with previous studies, that large amounts of Uac and Alo (1·0/11 mmol/l), not Hyp and Xan (0 mmol/l), were present in the urine from lactating dairy cows( Reference Gonzalez-Ronquillo, Balcells and Belenguer 15 , Reference Verbic, Chen and Macleod 20 , Reference Bristow, Whitehead and Cockburn 41 , Reference Martín-Orúe, Balcells and Guada 42 ). The estimated renal clearance of Uac (15 litres/h) and Alo (89 litres/h) also corresponded well with previous findings( Reference Giesecke, Ehrentreich and Stangassinger 43 , Reference Valadares, Broderick and Valadares Filho 44 ).
In summary, the purines were absorbed mainly as the DP Uac and Alo and only in minor proportions as NS and BS. The absorbed NS and BS was fully degraded to Uac or Alo in the hepatic tissue where it, alongside with absorbed and endogenously produced DP, was subsequently released into the circulating pool of DP, ready for excretion from the kidneys.
Splanchnic metabolism of pyrimidines
Portal-drained viscera metabolism of pyrimidines
The net PDV release of the pyrimidine NS and BS (0·30–2·8 mmol/h) was higher than that of the purine NS and BS (0·0023–1·3 mmol/h), and the net PDV release of the pyrimidine DP β-ala and β-ami (0·047–0·77 mmol/h) were lower than that of the purine DP (7·0–7·8 mmol/h). From these results, it becomes evident that the mechanisms of purine and pyrimidine metabolism differ in lactating dairy cows in the same way as they differ in humans( Reference Loffler, Fairbanks and Zameitat 21 ). When such large amounts of pyrimidine NS were absorbed and such low levels of pyrimidine DP, it would seem that, in contrast to the purines, a prominent degradation of NS to BS before or during absorption does not occur for the pyrimidines. The low levels of pyrimidine DP could also partly be a result of β-ala and β-ami being incorporated into other intermediate products. Pyrimidine DP are not the end products in the same manner as the purines( Reference Loffler, Fairbanks and Zameitat 21 ); β-ala can become part of β-ala metabolism( 22 ) and β-ami can be part of valine, leucine and isoleucine metabolism and the citric acid cycle( 23 ). In contrast, in parallel to purine metabolism, the pyrimidine BS Cyt, Ura and Thy were rapidly degraded. This was also the case for the pyrimidine DP β-ure, suggesting that β-ure functions more as an easily convertible intermediate than as a terminal DP. It follows that active dihydrouracil dehydrogenase (EC 1.3.1.1) and/or dihydropyrimidine dehydrogenase (EC 1.3.1.2), and β-ureidopropionase enzymes (EC 3.5.1.6) must be present in the intestinal mucosa and/or blood. Some of the released pyrimidines may also be of endogenous origin, and the salvage mechanisms of mucosal enterocytes may also play a role in the absorption pattern observed( Reference Fujihara and Shem 7 , Reference Chen and Gomes 14 ). When estimating net gastrosplenic fluxes of the pyrimidines, only β-ure had a gastrosplenic flux that contributed to the net PDV flux with more than 20 % (i.e. approximately 60 %). Since there is no evidence of ruminal absorption of pyrimidines, the gastrosplenic contributions probably were of endogenous origin.
When studying how the postprandial pattern affects PDV metabolism, only the net PDV flux of dUrd and β-ala increased over time. A time-dependent absorption profile was not expected since, as with the purines, pyrimidines undergo a comprehensive digestion route before absorption takes place. From the present study, we are not able to clarify why an effect of time was detected for these two pyrimidine metabolites and not the remaining pyrimidines.
Hepatic and splanchnic metabolism of pyrimidines
Concerning the net hepatic fluxes of the pyrimidine NS and BS ( − 0·52 to 5·0 mmol/h), extensive hepatic uptake was detected as expected. Consistent with the theory that pyrimidine DP can function as intermediates and, as such, are not terminal end products, pyrimidine DP ( − 0·095 to 0·22 mmol/h) was also removed by the hepatic tissue( Reference Loffler, Fairbanks and Zameitat 21 – 23 ).
The hepatic fractional removal of the pyrimidine NS and BS was approximately 100 %, suggesting that the pyrimidine-degrading enzymes in the hepatic tissue on a net basis were able to degrade all of the pyrimidines at a rate equivalent to the net PDV release. The TI% of the pyrimidine NS and BS was approximately 50 % and, not like the purines, the same as the NP%. This suggests that the enzymes in the hepatic tissue were not capable of removing the entire amount of pyrimidines entering from the PDV and the peripheral tissues, and probably reflects the fact that much larger amounts of pyrimidines enter the hepatic tissue intact as a NS, and not as a BS or a DP. The same pattern of high NP% and lower TI% was observed for the pyrimidine DP, further demonstrating the notion that the pyrimidine DP acts more like intermediates than end products in pyrimidine metabolism.
In accordance with the calculated net PDV and hepatic fluxes, the net splanchnic fluxes of the pyrimidine NS Cyd was positive (0·49 mmol/h) and those of the pyrimidine NS Urd, Thd and dUrd were negative ( − 0·2 to 2·2 mmol/h). The net splanchnic fluxes of the pyrimidine DP β-ala and β-ami (0·37 and − 0·032 mmol/h, respectively) were also, as expected, lower than those of the rest of the pyrimidines and the purine DP. Only the net splanchnic flux of dUrd increased over time (P< 0·06).
In summary, the pyrimidines were absorbed mainly as NS and BS and only in minor proportions as DP. This was the opposite of what was recorded for the purines, where mainly DP was absorbed. In both purine and pyrimidine metabolism, a pronounced degradation of BS took place. The absorbed pyrimidines were partly degraded across the hepatic tissue (some release of Cyd and β-ala), most ending up as intermediates in other parts of N metabolism. The pyrimidines were, as such, not as exposed to excretion via the kidneys. It must then be assumed that the pyrimidines to a greater extent than the purines can be used for N salvage. Although we would have liked to determine the pyrimidine metabolites in the urine, unfortunately, at present, no method was available. Hence, calculations of renal pyrimidine variables could not be performed.
Purine and pyrimidine nitrogen contribution to nitrogen metabolism
When reviewing purine and pyrimidine metabolism with focus on the contributions to N metabolism, it became evident that considerable amounts of purine N in the form of Uac and Alo were lost to in dairy cows (Figs. 1 and 3). Even though 67 % of the purine N was absorbed from the small intestine, the very effective degradation of the purine metabolites before absorption, in the intestinal mucosa, the blood and the hepatic tissue, as a consequence of a high activity of xanthine oxidase in these tissues, as well as the high renal clearance rate of Uac and Alo and the inability of the animal to salvage Uac and Alo in other cells than the mucosal enterocytes, made it almost impossible to reclaim purine N for microbial synthesis of endogenous purines and/or amino acids in dairy cows. Furthermore, 67 % becomes 84 % if taking into account that the digestibility of DNA (75–85 %) and RNA (80–90 %) is about 80 % in the small intestine( Reference McAllan 11 ).
Focusing on the intermediary metabolism of the pyrimidines, very different types of degradation mechanisms seemed to be in function. First, only 24 % of the pyrimidine N was absorbed from the small intestine, 30 % if taking the digestibility of DNA and RNA into account. Thus, much less N was available to the cow from this part of N metabolism. Nevertheless, the pyrimidine metabolites were also, as the purines, degraded before and in the hepatic tissue but, because the end products β-ala and β-ami can function as intermediates in other parts of N metabolism, the pyrimidine N does not seem to be lost to the same extent as for the purines (Figs. 2 and 3). Some β-ala escapes the hepatic tissue and might be excreted in the kidneys; however, in comparison to Uac and Alo, the proportion is expected to be minor. Another advantage of the pyrimidines was that due to the comprehensive degradation process and less effective hepatic degradation, they were available as NS metabolites for N salvage in peripheral tissues.
It should also be noted that not all of the purine N and pyrimidine N was lost in Uac and Alo, and β-ami and β-ala; the released NH3 from purine and pyrimidine degradation could become part of the urea recycling system, and thereby possibly be recycled by the dairy cow for incorporation into valuable amino acids (Fig. 3), though recent research has questioned the true recycling of urea N in ruminants( Reference Røjen, Theil and Kristensen 24 , Reference Kristensen, Storm and Larsen 31 ).
The present study has described the basic intermediary degradation pathways of purine and pyrimidine metabolism and purine and pyrimidine N. Further studies examining the effect of protein level on the postprandial pattern of the net PDV and hepatic metabolism could reveal whether it is possible to manipulate or use this complex system for optimising and making more efficient the utilisation of purine and pyrimidine N in ruminants.
Conclusion
All of the twenty examined NA, the ten key purines and the ten key pyrimidines, were released to different extents to the PDV of lactating dairy cows; the purines mainly as the DP Uac and Alo and only in minor proportions as purine NS and BS, and the pyrimidines mainly as NS and BS and only in minor proportions as the pyrimidine DP β-ala and β-ami. Most of the purine and pyrimidine BS were degraded during absorption, in the blood or the hepatic tissue, resulting in low, yet detectable, concentrations of these metabolites in the blood. A very effective blood and hepatic metabolism consequently degraded all of the purines to Uac and Alo, releasing these non-salvageable N metabolites to the circulating PD for excretion into the kidneys. The metabolic processes of pyrimidine metabolism appeared quite differently from those of purine metabolism. The pyrimidine NS was to a much larger extent absorbed intact and an outlet into other parts of N metabolism through β-ala and β-ami resulted in a more economical N degradation mechanism of these metabolites. The postprandial pattern was not found to have an effect on neither the net PDV nor the net hepatic metabolism of any of the purine and pyrimidine metabolites examined in the present study. Further investigations with varying rumen microbial synthesis are needed to discover the full potential of improving the utilisation of N in ruminants by manipulating purine and pyrimidine metabolism.
Acknowledgements
The authors acknowledge Lis Sidelmann and Birgit H. Løth, Department of Animal Science, Faculty of Science and Technology, Aarhus University (Denmark), for skilful and dedicated technical assistance. The authors thank Peter Løvendahl, Department of Molecular Biology and Genetics, Aarhus University (Denmark), for his competent and constructive assistance during statistical handling.
C. S. holds a PhD Scholarship co-financed by the Faculty of Science and Technology, Aarhus University (Denmark) and a research project supported by the Danish Milk Levy Fond, c/o Food and Agriculture (Aarhus, Denmark). The present study was funded by the Commission of the European Communities (Brussels, Belgium; FP7, KBBE-2007-1), the Directorate for Food, Fisheries and Agri Business (Copenhagen, Denmark; #3304-VMP-05-005), and the Danish Ministry of Food, Agriculture and Fisheries (Copenhagen, Denmark). None of the funders had any role in the design and analysis of the study or in the writing of this article.
The authors' contributions are as follows: C. S., S. K. J., N. B. K. and M. V. were responsible for project development and formulating the research questions; B. A. R. and N. B. K. designed the dairy cow study and carried out the experiment; C. S. developed and performed the purine and pyrimidine analysis; C. S. and M. L. performed the statistical analysis and drafted the manuscript. All authors contributed, commented and approved the final content.
There are no conflicts of interest.


