


1. Introduction
Free-surface jetting, a ubiquitous phenomenon observed in both nature and industries, is often associated with bubbles, including bursting (Spiel Reference Spiel1995; Gañán Calvo Reference Gañán Calvo2017) or pulsating (Chahine Reference Chahine1977; Kang & Cho Reference Kang and Cho2019) ones. This phenomenon holds significant implications, such as its potential to induce natural aerosols (Veron Reference Veron2015; Gañán Calvo Reference Gañán Calvo2017), which exerts a profound influence on coastal ecosystems and global climate patterns (Andreas et al. Reference Andreas, Edson, Monahan, Rouault and Smith1995; Lhuissier & Villermaux Reference Lhuissier and Villermaux2012). Additionally, there are applications in printing techniques such as laser-induced forward transfer (Serra & Piqué Reference Serra and Piqué2019; Saade et al. Reference Saade, Jalaal, Prosperetti and Lohse2021) and needle-free injection (Tagawa et al. Reference Tagawa, Oudalov, Visser, Peters, van der Meer, Sun, Prosperetti and Lohse2012; Kyriazis, Koukouvinis & Gavaises Reference Kyriazis, Koukouvinis and Gavaises2019). The free-surface jet induced by the collapse of a transient cavitation bubble is always accompanied by a downward jet that forms on the upper surface of the bubble (Chahine Reference Chahine1977; Supponen et al. Reference Supponen, Kobel, Obreschkow and Farhat2015). Both of the jets originate from the pressure stagnation points that form between the bubble and the free surface (Blake, Taib & Doherty Reference Blake, Taib and Doherty1987; Kang & Cho Reference Kang and Cho2019). The direction of the two jets is typically deterministic, always aligned along a line and developing in opposite directions.
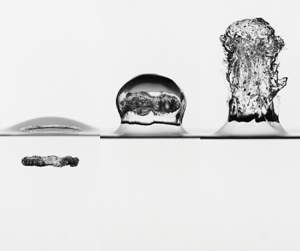
Different from the initially spherical cavitation bubble, the cavitating vortex ring (Chahine & Genoux Reference Chahine and Genoux1983) presents itself as a toroidal cavitation structure capable of maintaining its bubble morphology steadily. This inherent stability in flow pattern paves the way for the emergence of a highly directional free-surface jet. In this paper, we highlight the formation of a vigorous free-surface jet resulting from the collision of a cavitating vortex ring, as illustrated in figure 1. This phenomenon represents a notable departure from previous reports on the vortex–free surface interaction (Yu & Tryggvason Reference Yu and Tryggvason1990; Ohring & Lugt Reference Ohring and Lugt1991; Song, Bernal & Tryggvason Reference Song, Bernal and Tryggvason1992), where the free surface impedes the upward motion of the vortex. The energy of the vortex ring is dispersed and reaches extinction during this process (Lim & Nickels Reference Lim and Nickels1992; Song et al. Reference Song, Bernal and Tryggvason1992; Archer, Thomas & Coleman Reference Archer, Thomas and Coleman2009). The penetration of vortex rings, featuring maximum density ratio 3 between the lower and upper fluids, was explored through numerical simulations in Dahm, Scheil & Tryggvason (Reference Dahm, Scheil and Tryggvason1989). However, experimental studies have been limited by the strength of the vortex rings observed, and penetration of vortex rings typically occurs when the difference of density between the upper and lower fluid layers is relatively small (Olsthoorn & Dalziel Reference Olsthoorn and Dalziel2017; Su, Wilhelmus & Zenit Reference Su, Wilhelmus and Zenit2023). More recently, the penetration behaviours of toroidal air bubbles at the interface of two immiscible liquids with maximum density ratio approximately 1.3 (Moon, Song & Kim Reference Moon, Song and Kim2023) and gas–liquid interface (Bi et al. Reference Bi, Qin, Yu, Li, Liu and Zuo2024) were observed in experiments. An intriguing study by Saini et al. (Reference Saini, Tanne, Arrigoni, Zaleski and Fuster2022) demonstrated the unexpected formation of a robust vortex ring when a laser-induced bubble collapses near a rigid wall. Their findings highlighted a remarkable case where this vortex ring penetrated the water–air interface, generating a free-surface jet. However, the underlying mechanisms driving this phenomenon remain poorly understood.
Interaction between a cavitating vortex ring and the free surface. The time of each frame is indicated in milliseconds. The black bar represents a length of 20 mm. The diameter of the cavitating vortex ring is approximately 27.2 mm, and the translational velocity is approximately 6.56 m s $^{-1}$.

In this study, we generated vortex rings at scales ranging from millimetres to centimetres using in-tube cavitation bubbles. To describe the interaction between inertia, gravity and surface tension, we introduced two dimensionless parameters: the Froude number (following Linden (Reference Linden1973), we define  $Fr\equiv v_t/\sqrt {gR}$, where $v_t$, $R$ and $g$ represent the translational velocity, radius of the vortex ring and gravitational acceleration, respectively) and the Weber number ( $We\equiv \rho v_t^2 R/\sigma$, where $\rho$ and $\sigma$ represent the density and surface tension coefficient of the water). This study focuses on the vortex ring's penetration at the free surface, and the subsequent acceleration of the free-surface jet. We provide a detailed quantitative analysis of the maximum penetration depth and the underlying acceleration mechanisms. Due to the high repeatability and directivity of the resulting jet, this approach holds promise for innovative methods of transporting liquid from a surface into the gas phase.
The structure of this paper is organized as follows. In § 2, we describe the experimental set-up and numerical model used in this study, along with a one-to-one comparison between experimental observations and results from numerical simulations. In § 3, we discuss the interaction patterns between the vortex ring and the free surface, explained through a theoretical model that captures the interplay between inertia, gravity and surface tension. The mechanism of jet formation is further elucidated through numerical simulations. Finally, we summarize the study and present the conclusions in § 4.
2. Methodology
2.1. Experimental set-up
In the experiments, we generated a series of cavitating vortex rings at centimetre (ring radius  $R\sim O$(10 mm)) and millimetre ( $R\sim O$(1 mm)) scales using electrical discharge (Han et al. Reference Han, Zhang, Tan and Li2022) and laser pulse (Reese et al. Reference Reese, Schädel, Reuter and Ohl2022; Li et al. Reference Li, Zhao, Zhang and Han2024) experimental systems. Both systems feature a tube that restricts the expansion of an initially high-pressure bubble and creates a cavitating vortex ring near its nozzle. By adjusting the energy generating the in-tube bubble, we were able to produce vortex rings of varying strength. Take the electrical discharge experiment system, for example. Figure 2(a) shows an elementary diagram of the experimental apparatus, in which the generator of the vortex ring consists of a spark-induced bubble system and a rigid tube. A $400\,\mathrm {\mu }$F capacitor, charged within the range 400–1500 V, serves as the power supply. Two 0.23 mm diameter wires, connected to positive and negative electrodes, pass through holes (approximately 1 mm in diameter) located on the sidewall near the bottom of the tube. These wires overlap and form a cross near the centre of the tube bottom. Upon discharge, the water surrounding the overlapping point undergoes rapid heating, resulting in the initiation and rapid expansion of a vapour bubble. In the free field without confinement, the cavitation bubble expands and collapses nearly spherically. At normal temperatures ( ${\sim }25\,^{\circ }$C) and pressures (atmosphere pressure ${\sim }101\,300$ Pa), the maximum radius of the spark-induced bubble is approximately $6\unicode{x2013}18$ mm, with the discharge voltage in the range $400\unicode{x2013}1500$ V. When the bubble is generated in a tube sealed at one end, its maximum size is slightly reduced compared to that in an open environment due to the constraints imposed by the tube walls. In this set-up, the expanding bubble acts as a piston pushing water out of the tube from the nozzle, which leads to the formation of a vortex ring. When the local pressure in the vortex core dropped below the saturated vapour pressure, a toroidal cavitation bubble was formed. The cavitation of a vortex ring correlates with its intensity, which can be characterized by either the circulation or the translational velocity of the vortex ring. In our experiments, where vortex ring radii range from 5 to 15 mm, cavitation becomes visually detectable when the translational velocity of the vortex ring (moving away from the nozzle) exceeds approximately 1.8 m s $^{-1}$. For vortex rings that do not induce cavitation, we employed the dye-tracing method to track their motion (Maxworthy Reference Maxworthy1977; Saini et al. Reference Saini, Tanne, Arrigoni, Zaleski and Fuster2022). All the experiments were undertaken in a transparent water tank $200\,{\rm mm}\times 200\,{\rm mm}\times 450\,{\rm mm}$ in size, filled with degassed water at room temperature ( ${\sim }25\,^{\circ }$C). The surface tension coefficient $\sigma$ of water is approximately 0.07 N m $^{-1}$. Various-sized tubes (inner diameter $5\unicode{x2013}22$ mm) were fixed at the base of the tank to generate vortex rings with various radii ( $5\unicode{x2013}14$ mm). Equipped with a NIKKOR lens (50 mm, F1.8, Japan), a high-speed camera (Phantom V2012, USA) was positioned in front of the water tank to record the experimental phenomena. The camera operated at $16\,000\unicode{x2013}39\,000$ frames per second (fps) with an exposure time setting at $1\,\mathrm {\mu }$s. For a more detailed observation of the local interaction between the vortex ring and the free surface, the lens was substituted with a telephoto one (LAOWA, 100 mm, F2.8, China). Illumination for all experiments was provided by a 1500 W diffused light source. To generate vortex rings at millimetre scales ( $R \sim O(1\,\text {mm})$), we use a laser pulse to create millimetre-sized cavitation bubbles within smaller tubes (for more details, see Appendix A).
(a) Schematic of electrical discharge experimental set-up. (b) Numerical set-up.

Since the subsequent expansion of the in-tube bubble after the first cycle is significantly weakened (Zhang et al. Reference Zhang, Li, Xu, Pei, Li and Liu2024), and the distance between the nozzle and the free surface exceeds 10 times the radius of the vortex ring in our experiments, we treat the free surface and the vortex-ring-generating device as an independent system (as illustrated in Appendix B), disregarding the influence of the in-tube bubble and other tube-related factors on the vortex ring–free surface interaction.
2.2. Numerical simulation
To explore the mechanisms behind the vortex ring–free surface interaction, we conducted numerical simulations using the finite-volume method in the open source platform OpenFOAM to solve the incompressible Navier–Stokes equations (Weller et al. Reference Weller, Tabor, Jasak and Fureby1998). The computational domain consists of two phases (gas and liquid), which are incompressible and immiscible Newtonian fluids. The interface of the two phases is captured by the volume of fluid method. To reduce the computational effort, an axisymmetric computational domain was constructed, as shown in figure 2(b). The simulations focused on the specific interaction between a vortex ring and a free surface, disregarding the formation process of the vortex ring. Therefore, we initialized the vortex ring with a predefined function of velocity (Cheng, Lou & Luo Reference Cheng, Lou and Luo2010)
 \begin{equation} {\boldsymbol{U}_0} = \frac{\varGamma}{{2{\rm \pi} r}}\,[1 - {\exp({-{{(r/{a})}^2}})}]\,{\boldsymbol{n}}, \end{equation}
where  $\varGamma$ is the circulation of the vortex ring, $r$ is the radial distance between the point of interest and the vortex core centre, $a$ is the vortex core radius, and $\boldsymbol {n}$ is the unit vector of the angular coordinate. To make the initialized flow field more closely resemble the three-dimensional situation, the locally induced velocity field incorporates the contribution of the mirror image vortex of the initial vortex with respect to the axis of symmetry. Under these conditions, the discrepancy in the translational velocity of the vortex ring between our numerical simulations and the theoretical predictions by Saffman (Reference Saffman1970) was found to be approximately 1 %. After introducing the free surface, the initial distance between the vortex ring and the free surface is set to at least three times the radius of the vortex ring $R$, corresponding to the condition where the free surface remains flat in experimental observations. In the region of vortex ring motion and jet formation, the mesh size is approximately $1/120$ of the vortex ring radius, ensuring mesh convergence.
2.3. Comparison of experiment and numerical simulations
In this subsection, we validate our numerical model by directly comparing experimental observations with simulation results, focusing on the free-surface morphology and vortex ring displacement. Figure 3 illustrates the interaction between the vortex ring and the free surface in both the spark-induced bubble experiment and the corresponding simulation. The vortex ring's initial circulation is  $\varGamma = 0.0377\,{\rm m}^2\,{\rm s}^{-1}$, with radius $R = 7.33$ mm and vortex core diameter $a = 1.47$ mm. As the vortex ring rises, it elevates the free surface, as shown in figures 3(a,b), leading to the formation of a free-surface jet. At the same time, the vortex ring's radius gradually decreases. While the overall jet morphology predicted by the numerical simulations aligns well with the experimental observations, some discrepancies appear in the development of jet instability between the axisymmetric simulations and the experiments, particularly in figures 3(e,f). Furthermore, figure 3(g) reveals a marked acceleration in the free-surface jet, with the jet's peak velocity reaching approximately 4.9 times the vortex ring's translational velocity. This acceleration phenomenon will be discussed in greater detail in subsequent sections. On the whole, both the jet morphology (figures 3a–f) and the displacements of the vortex ring and jet tip (figure 3g) demonstrate remarkable consistency between the numerical simulations and our experimental observations, indicating the reliability of our model. To further validate the model at millimetre scales, we compared a laser-induced bubble experiment with the numerical simulations (see Appendix A). In that case, surface tension plays a more important role, suppressing jet instabilities, which leads to an even better agreement between the experiments and simulations.
Comparison of vortex ring–free surface interaction between a spark-induced bubble experiment and the corresponding simulation ( $Fr = 4.66$ and $We = 163$). (a–f) Comparison of jet morphology: in each frame, the left-hand side shows the simulation results, while the right-hand side presents the experimental observations. In the simulation, the flow field is coloured by the magnitude of vorticity, $|\varOmega | = |{\partial {u_r}}/{{\partial z}} - {\partial {u_z}}/{{\partial r}}|$. The time of each frame is indicated in milliseconds. In this and subsequent figures, unless otherwise specified, time $t = 0$ corresponds to the initial moment of the numerical simulation. In this case, at the initial time, the dimensionless distance between the vortex ring and the free surface is 5.5. The dashed line in each frame represents the initial free-surface position. The black bar in (a) indicates a length of 20 mm. (g) The time history of the vertical position of vortex ring and free surface peak. The coordinates are scaled by the initial radius of the vortex ring. Diamond and circle markers represent the vertical positions of the vortex ring and the free surface in the experiment, respectively, while the dashed and solid black lines show their positions in the simulation.

3. Results and discussion
3.1. Three patterns of vortex ring–free surface interaction
Intuitively, the interaction between the vortex ring and free surface is dominated primarily by the combined effect of inertia and gravity, encapsulated by the Froude number  $Fr$. Regarding its definition, two main approaches are commonly employed, based on the circulation (Dahm et al. Reference Dahm, Scheil and Tryggvason1989; Moon et al. Reference Moon, Song and Kim2023) and translational velocity (Linden Reference Linden1973; Wang & Feng Reference Wang and Feng2022) of the vortex ring. These definitions can be conveniently interconverted through the relationship between translational velocity and circulation. In this study, we regard the fluid entrapped by the vortex ring primarily as a whole translating ellipsoid, and consequently define $Fr$ using the translational velocity of the vortex ring.
Figures 4(a)–4(c) illustrate three distinct patterns of interaction between a vortex ring and a free surface, manifesting as a ripple, mound or jet formation under different  $Fr$. At low ${Fr}$, the vortex ring–free surface interaction only causes ripples on the surface. During this process, offspring vortex structures are generated due to baroclinicity (figure 4a). The vortex ring experiences radial expansion, and its vorticity gradually diminishes. As ${Fr}$ increases, the rising vortex ring elevates the free surface into a water mound. In this scenario, the hindrances posed by the water mound and secondary vortex prevent the vortex ring from expanding radially, compelling it to hover within the mound (figure 4b). With further increases in ${Fr}$, the vortex ring penetrates through the free surface, generating a jet that entrains the vortex ring within it (figure 4c). Here, the jet pattern is the scenario where the water carried by the vortex ring can break away from the free surface, or, quantitatively, where the maximum height of the water jet exceeds the diameter of the vortex ring. Figure 4(d) illustrates the temporal evolution of the vortex core position for these three distinct scenarios. A vortex ring with low ${Fr}$ approaching a free surface results in radial expansion, but the vortex core does not reach the height of the free surface. As ${Fr}$ increases, the vortex rings tend to penetrate the free surface, and their radii exhibit a decreasing trend.
The interaction pattern between a vortex ring and a free surface. (a–c) Three distinct interaction patterns obtained from numerical simulation, i.e. the ripple, mound and jet patterns, respectively. The free surface is coloured by the velocity magnitude, and the vortex is coloured by the vorticity. The time of each frame is indicated in milliseconds. (d) The trajectory of the vortex core in (a–c). The grey dashed line represents the initial position of the free surface. The vortex rings in the three cases have the same geometric parameters, while different translational velocities, hence varying Froude numbers, are achieved by adjusting the circulation. The coordinates are non-dimensionalized with the initial radius of the vortex ring.

3.2. Criterion of vortex ring penetration
This subsection aims to establish the criteria for jet formation resulting from vortex ring penetration of the free surface at different length scales. At smaller scales, the influence of surface tension, which plays a critical role, will be assessed using the Weber number. Figure 5 summarizes our simulation and experimental results, along with data from Song et al. (Reference Song, Bernal and Tryggvason1992). As shown, for centimetre-scale vortex rings, the critical Froude number ( ${Fr}$) that distinguishes between the penetration and no-penetration regimes is approximately 1. However, in millimetre-scale experiments, surface tension becomes a significant barrier that vortex rings must overcome to penetrate the free surface. When the Weber number ( ${We}$) is of the order of 1, even with ${Fr}$ values reaching 5 or higher, the vortex ring is still unable to break through the free surface.
The phase diagram of the interaction mode between the vortex ring and free surface according to  ${Fr}$ and ${We}$. The results originally reported by Song et al. (Reference Song, Bernal and Tryggvason1992) have been reorganized in accordance with the criteria outlined in this work. The two dashed lines stand for the contour lines $1/2\,{Fr}^2 (\beta - 6/(\alpha {We})) = 1$ when $\beta = 1$ and 4.8, respectively, and the red solid line represents the contour line when $\beta = 3.2$.

To quantitatively describe the role of gravity and surface tension during this process, we proposed a model based on energy relationships. The translational kinetic energy of the vortex ring is expressed as  $E_{k,t} = 2/3{\rm \pi} \rho v_t^2(\alpha R)^3$, where $\alpha$ is the ratio of the equivalent spherical radius of water transported by the vortex ring to its radius, set at 1.1 (Sullivan et al. Reference Sullivan, Niemela, Hershberger, Bolster and Donnelly2008). Setting $R/a = 5$, the overall kinetic energy possessed by a vortex ring is approximately 4.8 times $E_{k,t}$, i.e. $E_{k,o} = 4.8 E_{k,t}$ (Sullivan et al. Reference Sullivan, Niemela, Hershberger, Bolster and Donnelly2008). Assuming that the water transported by the vortex ring breaks away from the free surface, it possesses gravitational potential energy $E_p = 4/3{\rm \pi} \rho g h_b(\alpha R)^3$, where $h_b$ is the centre of mass of the water bulk carried by the vortex ring. Meanwhile, the increase in surface energy is $E_s = 4{\rm \pi} \sigma (\alpha R)^2$. Once the kinetic energy of the vortex ring surpasses the gravitational potential energy and the surface energy, i.e. $E_k > E_p + E_s$, a jet is formed. By introducing $E_k = \beta E_{k,t}$, we establish that $\beta = 1$ corresponds to the translational kinetic energy, while $\beta = 4.8$ corresponds to the total kinetic energy. Here, $E_{k,o}$ and $E_{k,t}$ serve as the upper and lower bounds for the left-hand side of the inequality, respectively. Thus we arrive at
 \begin{equation} \frac{h_b}R<\frac12\,{Fr}^2\left(\beta-\frac6{\alpha\,{We}}\right).\end{equation}
 It should be noted that due to the deformable nature of fluids, in contrast to the rigid body assumption, the term  $h_b/R$ on the left-hand side of the inequality serves more as an indicator of penetration potential rather than a precise threshold. Ideally, a ratio $h_b/R = 1$ signifies the vortex ring's penetration. Here, we present the theoretical prediction of the penetration threshold obtained from $h_b/R = 1$ in figure 5 with the blue band. The two dashed lines are the contour lines $1/2\,{Fr}^2 (\beta - 6/(\alpha \,{We})) = 1$ when $\beta = 1$ and 4.8, respectively. Setting $\beta = 3.2$, this model aligns closely with our numerical simulations and experimental findings across various scales. The analysis highlights that both gravity and surface tension act as barriers to vortex ring penetration, albeit at different magnitudes depending on the scale. For vortex rings larger than a centimetre in water, gravity poses the primary challenge, necessitating a critical ${Fr}$ of approximately 0.8. In contrast, for vortex rings on the millimetre scale or smaller, surface tension predominantly hinders penetration, with critical We approximately 1.7, below which the vortex ring is unable to penetrate the free-surface.
3.3. Maximum height of the free-surface jet
Let us now delve into the penetration depth of the free surface by the vortex ring. In a classical vortex–interface interaction problem (Linden Reference Linden1973), the interface separates upper and lower fluids, characterized by densities  $\rho _1$ and $\rho _2$, respectively. The equilibrium between the kinetic and potential energies of the interface deformation yields $g\,\Delta \rho \,H \propto \rho _2 U_{in}^2$, where $\Delta \rho = \rho _2 - \rho _1$ is the density difference between the upper and lower fluids, $H$ is the maximum penetration depth (i.e. the maximum height of the deformed interface), and $U_{in}$ is the translational velocity of the vortex ring as it surpasses the initial height of the interface. Assuming that $U_{in}$ is directly proportional to the translational velocity of the vortex ring, and disregarding the density of air ( $\Delta \rho \approx \rho _2$), we arrive at
 \begin{equation} H^* = {\frac{H}{R}} \propto {\frac{v_{t}^2}{g R}} = {Fr}^2.\end{equation}
According to the finding in Linden (Reference Linden1973), where interaction patterns are primarily ripple and mound, the constant of proportionality is approximately 1.72. As illustrated in figure 6, it shows favourable agreement with our numerical simulation at low  ${Fr}$, whose interaction patterns are consistent with Linden (Reference Linden1973), while for vortex rings at high ${Fr}$, more efficient energy conversion between the kinetic and potential energies makes the height of the penetration exceed the theoretical value gradually. In our experiments, the free-surface jet can reach heights up to 500 times the radius of the vortex ring and above.
Maximum penetration height of the free-surface jet as a function of  $Fr^2$ for different scales. The diamond and triangle markers represent the spark-induced bubble ( $Fr = 0.62\unicode{x2013}14.28$) and laser-induced bubble ( $Fr = 6.57\unicode{x2013}14.18$) experiments. The square markers represent the simulation results, where the vortex ring radii are 10 and 0.5 mm, corresponding to the spark-induced bubble and laser-induced bubble experiments.

At smaller scales, the penetration depth falls significantly below the theoretical prediction and deviates from the scaling law  $H/R \propto Fr^2$, as shown in figure 6. To explain the differing trends observed between our laser-induced bubble and spark-induced bubble experiments, we developed a new model for the maximum penetration depth of the vortex ring during its interaction with the free surface, based on energy relationships.
Assuming that the water transported by the vortex ring breaks away from the free surface, it gains gravitational potential energy given by  $E_p = 2/3{\rm \pi} \rho g H(\alpha R)^3$, where $H$ is the maximum height of the jet. If we disregard jet breakup and treat the jet as a cylinder, which is a reasonable assumption for relatively gentle jets, then the increase in surface energy can be approximated as $E_s = 2{\rm \pi} R_j H\sigma$, where $R_j = \sqrt {4(\alpha R)^3/3H}$ is the radius of the cylindrical jet. We assume that when the jet reaches its maximum height, the kinetic energy of the vortex ring is fully converted into gravitational potential energy and surface energy, i.e. $E_k = E_p + E_s$. Thus we arrive at
 \begin{equation} H^*+\sqrt{\frac{12}{\alpha^3\,Bo^2}}\,H^{*1/2}=4.8\,Fr^2,\end{equation}
where  $Bo = \rho g R^2/\sigma$. Specifically, with $R = 0.5$ mm, consistent with our numerical simulation, we determined that $Bo = 0.035$. It is worth noting that the prefactor of the $Fr^2$ term reflects the full conversion of the vortex ring's kinetic energy into the jet's gravitational potential energy. Consequently, this value is significantly higher than 1.72, as this coefficient corresponds to cases where the vortex ring's energy does not fully convert into the jet's gravitational potential energy, resulting in patterns of ripples and mounds. This relationship is illustrated by the blue line in figure 6, showing excellent agreement with both the simulation and experimental results. This concurrence implies that at identical $Fr$ numbers, the variations in the dimensionless jet height across different scales can be ascribed to the effects of surface tension. The discrepancy between theoretical predictions and both simulations and experiments may arise from inaccuracies in predicting surface energy, due to the simplified jet morphology assumed in the theoretical model. Additionally, when the jet reaches its maximum height, internal flow may not be entirely stagnant, potentially introducing some deviations.
3.4. Mechanism of vortex ring acceleration
Acceleration is a distinct characteristic exhibited by vortex rings at high  ${Fr}$ during their interaction with the free surface. A numerical model was employed to explore the underlying mechanism behind this acceleration phenomenon. Figures 7(a) and 7(b) exhibit the resulting contours of vorticity magnitude and pressure obtained from the numerical simulation. Moreover, to offer a more comprehensive perspective on the acceleration process, we present the time–space map of the dynamic pressure ( $P_d$) along the centreline in figure 7(c).
The evolution of the vorticity and pressure fields during the interaction between a vortex ring and a free surface ( $Fr = 4.66$, $We = 163$). (a,b) The vorticity and pressure fields at $t = 10$ ms and $t = 30$ ms, respectively, with the free surface indicated by green lines. (c) A time–space map of the dynamic pressure along the centreline throughout the interaction, where the dashed and solid lines represent the vertical positions of the vortex ring and the free surface, respectively. (d) The dynamic pressure along the centreline at various time points, with the dashed line indicating the initial position of the free surface, and the arrow indicating the translational direction of the vortex ring.

When a vortex ring translates through the bulk liquid, it induces high-pressure zones at its front and rear, known as the leading pressure maximum (LPM) and trailing pressure maximum (TPM) (Lawson & Dawson Reference Lawson and Dawson2013; Schlueter-Kuck & Dabiri Reference Schlueter-Kuck and Dabiri2016), respectively. These high-pressure zones are arranged symmetrically around the vortex ring, facilitating a nearly uniform motion for the ring (figures 7a,c). To estimate the magnitude of the LPM and TPM, we can treat the vortex ring and the fluid trapped within it as a rigid sphere translating at a stable velocity in a free field, resembling a Hill sphere vortex. This approximation is based on the flow dynamics past a sphere, where  $P_d \propto v_t^2$. However, when a vortex ring at high ${Fr}$ encounters the free surface, the high-pressure region in front of the vortex ring diminishes due to its proximity to the atmosphere, which exerts a lower pressure compared to the zone behind the ring (figure 7b). Consequently, a downward pressure gradient is created, accelerating the vortex ring. This acceleration, in turn, amplifies the magnitude of the TPM, as illustrated in figure 7(d), further enhancing the acceleration. In this specific case, the TPM rises quickly from 0.75 kPa to approximately 2.37 kPa before gradually decreasing. This positive feedback loop ultimately gives rise to the formation of an accelerated jet.
3.5. Velocity ratio between the free-surface jet and vortex ring
In figure 8(a), we present the displacement data of the vortex ring and the tip of the free-surface jet collected from three different experiments. Intuitively, the results suggest a correlation between the translational velocity of the vortex ring beneath the free surface and the maximum velocity of the jet tip. More comprehensively, we conducted over one hundred spark-induced bubble experiments using tubes with different diameters ( $5\unicode{x2013}20\,{\rm mm}$) and varying discharge voltages ( $400\unicode{x2013}1500\ {\rm V}$), and plot the data with blue circles in figure 8(b). It shows that the ratio between the maximum velocity of the jet and the translational velocity of the vortex ring remains relatively stable, in the range $2.9\unicode{x2013}4.5$.
Acceleration ratio of the free-surface jet driven by the vortex ring. (a) Displacement data of the vortex ring ( ${\blacktriangledown }$) and the peak of the free surface ( ${\bullet }$) at different discharge voltages under tube diameter 17 mm. (b) Translational velocity of vortex rings underwater, and the maximum peak velocity of the free surface. The dashed blue line stands for the results after correcting for deviations between the theoretical model and the actual kinetic energy of the jet, without taking into account the influence of surface tension.

We will now describe quantitatively the velocity ratio between the free-surface jet and the vortex ring based on energy relationships. First, we documented the vertical velocity distribution along the jet's axis and surface at the instant when the jet attains its maximum velocity, as obtained from our numerical simulation, illustrated in figure 9(b). The results show that the velocity near the base of the jet is nearly zero, and the velocity distribution follows a quadratic relationship with the jet height, expressed as  $v = v_m h^2/h_m^2$, where $h_m$ is the height of the jet when its peak reaches the maximum velocity $v_m$. Based on mass conservation, which requires that $vr^2$ remains constant across different horizontal cross-sections of the jet, we derived a relationship between the jet's radius and its vertical position as $r = r_m h_m/h$, where $r_m$ is the radius at the jet's peak. To prevent an infinitely large jet volume resulting from this profile, a correction was applied to the jet radius, expressed as $r = r_m h_m / (h+\eta h_m)$, as shown in figure 9(a). Here, we assume that the radius of the jet's base cross-section equals the radius of the vortex ring, implying that $\eta = r_m/R$. With this adjustment, the volume of the jet can be calculated as
 \begin{equation} V_{jet} = \int_0^{h_m}{\rm \pi}\,\frac{r_m^2h_m^2}{(h+\eta h_m)^2}\,{\rm d} h = \frac{{\rm \pi} r_m^2 h_m}{\eta(1+\eta)}, \end{equation}
and the kinetic energy of the jet can be expressed as
 \begin{equation} E_{k,jet} = \int_0^{h_m}\frac{{\rm \pi}\rho v_m^2r_m^2}{2h_m^2}\, \frac{h^4}{(h+\eta h_m)^2}\,{\rm d} h = \frac{{\rm \pi}\rho v_m^2r_m^2h_m}{2} \int_0^{1}\frac{h^{*4}}{(h^*+\eta)^2}\,{\rm d} h^*, \end{equation}
with  $h^* = h/h_m$. Equating (3.4) to the volume of the jet obtained from the numerical simulation and experimental data, we approximate $\eta$ to be approximately 0.33 here.
Validation and comparison of the models at the length scale of the spark-induced bubble experiment ( $R = 7.33$ mm). (a) Comparison of jet profiles in the numerical simulation and present model. (b) Velocity distribution along the interface and centreline of the jet compared with that obtained using both the linear and present models. (c) Kinetic energy per unit length $e_k$ along the height of the jet. The light and dark red lines represent the kinetic distribution calculated based on the interface and centreline velocity presented in (b). The dashed line represents the result obtained from a linear velocity distribution and cylindrical jet profile model, and the solid black line corresponds to the present model.

The kinetic energy of a vortex ring can be expressed as (Sullivan et al. Reference Sullivan, Niemela, Hershberger, Bolster and Donnelly2008)
 \begin{equation} E_{k,vortex} = \frac{1}{2}\,\rho {{{\varGamma }}^2}R\left( {\ln \frac{{8R}}{a} - 2.04} \right),\end{equation}
where  $\varGamma$ is the vortex ring circulation. Substituting the translational velocity relation of a vortex ring (Sullivan et al. Reference Sullivan, Niemela, Hershberger, Bolster and Donnelly2008) $v_{t} = ({\ln (8R/a) - 0.558})\varGamma /(4{{\rm \pi} }R)$ into (3.6) leads to
 \begin{equation} E_{k,vortex} = 8\rho {\left(\frac{{{\rm \pi}v_t}}{{{{\varLambda - 0.558}}}}\right)^2}{R^3}(\varLambda - 2.04), \end{equation}
where  $\varLambda = \ln (8R/a)$. Assuming that the maximum velocity of the free-surface jet marks when the energy of the vortex ring bubble is entirely converted into the kinetic energy of the free-surface jet, and the dominant velocity of the jet is vertically upwards, we equate the kinetic energy of the jet $E_{k, jet}$ to that of the vortex $E_{k, vortex}$, thus arriving at
 \begin{equation} \frac{{{v_{m}}}}{{{v_{t}}}} = 4\sqrt {\frac{{{{{\rm \pi} }}{R^3}(\varLambda - 2.04)}}{{{{\lambda_1 (\varLambda - 0.558)}^2}{{r_m}^2}h_m}}},\end{equation}
where  $\lambda _1 = \int _0^{1}({h^{*4}}/{(h^*+\eta )^2})\,{\rm d} h^* \approx 0.16$.
Considering the volume of the jet from (3.4), (3.8) can be reformulated as
 \begin{equation} \frac{{{v_{m}}}}{{{v_{t}}}} = 4\sqrt {\frac{{{{{{\rm \pi} }}^2}(\varLambda - 2.04)}}{{{{\lambda_1 (\varLambda - 0.558)}^2\eta(1+\eta)}}}\left(\frac{{{R^3}}}{V_{jet}}\right)}.\end{equation}
The term  $R^3/V_{jet}$ in (3.9) can be handled through the relationship between the volume of the water entrapped by the vortex ring and the jet volume. The volume of entrapped water, which is spheroid in shape, can be calculated as ${V_{vortex}} = \frac {4}{3}{{\rm \pi} }R_{vortex}^3\gamma$, where $R_{vortex}$ is the length of the long axis of the water entrapped by a vortex ring, and $\gamma$ represents the ratio of semi-minor to semi-major axes. Therefore, the following relation is found (Sullivan et al. Reference Sullivan, Niemela, Hershberger, Bolster and Donnelly2008):
 \begin{equation} \frac{R}{R_{vortex}} = {\left[{\gamma (1 + k)\, \frac{\varLambda -0.558}{{3{\rm \pi}}}}\right]^{1/3}},\end{equation}
where we define  $k$ as the coefficient of added mass, which is approximately 0.67 (§ 80 in Loitsyanskii Reference Loitsyanskii1966). From our numerical simulation across $Fr = 4\sim 14$, we found that the volume of the jet is larger than the volume of the vortex ring, with the relation $V_{jet} = \lambda _2 V_{vortex}$, for $\lambda _2 \approx 1.6$. Finally, (3.9) takes the form
 \begin{equation} \frac{{{v_{m}}}}{{{v_{t}}}} = 2\sqrt {\frac{{(\varLambda - 2.04) (1 + k)}}{{\lambda_1\lambda_2\eta(1+\eta)(\varLambda - 0.558)}}}.\end{equation}
Equation (3.11) reveals a weak correlation between the velocity ratio and the slenderness ratio ( $\epsilon = R/a$) of the vortex tube: specifically, the ratio increases by approximately 7 $\%$ when $\epsilon$ doubles from 5 to 10. Setting $\epsilon = 5$, we achieve a ratio 5.6, which exhibits a clear deviation from our experimental results. This could be explained mainly by the fact that this model underestimated the kinetic energy of the jet by $20\,\%\unicode{x2013}30\,\%$, as illustrated in figure 9, which inflates the predicted velocity ratio beyond its actual value. Specifically, in this case, this model predicts kinetic energy approximately $5.1\times 10^{-3}$ J for the jet, while the kinetic energy in the numerical simulation is approximately $6.7\times 10^{-3}$ J, resulting in an error approximately 24 %. Taking this discrepancy into consideration, the theoretically predicted velocity ratio drops to 4.9, as shown by the blue dashed line in figure 8(b). Although surface tension has a minimal effect on the free-surface jet at the centimetre scale under intense interaction conditions, an increase in surface energy still influences energy distribution when the vortex ring is mild (with translational velocity $v_t < 1$ m s $^{-1}$). Considering the increase of surface energy, the energy relationship then becomes $E_{k,vortex} = E_{k, jet} + E_{s, jet}$. In the context of a jet profile described by a quadratic function, the increase in surface energy at its maximum velocity can be estimated as
 \begin{equation} E_{s,jet} = \int_0^{h_{m}}2{\rm \pi} r\sigma \,{\rm d} h=\int_0^{h_{m}}2{\rm \pi}\, \frac{r_{m}h_m}{h+\eta h_m}\,\sigma \,{\rm d} h=2{\rm \pi} R h_{m}\sigma\eta \ln{\frac{1+\eta}{\eta}}, \end{equation}
which leads (3.11) to become
 \begin{equation} v_{m}=\sqrt{\lambda^{2}v_{t}^{2}-\frac{4\sigma}{\lambda_{1}\eta\rho R}\ln\frac{1+\eta}{\eta}}. \end{equation}
Here,  $\lambda$ represents the velocity ratio when surface tension is disregarded, with value 4.9 as discussed above, and $R = 5$ mm. We plot the result of (3.13) in figure 8(b) with a blue solid line, showing improved alignment with experimental findings at lower velocities ( $v_t<1$ m s $^{-1}$).
Despite these considerations, this model still shows considerable discrepancies from experimental data when the vortex ring's translational velocity is high. We deem that this can be attributed mainly to the following reasons. First, in experiments, the emergence of instabilities in three-dimensional scenarios poses a challenge to the jet in achieving the high velocity ratios predicted theoretically. In situations with high  $Fr$, the jet is more violent and intense, leading to pronounced fragmentation. This not only disrupts the acceleration mechanism driven by the TPM, but also induces radial velocity components that hinder the axial acceleration of the jet. In milder jet conditions (as depicted in figure 3), the velocity ratio can reach approximately 4.5 in experiments and 4.8 in numerical simulations, demonstrating reasonable alignment with theoretical prediction despite minor deviations. Additionally, this model overlooks the increase in gravitational potential energy during jet formation, which could introduce minor inaccuracies if the Froude number is less than 1.
At smaller spatial scales, the jet will exhibit a more stable morphology. In such scenarios, it can be expected that a better alignment between the theoretical framework and experimental results will be achieved. Notably, in our laser-induced bubble experiment, the vortex ring typically spends over 3 ms below the free surface, causing the vortex core radius to exceed  $a\sim \sqrt {4\nu t}\approx 0.126\,{\rm mm}$ (Saffman Reference Saffman1970; Sullivan et al. Reference Sullivan, Niemela, Hershberger, Bolster and Donnelly2008; Das, Bansal & Manghnani Reference Das, Bansal and Manghnani2017). Consequently, the slenderness ratio $\epsilon = R/a$ drops to $4$ or below. For example, in the experiment illustrated in figure 9, $\epsilon$ is approximately 3. This will significantly modify the velocity distribution within the jet, as depicted in figure 10. To account for this, we modelled the jet as a cylinder with a radius of $r_j$, obtaining a kinetic energy distribution that closely matched the results from numerical simulations, as shown in figure 10. Specifically, the model predicts kinetic energy approximately $6.3\times 10^{-6}$ J for the jet, while the kinetic energy in the numerical simulation is approximately $5.7\times 10^{-6}$ J, resulting in an error approximately 10 %. Therefore, the total kinetic energy of the jet can be expressed as
 \begin{equation} E_{k,jet} = \int_0^{h_m}\frac{{\rm \pi}\rho v_m^2r_j^2h^4}{2h_m^4}\,{\rm d} h = \frac{{\rm \pi}\rho v_m^2r_j^2h_m}{10}. \end{equation}
In this context, the velocity ratio can be expressed in the form
 \begin{equation} \frac{{{v_{m}}}}{{{v_{t}}}} = 2\sqrt {\frac{{5(\varLambda - 2.04)(1 + k)}}{{\lambda_2(\varLambda - 0.558)}}}. \end{equation}
Setting  $\lambda _2 = 1.6$, we find $v_m/v_t\approx 3.1$. Considering the influence of surface tension on millimetre-scale vortex rings, as the surface energy increases with $E_{s, jet} = 2{\rm \pi} h_m r_j \sigma$, (3.15) transforms into the form
 \begin{equation} v_m=\sqrt{\lambda^2v_t^2-\frac{20\sigma}{r_j\rho}},\end{equation}
where  $\lambda$ represents the right-hand side of (3.15), equal to 3.1 here. The radius of the jet is approximately 0.3 mm. As shown in figure 8, the theoretical prediction agrees well with the numerical simulation and experimental data. It turns out that our theoretical model is more suitable for describing the laser-induced bubble experiments, where the instability of the jet is largely suppressed by surface tension. This model not only suggests that the process of jet acceleration involves the conversion of kinetic energy from the vortex ring to the jet, but also underscores the significance of the surface energy of the jet during this process, particularly in scenarios involving small-scale vortex rings.
Validation and comparison of the models at space scale of the laser-induced bubble experiment ( $R = 0.54$ mm). (a) Comparison of jet profiles in the numerical simulation and present model. (b) Velocity distribution along the interface and centreline of the jet compared with that obtained using both the linear and present models. (c) Kinetic energy per unit length $e_k$ along the height of the jet. The light and dark red lines represent the kinetic distribution calculated based on the interface and centreline velocity presented in (b). The dashed line represents the result obtained from linear velocity distribution and cylindrical jet profile model, and the solid black line corresponds to the present model.

4. Summary and conclusions
This study investigated the interaction between a cavitating vortex ring and a free surface through experimental, numerical and theoretical approaches. Our findings reveal a unique interaction pattern: when the upward translating vortex ring approaches the free surface, it contracts in radius and undergoes significant vertical acceleration due to the asymmetric pressure field above and below the ring. This results in a highly energetic interface jet capable of propelling water to heights hundreds of times the vortex ring radius. The roles of inertia, gravity and surface tension in shaping the vortex ring–free surface interaction were examined thoroughly. The main conclusions are drawn as follows.
The interaction between a vortex ring and a free surface is highly dependent on the Froude number ( $Fr$) and Weber number ( $We$), and it can be categorized into three distinct patterns based on the evolution of free-surface morphology: ripple, mound and jet. Successful penetration of the free surface, resulting in the formation of an interface jet, requires overcoming the combined effects of gravity and surface tension, with the relative influence of each varying across different length scales. We established criteria for vortex ring penetration through the free surface as ${Fr}^2\, (1.6-3/(\alpha \,{We})) > 1$, where $\alpha$ is the ratio of the equivalent spherical radius of water transported by the vortex ring to its radius, equal to 1.1 in this work.
In experiments at the centimetre scale, surface tension has a minor influence. Here, the maximum height of the free-surface jet, resulting from the impact of vortex rings at lower  $Fr$ ( ${\lesssim }1$), follows the scaling law $H^* \propto Fr^2$. As $Fr$ increases, however, the maximum jet height diverges from this relationship, shifting towards higher values. For millimetre-scale experiments, surface tension plays a significant role, causing a noticeable reduction in maximum jet height at the same $Fr$. This behaviour can be modelled by the equation $H^* + \sqrt {{12}/(\alpha ^3 Bo^2)}\,H^{*1/2} = 4.8\,Fr^2$ where $Bo = \rho g R^2/\sigma$ is the Bond number.
Once a centimetre-scale vortex ring penetrates the free surface, we observed that the ratio of the maximum jet velocity to the translational velocity of the vortex ring remains relatively stable. To uncover the mechanism behind this, we developed a theoretical model to predict this velocity ratio based on energy relationships. Our model slightly overestimates the velocity ratio, likely due to the onset of instabilities in three-dimensional experimental conditions. For laser-induced vortex rings at the millimetre scale, the influence of surface tension not only reduces this velocity ratio but also suppresses instability formation at the jet surface, resulting in improved alignment between our theoretical predictions and experimental observations. Future studies utilizing laser-induced bubble experiments under depressurized conditions are anticipated to effectively bridge the gap between the large Weber number regime and the regimes where surface tension plays a significant role in jet dynamics.
We anticipate that these findings will shed new light on vortex ring dynamics and open up possibilities for efficient energy and material transport within liquid environments and from liquids into a gas phase, which has implications for various applications, including fluid mixing, bioprinting and aerosol generation.
Funding
This work is supported by the National Natural Science Foundation of China (grant numbers 51925904, 12372239, 12072087 and 12388101), National Key Laboratory of Ship Structural Safety (Naklas2024ZZ004-J), and the Heilongjiang Provincial Natural Science Foundation of China (no. YQ2022E017).
Declaration of interests
The authors report no conflict of interest.
Appendix A. Laser-induced bubble experiment
Figure 11(a) shows the experimental set-up used for the laser-induced bubble experiment. A millimetre-scale cavitation bubble was generated by focusing a frequency-doubled Nd:YAG laser (Nimma-900, with pulse duration 8 ns, wavelength 532 nm, and pulse energy ranging from 45 to 70 mJ) into deionized water (DI water, Huake, China) at room temperature (approximately  $25\,^{\circ }$C). To minimize refraction effects and enhance laser focusing, a 0.3 mm thick sapphire glass window was embedded in a 33 mm diameter aperture on the bottom wall of a $100\,{\rm mm}\times 100\,{\rm mm}\times 100\,{\rm mm}$ tank. A transparent acrylic tube, of inner diameter 1 mm and wall thickness 0.5 mm, was mounted on a holder. The pulsed laser beam was focused through the sapphire glass window and transparent holder using a microscope objective lens (M Plan Apo L 10 $\times$, numerical aperture ${\rm NA} = 0.28$), resulting in a concentrated laser point within the tube. At the focal point, the energy levels exceeded the liquid's breakdown threshold, initiating a transient process known as avalanche ionization. Consequently, this resulted in the generation of a shock wave and the formation of a high-pressure plasma cavity. As the shock wave propagated, a cluster of cavitation bubbles formed inside the tube. Along with the laser-induced bubble, these bubbles collectively expelled water from the tube, generating a vortex ring at the nozzle. For consistent background illumination, we used a continuous 300 W LED light source (LINGXU, China), diffused through matte glass to ensure even lighting. A high-speed camera (Phantom V2012, USA), fitted with a macro lens (LAOWA, 100 mm, F2.8, China), was synchronized with the laser to capture the transient evolution of the laser bubble and the resulting jet formation. The high-speed camera captured the process at resolution $256\times 800$ pixels, recording at 50 000 fps with exposure time $20\,\mathrm {\mu }$s.
Experimental set-up for the laser-induced bubble and a typical observation. (a) Schematic of the laser bubble experimental set-up. (b) Millimetre-scale formation of the free-surface jet. The black bar in the first frame indicates length 5 mm.

Figure 11(b) shows key moments from the laser bubble experiment and the subsequent development of the free-surface jet. After the laser was triggered, a shock wave and cavitation bubble were generated. The combined action of the laser-induced bubble and secondary cavitation bubbles expelled water through the tube nozzle. Flow separation near the nozzle resulted in the formation of a vortex ring, while the low pressure at the vortex core caused cavitation. The first cycle of the laser-induced bubble lasted approximately 0.48 ms. After approximately ten bubble cycles, the vortex ring reached the free surface, initiating the formation of a jet. Surface tension contributed to a more regular shape and a smoother surface for the jet, distinguishing it from the free-surface jets generated by spark-induced bubbles.
As discussed in § 2.3, we also compared the laser-induced bubble experiment with a numerical simulation at the millimetre scale. Here, the vortex ring's initial circulation is  $\varGamma = 0.00328\,{\rm m}^2\,{\rm s}^{-1}$, with radius $R \approx 0.54$ mm and vortex core diameter $a \approx 0.18$ mm. In the laser bubble experiment, surface tension helps to suppress the development of instabilities on the jet surface, leading to improved agreement between the numerical simulation and experimental results, as shown in figure 12. In the experiment, the velocity ratio $v_m/v_t$ is approximately 3.0, which closely matches the numerical simulation value of approximately 3.1. This further validates the numerical model, as well as the velocity and energy distributions within the jet derived in the theoretical model.
Comparison of millimetre-scale vortex ring–free surface interaction between experiment and simulation ( $Fr = 25.65$, $We = 26$). (a–f) Jet morphology comparison. The left-hand half of each frame shows the simulation results, colour-coded by vorticity magnitude, while the right-hand half shows the corresponding experimental results. The time for each frame is given in milliseconds. The black bar in (a) represents length 1 mm. (g) Time–space map of dynamic pressure along the centreline during the vortex ring–free surface interaction. The vertical displacement is scaled by the initial radius of the vortex ring. Diamond and circle markers indicate the vertical positions of the vortex ring and free surface in the experiment, respectively, while dashed and solid black lines represent their positions in the simulation.

Appendix B. Effect of nozzle-to-free-surface distance
We conducted a series of experiments controlling the distance between the nozzle and the free surface. During the interaction between the in-tube bubble system and the free surface, we identified three distinct jet regimes: single jet, jointed jet and umbrella-shaped jet. These regimes are characterized by the dimensionless distance parameter ( $\delta = d/R_n$, where $d$ is the distance between the nozzle and the free surface, and $R_n$ is the nozzle radius), as illustrated in figure 13.
Three jet regimes at different distances between the tube nozzle and the free surface. The black bars represent length 10 mm, with the inner radius of the tube nozzle being 10 mm. The time in each frame is indicated in milliseconds. Time  $t = 0$ represents the moment when the in-tube bubble is generated. (a) Single jet regime, $\delta = 7.5$. (b) Jointed jet regime, $\delta = 1.34$. (c) Umbrella jet regime, $\delta = 0$.

When the nozzle is far from the free surface, the interaction is characterized by a solitary jet, driven by a single isolated primary vortex ring (figure 13a). As the nozzle moves closer to the free surface, secondary vortices trailing behind the primary vortex begin to interact with the surface, leading to the formation of a joint-like structure along the jet (figure 13b). When the nozzle is level with the free surface ( $\delta = 0$), the in-tube bubble no longer generates vortex rings, and the free-surface jet is driven directly by the expansion of the in-tube bubbles, taking on an umbrella shape. In the main part of this study, we focus on cases where the nozzle-to-free-surface distance exceeds 10 times the nozzle radius. Under these conditions, we can treat the free surface and vortex ring generator as independent systems, ignoring the influence of the in-tube bubble and secondary vortices on the vortex ring–free surface interaction.
Appendix C. Effect of nozzle thickness on the vortex ring features
We investigated the influence of tube wall thickness on vortex ring features through a series of experiments. To quantify this effect, we focused on two key parameters that capture the kinetic properties of vortex rings: the radius ( $R$) and translational velocity ( $v_t$). Adjusting the length of the in-tube bubble $L$, we obtained vortex rings with varying radii and translational velocities. As illustrated in figure 14, vortex rings produced by tubes with varying wall thicknesses exhibit similar radii and velocities. This indicates that the vortex ring properties are largely insensitive to changes in tube wall thickness, at least within the range examined in this study.
Characteristics of vortex rings generated by tubes with varying wall thickness. (a) Variation of vortex ring radius as a function of in-tube bubble length  $L$. (b) Variation of vortex ring translational velocity as a function of in-tube bubble length $L$.
$L$.


 Open access