


1. Introduction
This study investigates the phonetic interaction between lexical tones and glottalization in San Sebastián del Monte Mixtec (henceforth SSM, ISO: 639 code mks), also known as Tò’on Ndà’vi. SSM is a language of the Mixtecan family, Otomanguean stock (Rensch Reference Rensch1976, Cortés et al. Reference Cortés, Mantenuto and Steffman2023), spoken in the Mixteca Baja region of Oaxaca (Josserand Reference Josserand1983:107). A phonetic description of SSM was written by Cortés et al. (Reference Cortés, Mantenuto and Steffman2023). In that study, the authors provided some qualitative assessment of glottalization in so-called ‘rearticulated’ vowels (described below). However, that study, and work on glottal phenomena in other Mixtec varieties has focused on just a few tones (e.g., Gerfen & Baker Reference Gerfen and Baker2005), leaving open the question of how glottalization phenomena are manifest across the tonal inventory. In this study we build on that preceding literature by testing a near-exhaustive combination of tone and re-articulation in the language. We further complement past research in using several time-series modeling approaches (Generalized Additive Mixed Models, and Functional Principle Components Analysis) to provide a quantified and dynamic characterization of the data, elicited from 14 speakers of SSM.
1.1 Background on glottalization and tone
The precise manner in which contrastive glottalization is realized in speech has been the subject of much phonetics study (see Blankenship Reference Blankenship2002, Gerfen & Baker Reference Gerfen and Baker2005, Garellek & Keating Reference Garellek and Keating2011, DiCanio Reference DiCanio2012, Esposito & Khan Reference Esposito and Khan2020, Garellek Reference Garellek2022, and others). This research has shown that contrastive glottalization is associated with multiple phonetic features (i.e., duration, f0, spectral tilt) and that languages vary in their exact realization of these phonetic attributes.
Garellek et al. (Reference Garellek, Chai, Huang and Van Doren2021) investigated the acoustics of various glottal phenomena across a number of the world’s languages using speech data collected from Illustrations of the IPA. Their analysis found that phasing and degree of glottal constriction in glottalized vowels varied, based on both the type of glottal gesture and its position within the word. Garellek et al. (Reference Garellek, Chai, Huang and Van Doren2021) found that checked and rearticulated vowels, unlike creaky vowels, were characterized by dynamic voice quality over the course of the vowel. That is, voice quality was not constant over the vowel, but changed over time. Additionally, rearticulated vowels were found to have an earlier phasing of the glottal gesture as compared to checked vowels. Both rearticulated and checked vowels had a lower rise in amplitude following the glottal gesture when in word-final position as compared to word-medial position.
During non-modal phonation, f0 may lower or become highly irregular (Silverman Reference Silverman1997a, Silverman Reference Silverman1997b, Gerfen & Baker Reference Gerfen and Baker2005, Garellek & Keating Reference Garellek and Keating2011, DiCanio Reference DiCanio2012). This leads to an interesting problem for languages in which contrastive voice quality and lexical tone can co-occur on the same vowel. Such languages are labeled ‘laryngeally complex’ in Silverman (Reference Silverman1997a). Laryngeally complex languages, Silverman argues, are able to maintain tone contrasts by sequencing non-modal phonation with respect to modal phonation such that tone information can occur on the modal portions of the vowel. In addition, tonal contrasts can be enhanced with changes in voice quality (Esposito & Khan Reference Esposito and Khan2020, Garellek Reference Garellek2022). In languages with dense tonal systems, cuing lexical tone category with voice quality differences may aid the listener in distinguishing lexical tones (see Garellek Reference Garellek2022 for further discussion). For instance, Black Miao has a dense tonal system with five level tones; both production and perception studies have shown that voice quality is an important cue of tone in the language (Kuang Reference Kuang2013a, Kuang Reference Kuang2013b, Kuang Reference Kuang2017). In addition, Andruski & Ratliff (Reference Andruski and Ratliff2000) and Huang (Reference Huang2020) present evidence for voice quality as a tonal correlate and cue in Green Mong and Mandarin Chinese, respectively. Andruski & Ratliff (Reference Andruski and Ratliff2000) showed, via a production study of six speakers, that three of the seven contrastive tones in Green Mong are best predicted by H1–H2 values. Huang (Reference Huang2020) performed two perception experiments in which Mandarin speakers identified tones with f0 and voice quality manipulations, with and without noise. They found that voice quality differences were more important for tone identification when f0 was partially obscured by noise.
Chai (Reference Chai2022) further expands on the concept of laryngeal complexity as laid out in Silverman (Reference Silverman1997a). Languages which include both lexical tone and contrastive glottalization are further categorized into six different types based on to the extent that lexical tone and contrastive glottalization are orthogonal to each other. These six types range from fully crossed (completely orthogonal) to no overlap (in which modal and glottal vowels have no tones in common).Footnote 1 This study concerns a fully crossed language, as lexical tone and voice quality are orthogonal in SSM.
1.2 Voice quality and tone in Otomanguean languages
There is substantial work describing the phonetics of tone and voice quality in Otomanguean languages, including several studies testing interactions between them. Relevant aspects are detailed briefly below.
Mazatec is an Otomanguean language of the Popolocan branch (Garellek & Keating Reference Garellek and Keating2011). San Felipe Jalapa de Díaz (shortened to Jalapa) Mazatec has a lexical tone system with three tones: high, mid, and low, which are fully orthogonal to the three-way voice quality contrast (Garellek & Keating Reference Garellek and Keating2011). Garellek & Keating (Reference Garellek and Keating2011) investigated acoustic correlates of voice quality contrasts (spectral tilt measurements) and lexical tone in Jalapa Mazatec, including their interactions. The study analyzed audio recordings of 14 speakers of Jalapa Mazatec. Certain acoustic correlates were found to be more important for differentiating phonation type in certain tones than others. For example, high tone tokens did not have a single acoustic correlate which differentiated breathy, modal, and laryngealized vowels from each other, whereas for mid tone tokens, H1*–A2* was significantly different for all three phonation types. This indicates that voice quality contrasts in laryngeally complex languages (like SSM) may not be consistent across all tones: it is useful and perhaps necessary to investigate voice quality differences between modal and non-modal vowels for each individual tone.
San Lucas Quiaviní Zapotec is an Otomanguean language of the Zapotec family (Chávez Peón Reference Chávez-Peón2001). The language has four tones: high, low, rising, and falling. In addition, there are four phonation types: modal, breathy, creaky, and interrupted. Interrupted vowels are realized as either checked (for high tone vowels) or rearticulated (for low and falling tones). The rising tone is only ever present on modal vowels. Chávez Peón (Reference Chávez-Peón2001), as part of larger work surveying the phonetics and phonology of the language, examined phonetic tone and non-modal phonation using recordings of two speakers of the language. In order to quantify voice quality, the measure of jitter was used at the midpoint of the vowel. When comparing between creaky vowel tokens, high tone creaky vowels were found to have the lowest amount of jitter (corresponding to less creakiness) when compared to low and falling tone creaky vowels. This indicates that the implementation of a voice quality contrast in laryngeally complex languages like SSM may be influenced by lexical tone.
Itunyoso Trique is an Oto-Manguean language of the Mixtecan branch (DiCanio Reference DiCanio2010). DiCanio (Reference DiCanio2012) studied the phasing of f0 perturbation and non-modal phonation in vowels adjacent to the glottal consonants [h] and [ʔ] in Itunyoso Trique, across 12 different lexical tone combinations. Analysis of audio recordings taken from eight speakers indicated that a more gradual phasing of the glottal gesture with a greater degree of coarticulation led to a dip in f0 on the adjacent vowel. The effect was not the same across all tones; low tones did not show any f0 perturbation. Again, we see that tonal category is important: it can affect the interaction between glottal consonants and f0. In the case of SSM, this indicates that examining the interactions of contrastive glottalization and f0 across tones is crucial to understanding the whole picture.
Gerfen & Baker (Reference Gerfen and Baker2005) examined both production and perception of what they refer to as laryngealized vowels in Coatzospan Mixtec, analogous to what we refer to as re-articulated vowels in SSM. In the production study, modal and laryngealized vowels of eight speakers were compared in terms of f0, amplitude, H1–H2, and duration. Speakers were highly variable in their degree of creak during the production of laryngealized vowels. The most common correlate of laryngealization was dip in amplitude, which was sometimes accompanied by a drop in f0 or creaky voicing. In terms of duration, laryngealized vowels were found to be shorter than modal vowels. While there was interspeaker variation in the voice quality of laryngealized vowels, overall, H1–H2 was found to be significantly lower for laryngealized vowels as compared to modal vowels. Lastly, several perception studies examined judgments of 31 speakers. These studies found that small f0 and amplitude dips, individually, were enough to cue the presence of a laryngealized vowel, and that combining the two cues led to listeners detecting a laryngeal vowel with an even smaller dip in both. Neither the production nor the perception studies examined all tones, however: the production study included only HH and LH tones, and the perception studies included only the HH tone. This leaves open the question of whether these findings would hold for a wider variety of tones. As mentioned above, tone has been shown to have an impact on voice quality contrasts and on the interaction between glottal contrasts and f0 in other Otomanguean languages.
In light of the prior research on voice quality and tone, we seek to answer the following questions as they pertain to SSM:
-
• How is lexical tone realized in terms of f0 (as a replication of Cortés et al. Reference Cortés, Mantenuto and Steffman2023)?
-
• How is contrastive glottalization (in rearticulated vowels) realized over time?
-
• Does lexical tone in modal vowels have any impact on voice quality, or in other words, could voice quality be a non-f0 correlate of lexical tone in SSM? Such a finding would be commensurate with previous research showing that lexical tone contrasts incorporate voice quality (Andruski & Ratliff Reference Andruski and Ratliff2000; Huang Reference Huang2020).
-
• Does lexical tone impact the magnitude and phasing of the contrastive glottal gesture in rearticulated vowels?
1.3 Background: San Sebastián del Monte Mixtec
San Sebastián del Monte Mixtec is part of the Mixtecan language family, which consists of Mixtec, Cuicatec and Trique, though Mixtec and Cuicatec are part of the same subgroup, also called Mixtecan (Josserand Reference Josserand1983:99–101). San Sebastián del Monte is a town in the Santo Domingo Tonalá municipality of Oaxaca State, Mexico, in the district of Huajuapan de León. The town is 45 km southwest of Huajuapan de León, with a population of approximately 2,000 people (latitude: 17.677778, longitude: –98.021944). The majority of people between the age of 19 and 80 are bilingual Mixtec and Spanish speakers and specifically younger generations (below the age of 19) are mostly monolingual Spanish speakers; though in the town there is an ongoing effort to revitalize the language (Cortés et al. Reference Cortés, Mantenuto and Steffman2023).
The consonantal inventory of SSM consists of 21 contrastive sounds /p, b, t, tj, k, kw, mb, ⁿd, ⁿdj, t͡ʃ, m, n, ɲ, r, v, s, ʃ, ʒ, x, ɣ, l/, there are five contrastive oral vowels /a, e, i, o, u/, and four contrastive nasal vowels /ã, ē, ĩ, õ/ (Cortés et al. Reference Cortés, Mantenuto and Steffman2023). There are long and short vowels, though vowel length is not contrastive in the language. Vowel length is predictable based on the shape of the morpheme. For example, morphemes that present a long vowel in the language are only CVV or VV. Lexical words are minimally and generally formed by two moras (Pike Reference Pike1948, Longacre Reference Longacre1957), and they can also have three or four moras; however, only function words can be monomoraic (Cortés et al. Reference Cortés, Mantenuto and Steffman2023).
Glottalization in SSM is employed contrastively in vowels, and it is evident in four types of bimoraic word: V͡ˀV, CV͡ˀV, V͡ʔCV and CV͡ʔCV. The vowels flanking the glottal event in V͡ˀV and CV͡ˀV are always of the same quality and are called ‘rearticulated vowels’ (eg, ndı`Ɂi ‘pimple’ and loɁo` ‘little’). In the V͡ʔCV and CV͡ʔCV shapes, glottalization occurs at the end of a vowel preceding a consonant and the two vowels in the syllable can be of different quality (Cortés et al. Reference Cortés, Mantenuto and Steffman2023). While the glottal gesture in rearticulated and checked vowels is commonly transcribed as a glottal stop /ʔ/ for other languages, this study will transcribe it as a tie with a superscript glottal stop, as in /V͡ʔV/. This convention has been adopted to describe Mixtecan languages due to a lack of full glottal stop closure in most productions of checked and rearticulated vowels (Garellek et al. Reference Garellek, Chai, Huang and Van Doren2021, Cortés et al. Reference Cortés, Mantenuto and Steffman2023). Figure 1 shows an example of three rearticulated vowel productions, adopted from Cortés et al. (Reference Cortés, Mantenuto and Steffman2023). As is already apparent from the figure, the production of rearticulation can vary substantially, in some cases showing full closure and silence in between flanking vowels, and in other cases only a dip in amplitude.
Time-aligned waveforms and spectrograms exemplifying three realizations of SSM rearticulated /o͡ʔo/. Ticks on the x axis are placed at 100 ms intervals. Because speakers were recorded in situ (see the following section), there may be some reverberation present in the recordings, as is visible in the vowel medial portion of the rightmost spectrogram.

Figure 1 Long description
The image contains three sets of time-aligned waveforms and spectrograms, each representing different realizations of the SSM rearticulated vowel sound /oo/. The waveforms display the amplitude of the sound over time, while the spectrograms show the frequency components of the sound. Ticks on the x-axis are placed at 100 millisecond intervals to provide a temporal reference. The spectrograms reveal the frequency content of the vowel sound, with darker regions indicating higher energy at specific frequencies. The waveforms and spectrograms are aligned to show the correspondence between the time domain and frequency domain representations. Some reverberation is visible in the vowel medial portion of the rightmost spectrogram, likely due to the in-situ recording conditions. The image provides a visual and auditory representation of the phonetic interaction between lexical tones and glottalization in San Sebastin del Monte Mixtec.
There are three tones in SSM, a high <á>, a mid tone <a>, and a low tone <à>. As in other Mixtec varieties, each mora carries a separate tone. In word shapes that are analyzed as bi-moraic (C)VV (a long vowel) or (C)V͡ʔV (a rearticulated vowel), a tone associates with each mora to form the following tonal combinations (Cortés et al. Reference Cortés, Mantenuto and Steffman2023): high level (HH), mid-level (MM), mid-falling (ML), low level (conventionally labeled as LM), low rising (LH), high falling (HL), low falling (LL). As stated earlier, SSM Mixtec is a fully crossed language with respect to modal and rearticulated vowels; all tones which occur on modal vowels can also occur on rearticulated vowels, and vice versa.
2. Methods
2.1 Speakers, stimuli, and recording
Two bimoraic word types (henceforth referred to as word shapes) were examined in this study. One modal word shape was included in the corpus: long modal vowel CVV, and one word shape which includes a glottal gesture: rearticulated vowel CV͡ʔV.
As noted above, there are seven tonal contours which occur on CVV and CV͡ʔV words: HH, MM, LL, ML, LM, HL, and LH (Mantenuto Reference Mantenuto2020, Cortés et al. Reference Cortés, Mantenuto and Steffman2023). These were the seven tonal combinations examined across both word shapes in this study. No tokens of HL tones were included in the CVV data. This tone pattern can occur on CVV words, but only in certain aspects of verbs, which were judged too difficult to control in the elicitation.Footnote 2 All five SSM vowels /i e a o u/ were represented in the corpus.
This study included 14 speakers of SSM (nine female, five male) who acquired the language from birth and use the language on a daily basis. The speakers were recorded in situ in San Sebastián del Monte. Target words were presented to the speakers in a randomized list of 36 unique words. Target words varied in vowel quality, tone, and word shape, with some lexical gaps. Speakers produced target words in the following carrier sentence:

The word list was randomized and read twice, with the second reading in reverse order. Each token was repeated twice in both readings of the list, resulting in a total of four repetitions of each unique word. Tokens with background noise or speech errors were not included in analysis, this ultimately being 12% of the recorded data. The tokens which were processed for data analysis included 919 CV͡ˀV productions and 944 CVV productions. Additionally, data for CVCV and CV͡ˀCV were collected; however, these words were not included in the data presented here, as they were ultimately outside of the scope of this study. See Appendix A for the full word list.
2.2 Measurements
Recordings were annotated by hand using Praat (Boersma & Weenink Reference Boersma and Weenink2022). Strength of Excitation (SoE) and f0 measurements were taken to evaluate voice quality and pitch, respectively.
SoE is an amplitude measure which captures relative loudness of voicing without other noise in the recording (Murty & Yegnanarayana Reference Murty and Yegnanarayana2008; Mittal et al. Reference Mittal, Yegnanarayana and Bhaskararao2014). In recent years, it has been used to analyze non-modal phonation in a variety of languages (see Garellek et al. Reference Garellek, Chai, Huang and Van Doren2021). Unlike other voice quality measures which utilize spectral tilt – such as H1–H2 and Cepstral Peak Prominence – SoE does not require clear harmonic structure, making it appropriate to quantify voicing which may change to very low amplitude, or silence, during a glottal gesture. Because the corpus contained a large number of tokens with heavy glottalization, this feature of SoE was crucial for examining voice quality in the present study. In addition, large amounts of both inter- and intra-speaker variation in the production of the glottal gesture would have meant that segmenting the rearticulated vowel tokens into more modal voiced portions would have made analyzing the corpus in any unified way quite complex.
SoE and f0 were computed in Voicesauce; f0 was measured using STRAIGHT (Shue et al. Reference Shue, Keating, Vicenik and Yu2011). Twenty time-normalized measurements were taken for both SoE and f0 across the vowels in CV͡ˀV and CVV productions, which were segmented manually.
For SoE we present data in log-transformed and range-normalized SoE, following Garellek et al. (Reference Garellek, Chai, Huang and Van Doren2021). We log-normalized the SoE measurements because SoE is expected to be log-normal with a right tailed distribution. Following Garellek et al. (Reference Garellek, Chai, Huang and Van Doren2021), we also excluded outliers (z-scored larger than |3|). We then range-normalized these measures for the purpose of visual illustration in the figure. This was done by taking the maximum and minimum SoE values produced by a given speaker, and then using the following formula where SoEi is the (logged) SoE measurement at a given time point.
With this procedure, a value of one represents the maximum SoE produced by a given speaker, while a value of (very near) zero represents voicelessness. As described in Dhananjaya & Yegnanarayana (Reference Dhananjaya and Yegnanarayana2009), SoE values which are less than 1% of the maximum SoE can be considered voiceless.
f0 measurements were transformed from Hz to Equivalent Regular Bandwidth (ERB) and scaled within speaker to account for between-speaker variation in overall f0 height, and f0 range.
2.3 Statistical modeling
Generalized Additive Mixed Models (GAMMs), throughout the paper, are implemented using R packages mgcv and itsadug (Wood Reference Wood2011, Reference Wood2015, Reference Wood2017; van Rij et al. Reference van Rij and Martijn Wieling2020). To reduce residual autocorrelation, the GAMMs were set up as AR1 error models, from which the rho value was obtained by a previous run of the model without the AR1 structure. In recent years, GAMMs have played a growing role in phonetics research, as a means of examining the dynamics of acoustic and articulatory properties of speech over time (e.g., Carignan et al. Reference Carignan, Hoole, Kuna, Pouplier, Joseph, Voit, Frahm and Harrington2020, Sóskuthy Reference Sóskuthy2021). We use them here as a means of assessing statistical differences in acoustics measures, as they unfold over time, with 20 time-normalized measures taken from each interval of interest, e.g., VV in CVV and V͡ʔV in CV͡ʔV. The default number of knots was used in all models, and each model was inspected and found to be adequate using the gam.check function.
We structured several different models to address different research questions. To address the question of how f0 varies as a function of lexical tone in CVV (Section 3.1), we set the GAMM to predict f0 as a function of lexical tone. We predicted f0, which was represented as ERB and scaled within speaker as a function of the tone variable, using both a parametric term for tone (capturing overall f0 height by tone) and smooth term, capturing the (potentially) non-linear dynamics of f0 over the course of the vowel. Random effects were specified for vowel quality, as control on possible vowel-quality-related modulation in f0, using bs = ‘re’ as a term in the model. We also include random effects analogous to random effects for subject and by-subject random slopes by tone, using bs = ‘fs’, and the reference-difference smooth technique described in Sóskuthy (Reference Sóskuthy2021), with the m parameter set to the value of 1 (Baayen et al. Reference Baayen, van Rij, de Cat and Wood2016; Sóskuthy Reference Sóskuthy2017). In subsequent analyses we modeled SoE, which was represented in the models as log SoE values, scaled by speaker. In Section 3.2, we were interested in the overall effect of rearticulation on voice quality, measured with SoE. To this end, the GAMM predicted the SoE measure, over normalized time, as a function of word shape, a two level variable with levels CVV (no rearticulation) and CV͡ʔV. The random effect structure was the same in this model, with the only difference being that the fixed effect of word shape was built as a by speaker random slope equivalent using the reference difference smooth approach. In this analysis, the parametric term measures the overall difference between word shapes in SoE (across the entire interval of normalized time), and is thus interpretable in a similar fashion to a coefficient in a linear regression model of SoE as a function of word shape.
Finally, we were interested in the interaction between tone and glottalization and their joint influence on voice quality (Section 3.3). To this end, we fit a model to predict SoE as a function of a combined variable which was the combination of each word shape with each tone for which data existed for that word shape. This model does not orthogonally represent tone and word shape, but rather examines their combination as a predictor of SoE. The advantage of this technique is that it allows us to capture (potentially) non-linear and dynamic differences between tones, as a function of word shape, and simultaneously, between word shapes as a function of tones. Fitting the data in this way, and then examining comparisons of interest thus allow for a full picture of the relationship between tone and rearticulation, and also allows us to examine tone-based differences within each word shape.
In presenting the GAMM results, we primarily use the ‘visual inspection’ technique to assess significance in the models (see Sóskuthy Reference Sóskuthy2017, Reference Sóskuthy2021, for discussion), with reference to computed difference smooths. Difference smooths capture the difference between two fit smooths of interest, and also have 95% confidence intervals (CI). When 95% CI exclude the value of 0, this indicates high confidence in a non-zero difference between smooths (i.e., a significant difference between smooths) at that particular point in normalized time. In what follows, we show both fit smooths and difference smooths for comparisons of interest.
To further examine the possible interactive influence between tone and rearticulation on SoE, we complemented our GAMM modeling of this data with Functional Principle Component Analysis (FPCA; Ramsay & Silverman, Reference Ramsay and Silverman2005). FPCA is a data-driven approach of modeling how a given parameter (here, SoE) changes over time. FPCA has fruitfully been applied to the study of dynamic f0 and formant frequencies (e.g., Gubian et al. Reference Gubian, Torreira and Boves2015; Asano & Gubian Reference Asano and Gubian2018; Baltazani et al. Reference Baltazani, Coleman, Passoni and Przedlacka2022; Arvaniti et al. Reference Arvaniti, Katsika and Hu2024), and offers a way to capture and quantify modes of variation in dynamic contours, which can submitted to statistical modeling to examine the influence of categories of interest; in our case tone and rearticulation. The present paper provides only a very brief and conceptual introduction to FPCA below; for a more in-depth explanation, we refer readers to Gubian et al. (Reference Gubian, Torreira and Boves2015).
In our application of the method, sampled SoE curves are represented as continuous functions over time. Independent modes of variation in the data are extracted, and these Principal Components (PCs) are each associated with a numerical score. A particular contour in the data is modeled as a function of time, and as the sum of functional components, including the mean of the contours in the data $\mu$
(t). In addition to
$\mu$
(t). In addition to $\mu$
(t), PC scores are multiplied by each PC curve and summed, as shown in the equation below.
$\mu$
(t), PC scores are multiplied by each PC curve and summed, as shown in the equation below.
As given in (3) above, $\mu$
(t) is modified by the sum of other PC contours, which together determine the shape of the modeled curve. Each contour in the data set will be associated with a particular value of a PC score, which determines how variation associated with that score is reflected in the contour. Importantly, PC curves are not actual curves in the data, but can be used to reconstruct curves on the basis of the summed PC curves, each with a corresponding PC score. FPCA is ‘data driven’ in the sense that the assignment of PC scores to contours in the data is not made on the basis of a-priori categories in the data (e.g., here, tone and word shape). Nevertheless, it allows for the incorporation of hypothesis tests about linguistic categories and distinctions in a secondary stage where PC scores are passed to a statistical model. Linear modeling can at this stage be used to examine how PC scores, which map to modes of variation in the time-series data, vary as a function of tone and rearticulation.
$\mu$
(t) is modified by the sum of other PC contours, which together determine the shape of the modeled curve. Each contour in the data set will be associated with a particular value of a PC score, which determines how variation associated with that score is reflected in the contour. Importantly, PC curves are not actual curves in the data, but can be used to reconstruct curves on the basis of the summed PC curves, each with a corresponding PC score. FPCA is ‘data driven’ in the sense that the assignment of PC scores to contours in the data is not made on the basis of a-priori categories in the data (e.g., here, tone and word shape). Nevertheless, it allows for the incorporation of hypothesis tests about linguistic categories and distinctions in a secondary stage where PC scores are passed to a statistical model. Linear modeling can at this stage be used to examine how PC scores, which map to modes of variation in the time-series data, vary as a function of tone and rearticulation.
One benefit of FPCA as a complement to GAMM modeling is that it allows for more direct testing of the relationship and interaction between tone and rearticulation in SSM. In particular, our GAMM modeling fits the model to a combined tone + rearticulation variable, which represents how each trajectory for this combined variable changes over time. Assessment of interactions between tone and rearticulation, made on the basis of visual inspection, are more qualitative in the sense that we can observe, e.g., if particular tones vary in how they are impacted by rearticulation. This is validated statistically by the inspection of difference smooths, which may be different in the scope and location of significant differences. However, the GAMM assessment still lacks a more quantified assessment of the presence of an interaction between tone and rearticulation. In modeling PC scores with a linear mixed effect model, we can test if both tones and words shapes differ in that score, and if there are statistical interactions between these factors in the model.
The modeling approach we took for the resulting PC scores was as follows: the first three PC scores were submitted to a mixed effects model, implemented in the Bayesian framework using brms (Bürkner Reference Bürkner2017). In order to account for possible co-variance among the PC scores, we opted to model the data using a multivariate approach: a single model was thus used to predict how each of the dependent variables (PC1, PC2, and PC3) vary, while also accounting for the possible relationship between the PC scores in the data set. We also ran individual models, one for each PC score, and found that the results were quite comparable across these two approaches, both of which are included on the open access repository. The model predicted a given PC score as a function of tone and word shape, with both of these variables contrast coded. The interaction between the two fixed effects was included as well, to address the central question of how tone and word shape (may) jointly impact SoE. Random effects in the model were by-speaker random intercepts with random slopes for both fixed effects and their interaction. A random intercept for vowel category was also included, as was the case for GAMM modeling. The priors in the model were set to be weakly informative student-t priors, centered on zero with a standard deviation of 1, and 3 df, for both the intercept and fixed effects in the model (encoding no prior expectation of an effect of tone or word shape on each PC score). The models were set to draw 4,000 samples in each of four Markov chains from the posterior distribution over parameter values. The first 1,000 samples from each chain were discarded, retaining 75% of samples for inference.
In reporting results from the model, our key interest is the overall (marginal) effect of word shape on each PC (that is, the effect of word shape across tones), and presence of any interactions between tone and word shape on PC scores. To examine marginal effects and interactions of interest we used emmeans (Lenth Reference Lenth2023) to compute marginal contrasts for word shape, tone, and the effect of word shape within each tone category (detailed in the results below). In reporting effects of interest, we provide the median posterior estimate for an effect, 95% Credible intervals (CrIs) for the estimate. CrIs refer to the range of an estimated posterior distribution in which 95% of the estimates fall. When estimates for an effect are reliably estimated to be non-zero, this indicates that an effect is reliable, or ‘credible’. A common convention for considering which effects are credible is thus to assess if the 95% CrI for a given effect Includes or Excludes the value of zero. If the value of zero is included in the interval, this would suggest a lack of certainty that the effect is not zero, or a lack of certainty that the effect has a consistent directionality (i.e. 95% CrI spanning zero indicates substantial variation in the estimated directionality of an effect). Conversely, 95% CrI which Exclude the value of zero can be taken to represent a consistently estimated effect. We additionally report the percentage of a distribution for a given effect which shows a consistently estimated directionality, as computed with bayestestR (Makowski et al. Reference Makowski, Ben-Shachar and Lüdecke2019). This ‘probability of direction’ (pd) metric can be taken to represent graded evidence for effect existence; a posterior estimate centered precisely on the value of zero will have a pd value of 50 (50% of the distribution on either side of zero). On the other hand, a distribution with a consistently estimated effect will have a pd value approaching 100. A pd value in excess of 97.5 corresponds precisely to an estimate with 95% CrIs just excluding zero; however, those values approaching this threshold can also be taken as graded evidence for an effect (i.e., the probability that an effect exists with a particular directionality).
For both of the data analysis approaches described above, the numerical model output is not particularly insightful for interpreting effects of interest. The full models, in addition to the data and scripts for analysis are thus contained online, hosted on the OSF at: https://osf.io/crx2q/. We also present marginal effect estimates for comparisons of interest in Appendix B of the paper.
3. Results
3.1 f0 as a function of tone in CVV
First, we investigate the manner in which lexical tone is realized with f0 in long modal vowels, as a basic characterization of the tonal contrasts when not influenced by re-articulation. To this end, we use GAMMs to test how f0 varies across the vowel in CVV word shapes. The f0 results for rearticulated tokens will not be examined here, as the glottalized vowel-medial portion had irregular f0, which led to a high number of erroneous f0 readings.Footnote 3
Figure 2 shows findings for this section. Panel A contains fit smooths for each of the six tonal melodies elicited for the CVV tokens (coloration indicating tone). The tone smooths in Panel A are generally as expected given the lexical tone labels, with a couple of exceptions. The non-contour tones (according to phonological tone labels) HH, MM, and LL have a mostly constant f0 and have highest to lowest f0 in that order. The LL (low falling) tone drops slightly over the course of the vowel. LM and LH both have rising f0 over the duration of the vowel, with LH rising farther than LM. ML starts with a higher f0 than expected given the standard tone label: at the beginning of the vowel, it has a similar f0 to HH. Unfortunately, as mentioned earlier, we were not able to collect any HL long modal vowel tokens for comparison. Panel B of Figure 2 shows the difference smooth for each pair of tonal melodies. Highlighted yellow sections mark portions of the vowel for which f0 is significantly different between tonal melodies. Generally, tone pairs are significantly different in terms of f0 for all or most of the vowel, with the exception of LL and LM, which only show small differences in f0 over relatively short portions of the beginning and end of the vowel.
Panel A (top) shows GAMM fits for f0 (in scaled ERB) over vowel duration for each tone in CVV tokens. Panel B (bottom) shows difference smooths for all tone pairs in Panel A; yellow marks parts of the vowel duration where there is a significant difference in f0 between tones.

Figure 2 Long description
The image contains two panels. Panel A at the top displays multiple line graphs showing generalized additive mixed model (GAMM) fits for fundamental frequency (f0) in scaled equivalent rectangular bandwidth (ERB) over proportional vowel duration for each tone in consonant-vowel-vowel (CVV) tokens. Each line represents a different tone, with colors distinguishing them. Panel B at the bottom shows difference smooths for all tone pairs from Panel A, highlighting parts of the vowel duration where there is a significant difference in f0 between tones with yellow lines. The x-axis in both panels represents proportional vowel duration, while the y-axis in Panel A represents scaled ERB (fit) and in Panel B represents scaled ERB (difference).
Cortés et al. (Reference Cortés, Mantenuto and Steffman2023) also presented f0 data for tones in SSM Mixtec CVV tokens. Findings were similar to those in this study for all tones except LM. Cortés et al. (Reference Cortés, Mantenuto and Steffman2023) characterizes LM as a low steady tone, citing their result that the f0 of LM was mostly stable and did not show a substantial rise in pitch in the latter part of the vowel. However, the LM data in this experiment is not consistent with that finding. The LM tone f0 smooth here dips down in the beginning of the vowel and then rises slightly in the latter two thirds of the vowel. Cortés et al. (Reference Cortés, Mantenuto and Steffman2023) had a similar result for ML tokens (which we found had slightly higher than expected at the beginning of the vowel given the tone label). In their study, HL tokens were included, and HL was differentiated from ML by a higher peak in f0 during the first half of the vowel and a lower dip in f0 during the last third of the vowel. Cortés et al. (Reference Cortés, Mantenuto and Steffman2023) found that the HL f0 smooth dipped down to approximately match the level of the LL f0 smooth near the end of the vowel, while the ML f0 smooth stayed higher. While our ML tone findings include a slightly higher f0 rise at the beginning of the vowel, our results are very similar to Cortés et al. (Reference Cortés, Mantenuto and Steffman2023) in that the f0 of ML does not dip down to meet the LL tone at the end of the vowel.
3.2 Strength of excitation by word shape
In this section, we examine how rearticulated vowels are produced, focusing on the dynamics of strength of excitation (SoE) over the vowel. As in the previous section, we use GAMMs, this time to test how SoE varies across the vowel in both rearticulated and CVV word shapes. Two separate GAMM structures are described in this section.
Prior to proceeding to the analysis, we present the data in Figure 3, which shows by-speaker measures of SoE over time in both rearticulated and CVV word shapes. Figure 3 shows these measures plotted for both the individual productions, and speaker means as smoothed functions (GAMMs) over time, to visually simplify and factor out micro-fluctuations in SoE. The thin black lines in the figure represent individual SoE trajectories and the thicker colored lines represent SoE mean.
SoE tracks over normalized vowel duration, split by speaker. For each speaker, a plot for CVV words is shown on the left and a plot for CV͡ʔV words is shown on the right. Thin lines represent individual SoE tracks, and thick colored lines show means.

Figure 3 Long description
The image contains multiple line graphs showing the range normalized SoE across vowel duration for different speakers and word types in San Sebastin del Monte Mixtec. The graphs are organized into rows and columns, with each row representing a different speaker and each column representing a different word type (CVV and CVV). Thin lines represent individual SoE tracks, while thick colored lines show the means. The x-axis represents the proportional vowel duration, and the y-axis represents the range normalized SoE. The graphs compare the SoE tracks for CVV words on the left and CVV words on the right for each speaker. The data is elicited from 14 speakers of SSM, and the graphs provide a quantified and dynamic characterization of the data using time-series modeling approaches.
All speakers show relatively stable mean smooths for SoE over the course of long modal vowels in CVV tokens. While SoE means are stable, individual SoE trajectories can be dynamic over time (for example, see speakers 1, 3, and 11). However, the timing of the SoE dip within the vowel differs across tokens, leading to a relatively flat SoE mean trajectory. This is not the case for rearticulated vowel tokens. For seven speakers (1, 4, 6, 8, 10, 11, and 14), there is a pronounced dip in mean SoE about halfway through rearticulated vowel tokens. This dip corresponds with the expected glottal gesture in the middle of rearticulated vowels. Other speakers who do not show this regularly phased glottal gesture in rearticulated vowels may be producing contrastive glottalization with other phonetic cues. We examine this inter-speaker variation in quantified terms using FPCA in Section 3.4.
Panel A (top left) shows the overall mean SoE for long modal and rearticulated vowels (larger points), with half-violin plots showing the distribution of the data and individual data points shown at the right of each half-violin. Panel B (top right) shows smooths for SoE in long modal (blue) and rearticulated vowels (red). Shading shows 95% confidence intervals. Finally, panel C (bottom) shows the difference smooth corresponding to the pair of smooths in panel B.

Figure 4 Long description
Panel A displays the overall mean SoE for long modal and rearticulated vowels, with larger points indicating the mean values. Half-violin plots show the distribution of the data, and individual data points are shown to the right of each half-violin. Panel B presents smooths for SoE in long modal vowels in blue and rearticulated vowels in red, with shading indicating 95% confidence intervals. Panel C shows the difference smooth corresponding to the pair of smooths in Panel B.
In our first analysis of rearticulated vowels, we focus on the difference between the two word shapes overall by fitting a GAMM to model SoE over time. There are two essential questions examined here: first, whether rearticulation leads to a dip in SoE, as predicted based on findings from Garellek et al. (Reference Garellek, Chai, Huang and Van Doren2021); and secondly, how this dip is phased in the vowel overall. To this end, we fit the GAMM to model log SoE, scaled within each speaker, as a function of word shape. The model was fit with a parametric term for word shape. Parametric terms are analogous to a fixed effect in a linear model. This term will capture the overall value of SoE, across the interval as a whole, as a function of word shape. The model was additionally fit with smooth terms for word shape over time, which will allow us to capture the dynamics of (potential) differences in SoE as a function of word shape. Random effects in the model were a random intercept for vowel (bs = ‘re’) and a random intercept for speaker with by-speaker slopes for shape, using the reference-difference smooth technique described in Sóskuthy (Reference Sóskuthy2021). These random effects thus account for vowel-based variation in SoE, where we may expect more sonorous segments to have higher SoE (e.g., Chong et al. Reference Chong, Risdal, Aly, Zymet and Keating2020), potentially as a function of e.g., vowel openness. The random effects also account for speaker-based variation in overall SoE, and in the effects of word shape for each speaker. The overall effects of word shape on SoE are shown in Figure 4.
First, there was a main effect of shape on SoE, whereby with CV͡ʔV as the reference level on the model, the parametric term capturing the differences between shapes was significant, showing that, across the interval as a whole, CVV shapes have higher SoE (β = 0.31, t = 4.19, p < .001). This effect is shown in Figure 4, Panel A, which presents the empirical scaled mean SoE measure across word shapes. This overall lowering of SoE is consistent with what we expect in terms of glottalization lowering voicing amplitude overall. To inspect the dynamics of the effect, we plot the fit smooths for each word shape (Figure 4, Panel B), and the difference smooth for each word shape (Figure 4, Panel C). The difference smooth in a GAMM model allows for a statistical assessment of where (in time) two trajectories are different from one another. As can be seen by coloring in Panel C, the region of significant difference is in the middle portion of the vowel, and in this region only. In other words, in assessing the differences in voicing amplitude across word shapes overall, rearticulation leads to a dip in SoE in the middle of the vowel, which is otherwise not significantly different from CVV at the beginning or end of the vowel’s duration. This corresponds to the expectation that rearticulation is phased in the middle of the vowel. Interestingly, we found that SoE in rearticulated vowels, as a whole, rose more after the initial dip than was reported in Garellek et al. (Reference Garellek, Chai, Huang and Van Doren2021), where results indicated that word-final rearticulated vowels had a dip in SoE, after which SoE did not rise.
3.3 Interactions between glottalization and tone
3.3.1 GAMM modeling
Our second analysis sought to examine the influence of lexical tone on the dynamics of SoE. Our interest here is twofold. First, are there reliable differences in SoE based on tone in CVV and CV͡ʔV shapes? Descriptively, we are interested in testing for non-f0 correlates that may distinguish lexical tones in SSM. Secondly, how does the previously described phasing pattern, evident in the aggregated modeling in Section 3.2, vary by tone? That is, we are interested to test if lexical tone mediates the magnitude and phasing of SoE differences across word shapes. To this end, we fit smooths with a combined tone+wordshape variable, which was also included as a parametric term and a random effect using the reference difference smooth method employed in the previous GAMM. The same random effects for vowel were additionally used. Crucially, for our purposes, this technique allows us to model non-linear interactions between word shape and tone. Figure 5 shows these GAMM fits, grouped by word shape in Panel A, and grouped by tone in Panel B.
Panel A (top) shows by-tone SoE smooths for long modal and rearticulated vowels. Panel B (bottom) shows smooths which compare the SoE for long modal and rearticulated of the same tone.

Figure 5 Long description
The image contains two sets of graphs. Panel A at the top shows multiple line graphs depicting the scaled log SoE (fit) over the proportional vowel duration for different tones and shapes. The tones are color-coded: HH in blue, LH in yellow, HL in red, LL in green, LM in brown, ML in light blue, and MM in black. The shapes are represented by solid lines for CVV and dashed lines for CV?V. Panel B at the bottom shows six individual line graphs comparing the scaled log SoE (fit) over the proportional vowel duration for long modal and rearticulated vowels of the same tone. Each graph represents a different tone: HH, LH, LL, LM, ML, and MM. The solid lines represent CVV, and the dashed lines represent CV?V. The graphs illustrate how SoE varies over time for different tones and rearticulation conditions. All values are approximated.
Panel A shows that long vowel tokens have a more stable in SoE over time, whereas rearticulated vowel tokens are more dynamic with a large dip in SoE corresponding to the contrastive glottal gesture in that word shape (as shown in the aggregated analysis in Figure 4).
In Panel B, blue shading indicates portions of the vowel during which the long vowel smooths and rearticulated vowel smooths are significantly different. For all tones, there was some vowel-medial (and/or end) portion in the rearticulated vowel tokens during which SoE dipped significantly lower than the CVV smooth. Crucially, the timing, duration, and degree of this difference in SoE shapes varied by tone. The SoE of rearticulated LH and LM tone tokens only briefly and very slightly dips below the 95% CI for long modal vowels. Comparing the modal and rearticulated vowel smooths for the HH and MM tones, on the other hand, shows that the rearticulated vowels have a more robust dip in SoE vowel-medially as compared to modal vowels. Lastly, the ML and LL rearticulated data show a different pattern from the others: rather than SoE falling and rising, SoE falls after the first quarter of vowel duration and does not rise.
In the smooths in Panel A of Figure 5 above, it appears that SoE smooths for each tone differ from one another within word shape (comparing tones within long modal and rearticulated vowels). This is further confirmed by inspection of pairwise difference smooths, which show clearly in aggregate that the scope and location of differences varies between tones and word shapes. Most tone pairs within word shape, eight of 15 tonal pairs for long modal vowels and 17 of 21 tonal pairs for rearticulated vowels, had a significantly different SoE for some portion of the vowel. These difference smooths are included in Appendix C below. This trend in the data will be explored more fully in the following FPCA section.
Panel A (top): visual representation of the impact of each PC, represented by how a particular PC score results in deformation of the mean curve in the data (dashed line, same in all panels). These were generated by adding a particular PC curve (PC1 at left, PC2 at middle, PC3 at right) multiplied by a particular PC score (shown by coloration and indexed at right) to the mean curve. The scores are represented as SD to normalize across PCs visually, ranging from –1 SD to +1 SD. Panels B–G show the model estimates for each PC as a function of word shape (indicated by point shape, left) and tone and word shape (right). Points are median estimates, error bars show 95% CrI.

Figure 6 Long description
The image contains multiple graphs analyzing the impact of principal components on speech data. The top panel shows three line graphs representing the deformation of the mean curve due to different principal component scores. The x-axis represents the proportional vowel duration, while the y-axis shows the normalized scores ranging from negative one to positive one. The colors indicate different scores, with a gradient from green to blue to yellow. The bottom panels display model estimates for each principal component as a function of word shape and tone. Points represent median estimates, and error bars show ninety-five percent credible intervals. The left panels compare different word shapes, while the right panels compare different tones and word shapes. The graphs illustrate how variations in principal component scores affect the speech data.
3.3.2 FPCA modeling
Figure 6 shows the FPCA modeling results, where Panel A gives a visual representation of the impact of variation in PC1 (left) PC2 (middle) and PC3 (right); see the figure caption for details. The first three PCs in the data set captured 55%, 18%, and 12% of the variance in the data for PC1, PC2, and PC3, respectively, 85% in aggregate. This indicates that the first three PCs collectively explain a large proportion of variance present in the data set. In presenting the results which follow, our goal is to describe how a particular PC score corresponds to variation in contour shape in the data set. With that variation in mind, we observe how the PC score varies as both a function of tone and word shape. We explain each of the three PCs in succession in what follows.
Table 1 above contains a brief description for each PC score, i.e. what a higher or lower value corresponds to in deformation of the mean curve. We will step through each in detail here. PC1, broadly speaking, appears to capture two different properties simultaneously. The first is contour height, whereby SoE contours with higher PC1 scores are lower in SoE– numerically higher (normalized) scores in PC1 result in lower-valued contours (i.e., weaker voicing). PC1 additionally varies in the extent to which the contours dips in the middle. Numerically higher PC1 values map to a more-dipping contour shape. This observation that PC1 maps to SoE height and propensity to dip leads us to expect that there will be a difference in this PC score as a function of word shape: rearticulated vowels, having been shown to have lower and more-dipping SoE contours, should have numerically higher PC1 scores. The statistical model of PC1 scores confirms this observation. The marginal effect for word shape in the model shows that rearticulated vowels have credibly higher PC1 scores (β = 1.84, 95% CrI = [0.97,2.81]; pd = 100), shown in Figure 6 Panel B. This essentially confirms the previous GAMM modeling analysis based on word shape: overall, PC1 captures SoE lowering and dipping which is present in rearticulated vowels. Marginal effects for tone also indicate some differences in PC1. Given the many possible pairwise comparisons of tones with one another, we just focus on several comparisons of interest, which can also be seen in Figure 6, Panel C. The points in the panel are sorted from lowest to highest PC1 score by tone (left to right). Table 2 in Appendix B contains marginal estimates for all pairwise tone differences (for all three PCs). One clear difference in PC1 is that HH tones have credibly lower PC1 scores as compared to three other tones: LM, LL, and ML (pds > 99). This suggests that these latter tones are effectively lower in SoE (and/or more dipping), also confirming the observations from the fit GAMM smooths. Like HH, LH is also credibly lower in PC1 as compared to LM and LL (pds > 99). This clearly shows that tone and word shape are jointly structuring SoE variation associated with PC1, such that the information is jointly encoded in the trajectories’ PC1 score.
This includes the qualitative characteristics of the curve corresponding to higher and lower PC scores for each calculated PC value

Table 1 Long description
The table presents the interpretation of principal component (PC) scores and their associated modifications of the mean curve for a study on speech patterns. It includes three principal components (PC1, PC2, and PC3) with high and low score values. For PC1, a high score indicates a lower standard of living over all with more dipping, while a low score indicates a higher standard of living over all with less dipping. For PC2, a high score shows a falling standard of living, and a low score indicates a more dipping and rising standard of living. For PC3, a high score suggests a more stable standard of living throughout, and a low score indicates a standard of living that rises in the beginning portion, dips in the middle, and then rises and falls at the end. The table is structured with three columns: PC number, PC score value, and interpretation of the associated modification of the mean curve.
The model also indicates the presence of credible interactions between tone and word shape (pds > 99), leading us to inspect the effect of shape within each tone, shown in Figure 6, Panel C. Comparison of marginal shape effects within tone show that for all but one tone, there is clear evidence for a difference based on shape in line with the marginal shape effect (pds > 97). For LM however, there was no credible evidence for a difference in PC1 score as a function of word shape (pd = 84), though the directionality of the effect was the same as the marginal effect for word shape. The estimates also reveal clear variation in the magnitude of the shape effect within each tone. For example, ML shows a larger difference in PC1 score as a function of word shape. In summary, PC1, which varies credibly as a function of both tone and word shape, shows that these dimensions are intricately linked in their impact on SoE variation captured in this particular PC. Statistical interactions further confirm that tone and word shape are jointly encoded in PC1, and that the effects of rearticulation are not uniform in this dimension.
Looking at Panel A in Figure 6, we can note that PC2 variation is primarily associated with variation between monotonically falling shapes (high PC2 score) or scooped and rising shapes (low PC2 score). Lexical tone varied clearly in this dimension, with many tones showing credible pairwise differences from one another (see Table 2 in Appendix B), as evident from the variation in PC2 score left to right as a function of lexical tone (ordered low to high in Panel E). The evidence was weaker for a difference in PC2 based on the marginal effect of word shape, as shown in Figure 6, Panel D. The estimates are strongly skewed one way, however 95% CrI do narrowly include the value of zero (β = –0.30, 95% CrI = [–0.60,0.01]; pd = 97). The presence of several credible interactions between tone and word shape in the model indicate possible asymmetries of this effect across tones, which become apparent when we consider the estimates for these two factors in interaction in Panel E. MM and LH tones show no credible difference in this PC, though the remaining tones show some evidence of credible difference in PC2 score as a function of word shape (pds > 99, save for ML where pd = 95). For all but one, this aligns with the marginal effect of word shape, though interestingly ML tones show a reversal of this effect whereby rearticulated vowels tend to have higher PC2 scores. Observing the GAMM fits for this tone shown in Figure 5, we can recall that rearticulation is expressed differently for this tone: instead of an SoE dip which falls and rises, SoE for ML toned rearticulated vowels falls monotonically, aligning more closely with numerically higher PC2 score contributions to contour shape. In this sense, the statistical interaction observed in this PC confirms the tone-dependent realization of rearticulation over the time course of the vowel.
Finally, PC3 can be characterized as encoding the presence or absence of a dip in SoE in the middle of the vowel (PC3 in Panel A). In this sense, it is similar to PC1. However, it does not encode as much global height variation, and instead is mostly an indication of dipping in the middle of the vowel. In accordance with this qualitative observation, we have the clear expectation that rearticulation should cause variation in the PC. This is confirmed by the model, (Figure 6, Panel F) which shows credibly lower PC3 scores for rearticulated vowels (β = –0.79, 95% CrI = [–1.17, –0.42]; pd = 100), where lower scores map to more of an SoE dip. This difference was credible for all tones (pds > 99, save for LL where pd = 97), evidencing a clear tone-general manifestation of word shape in this PC. Comparisons across lexical tone also show that PC3 variation is less driven by tone as compared to the preceding 2 PCs, though there are several credible differences where HH < {LL, LM, ML} and LH < {ML, LL} in terms of PC3 score.
In sum, the FPCA analysis confirms the GAMM modeling in showing that modes of variation in the SoE trajectories are reflective of both tone and rearticulation. Moreover, even for each of the first three PCs analyzed here, credible interactions between tone and word shape indicated that a particular PC was impacted by both of these factors. The patterns overall comported with what was observed more qualitatively in the GAMM modeling analysis; rearticulation was associated with overall lower SoE (higher PC1 score) and more of an SoE dip in the analyzed interval (lower PC2 and PC3 scores, though PC2 variation was smaller as a function of rearticulation). In addition to overall variation in PC scores based on tone, notable tone-based interactions emerged. For example, ML tone showed evidence for the opposite of the main effect for rearticulation in PC2 scores. In observing the actual contours fit by the GAMMs in Figure 5, it became apparent that this difference arises from the tone-specific realization of rearticulation, wherein ML rearticulated vowels were realized more as falling instead of dipping (reflected in a higher PC2 score overall). Patterns such as this show clearly that both dimensions of contrast – tone and rearticulation – are intimately tied up in voice quality dynamics, as measured with SoE.
3.4 Quantifying speaker variability
Given the group-level results presented above, one point of interest is the extent to which individual speakers align with these results, as already noted in the substantial variation across speakers that was identified in Section 3.2. In this section, we briefly quantify and examine individual variation, focusing on the overall word shape differences. As previously noted in Figure 3, speakers do certainly vary in the extent they produce SoE modulations associated with re-articulation, leading us to examine these patterns in a bit more detail here.
To this end, we modified two of the previous analyses to be speaker specific. For a numerical and objective quantification of speaker differences, we modified the FPCA analysis to include Speaker as a fixed effect. While individual speakers are certainly conceptually in line with random effects, fitting them as a fixed effect in this case allows us to estimate speaker-wise difference in PC scores as a function of rearticulation, with, critically, the same PC scores modeled as in the group-level analysis. With this structure, we can estimate marginal contrasts for word shape and for each speaker, asking, for example, does Speaker 1 show a credible difference in PC1 across word shapes? Looking at the constellation of PC scores and whether or not there are credible differences across speakers allows us to get a bird’s-eye, quantified view of individual variation. To provide a more qualitative assessment of individual variability, not unlike Figure 3, we fit a GAMM to each speaker and word shape combination, mirroring the analysis of overall word shape effects. This allows us to get a more specific view of the actual SoE trajectories produced under these conditions, and can be related to the PC score evaluation as a way of understanding how PC score variation maps to actual trajectory shapes. (For a summary of how each PC score corresponds to a different trajectory shape, see Table 1.)
Figure 7 below shows both of these results. In Panel A, the estimated contrast for the shape variable is plotted in three dimensions, one for each PC. The x axis is the word shape contrast for PC1 (see Table 1 for how varying each PC corresponds to deviations from the mean trajectory). Note that this is the estimated difference in PC1 scores between rearticulated and modal vowels, when the difference is positive, rearticulated vowels have a higher PC1 score (a more dipping shape as shown in Figure 5 Panel A). The error bars along the x axis are 95% CrI for the estimated contrast, when they exclude the value of zero, we conclude there is credible evidence for a difference in PC1 score based on shape. As a specific illustration, we can note that Speaker 9 has an estimated difference in PC1 score of approximately zero: no credible evidence for an effect of word shape on PC1 for this speaker. Conversely, Speaker 4 has the largest estimated difference, and a clearly credible (non-zero) effect. The word shape contrast for PC3 is shown in the y axis, chosen because it was more clearly related to word shape differences. Finally, the word shape contrast for PC2 is shown in terms of the coloration of each speaker’s point, represented at right on the color scale. When a PC2 contrast is credibly non-zero, the shape is a triangle, otherwise a circle. In aggregate, this three dimensional representation shows if individual speakers have credible differences in each of the PC components, if and how these different aspects of SoE variation co-vary across speakers. Panel B below shows the GAMM smooths fit to each speaker and word shape, plotted together.
Panel A (top): PC score contrasts for word shape, computed for each individual speaker, from the individual analysis showing PC1 on the x axis, PC3 on the y axis, and PC2 in terms of point coloration, shown in the legend on the right. Panel B (bottom): By-speaker smooths for modal (blue solid blue line) and rearticulated (red dashed line) vowels.

Figure 7 Long description
The image contains two panels. Panel A (top) features a scatter plot with PC1 on the x-axis, PC3 on the y-axis, and PC2 represented by point coloration. Each point corresponds to an individual speaker, with some points marked as credible PC2 contrast. Panel B (bottom) displays multiple line graphs, each representing a different speaker. The graphs show smooths for modal vowels with a solid blue line and rearticulated vowels with a dashed red line. The x-axis represents proportional vowel duration, and the y-axis represents scaled log SoE (fit).
We first consider some basic observations of this representation of inter-speaker variability. There are a set of speakers who show credible differences in all three PCs: Speakers 1, 4, 10 and 14. These speakers, as can be seen in Panel B, produce rearticulated vowels with pronounced dips in SoE which involve a clear lowering, and centralized dipping. This shape evidently combined aspects of each of the three PCs to the extent that they all are differentiated for these speakers. These four speakers can thus be considered maximalists in terms of their production of rearticulation in SoE: they produced large dips which involve lowering, central dipping and the early dip-then-rise shape associated with negative PC2 scores.
Speakers 8 and 11 represent a similar qualitative dip, as shown in Panel B, though differ from the aforementioned four in not having a credible difference in PC2 scores as a function of rearticulation. Recall that in the group-level analysis PC2 was the least associated with re-articulation. While both of the PC2 scores for these two speakers lean in the direction that is expected (a negative estimate, meaning rearticulated vowels have more negative PC2 scores, the lack of a credible difference means that component of variation is not consistent or large enough for these two speakers to constitute a credible effect. Speaker 11 in particular shows a smaller (less-negative) contrast, which we can hypothesize is related to the fact that their productions of rearticulated vowels do not rise quite as much at the end, though do not contain as much variation in the vein of PC2. For each of the six aforementioned speakers though we can conclude they are producing large and robust dips in SoE, evident in credible differences in PC1 and PC3 in all cases.
Next, there is a group of speakers who show credible differences for PC1. Speaker 3 shows a very slight credible difference for PC1 alone. This is as expected given Speaker 3’s extremely slight difference between rearticulated and model vowels in Panel B (with rearticulated vowels having a very slight dip). Speakers 6 and 12 show credible differences for PC1 and PC3, which matches the qualitative patterns shown in panel B – both speakers have rearticulated vowels which dip slightly in SoE word medially. Interestingly, Speaker 13 appears to be a slight outlier. This speaker shows credible differences in PC1 and PC2, but not PC3.
Finally, we have a group of speakers who did not show credible differences in any PC score. This group includes five speakers out of our 14 speakers, which all cluster around the origin in the plot in Panel A. Speaker 7 showed very weak differences in PC1 which were not credible. Lastly, Speakers 2, 5, and 9 showed no credible PC score differences at all. Speaker 2 shows a slight difference in PC1 which is not credible, but interestingly this difference is in the opposite direction to other speakers with a PC1 difference.
4. Discussion and conclusions
This study provided an examination of lexical tone and contrastive glottalization in San Sebastián del Monte Mixtec rearticulated vowels. The language, being laryngeally complex in the terminology of Silverman (Reference Silverman1997a) provides a good opportunity to study both lexical tone and contrastive glottalization, as well as interactions between the two. The main focus of the study was twofold: first, to better understand the phonetic realization of lexical tone and rearticulated vowels in San Sebastián del Monte Mixtec, and second, to examine any potential interactions between lexical tone and voice quality.
In terms of f0, lexical tone patterns as expected given tonal labels, largely corroborating the findings of Cortés et al. (Reference Cortés, Mantenuto and Steffman2023). Strength of Excitation (SoE) was used to study the degree and phasing of the contrastive glottal gesture in rearticulated vowels. Garellek et al. (Reference Garellek, Chai, Huang and Van Doren2021) found that a dip in SoE is a robust acoustic correlate of contrastive glottal gestures across a number of the world’s languages, making it a good measure to quantify rearticulation in our data. Our findings broadly support the results of Garellek et al. (Reference Garellek, Chai, Huang and Van Doren2021) in that SoE is an effective measure of the glottal gesture in these rearticulated vowels. Our findings in SSM indicate that the phasing of the glottal gesture may be affected by lexical tone; rearticulated ML and LL tokens have a dip in SoE which does not rise, as reported in Garellek et al. (Reference Garellek, Chai, Huang and Van Doren2021). Other tones, however, have a dip in SoE which rises towards the end of the vowel. Garellek et al. (Reference Garellek, Chai, Huang and Van Doren2021) did not report tone information, so it is unclear whether that pattern was also present in their data.
In addition, voice quality results for rearticulated vowels in SSM are generally consistent with those reported in Gerfen & Baker (Reference Gerfen and Baker2005) for laryngealized vowels in Coatzospan Mixtec. Like Gerfen & Baker (Reference Gerfen and Baker2005), we observed interspeaker variation in the production of non-modal vowels. By comparing PC scores, we found that different speakers make different adjustments in SoE when producing rearticulated vowels. In addition, Gerfen & Baker found that Coatzospan Mixtec laryngealized vowels were produced with a dip in amplitude in the middle of the vowel, as well as lower H1–H2 than their modal counterparts. This aligns with our finding that there is a dip in SoE for rearticulated vowels, as compared to modal vowels. Lastly, we sought to expand on the production study of Gerfen & Baker (Reference Gerfen and Baker2005), which examined two tones (HH and LH), by including seven tones, and we found that phasing and degree of the glottal gesture in non-modal vowels did vary by tone. This is significant because it indicates that the production of a glottal gesture is affected by tonal category.
We found that lexical tone impacts SoE, which we presume is linked to non-modal phonation (cf. Garellek et al. Reference Garellek, Chai, Huang and Van Doren2021). This impact includes long modal vowels (Figure 5). Difference smooths (Figure 9, in the Appendix) show that SoE between 8 of fifteen tonal pairs examined for these long vowels was different in some region of the SoE contour. Since there is no contrastive glottal gesture in long modal vowels, differences in f0 across tones can only be explained through some influence of tone on voice quality. In addition, SoE was significantly different across most tones for rearticulated vowel tokens, with 17 of 21 tonal pairs being significantly different for some portion of the vowel, according to the GAMM analysis (Figure 8 in the Appendix). Moreover, the FPCA modeling of the SoE contours for rearticulated vowel tokens show clearly that SoE variation is credibly impacted by tone, most clearly for the first two PCs. In sum, this suggests that voice quality serves as a non-f0 correlate of lexical tone in SSM.
In general, our findings on the nature of interaction between lexical tone, voice quality, and contrastive glottalization corroborate Silverman (Reference Silverman1997a, Reference Silverman1997b) in that contrastive voice quality is necessarily sequenced with more modal phonation, which carries tonal information. Rearticulated vowels consist of more modal vowel portions at the beginning and end of the vowel, with a glottalized vowel-medial portion which contains the glottal gesture – with the exception of the ML and LL tones, which did not show a rise in SoE following the glottal gesture. While lexical tone does impact voice quality (as we observed in CVV data), the degree of glottalization is far smaller and less dynamic than the contrastive glottal gesture in rearticulated vowels. Therefore, while voice quality may be a correlate of lexical tone in SSM, tone-based voice quality differences remain distinct from contrastive voice quality differences in rearticulated vowels.
One interesting finding of this study (mentioned in the preceding paragraph) is that SoE in rearticulated vowels was not the same across tones. So, tone-based variation in voice quality is not entirely constrained by the presence of a contrastive glottal gesture. In this sense the results contribute to our understanding of how glottal events are manifest in languages with lexical tone, and complement previous research in Otomanguean, in particular in evidencing intricately linked realization of both dimensions. Previous studies, like this one, have found various interrelations between voice quality and tone in Otomanguean. For instance, Garellek & Keating (Reference Garellek and Keating2011) found that voice quality contrasts in Jalapa Mazatec can be measured using different acoustic qualities depending on tone. In addition, Chávez Peón (Reference Chávez-Peón2001) found that creaky vowels in San Lucas Quiaviní Zapotec had more or less jitter at the midpoint of the vowel depending on tone. Lastly, Dicanio (Reference DiCanio2010) found that tonal category was important for the phasing of glottal consonants in Itunyoso Trique. In the broadest terms, our results align with these in showing that tone and rearticulation jointly influence dynamics of SoE across SSM vowels.
Our findings suggest that ideas around laryngeal complexity may be extended – not only are tone and glottal gestures sequenced with one another, tone category itself may exert a mediating influence into this phasing equation. In sum, the results contribute to our understanding of how glottal events are manifest in languages with lexical tone, and complement previous research in Otomanguean, in particular in evidencing intricately linked realization of both dimensions.
4.1 Limitations and future directions
There is much more interesting phonetic research left to be explored in SSM Mixtec. For instance, SSM Mixtec has checked vowels in addition to rearticulated vowels. A future study is needed to examine the glottal gesture in checked vowels and its interactions with lexical tone. An additional limitation of this study was that no f0 data was examined from rearticulated vowel tokens, due to substantial f0 tracking errors. Future research could include f0 data for rearticulated vowels, to determine whether the glottal gesture might have any impact on f0 across lexical tones.
Another limitation of the present study is that our target words, while produced in an utterance as compared to isolation, were elicited in relatively careful speech, and in the context of a phrase which did not vary. This leaves open the question of how the phasing and strength of the glottal gesture in rearticulated vowels will play out in more variable contexts, and naturalistic speech. One possible future avenue is thus to examine these effects in more naturalistic speech contexts, in for example, a communicative task like the Map Task (e.g., Brown et al. Reference Brown, Anderson, Yule and Shillcock1983). What we can assume is that the patterns we see here are most representative of careful speech, in which we can presume the effects of rearticulation, and intersection with tone, will be most clearly produced by speakers. Testing if and how these effects are reduced or modulated by contextual factors will be another important piece of the puzzle.
One aim of this study was identifying possible non-f0 correlates of lexical tone in SSM Mixtec. We have identified SoE as an acoustic correlate of lexical tone production in SSM, which we take to constitute a measure of voice quality changes, as also reflected in rearticulated vowels. It remains to be seen whether and how voice quality variation plays a role as a cue in speech perception. Whereas some research on Mixtec has examined perception of re-articulation (Gerfen & Baker Reference Gerfen and Baker2005), we are not aware of existing research on the perception of lexical tone in Mixtec varieties. Given the production patterns documented in this study, SSM represents a good extension along these lines. A fundamental question to address is the relative perceptual import of f0 and non-f0 cues to lexical tone, which could be manipulated along continua as in many cue-weighting studies, or investigated by resynthesizing f0 across base files of differing lexical tones, examining how perceptual processing of these correlates operates when they are in conflict. Examining how this works for particular pairs of tones that share relatively similar SoE profiles (e.g., relatively flat SoE contours for modal LH and LM tones), or are more distinct, would present another comparison of interest. Though modal vowels seem a logical starting point to address this question, further exploring if/how patterns differ in rearticulated tone perception would constitute an important step. Each of these possible studies would help provide insight into how the acoustic differences shown here translate perceptually.
To answer a different but related question, another valuable extension would be to study the cues relevant to the perception of rearticulation in SSM, in similar fashion to Gerfen & Baker (Reference Gerfen and Baker2005). This question becomes particularly interesting in light of the tone-dependent manifestation of rearticulation seen in this study. A test of how cue weighting for perception of rearticulation may vary across tonal context strikes us as another intriguing perception-oriented question to address.
Extending the study in these ways would provide a fuller understanding of lexical tone and glottalization in SSM, and in doing so, contribute to the overall knowledge of laryngeal contrasts cross-linguistically.
Acknowledgements
First and foremost, we want to thank the community of San Sebastiaán del Monte for their invaluable help with this project. Without their assistance, this project simply would not be possible. Secondly, many thanks to the University of Wisconsin – Madison Language Sciences program for providing the funding for this work.
Appendix A
Word list
List of all words elicited in the study

Table 2 Long description
A table listing words in SSM, IPA, and English. The table has three columns: SSM, IPA, and English. It contains 33 rows, each row listing a word in SSM, its IPA representation, and its English translation. The words include pimple, female, lay (an egg), to be cold, new, well (adjective), strange, long time, wear (verb), hard, strong noise, stone, happy, you, word, plate, foot, ash, empty (verb, future tense), mouse, little, deceased, pile (verb, future tense), house, night, metal, ring (noun), frequently, raw, bottom, there, sweat lodge, we, baby, hen, and here.
Appendix B
PC scores for FPCA analysis
Summary of marginal estimates for tone pairs, for each PC, from the FPCA analysis. The contrast column shows the tone pair compared with median, lower and upper CrI, and pd

Table 3 Long description
The table presents a detailed summary of marginal estimates for tone pairs across three principal components (PC1, PC2, PC3) from the FPCA analysis. It includes columns for contrast, estimate, lower 95% credible interval (CrI), upper 95% credible interval (CrI), and probability of direction (pd). The table has 30 rows and 5 columns. Each row represents a specific tone pair comparison, such as HH - LH, HH - LL, and so on, across the three principal components. The estimates range from negative to positive values, indicating the direction and magnitude of the effect. The credible intervals provide a range of uncertainty around these estimates, and the probability of direction indicates the likelihood that the effect is in the specified direction. Notable trends include higher estimates and narrower credible intervals for certain tone pairs, suggesting stronger and more precise effects. For example, in PC1, the contrast HH - LL has an estimate of 2.69 with a credible interval ranging from 3.76 to 1.61, and a probability of direction of 100. In contrast, some tone pairs show estimates close to zero with wider credible intervals, indicating less certain effects. Overall, the table provides a comprehensive overview of the marginal estimates for tone pairs across different principal components, highlighting both strong and uncertain effects.
Summary of marginal estimates for the effect of word shape for each tone, and for each PC, from the FPCA analysis. The estimates are shown with the median, lower and upper CrI, and pd

Table 4 Long description
The table presents a detailed summary of marginal estimates for the effect of word shape across different tones and principal components, derived from a functional principal component analysis. It includes columns for tone, contrast for shape, lower 95% credible interval, upper 95% credible interval, and probability density. The table is organized into three sections based on principal components (PC1, PC2, PC3), each with various tone and contrast combinations. Notable trends include high probability densities for certain tone and contrast combinations, particularly in PC1 and PC3. The estimates vary significantly across different tones and principal components, highlighting the nuanced effects of word shape on these variables.
Appendix C
Pairwise difference smooths for SoE modeling
For rearticulated vowel tokens (Figure 8), all tone pairs had some portion of the vowel during which the smooths were significantly different, except for HH & LH, HH & MM, LL & ML, and MM & LH. The MM & LM pair of smooths are only significantly different for a brief period toward the beginning of the vowel. The same difference smooths were calculated for long modal vowel tokens (Figure 9). For CVV smooths, the tonal pairs which showed a statistically significant difference for some portion of the vowel were HH & LL, LH & LM, LL & LH, LL & ML, ML & LM, MM & LL, and MM & LM. The HH & LH pair also showed a significant difference, but only briefly at the middle of the vowel. Overall, the pairwise inspection of difference smooths indicates that there are significant differences in SoE between lexical tones in both word shapes. These results indicate that voice quality may enhance tonal contrasts in both rearticulated and long modal vowels. For rearticulated vowels, lexical tone may affect the phasing and degree of glottalization in the contrastive glottal gesture.
Difference smooths for SoE in rearticulated vowels, each plot shows the smooth for one tone pair.

Figure 8 Long description
The image contains multiple line graphs arranged in a grid, each representing the difference in scaled log SoE for different tone pairs over proportional vowel duration. The x-axis represents the proportional vowel duration ranging from 0.25 to 0.75, while the y-axis represents the scaled log SoE difference ranging from -1 to 1. Each plot shows the smooth for one tone pair, with significant differences highlighted in orange and non-significant differences in black. The tone pairs are labeled at the top of each plot, such as HH, LH, LL, LM, ML, MM, HL, and LH. The graphs illustrate how the difference in SoE varies across different tone pairs and vowel durations, providing insights into the impact of lexical tone on SoE.
Difference smooths for SoE in CVV vowels, each plot shows the smooth for one tone pair.

Figure 9 Long description
The image contains twelve line graphs arranged in a grid, each representing scaled log SoE (difference) across proportional vowel duration for different tone pairs. The x-axis represents proportional vowel duration ranging from 0.25 to 0.75, while the y-axis represents scaled log SoE (difference) ranging from -1.5 to 1.5. Each graph compares two tone pairs, labeled at the top and bottom of each plot. The lines within each graph are color-coded to indicate significant differences: black lines indicate no significant difference, and orange lines indicate a significant difference. The graphs show various trends, with some lines remaining relatively flat and others showing upward or downward curves. The shaded areas around the lines represent confidence intervals. The overall purpose of the graphs is to illustrate how the scaled log SoE differences vary with proportional vowel duration for different tone pairs, highlighting instances where significant differences are observed.


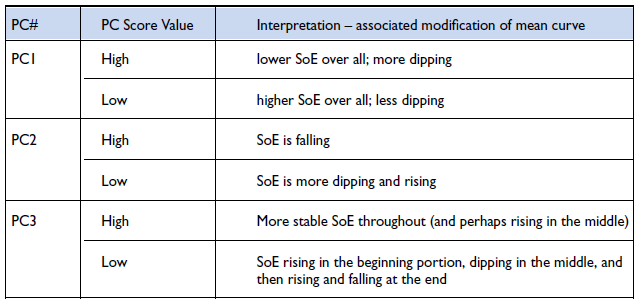

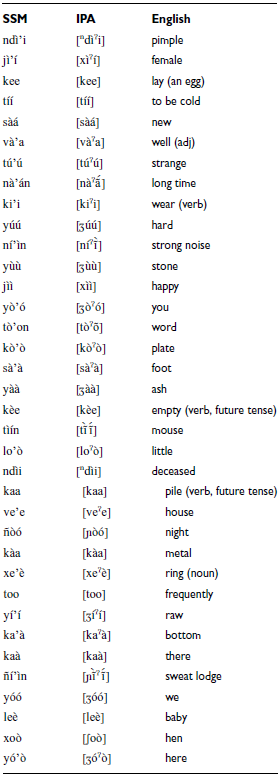
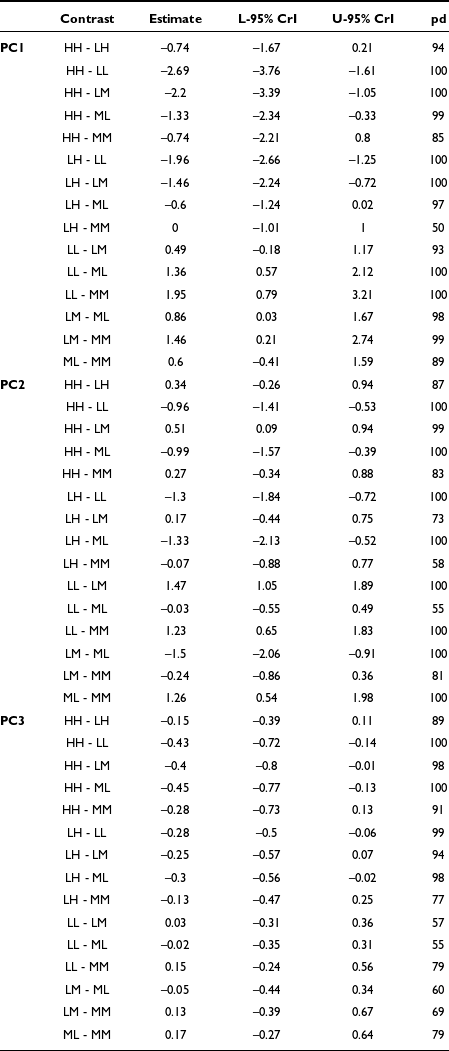
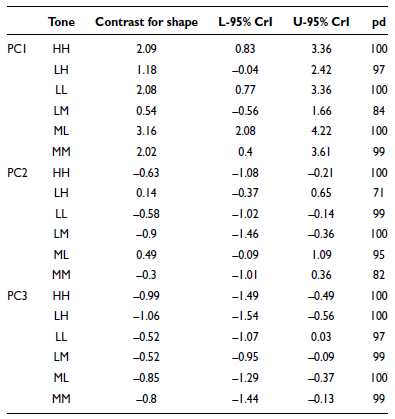


 Open access