


Americans’ persistent lack of confidence in the institutions of federal democracy is well documented (e.g., Hetherington Reference Hetherington2005; Lipset and Schneider Reference Lipset and Schneider1983). This dissatisfaction extends to the nation’s duopolistic party system, with mass frustrations evident in periodic bursts of support for third-party and independent candidates in presidential races. Though the modern presidency has only ever been won by Democratic and Republican candidates, and third-party and independent candidates have rarely secured seats in the U.S. Congress, there are growing signs of popular and elite dissatisfaction with the nation’s party system. One recent survey, for example, indicates that a large majority (71%) of Americans wish there were more political parties to choose from (Pew Research Center 2022).
The emergence of third-party candidates and new parties in the United States has, to date, occurred independent of changes in the federal electoral system. Indeed, party systems are not shaped by electoral systems alone. The number and ideological diversity of parties are also influenced by factors such as socioethnic fractionalization (Neto and Cox Reference Neto and Cox1997; Ordeshook and Shvetsova Reference Ordeshook and Shvetsova1994), the number of salient issue dimensions (Taagepera Reference Taagepera1999), and economic inequality (Garand Reference Garand2010; McCarty, Poole, and Rosenthal Reference McCarty, Poole and Rosenthal2006). Electoral systems can, however, play a crucial role in shaping party systems, including the number of parties that win legislative seats (Cox Reference Cox1997; Lijphart Reference Lijphart2012; McCarty Reference McCarty2019). It is therefore perhaps unsurprising that calls for party-system change in the United States have gone hand-in-hand with mass mobilizations against the single-member plurality system currently used to elect members of Congress in the great majority of states, as well as in subnational contests. This mobilizing has recently resulted in significant electoral system change in Alaska and Maine, in addition to New York City, Washington, DC, and dozens of other cities. Yet, despite these important developments, there is only a small body of published research on Americans’ attitudes toward electoral system reform and its connection to party system change, and very few studies focus on these issues as they relate to congressional electoral reform.
Policymakers and advocates pursuing electoral system reform, such as the adoption of ranked-choice voting (RCV) or proportional representation (PR), require credible evidence of public support for such setups. Given the far-reaching societal consequences of electoral systems, the evidentiary standard for making claims about citizens’ preferences over electoral reform should be strict. Meeting this standard is challenging, as citizens are not likely to fully grasp differences between electoral systems, such as threshold rules, ballot structures, or vote transfer mechanisms (e.g., Karp Reference Karp2006; Rich Reference Rich2014). Attitudes toward electoral systems can more readily be gauged with reference to their major outputs or effects, which are easier for voters to understand and more meaningful to them. Two such highly salient and consequential features of the U.S. political system that would almost certainly be impacted by an electoral system change are the number of parties sitting in Congress (i.e., legislative fractionalization) and the ideological spread among those parties (i.e., legislative polarization). In this article, we study Americans’ appetite for electoral system change by focusing on these two key party system features.
When it comes to assessing attitudes toward electoral systems, standard public opinion survey questions come up short. This is because their outcomes are both numerous and intertwined, and a battery of survey items cannot begin to capture this complexity without being long and fatiguing. We therefore construct a pair of studies that expose respondents to electoral system- and party system-relevant information in an easy-to-understand manner. Our studies present information holistically, with the treatments in each simultaneously varying electoral systems’ impacts on legislative fractionalization and polarization. The designs that we employ are definitionally experiments in that participants are randomly assigned to different conditions, but our primary objective differs from the usual experimental goal of ascertaining particular treatment effects. Instead, we use randomization to ease participants’ cognitive burden while duly capturing the complexity of electoral systems and their consequences for the party system. Given randomization, the effects we estimate are also credibly causal.
In particular, we use conjoint and vignette experiments, both of which were developed to study preferences over multidimensional stimuli (Hainmueller, Hopkins, and Yamamoto Reference Hainmueller, Hopkins and Yamamoto2014; Rossi and Anderson Reference Rossi, Anderson, Rossi and Nock1982). The conjoint approach is valuable because it is especially adept at assessing multidimensional preferences. Conjoint experiments have, for example, been employed to capture opinion over complex, multifaceted phenomena, such as party manifestos (Horiuchi, Smith, and Yamamoto Reference Horiuchi, Smith and Yamamoto2018), governing coalitions (Green-Pedersen and Hjermitslev Reference Green-Pedersen and Hjermitslev2024), and the qualities of potential immigrants (Hainmueller and Hopkins Reference Hainmueller and Hopkins2015; Hainmueller, Hopkins, and Yamamoto Reference Hainmueller, Hopkins and Yamamoto2014). Moreover, they have been successfully validated against real-world data and well-founded a priori expectations (Hainmueller, Hangartner, and Yamamoto Reference Hainmueller, Hangartner and Yamamoto2015; Myers, Zhirkov, and Lunz Trujillo Reference Myers, Zhirkov and Lunz Trujillo2024). For its part, the vignette approach, which has been used for over 70 years (e.g., Herskovits Reference Herskovits1950), is particularly adept at preserving “key properties of the situations of interest, by tailoring both their content and format to the appropriate context” (Baguley, Dunham, and Steer Reference Baguley, Dunham and Steer2022, 1145).
In Study 1, we use the conjoint approach to ascertain the effects of various electoral and partisan features, including the number of parties sitting in the U.S. House of Representatives and ideological polarization among those parties, on citizens’ attitudes toward electoral reform. In Study 2, we use the vignette approach via both a between- and a within-subjects experiment. Our vignettes describe the results of a putative electoral system change and its impact on the number of parties in the House and their ideological positions. This again allows us to identify the effect of the number and polarization of parties on citizens’ evaluation of reforms.
While both studies are built to test the same hypotheses, their designs are different. This is a feature rather than a bug; it helps ensure that any inferences about attitudes toward electoral reform are not an artifact of a particular instrument. Rather, consistent findings across our studies likely reflect genuine preferences toward the reform of U.S. House elections and apply outside of our controlled environments.
We anchor citizens’ evaluations of electoral reform in a theoretical framework that sees “voice,” “governability,” and “responsiveness” as key democratic products valued by citizens. Voice entails that citizens’ views and policy preferences are aired and debated, governability pertains to the ability of elected representatives to pass legislation, and responsiveness implies that the legislation that is passed is reflective of citizens’ views and policy preferences. We hypothesize that Americans recognize the benefits of multiple and ideologically varied parties for voice, while at the same time viewing legislative fractionalization and polarization as harmful to governability and responsiveness. This, in addition to Americans’ recent experiences with polarization, leads us to anticipate that Americans are drawn to systems that break the two-party duopoly in Congress but do not compromise the potential for a moderate politics.
In line with our expectations, results from both studies indicate that Americans react very negatively to reforms that lead to pronounced polarization in terms of their perceptions of governability and responsiveness. Unexpectedly, this is true even with regard to evaluations of voice. Americans respond less consistently to reforms that induce multipartism. In Study 1, we find some evidence that, as expected, people see multiparty competition as beneficial for voice, but there is no evidence that it shapes other evaluations. In Study 2, consistent with our expectations, while respondents see multipartism as harmful to governability, they express an overall preference for multiparty competition and view it as beneficial for voice. Respondents even see multiple parties as boosting responsiveness, a finding that runs counter to our expectations. In general, preferences for multiparty competition are strongest when it is not accompanied by polarization.
Americans may be attracted to the enhanced opportunities for voice that accompany the pluralism afforded by a multiparty system, but their aversion to polarization and concerns about governability temper this enthusiasm. In the conclusion, we reflect on the consistencies and divergences across our findings. We also consider the implications of our findings for electoral reformers, and we discuss the limitations of our research and pathways for future work.
RELEVANT LITERATURE
Scholars of political behavior have long been interested in electoral systems, and the vast majority of resultant work focuses on the consequences of the proportional versus majoritarian varieties. This includes research on how electoral proportionality influences the composition of legislatures and cabinets (e.g., Golder and Lloyd Reference Golder and Lloyd2014; Golder and Stramski Reference Golder and Stramski2010; Huber and Powell Reference Huber and Powell1994; Powell Reference Powell2019), government longevity (e.g., Furlong Reference Furlong1991; Jäckle Reference Jäckle2009), policy responsiveness and legislative outcomes (e.g., Baraldi Reference Baraldi2008; Coman Reference Coman2015; Lijphart Reference Lijphart2012; Soroka and Wlezien Reference Soroka and Wlezien2005), electoral participation (e.g., Cox Reference Cox2015; Gallego, Rico, and Anduiza Reference Gallego, Rico and Anduiza2012; Selb Reference Selb2009; Smith Reference Smith, Herron, Pekkanen and Shugart2018), economic policy (e.g., Hays Reference Hays2022; Iversen and Soskice Reference Iversen and Soskice2006), and even regime stability (e.g., Bohrer Reference Bohrer1997; Diskin, Diskin, and Hazan Reference Diskin, Diskin and Hazan2005). Likely owing to the relative rarity with which it is used, a smaller literature has considered the consequences of RCV, focusing on outcomes, such as party system moderation (e.g., Bean Reference Bean1997; Mussel and Schlechta Reference Mussel and Schlechta2024; Reilly Reference Reilly2018), ethnic conflict (e.g., Fraenkel and Grofman Reference Fraenkel and Grofman2004; Horowitz Reference Horowitz and Montville1991; Reilly Reference Reilly2001), and strategic voting (e.g., Cox Reference Cox1997; Eggers and Nowacki Reference Eggers and Nowacki2024). Important research also exists on the causes and correlates of the reform of electoral systems (e.g., Boix Reference Boix1999; Dunleavy and Margetts Reference Dunleavy and Margetts1995; Hooghe and Deschouwer Reference Hooghe and Deschouwer2011; Norris Reference Norris2011; O’Brochta and Cunha Silva Reference O’Brochta and Cunha Silva2022; Rahat and Hazan Reference Rahat and Hazan2011; Renwick Reference Renwick2010; Sakamoto Reference Sakamoto1999). Researchers have shown, however, much less interest in using individual-level data to study mass attitudes toward electoral system reform. Against the backdrop of growing concerns about democratic deconsolidation (Foa and Mounk Reference Foa and Mounk2017; Levitsky and Ziblatt Reference Levitsky and Ziblatt2018), and not least given ongoing efforts to re-engineer electoral institutions in ways that undermine democratic principles (Grumbach Reference Grumbach2023; Haggard and Kaufman Reference Haggard and Kaufman2021), work has begun to appear on this question in recent years.
The growing body of research examining citizen attitudes toward the reform of electoral institutions can be divided into two literatures. The first investigates attitudes related to electoral systems, the primary focus of which is gauging popular preferences for majoritarian versus proportional approaches to casting and counting votes. Most studies that examine citizen attitudes toward majoritarian and proportional electoral systems rely on data from experiments, with voting simulations being by far the most common approach. The second examines citizen attitudes toward other election-related rules and processes. This includes studies of citizen preferences regarding voter identification requirements, absentee voting, same-day registration, as well as redistricting, election timing, and systems used to elect executives (such as the Electoral College in the United States).
Few published studies examine U.S. public opinion regarding federal electoral systems.Footnote 1 Almost all of this work relies on data from simulated voting tasks, and most of it focuses on presidential elections. Anthony et al. (Reference Anthony, Kimball, Santucci and Scott2024) find that a majority of Americans prefer single-choice over RCV for the presidency, and this holds true across different racial groups and for Democrats as well as Republicans. Nielson (Reference Nielson2017) also finds that participants in a presidential voting simulation do not prefer RCV to plurality or majoritarian rules; nor do participants in the RCV treatment think the election outcome is fairer than those in plurality or majoritarian treatment groups. Blais, Plescia, and Sevi (Reference Blais, Plescia, Högström and Péloquin-Skulski2021) come to a similar conclusion based on a voting simulation carried out during Super Tuesday Democratic presidential primaries: the current system of single-choice voting is preferred over ranked-choice, approval, and point (or score) voting, which the authors argue reflects a status quo bias, as study participants’ views are strongly correlated with age.Footnote 2
Taken together, this small body of work on attitudes toward the system used to elect the president strongly indicates that Americans do not have an appetite for change. However, the results of public opinion research on the system used to elect members of Congress suggest a greater openness to change. It is important to note, however, that the evidence base for this conclusion is small. We know of only three published studies in this area. Bowler and Donovan (Reference Bowler and Donovan2007) find that respondents who self-identify as national electoral losers are more supportive of using PR to elect members of Congress, arguing that this may be due to electoral losers being less risk averse. McCarthy and Santucci (Reference McCarthy and Santucci2021) report observational results from two surveys that poll Americans on their support for using RCV to elect House members. In one, a majority supports RCV; in the other, only a small minority supports RCV, though this grows to a majority among younger voters. By contrast, using data from a vignette experiment focused on a Wyoming Senate election, Cerrone and McClintock (Reference Cerrone and McClintock2023) find that voters are less satisfied with ranked-choice voting than plurality and run-off rules, especially when the former produces a come-from-behind victory.
Given the small number of U.S. studies and the aims of the current study, it is instructive to review the findings of research using data from other (mainly European) high-income democracies to investigate mass attitudes toward legislative electoral systems. This research provides strong evidence of public support for proportional rules in national legislative elections (over majoritarian ones) and multipartism (over two-party competition). Jankowski, Linhart, and Tepe (Reference Jankowski, Linhart and Tepe2019), using a conjoint experiment, find that Germans prefer proportional electoral systems and the legislative representation of a diversity of parties. Similarly, Singh and Williams (Reference Singh and Williams2021), also using data from a conjoint experiment, find that Chileans prefer a multiparty system (over a two-party one) and a proportional (rather than a majoritarian) votes-to-seats transfer. Högström, Blais, and Plescia (Reference Högström, Blais and Plescia2022), using data from a survey experiment with a within-subjects design fielded in Austria, England, Ireland, and Sweden, find that voters are more satisfied with a ballot that gives them more parties to choose from. That said, the same experiment showed that study participants differ little in their overall satisfaction with the voting rule that allowed them to rank parties compared to when they were not (Blais, Plescia, and Sevi Reference Blais, Plescia and Sevi2021).
In studies that address the issue of government formation, evidence of public support for proportional electoral rules and multipartism is more mixed and nuanced. Blais et al. (Reference Blais, Bol, Bowler, Farrell, Fredén, Foucault and Heisbourg2023) find that people across several West European countries prefer electoral outcomes that produce more parties in parliament but fewer parties in government. Arnesen et al. (Reference Arnesen, Bergh, Christensen and Aardal2021) find that Norwegians’ support for increased proportionality is lower if they are told it helps small parties or harms governability. Blais, Sevi, and Plescia (Reference Blais, Sevi and Plescia2022) find that Canadians somewhat prefer proportional legislative outcomes, but that this preference is conditional on partisan considerations and which parties are likely to form the government. Similarly, other Europe-focused work (e.g., Blais et al. Reference Blais, Laslier, Poinas and Van Der Straeten2015; Weber Reference Weber2020) shows that people prefer electoral systems that benefit their preferred candidates and parties, and Plescia, Blais, and Högström (Reference Plescia, Blais and Högström2020) find evidence that citizens judge electoral outcomes based on how they affect the performance of their preferred party, with the attitudes of voters of small parties being more affected by the disproportionality of different electoral systems.
Whereas studies focused on citizen attitudes toward electoral systems are split between the United States and other democracies, the vast majority of attitudinal research on reforming other election-related rules and processes relies on U.S. data. This may come as no surprise given the fierce debates surrounding U.S. policymakers’ efforts to curtail voting rights through the imposition of burdens and restrictions (Bentele and O’Brien Reference Bentele and O’Brien2013; Grumbach Reference Grumbach2023), as well as efforts to make it easier (Biggers and Hanmer Reference Biggers and Hanmer2015; Cain, Donovan, and Tolbert Reference Cain, Donovan and Tolbert2011) and even compulsory (Dionne and Rapoport Reference Dionne and Rapoport2022) for citizens to vote.
Though the substantive focus of this second body of work skews toward the United States, its methods are fairly evenly split between pieces using observational survey data and those relying on data from survey experiments (almost all of which are vignette-based). Much of this research underscores partisanship and partisan electoral calculations as important explanations of how U.S. voters view election-related reforms. This includes observational studies of support for voter ID laws (Hood and McKee Reference Hood and McKee2022; Wilson and Brewer Reference Wilson and Brewer2013), Electoral College reform (Aldrich, Reifler, and Munger Reference Aldrich, Reifler and Munger2014), and changing the presidential primary calendar (Tolbert, Redlawsk, and Bowen Reference Tolbert, Redlawsk and Bowen2009). There is also experimental evidence revealing Americans’ partisan support for election-related reforms, including voter ID laws, early voting, and same-day registration (Biggers Reference Biggers2019; Biggers and Bowler Reference Biggers and Bowler2022; McCarthy Reference McCarthy2019). Other experimental work paints, however, a more nuanced picture of how partisanship shapes Americans’ attitudes toward electoral institutions. McCarthy (Reference McCarthy2022) finds that only citizens who strongly identify as members of a political party are likely to choose a gerrymandered map over a nonpartisan one. Biggers (Reference Biggers2023) find that priming fairness reduces but does not eliminate the effect of partisan self-interest in shaping support for different election rules, including early voting, voter purges, the closure of polling stations, and requiring that voters pass a civics test. Finally, Virgin (Reference Virgin2023) finds that individuals are willing to support rule changes that disadvantage their preferred party when these changes advance core personal values related to egalitarianism and moral tolerance.
THEORY
While it is clear that the literature on attitudes toward electoral systems is growing, to date almost no published work focuses on what the American public thinks about how members of the U.S. House of Representatives are or should be elected. This is striking given the profound impact that a House transformed by a different electoral system could have on U.S. politics. Beyond the dearth of empirical research on this subject, questions related to how members of the House are elected, including threshold rules, ballot structures, and vote transfer mechanisms, are arguably esoteric for the average American, not least because most Americans have not experienced voting in a non-plurality electoral system. Given this context, we focus on citizen attitudes toward the concrete structural ramifications of electoral system reform, rather than the abstract idea of reform itself or the technical features of different electoral systems. We specifically address two major consequences of electoral system reform that are highly salient and fundamentally important features of the American political system: namely, the number of political parties sitting in the House (legislative fractionalization) and the diversity of ideologies represented by those parties (legislative polarization).
The focus of the current study is informed by ongoing political debates and mass mobilizations, as well as recent state and local electoral system changes, which have focused on RCV and PR as alternatives to the current first-past-the-post system used to elect members of Congress. More specifically, it is informed by existing research that links RCV and PR to the number and ideological diversity of legislative parties. This literature is especially developed with regard to PR, likely due to its status as the world’s most common electoral system. It shows that PR has a robust positive relationship with multipartism, including in presidential systems (e.g., Lijphart Reference Lijphart2012, chapter 8). This literature also shows that PR reliably fosters ideological diversity among parties (Blais and Bodet Reference Blais and Bodet2006; Calvo and Hellwig Reference Calvo and Hellwig2011; Catalinac Reference Catalinac2018; Cox Reference Cox1990; Dow Reference Dow2011; Ezrow Reference Ezrow2010; Matakos, Troumpounis, and Xefteris Reference Matakos, Troumpounis and Xefteris2016).
When it comes to RCV, there is theoretical reason to expect that it should increase the number of electorally viable parties: because ballots transfer from eliminated candidates to subsequent preferences, RCV removes incentives to choose the “lesser of two evils” (Cox Reference Cox1997, chapter 4). Campaigners for RCV highlight that this vote distribution process further engenders party system moderation, as parties must appeal beyond their core supporters to win second- and third-choice preferences. Given RCV’s relative rarity, there are few studies of its connections to multipartism and polarization. However, studies conducted in Brazil and Italy find that runoff voting, which is essentially RCV held over two rounds, increases the number of candidates in mayoral elections while also lessening policy volatility (a signal that extremist parties are absent or powerless) (Bordignon, Nannicini, and Tabellini Reference Bordignon, Nannicini and Tabellini2016; Fujiwara Reference Fujiwara2011). Studies seeking to connect Australia’s use of RCV in lower house elections to polarization have arrived at conflicting conclusions, though, on balance, they credit the system for the country’s comparatively moderate politics (cf. Bean Reference Bean1997; Mussel and Schlechta Reference Mussel and Schlechta2024; Reilly Reference Reilly2018).
We are interested in understanding how Americans evaluate the impact of electoral system change on legislative fractionalization and polarization using specific and explicitly democratic criteria. Few studies have done this, whether in the United States or elsewhere. Almost all work in this area relies exclusively on dependent variables related to citizens’ overall rating of, preference for, or satisfaction with, different electoral systems, which means we lack an understanding of how, if at all, voters evaluate electoral systems based on critical democratic features. An exception is found in the research of Blais et al. (Reference Blais, Bol, Bowler, Farrell, Fredén, Foucault and Heisbourg2023), where European citizens were asked to judge how good or bad different electoral outcomes were for democracy based on vote–seat proportionality and the number of parties in the legislature and government.
We build on and expand this approach by examining whether legislative fractionalization and polarization (resulting from electoral system change) affect perceptions of the ability of the U.S. House to fulfill three key democratic functions. Two of these functions correspond to aspects of democratic representation famously described in the classic work of Pitkin (Reference Pitkin1967). The first is “voice,” which relates to the House being an elected body that is of and by the people, whose members “stand for” and “make present again” (to borrow the words of Pitkin) the voices and preferences of the American public. “Responsiveness” is the second function, which depends on the House serving as an elected body that is for the people—namely, one where elected officials “act for” citizens (again, to quote Pitkin) by passing legislation that is responsive to the needs and wants of the American public. To these two representational functions, we add a third: “governability,” an implied necessary but insufficient condition for legislative responsiveness that is debated in the literature on electoral systems (e.g., Lijphart Reference Lijphart2012; Weaver Reference Weaver2002). This third function refers to the ability of members of the U.S. House to pass legislation.
Studying citizens’ evaluations of the impact of legislative fractionalization and polarization on voice, governability, and responsiveness in the context of electoral system change is not just normatively important but practically important too. Given the findings of existing research and the nature of ongoing national public debates in the United States, we expect that Americans’ assessments of electoral system change—based on its impact on the number and ideological diversity of parties sitting in the U.S. House—will differ depending on the democratic function in question. Evidence of any such democratic tensions and trade-offs in how Americans think about electoral reform and its impact on the number and ideological diversity of parties in the House will point to the complicated nature of structurally reforming how federal legislators are elected.
As already noted, the body of accumulated knowledge on Americans’ attitudes toward reform of electoral systems is small, and especially so on the question of congressional electoral reform. In the remainder of this section, we build on this research, findings from larger bodies of U.S. public opinion and congressional scholarship, and electoral system research that uses data from other countries, to develop hypotheses regarding Americans’ assessments of the impact of electoral system change as a function of legislative fractionalization and polarization.
Voice
As Schattschneider (Reference Schattschneider1942, 1) wrote, “modern democracy is unthinkable save in terms of political parties.” Of the myriad functions that parties fulfill (King Reference King1969), a key one is that they serve as conduits that ensure the voices of ordinary people are heard in legislative chambers. Studies examining the long-term decline in, and low levels of, political trust in the United States (e.g., Chanley, Rudolph, and Rahn Reference Chanley, Rudolph and Rahn2000; Cooper Reference Cooper1999; Dennis and Owen Reference Dennis and Owen2001; Hetherington Reference Hetherington2005; Lipset and Schneider Reference Lipset and Schneider1983) paint a clear picture of how poorly Americans think the current political system is working for them, not least at the national level. This has fueled research efforts to explore Americans’ support for alternative forms of policy making, including “stealth democracy” (Hibbing and Theiss-Morse Reference Hibbing and Theiss-Morse2002) and direct democracy (Bowler, Donovan, and Tolbert Reference Bowler, Donovan and Tolbert1998), and new work has begun to appear on challenges to the two-party duopoly (e.g., Drutman Reference Drutman2020), with one recent survey (Pew Research Center 2022) indicating that a large majority (71%) of Americans often wish there were more political parties to choose from. Against this backdrop of widespread frustration with the political status quo, we hypothesize that Americans will view more parties as providing more voice. Additionally, we hypothesize that Americans will believe citizens’ views and policy preferences will be more fully aired and debated the greater the range of the ideological positions represented by parties in the House.
Hypothesis 1: People view electoral system reforms that increase legislative fractionalization as giving citizens more voice in the democratic process than reforms that do not.
Hypothesis 2: People view electoral system reforms that increase legislative polarization as giving citizens more voice in the democratic process than reforms that do not.
Governability
Legislative gridlock at the federal level has become an increasingly important issue of public concern. In the often-heated debates on this issue, party polarization among elites and affective polarization within the general population are cited as key for understanding the unwillingness and inability of politicians to reach agreement and pass legislation. Scholars have studied this question of legislative productivity from a historical perspective (Binder Reference Binder, Patashnik and Schiller2021; Fiorina Reference Fiorina2017; McCarty Reference McCarty2019), and much has been written on the nature and scale of the growing problem of partisan animosity between everyday Americans (see Iyengar et al. Reference Iyengar, Lelkes, Levendusky, Malhotra and Westwood2019). Concerns about legislative dysfunction, a fissuring society, and the implications of both for the future of American democracy have led to scholarly calls for a reimagining of the U.S. party system, where parties engage in more productive forms of partisan conflict and are more inclined toward compromise and bipartisanship (Levitsky and Ziblatt Reference Levitsky and Ziblatt2023; Muirhead Reference Muirhead2014).
In addition, a small body of experimental work has appeared on Americans’ attitudes toward bipartisanship and legislative compromises (Bauer, Yong, and Krupnikov Reference Bauer, Yong and Krupnikov2017; Broockman, Kalla, and Westwood Reference Broockman, Kalla and Westwood2023; Harbridge and Malhotra Reference Harbridge and Malhotra2011; Wolak Reference Wolak2020). This has generated evidence that Americans dislike party conflict, while also pointing to the likely overblown nature of claims that Americans, in general, desire a bipartisan future or that reducing polarization would increase support for bipartisanship. Given the track record of legislative conflict and gridlock at the federal level, it is unsurprising that polling suggests citizens have little faith in the ability of parties to work together to pass legislation in the House (Marist Poll 2022; Pew Research Center 2018; 2023).
Moreover, owing to the depths and widespread coverage of partisan polarization in American society, Americans are unlikely to believe parties have an incentive to cooperate with each other to pass legislation. Given the problems Americans already recognize in the polarized two-party system, we hypothesize that they will view any increase in the number and ideological spread of parties as producing legislative cacophony that is inimical to governability. The next two hypotheses are therefore:
Hypothesis 3: People view electoral system reforms that increase legislative fractionalization as more detrimental to governability than reforms that do not.
Hypothesis 4: People view electoral system reforms that increase legislative polarization as more detrimental to governability than reforms that do not.
Responsiveness
From Occupy to the Women’s Marches to Black Lives Matter, the United States has seen a number of large-scale mass mobilizations in recent years, all centered to a large extent on Americans’ frustrations with a lack of government responsiveness. Over this same period, a growing body of scholarship has emerged that describes and demonstrates the nature of key biases in government responsiveness fueling these popular protests. This includes work showing how federal legislators are more responsive to wealthy constituents and white voters, and to party members and organized interest groups, than to the general public, middle class, or median voter (Achen and Bartels Reference Achen and Bartels2016; Bartels Reference Bartels2008; Butler Reference Butler2014; Gilens Reference Gilens2012; Hacker and Pierson Reference Hacker and Pierson2010; Page and Gilens Reference Page and Gilens2017; Schlozman, Verba, and Brady Reference Schlozman, Verba and Brady2012). In this context of broad public frustration with government responsiveness, coupled with polling that suggests citizens have little faith in the ability of parties to work together to pass legislation in the House (Marist Poll 2022; Pew Research Center 2018; 2023), we hypothesize that Americans will view electoral system changes that increase the number of parties or the ideological diversity of parties as having a negative impact on legislative responsiveness. We therefore advance our next two hypotheses as:
Hypothesis 5: People view electoral system reforms that increase legislative fractionalization as more detrimental to democratic responsiveness than reforms that do not.
Hypothesis 6: People view electoral system reforms that increase legislative polarization as more detrimental to democratic responsiveness than reforms that do not.
Overall Evaluation
In addition to Americans’ evaluation of the impact of electoral system change on voice, governability, and responsiveness, we seek to understand their overall evaluation of electoral system changes that increase legislative fractionalization and polarization. The above-described evidence of the depth of mass political disaffection, coupled with the findings of existing work, albeit few in number, on support for alternative voting rules, strongly suggests that Americans want to see the political status quo challenged in significant ways. This includes the current two-party system being upended by new and fresh political entrants. With this in mind, we hypothesize that Americans will evaluate the overall impact of electoral system reforms that increase the number of parties in the House more positively than reforms that do not.
At the same time, many Americans are weary of partisan conflict, frustrated by legislative gridlock, and fearful of growing divisions in U.S. society. If true, Americans will largely be critical of political polarization as a major political problem, rather than something that they want to see more of at the national level, including in the House of Representatives. As a result, we hypothesize that Americans will more negatively evaluate the overall impact of electoral system reforms that increase the ideological diversity of parties sitting in the House compared to reforms that may facilitate a more moderate politics. Our final two hypotheses are thus:
Hypothesis 7: People are more supportive of electoral system reforms that increase legislative fractionalization than reforms that do not.
Hypothesis 8: People are less supportive of electoral system reforms that increase legislative polarization than reforms that do not.
In summary, we expect reforms that increase legislative fractionalization (i.e., the number of parties with seats in the House) to enhance perceptions of democratic voice but to undermine perceptions of both governability and responsiveness. Similarly, we expect reforms that increase legislative polarization (i.e., the ideological spread of parties) to improve voice while harming perceived governability and responsiveness. When it comes to overall support for reforms, we expect Americans to favor those that generate multipartism while opposing those that intensify polarization. Table 1 overviews of our hypotheses.
Summary of Hypotheses

STUDY 1: CONJOINT EXPERIMENT
In this experiment, we asked participants to choose between two potential electoral system reform profiles in three successive decision tasks. Each reform had values (or “levels”) on five attributes. Following the design of Hainmueller, Hopkins, and Yamamoto (Reference Hainmueller, Hopkins and Yamamoto2014), we randomly displayed these values to participants in each task, meaning every possible profile had an equal likelihood of appearing.Footnote 3
The attributes tied to our hypotheses were “Number of Parties with Seats in the House” and “Ideological Representation,” with our expectation being that participants will see reforms that increase legislative fractionalization and polarization as beneficial for voice but harmful to governability and responsiveness—and will overall prefer reforms that increase the number of parties but not those that exacerbate polarization. To operationalize fractionalization, we simply identified the number of parties in the House. For the polarization attribute, we displayed to participants bar graphs conveying the distribution of House members over an ideological spectrum. We anchored the extremes and center of this spectrum with the phrases “Extremely Liberal,” “Moderate,” and “Extremely Conservative,” following the longstanding labels used in the American National Election Studies (ANES). The graphs conveyed either a unimodal, flat, or bipolar ideological distribution, which signal an increasing amount of polarization according to the common index of Dalton (Reference Dalton2008).
Another attribute indicated whether Democrats or Republicans (or both) support the reform. This allows us to ascertain the relative importance of partisan considerations when it comes to both the adoption and consequences of the reform. Lastly, there were two attributes related to structural electoral system features: ballot structure and district magnitude. These provide no direct information about multipartism or polarization. Instead, they are meant to provide a holistic description of the reform while allowing us to ascertain whether Americans have direct preferences over such electoral system features.
We constructed the attribute levels so that any combination that could come about as a result of the randomization of their presentation to participants would not be illogical.Footnote 4 This randomization allows for unbiased estimation of the average change in the probability of a respondent selecting a particular electoral scenario if one attribute switched values. This is known as the average marginal component effect (AMCE). As highlighted by Abramson, Koçak, and Magazinnik (Reference Abramson, Koçak and Magazinnik2022), AMCEs are not necessarily reflective of majority preferences for a particular attribute value. For us, this is unproblematic: as stated in Hypotheses 1–6, we are interested in which reform outcomes people see as relatively beneficial or detrimental for voice, governability, and responsiveness; and, as stated in Hypotheses 7 and 8, we are interested in whether people tend to be more or less supportive of one reform outcome compared to another.
Our design also allows for the estimation of marginal means (MMs), the probability that participants choose a reform with a particular attribute value (see Leeper, Hobolt, and Tilley Reference Leeper, Hobolt and Tilley2020). We estimate both the AMCEs and MMs with linear regression. Standard errors are clustered by respondent, as each completed multiple tasks.
We used Qualtrics survey software and the design tool provided as a companion to Hainmueller, Hopkins, and Yamamoto (Reference Hainmueller, Hopkins and Yamamoto2014) to execute the experiment. Table 2 lists the attributes and possible levels, and an example of a decision task is shown in Section 3 of the Supplementary Material. The following description appeared at the top of the screen in each decision task:
Attributes and Possible Levels in the Conjoint Decision Tasks

There’s a lot of talk these days about changing the rules used to elect members of the U.S. House of Representatives. Such a change could impact the makeup of the House of Representatives in different ways. This includes the number of parties that win seats and the range of voices that get represented. Below are two potential scenarios concerning a change to electoral rules.
This design was preregistered with the Open Science Framework at https://osf.io/nwcsp. The entire Stage 1 manuscript is available with our pre-registration. We provide the preregistered design table overviewing the experiment in Section 9.1 of the Supplementary Material.
Outcome Variables
Hypotheses 1–6 expect multipartism and polarization to affect perceptions of voice, governability, and responsiveness, and Hypotheses 7 and 8 pertain to overall preferences for electoral system reforms that increase legislative fractionalization and polarization. To facilitate tests of these hypotheses, we asked the following questions after each task in random order:
Voice (Hypotheses 1 and 2): “Which of these scenarios do you think would best ensure Americans’ views and policy preferences on important issues get fully aired and debated in the House of Representatives?”
Governability (Hypotheses 3 and 4): “Which of these scenarios do you think would make it more difficult for legislation on important issues to get passed by the House of Representatives?”
Responsiveness (Hypotheses 5 and 6): “Which of these scenarios do you think would best ensure that the majority of Americans’ views and policy preferences on important issues get included in legislation that is passed by the House of Representatives?”
Overall Preference (Hypotheses 7 and 8): “If you had to choose one of these scenarios, which would you pick?”
Power Analysis and Sample
We assumed an AMCE of 0.05 based on the findings of the only two studies to use conjoint analysis to assess reactions to electoral system reforms. The smallest of three AMCEs related to proportionality detected in the conjoint analysis of Germans’ preferences over electoral reform is about 0.05 (Jankowski, Linhart, and Tepe Reference Jankowski, Linhart and Tepe2019). And, in the conjoint analysis of democratic reform preferences in Chile (Singh and Williams Reference Singh and Williams2021), the AMCEs associated with both proportionality and multipartism are about 0.05. Our benchmark AMCE of 0.05 is analogous to a Cohen’s d of 0.10 (Schuessler and Freitag Reference Schuessler and Freitag2020, 6), which is half the size of a Cohen’s d conventionally considered to be “small.”
The effective sample size needed to detect an AMCE of 0.05 when there are three attribute valuesFootnote 5 at 95% power and a significance level of 5% is 7,777.Footnote 6 We contracted with Bilendi, an international market research firm, to purchase an online sample of 2,000 U.S. adults. With two profiles and three decision tasks, our intended effective sample size was thus 2×3×2,000 = 12,000, which provides the ability to detect even AMCEs smaller than our benchmark. The extra observations also guard against potential missingness.
Fieldwork took place from October 6–28, 2025. The fee was U.S.$2.61 per respondent. Bilendi adhered to Census-based quotas to ensure national representativeness on age, gender, region, and household income. We also worked with Bilendi to obtain racial and educational representativeness with real-time quotas. As detailed in Section 8 of the Supplementary Material, the sample thus came close to U.S. Census benchmarks.
We included an instructional manipulation check (IMC), administered before the conjoint task, to gauge overall attentiveness. To avoid priming responses to subsequent items (Hauser and Schwarz Reference Hauser and Schwarz2015), the IMC contained no politically relevant information, asking respondents to pick a color from a list of five presented in random order. Respondents who failed the IMC were dropped from the survey upon failure and replaced by Bilendi. We slightly exceeded our target sample size, with 2,177 respondents. For data, see Mayne and Singh (Reference Mayne and Shane P.2026).
Results
Figures 1–4 show results pertaining to each outcome variable: perceptions of voice, governability,Footnote 7 and responsiveness; and overall preference. AMCEs are shown in the left-hand panels, while MMs are shown on the right. We interpret our results in accordance with our design table, which is shown in Section 9.1 of the Supplementary Material.
AMCEs and MMs Pertaining to Evaluations of Voice
Note: Estimates are from linear regressions of choice of voice-maximizing electoral scenario on attribute levels, which are detailed in Table 2. Standard errors are clustered by respondent. Horizontal lines represent 95% confidence intervals. The number of observations is 12,842 (2 profiles × mean of 2.9495 completed tasks × 2,177 respondents). Numerical results are provided in Section 4.1 of the Supplementary Material. Data are from an original conjoint survey experiment conducted by the authors.

AMCEs and MMs Pertaining to Evaluations of Governability
Note: Estimates are from linear regressions of choice of governability-maximizing electoral scenario on attribute levels, which are detailed in Table 2. Standard errors are clustered by respondent. Horizontal lines represent 95% confidence intervals. The number of observations is 12,842 (2 profiles × mean of 2.9495 completed tasks × 2,177 respondents). Numerical results are provided in Section 4.2 of the Supplementary Material. Data are from an original conjoint survey experiment conducted by the authors.

AMCEs and MMs Pertaining to Evaluations of Responsiveness
Note: Estimates are from linear regressions of choice of responsiveness-maximizing electoral scenario on attribute levels, which are detailed in Table 2. Standard errors are clustered by respondent. Horizontal lines represent 95% confidence intervals. The number of observations is 12,842 (2 profiles × mean of 2.9495 completed tasks × 2,177 respondents). Numerical results are provided in Section 4.3 of the Supplementary Material. Data are from an original conjoint survey experiment conducted by the authors.

AMCEs and MMs Pertaining to Overall Preference
Note: Estimates are from linear regressions of choice of preferred electoral scenario on attribute levels, which are detailed in Table 2. Standard errors are clustered by respondent. Horizontal lines represent 95% confidence intervals. The number of observations is 12,842 (2 profiles × mean of 2.9495 completed tasks × 2,177 respondents). Numerical results are provided in Section 4.4 of the Supplementary Material. Data are from an original conjoint survey experiment conducted by the authors.

Starting with perceptions of voice, results in Figure 1 show that, relative to a party system with two viable competitors, respondents see a five-party system as providing more voice. This supports Hypothesis 1. However, respondents do not see a three-party system as better at providing voice compared to one with two parties, and there is also no evidence that people view five parties as better for voice than three.Footnote 8
Hypothesis 2 expects that people view electoral system reforms that increase legislative polarization as giving citizens more voice. Here, we find that respondents see a roughly even distribution of representatives across the ideological spectrum as better at providing voice than a unimodal distribution centered on moderates. However, contrary to Hypothesis 2, respondents see a bipolar distribution of representatives as strongly detrimental to voice.
Turning to perceptions of governability, results in Figure 2 show that, relative to a two-party system, increasing the number of political parties has no influence, and there is also no evidence that people distinguish between the three- and five-party scenarios when evaluating governability.Footnote 9 This runs counter to Hypothesis 3.
Hypothesis 4 concerns evaluations of reform outcomes’ impact on legislative polarization for perceptions of governability. While respondents do not differentiate between a unimodal distribution centered on moderates and a roughly even distribution of representatives across the ideological spectrum, consistent with the hypothesis, respondents do view a bipolar distribution of representatives as detrimental to governability relative to both the unimodal and flat distributions.Footnote 10
Figure 3 shows results pertaining to evaluations of responsiveness. There is no evidence that a higher number of parties harms perceptions of responsiveness, which runs counter to Hypothesis 5. Further, contrary to Hypothesis 6, which posits that individuals perceive electoral system reforms that heighten polarization in the legislature as harmful to democratic responsiveness, respondents make no distinction between the flat and unimodal distributions of representatives in their assessments of responsiveness. However, in support of Hypothesis 6, respondents view a bipolar distribution of representatives as detrimental to responsiveness, relative to both the unimodal and flat distributions.Footnote 11
Results pertaining to respondents’ overall preferred electoral system reform outcomes are shown in Figure 4. We find no evidence for Hypothesis 7’s expectation that Americans prefer multipartism over a two-party duopoly, and we find that respondents do not distinguish between three- and five-party competition.Footnote 12 Contrary to Hypothesis 8, which posits that people are less supportive of electoral reforms that heighten polarization, we find that when respondents are asked to report their overall preference for different reform scenarios, they make no distinction between the flat and unimodal ideological distributions of representatives. However, in support of Hypothesis 8, we find that people are less supportive of electoral system reforms that lead to a bipolar distribution of representatives, relative to both a unimodal distribution dominated by moderates and one where the distribution of representatives is spread evenly across the ideological spectrum.Footnote 13
Although the partisan support, ballot structure, and district magnitude attributes are unrelated to our hypotheses, the results reveal some noteworthy patterns. First, with the exception of evaluations of governability, we see that respondents are, on average, less favorable toward reforms that do not enjoy bipartisan support. Further, Americans’ assessments of reform outcomes are largely independent of the type of ballot used, whether single-choice or ranked, and the number of representatives per district.
Exploratory Analyses
Consistent with our preregistered intentions, we explore whether effects are conditional on partisan identification and political ideology. As detecting such interactive effects typically requires a sample several orders of magnitude larger than what is required to detect main effects (Gelman, Hill, and Vehtari Reference Gelman, Hill and Vehtari2020, 301–2), we did not preregister any interaction-based hypotheses. Results are shown in Section 5.1 of the Supplementary Material.
There is very little evidence that the influence of the number of parties or legislative polarization on respondents’ evaluations is conditional on partisanship or political ideology. The lack of conditional effects could certainly reflect underpowering. However, if genuine, it suggests that electoral reform may be less politically divisive than is commonly supposed, and it runs counter to the above-discussed research that focuses on partisanship and ideologically-driven electoral calculations as key explanations of how Americans view electoral reforms.
The subgroup analyses also clarify respondents’ adverseness toward reforms without bipartisan support with regard to voice, responsiveness, and overall preference. Republicans and conservatives drive the negative AMCEs associated with reforms supported only by Democrats, while the negative AMCEs associated with reforms supported only by Republicans are largely due to Democrats and liberals. At the same time, all partisan and ideological groups are as positive toward reforms with bipartisan support as they are toward those backed by a single party. As a result, reforms with bipartisan support are, overall, assessed more favorably than those with the support of only one of the parties, as reflected by the MMs reported in the right-hand panels of Figures 1, 3, and 4.
Discussion of Unexpected and Null Findings
Counter to our expectations, we find little evidence that the number of parties influences evaluations of electoral reform outcomes. The post-treatment factual manipulation check (FMC) asked respondents to identify the five attributes differentiating the scenarios they chose between from a randomly ordered list of ten.Footnote 14 In the FMC, 57.85% of respondents correctly recalled the number of parties as an attribute in the conjoint experiment, as compared to an average of just 12.53% for each of the incorrect attributes. With a majority of respondents recognizing that the number of parties varied, null results likely reflect genuine lack of sensitivity to multipartism rather a lack of attentiveness to the manipulations.
The null effects pertaining to the number of parties are also not a result of offsetting preferences among subgroups. The associated exploratory analyses are detailed in Section 5.1 of the Supplementary Material. These show little evidence of a pattern whereby partisan or ideological groups react differently to the number of parties with seats in the House.
When it comes to the ideological distribution of House members, our hypotheses find more support. Respondents see extreme legislative polarization as harmful to governability and responsiveness and are, overall, least supportive of electoral system reforms that lead to extreme polarization. Yet we also unexpectedly find that people see pronounced polarization as harmful to voice.
In addition, there is no evidence that respondents evaluate relatively mild polarization, as represented by the flat ideological distribution of representatives, unfavorably. This is not due to offsetting preferences among subgroups. As shown in the exploratory analyses in Section 5.1 of the Supplementary Material, the effects of the different distributions of representatives are not conditional on party identification or political ideology.
Instead, participants’ unexpected response to mild polarization could be driven by the way in which they perceived the flat ideological distribution. We included a post-treatment subjective manipulation check (SMC) asking whether participants would describe the positions of the parties depicted in each distributional graph as moderate, polarized, or very polarized. For the bipolar distribution, 53.09% of respondents assessed the positions of members of the House as very polarized. For the flat distribution, only 9.12% did so, while 65.25% described that distribution as moderate. This is greater than the 62.95% who characterized the unimodal distribution as moderate. Thus, although the unimodal, flat, and bipolar distributional graphs convey an increasing amount of polarization according to the common Dalton (Reference Dalton2008) index, respondents only perceived the bipolar distribution as indicative of polarization. The null and unexpected effects associated with the flat distribution likely therefore reflect the fact that respondents perceived it as signaling political moderation, much as the unimodal distribution.
Tests for Design Flaws
Inference using our conjoint approach requires the assumptions of stability and no carryover effects and no profile-order effects. The former requires that the selection respondents would make in an identical decision task would remain unchanged irrespective of the profiles they had seen or would subsequently see. The latter requires that the order in which profiles are presented within a task does not influence respondents.
To probe the stability and no carryover effects assumption, we estimate AMCEs separately for each of the three tasks and compare the resulting estimates (Hainmueller, Hopkins, and Yamamoto Reference Hainmueller, Hopkins and Yamamoto2014, 8, 22). For the no profile-order effects assumption, we estimate AMCEs conditional on whether an attribute value appeared in the first or second profile (8–9, 25) Results detailed in Section 6 of the Supplementary Material indicate that AMCEs are consistent over tasks and profile order.
STUDY 2: VIGNETTE EXPERIMENTS
In our second study, we used a pair of vignette-based survey experiments to further assess preferences over electoral system reform outcomes. To date, few studies have used vignette-based designs with this goal, and, as far as we can tell, only two have done so in the United States (Bowler and Donovan Reference Bowler and Donovan2007; Cerrone and McClintock Reference Cerrone and McClintock2023). We built the vignette experiments to investigate Americans’ reactions to the same reform outcomes we study with the conjoint analysis in Study 1, namely multipartism and polarization.
In the first experiment of Study 2, we employed a 1×5 between-subjects design. Participants were randomly assigned to one of five short vignettes describing the outcome of a recent electoral system reform. The baseline vignette described a scenario mirroring the status quo in the United States, while the others described reforms that, in different ways, increased the number of parties with seats in the House of Representatives and varied their ideological positioning. Following exposure to the vignettes, we gauged individuals’ attitudes toward the reform outcomes to which they were exposed.
A between-subjects design avoids some of the potential pitfalls of a within-subjects approach, in which respondents would see more than one vignette. First, asking respondents to read more than one detailed vignette and respond to post-treatment questions about each can induce fatigue, thus increasing attrition or harming the quality of responses to the post-treatment items. Second, within-subjects designs are susceptible to demand effects, whereby participants infer the purpose of an experiment and, consciously or not, respond differently as a result (Charness, Gneezy, and Kuhn Reference Charness, Gneezy and Kuhn2012). Demand effects cannot be mitigated by presenting treatments in random order.
At the same time, within-subjects experiments allow for more precise estimates of treatment effects. This is because the within approach reduces variability due to individual differences, thus lowering error variance (Mutz Reference Mutz2011, 93–4). Thus, in the second experiment of Study 2, we employed a 1×5 within-subjects design. Here, each respondent saw, in random order, all five of the short vignettes used in the between design, and they were asked to answer questions about the reform outcomes following exposure to each vignette.
The between-subjects experiment was embedded in the first round of the within-subjects experiment. As such, data from the first round are gathered independent of the subsequent rounds, meaning only between-subjects variation is leveraged. We executed this combined design with Qualtrics survey software.
We estimate the effects of between-subjects vignette assignment on the dependent variables with linear regression and classical standard errors. To improve precision, we adjust for age, gender, and education in the regression models. These covariates were measured with questions sourced from the 2024 ANES and were asked before vignette assignment. We estimate the effects of within-subjects vignette assignment on the dependent variables with linear regression, respondent clustered standard errors, and respondent fixed effects. This panel approach allows for the estimation of the effect of vignette assignment using only within-person variation, and the covariates are absorbed by the fixed effects. For both designs, as we cannot be sure that individuals were manipulated by the treatment to which they were assigned, the estimates are intention to treat (ITT) effects.
Table 3 provides the text of the five vignettes. As in our first study, consistent with the ANES, we signaled ideological positions with the terms “liberal,” “moderate,” and “conservative.” The following description appeared at the beginning of the experiment for each respondent:
Vignettes

There’s a lot of talk these days about changing the rules used to elect members of the U.S. House of Representatives. Such a change could impact the makeup of the House of Representatives in different ways. This includes the number of parties that win seats and the range of voices that get represented. On the next screens, you will be shown a short description of five possible impacts and asked to evaluate them.
This design was preregistered with the Open Science Framework at https://osf.io/nwcsp. The entire Stage 1 manuscript is available with our pre-registration. We provide the preregistered design tables overviewing both the between and within experiments in Section 9.2 of the Supplementary Material.
Outcome Variables
Hypotheses 1–6 expect multipartism and polarization to affect perceptions of voice, governability, and responsiveness, and Hypotheses 7 and 8 pertain to overall preferences for electoral system reforms that increase party system fractionalization and polarization. To facilitate tests of these hypotheses, we asked the following questions in random order after vignette assignment:
Voice (Hypotheses 1 and 2): “Using a scale from 0 to 10, where 0 means ‘very negative’ and 10 means ‘very positive,’ what impact do you think this rule change will have on ensuring Americans’ views and policy preferences on important issues get fully aired and debated in the House of Representatives?”
Governability (Hypotheses 3 and 4): “Using a scale from 0 to 10, where 0 means ‘much easier’ and 10 means ‘much more difficult,’ to what extent do you think this rule change will make it easier or harder for the House of Representatives to pass legislation on important issues?”
Responsiveness (Hypotheses 5 and 6): “Using a scale from 0 to 10, where 0 means ‘very negative’ and 10 means ‘very positive,’ what impact do you think this rule change will have on ensuring that the majority of Americans’ views and policy preferences on important issues get included in legislation that is passed by the House of Representatives?”
Overall Preference (Hypotheses 7 and 8): “Using a scale from 0 to 10, where 0 means ‘very negative’ and 10 means ‘very positive,’ how would you describe your feelings about the impact of this rule change?”
Power Analysis and Sample
Given the lack of existing vignette-based studies that assess reactions to multipartism and polarization, we conservatively powered for the detection of small ITT effects. For the between-subjects design, 651 observations per group are needed to detect a “small” Cohen’s d of 0.20 at the 5% significance level with 95% power. With the control group and four treatment groups, we thus need 5×651 = 3,255 complete responses. For the within-subjects design, the required sample size is 1,310. As the between-subjects experiment is embedded in the first round of the within-subjects experiment, we aimed for 3,500 respondents to ensure sufficient power for both designsFootnote 15 and to account for missingness.
Fieldwork for the experiment lasted from October 6–28, 2025. As with Study 1, we contracted with Bilendi to purchase an online sample. The fee was U.S.$2.80 per respondent. Bilendi used a separate subcontractor to obtain respondents, helping to ensure that those included in Study 1 were excluded from Study 2. As in Study 1, Bilendi adhered to Census-based quotas to ensure national representativeness on age, gender, region, and household income, and we worked with the firm to obtain racial and educational representativeness with real-time quotas. As a result, the sample aligned quite well with U.S. Census benchmarks, as we detail in Section 8 of the Supplementary Material.
We also included the same pre-treatment IMC used in Study 1. As with Study 1, respondents who did not pass the IMC were terminated from the survey and replaced with new participants by Bilendi. We exceeded our target sample size, with 4,042 respondents. Data are available at Mayne and Singh (Reference Mayne and Shane P.2026).
Results
Figures 5–8 show results pertaining to each outcome variable: perceptions of voice, governability,Footnote 16 responsiveness; and overall evaluations. The top panels in each figure convey results from the between-subjects experiment, while the bottom panels pertain to the within-subjects experiment. ITTs are shown in the left-hand panels, and the mean value of the outcome variable in each treatment group is shown on the right. We interpret our results in accordance with our design tables, which are shown in Section 9.2 of the Supplementary Material.
ITT Effects and Treatment Group Means Pertaining to Evaluations of Voice
Note: Estimates in the between experiment are from linear regressions of evaluations of voice on dummies for the treatment groups, which are detailed in Table 3, adjusted for gender, age, and education. The number of observations is 4,034 (8 respondents were dropped from the between-subjects experiment due to missing data on education or treatment order). Estimates in the within experiment are from linear regressions of evaluations of voice on dummies for treatment group and respondent fixed effects. Standard errors are clustered by respondent. The number of observations is 19,182 (mean of 4.7457 completed rounds × 4,042 respondents). Horizontal lines represent 95% confidence intervals. Numerical results are provided in Section 4.5 of the Supplementary Material. Data are from an original vignette survey experiment conducted by the authors.

ITT Effects and Treatment Group Means Pertaining to Evaluations of Governability
Note: Estimates in the between experiment are from linear regressions of evaluations of governability on dummies for the treatment groups, which are detailed in Table 3, adjusted for gender, age, and education. The number of observations is 4,034 (8 respondents were dropped from the between-subjects experiment due to missing data on education or treatment order). Estimates in the within experiment are from linear regressions of evaluations of voice on dummies for treatment group and respondent fixed effects. Standard errors are clustered by respondent. The number of observations is 19,182 (mean of 4.7457 completed rounds × 4,042 respondents). Horizontal lines represent 95% confidence intervals. Numerical results are provided in Section 4.6 of the Supplementary Material. Data are from an original vignette survey experiment conducted by the authors.

ITT Effects and Treatment Group Means Pertaining to Evaluations of Responsiveness
Note: Estimates in the between experiment are from linear regressions of evaluations of responsiveness on dummies for the treatment groups, which are detailed in Table 3, adjusted for gender, age, and education. The number of observations is 4,034 (8 respondents were dropped from the between-subjects experiment due to missing data on education or treatment order). Estimates in the within experiment are from linear regressions of evaluations of voice on dummies for treatment group and respondent fixed effects. Standard errors are clustered by respondent. The number of observations is 19,182 (mean of 4.7457 completed rounds × 4,042 respondents). Horizontal lines represent 95% confidence intervals. Numerical results are provided in Section 4.7 of the Supplementary Material. Data are from an original vignette survey experiment conducted by the authors.

ITT Effects and Treatment Group Means Pertaining to Overall Evaluations
Note: Estimates in the between experiment are from linear regressions of overall preference on dummies for the treatment groups, which are detailed in Table 3, adjusted for gender, age, and education. The number of observations is 4,034 (8 respondents were dropped from the between-subjects experiment due to missing data on education or treatment order). Estimates in the within experiment are from linear regressions of evaluations of voice on dummies for treatment group and respondent fixed effects. Standard errors are clustered by respondent. The number of observations is 19,182 (mean of 4.7457 completed rounds × 4,042 respondents). Horizontal lines represent 95% confidence intervals. Numerical results are provided in Section 4.8 of the Supplementary Material. Data are from an original vignette survey experiment conducted by the authors.

Starting with perceptions of voice, results in Figure 5 show that, for both the between- and within-subjects experiment, respondents see the centripetal and centrifugal three-party scenarios, as well as the centripetal five-party scenario, as more voice enhancing than the status quo. This supports Hypothesis 1. However, counter to the hypothesis, we find no evidence that people view having five parties in the House as better for voice than having three, and there is no statistical difference between evaluations of the status quo vignette and the centripetal five-party vignette.
Hypothesis 2 predicts that people interpret electoral system reforms leading to greater legislative polarization as increasing citizen voice. In line with this prediction, in both experiments, respondents view the centrifugal three-party scenario as better for voice than the status quo. However, counter to the hypothesis, we see no evidence that respondents view the centrifugal three-party scenario as more voice enhancing than the centripetal three-party scenario. Moreover, with regard to five-party competition, again counter to Hypothesis 2, respondents do not see the centrifugal scenario as more voice enhancing than the centripetal scenario, and there is no statistical difference between the status quo scenario and the centrifugal five-party scenario.
Results strongly support Hypothesis 3, which predicts that people view electoral system reforms that increase legislative fractionalization as harmful for governability. As shown in Figure 6, in the within-subjects experiment, evaluations of governability are significantly weaker in the three-party and five-party scenarios than in the two-party, status quo scenario.Footnote 17 Further, in both experiments, the five-party scenarios are viewed as especially detrimental to governability.Footnote 18
Turning to Hypothesis 4, which expects that people see electoral reforms that increase legislative polarization as bad for governability, in both experiments respondents see both the centrifugal three-party and the centrifugal five-party scenario as harmful to governability, relative to the status quo scenario. Further, in the within-subjects experiment, the centrifugal scenarios are viewed as more harmful than the centripetal scenarios in both the three- and five-party settings.Footnote 19 These patterns support Hypothesis 4. However, counter to the hypothesis, mean evaluations of governability are not statistically different between the three- or five-party scenarios in the between-subjects experiment.Footnote 20
Figure 7 shows results pertaining to evaluations of responsiveness. Counter to Hypothesis 5’s expectation that people view electoral system reforms that increase legislative fractionalization as detrimental to democratic responsiveness, relative to the status quo, we find a positive effect of centripetal and centrifugal three-party systems, as well as a centripetal five-party system, on evaluations of responsiveness in both experiments. Further, there is no statistical difference in evaluations of responsiveness across the status quo and centrifugal five-party condition in either experiment.
We find limited support for Hypothesis 6, which expects that people see polarization-increasing reforms as deleterious to responsiveness. In line with the hypothesis, in the five-party scenarios in both experiments, people see a centrifugal distribution of parties as much more detrimental to responsiveness than a centripetal distribution.Footnote 21 However, in the three-party setting, the difference in evaluations across the centripetal and centrifugal scenarios is both substantively and statistically insignificant in both experiments.Footnote 22 We also find no evidence that people evaluate the centrifugal scenarios as harmful to responsiveness relative to the status quo scenario. In fact, in both experiments, people view three centrifugally distributed parties as beneficial for responsiveness, relative to the status quo.
Results pertaining to respondents’ overall preferences are shown in Figure 8. We find some evidence for Hypothesis 7’s expectation that people prefer multipartism over a duopolistic system. In both experiments, people prefer the centripetal and centrifugal three-party scenarios and the centripetal five-party scenario to the status quo. However, we see no evidence that five parties are preferred to three. Further, counter to Hypothesis 7, relative to a five-party system with centrifugally distributed parties, respondents prefer the status quo.
Consistent with Hypothesis 8, we find some evidence that people are less supportive of electoral system reforms that lead to legislative polarization. In the five-party scenarios in both experiments, people react more negatively to a centrifugal distribution of parties than a centripetal distribution.Footnote 23 Further, in both experiments, respondents see the centrifugal five-party scenario as less desirable than the status quo. In the three-party scenarios, differences between preferences for a centripetal or centrifugal distribution of parties are in the expected direction but substantively small in both experiments and not statistically significant in the between-subjects experiment.Footnote 24 Finally, counter to Hypothesis 8, we find that people prefer three polarized parties to the status quo in both experiments.
Exploratory Analyses
As in Study 1, and consistent with our preregistered intentions, we explore whether effects from the vignette experiments are conditional on partisan identification and political ideology. Results are shown in Section 5.2 of the Supplementary Material. In general, Republicans and conservatives show a stronger preference for the status quo than other ideological and partisan groups in their evaluations of voice and responsiveness, as well as their overall evaluations. At the same time, Republicans and conservatives react especially negatively to the centrifugal five-party scenario.
Discussion of Unexpected and Null Findings
The unexpected and null findings from Study 2 follow two main patterns. First, in situations of three seated parties, respondents’ reactions depend little on whether the parties are distributed centripetally or centrifugally. Second, people are highly averse to a scenario with five ideologically polarized parties: this vignette is rated lowest for every outcome variable in both the between- and within-subjects experiments.
We included a post-treatment SMC that asked participants whether they would describe the vignette they read as illustrative of ideological moderation or polarization. Responses to this SMC help shed light on the unanticipated and null findings. While 43.61% of respondents assessed the status quo scenario as polarized, 36.23% and 39.62% did so for the centripetal and centrifugal three-party scenarios, respectively.Footnote 25 That people saw both three-party scenarios as moderate relative to the status quo helps to explain why they rarely differentiated between them. These perceptions of relative moderation also help explain why respondents unexpectedly viewed the centrifugal three-party scenario as more conducive to responsiveness than the status quo.
Null effects rarely stem from differences in subgroup preferences. Yet, the above-discussed status quo bias among Republicans and conservatives does, in some instances, lead to a null ITT for the five-party centrifugal scenario in relation to the status quo vignette. This is because Republicans and conservatives always evaluate the five-party centrifugal scenario less favorably than the status quo, whereas other partisan and ideological groups tend to do the opposite. We elaborate on this in Section 5.2 of the Supplementary Material.
Responses to the post-treatment factual manipulation check suggest that it is unlikely that unanticipated effects regarding the number of parties are due to inattentiveness to treatments. The FMC asked respondents how many political parties had seats in the House of Representatives in the vignette they saw. On average, 67.59% of respondents correctly identified the number of parties in their vignette; by the final round of the within-subjects experiment, 71.95% did so. With a large majority of respondents recalling this feature, the null results likely reflect a genuine lack of sensitivity to the number of parties.
Tests for Design Flaws
In Section 7 of the Supplementary Material, we detail our checks for design flaws in the vignette experiments. First, while demonstrating covariate balance is not required for inference in randomized experiments (e.g., Mutz and Pemantle Reference Mutz and Pemantle2015), we use such balance tests to ensure that randomization “worked” in the between-subjects experiment. Results show no evidence of covariate imbalances over treatment groups, which is consistent with successful randomization.
Second, to probe fatigue or demand effects in the within-subjects experiment, we check whether estimates vary with experimental round. We find no evidence of demand effects. Though experimental attrition is very low, we do find mild evidence of fatigue. Evaluations tend toward the midpoint, and the precision of estimates tends to decrease in later rounds, patterns that could reflect increasing inattentiveness. However, as we discuss in the Supplementary Material, this does not seem to be the source of any null effects.
ETHICS
We received ethics approval from the Institutional Review Board (IRB) of the University of Georgia prior to fielding our experiments in Project No. 00013079. We also ensured that our experiments adhered to APSA’s Principles and Guidance for Human Subjects Research, and we obtained informed consent from participants, making them aware that they were taking part in a research study. We have stripped potentially identifying information, in particular IP addresses and geographic coordinates, from the final datasets. We also gave participants the option to have their responses removed following a debrief describing the experimental manipulations that we provided at the end of each survey.Footnote 26
CONCLUSION
In light of the state and local successes of the U.S. electoral reform movement, fueled by widespread dissatisfaction with the nation’s duopolistic party system, there is a surprising dearth of literature on the federal electoral system preferences of ordinary Americans. In this article, we report on the findings of a pair of survey experimental studies that we designed to gauge participants’ preferences for different electoral system reforms. We focus specifically on the consequences of these reforms for the number and ideological diversity of parties in the U.S. House of Representatives. We gauge participants’ support for electoral system and resultant party system change both in general terms and with regard to voice, governability, and responsiveness.
In Study 1, the treatments are a randomized series of electoral system features and outcomes presented in a conjoint framework. Study 2 includes two experiments. In the first, we randomly assign participants to vignettes that describe different electoral outcomes in a between-subjects design. In the second, we show respondents these same vignettes multiple times in a within-subjects design. Across both studies, one result stands out clearly: Americans exhibit a strong aversion to reforms that produce pronounced legislative polarization.
In Study 1, this aversion manifests even in evaluations of a reform’s potential to enhance citizens’ voice in the democratic process, a finding that runs counter to our theoretical expectations. Rather than viewing polarization as a tolerable feature of a legislature that is home to a diversity of perspectives, respondents appear to associate it with broader dysfunction in democratic governance, and respondents see extreme polarization as harming voice (and democratic responsiveness) even more than it harms governability. While we can only speculate about the mechanism underlying this result, it may be grounded in a belief that compromise is stigmatized in highly polarized environments, thereby reducing representatives’ willingness or ability to incorporate a wide range of public viewpoints.
With respect to reforms’ impact on the number of parties in the legislature, Study 1 provides only limited evidence that individuals view outcomes with a greater number of parties more favorably. This runs counter to common complaints about the lack of choice in American politics and contrasts with findings from other democracies, where citizens tend to favor electoral systems that foster multiparty competition (Blais et al. Reference Blais, Bol, Bowler, Farrell, Fredén, Foucault and Heisbourg2023; Singh and Williams Reference Singh and Williams2021). Conversely, in Study 2, we find generally positive reactions to multipartism, particularly when three rather than five parties are represented. As the samples are similarly representative on age, gender, region, household income, race, and educational attainment, these differences in reactions to multipartism are very unlikely to be due to differences in demographic characteristics across participants in Study 1 and Study 2. It is also unlikely that the contrasting findings result from differences in participant engagement or treatment efficacy. In both studies, respondents who failed the IMCs were dropped, meaning the participant pools were likely similarly attentive. Moreover, a sizable majority of respondents in both studies correctly answered a post-treatment FMC concerning the number of political parties in the experimental conditions. In addition, all experiments were adequately powered to detect very small effects, and the null results do not appear to stem from offsetting subgroup dynamics or breakdowns in design. Our suspicion is that the multipartism attribute was swamped by others in the conjoint experiment of Study 1, where concerns about partisan support for reforms and their impact on polarization dominated respondents’ decision-making.
Taken together, the results of the two studies suggest that while Americans are receptive to moderate departures from the two-party system, such preferences are fragile and can be overshadowed by concerns about polarization and partisan sponsorship when multiple considerations are made salient simultaneously. This distinction highlights the complementary value of the two experimental designs employed here. The conjoint experiment approximates the real-world, politicized, and multidimensional choice environment in which electoral reforms are debated and evaluated, revealing which preferences survive when respondents must weigh party-system consequences alongside cues about polarization and partisan support. By contrast, the vignette experiments isolate party-system outcomes more directly, offering insight into how Americans evaluate multipartism and ideological diversity when these features are made especially salient and cognitively accessible.
Viewed through this lens, divergent findings in the two studies are substantively informative rather than contradictory. In the vignette experiments of Study 2, respondents do not meaningfully distinguish between centripetal and centrifugal configurations in three-party systems, nor do they clearly differentiate these scenarios from a five-party centripetal system. Instead, respondents appear to make relatively coarse distinctions among party-system outcomes: they consistently reject an extreme combination of multipartism and polarization, while expressing broadly similar attitudes toward more moderate forms of pluralism. This pattern may reflect the fact that most Americans lack experience with routine multiparty legislative politics but are simultaneously dissatisfied with both major parties. Under these conditions, a hypothetical multiparty world may appear attractive in general terms, even if respondents have difficulty making sense of the finer-grained ideological structure of alternative party systems.
In Study 2, perceived gains in voice and responsiveness from multipartism tend to outweigh perceived governability losses. This pattern suggests that Americans are willing to trade some degree of governability for improvements in voice and responsiveness. From the perspective of the electoral system design literature, these findings both reinforce and complicate classic accounts of institutional trade-offs. While they confirm that public perceptions of governability often decline as party systems become more fragmented, they also indicate that voice and responsiveness are not viewed as being in tension with one another. Moreover, polarization emerges as a distinct and powerful evaluative dimension, suggesting that gains in voice or responsiveness are not sufficient to generate support for electoral reforms when they are accompanied by pronounced polarization.
Overall, our findings indicate that Americans place a premium on political moderation in the House of Representatives, even as they may favor reforms that increase viewpoint diversity—particularly through a limited expansion of the party system. This has implications for which electoral systems may be best suited for lower-house elections in the United States. RCV of the variety recently adopted in Alaska, Maine, New York City, and Washington, DC seems particularly appealing. It is less likely than PR to foster extensive multipartism and is often credited with incentivizing moderation, notwithstanding that the empirical record for this claim remains mixed (see Eggers and Bouton Reference Eggers and Bouton2024). Moreover, results from the conjoint experiment of Study 1 suggest that whether ballots require voters to rank candidates is relatively unimportant to Americans. Our findings also suggest that a proportional electoral system with a low average district magnitude—which is known to enhance representation without a proliferation of parties (Carey and Hix Reference Carey and Hix2011)—could align with Americans’ preferences.
Like all experiments, ours leave some questions unanswered. Later work may consider whether Americans’ preferences for electoral systems are contingent on how they affect voice and responsiveness for citizens at ideological extremes. Future research may also consider whether Americans take into account electoral systems’ impact on outcomes such as civility, or whether they think about the consequences of electoral system reform for Congress’s ability to legislate on specific issues. In addition, while voice, governability, and responsiveness are all key elements of democratic representation, further research might examine whether variation in legislative composition resulting from different electoral systems affects perceptions of voters’ ability to hold parties to account. Understanding how the findings of our experiments—focused on federal legislators—generalize to public support for, and evaluations of, state and local electoral reforms is another important avenue for research.
In addition to exploring alternative outcome variables, future research could draw on other experimental designs, including those that incorporate voting simulations. Doing so would create opportunities to examine how voters evaluate the scrutability of electoral systems. Opponents of RCV charge that the system is confusing. Proportional systems also range in their complexity—from closed-list PR at one end to single-transferable vote systems at the other—and voters may place a premium on navigability. Comprehensibility can also affect the extent to which voters are able to pick a candidate or party that best aligns with their preferences (Lau et al. Reference Lau, Patel, Fahmy and Kaufman2014), which itself will shape the ability of an electoral system to give voice to voters and allow legislators to respond accordingly.
SUPPLEMENTARY MATERIAL
To view supplementary material for this article, please visit https://doi.org/10.1017/S0003055426101658.
DATA AVAILABILITY STATEMENT
Research documentation and data that support the findings of this study are openly available at the American Political Science Review Dataverse: https://doi.org/10.7910/DVN/ZQNHB1.
ACKNOWLEDGEMENTS
Alphabetical ordering reflects an equal contribution by both authors. We thank our editor, Andrew Eggers, and anonymous reviewers for their thoughtful and constructive engagement during the Registered Report process. We are also grateful to Archon Fung and the Ash Center for Democratic Governance and Innovation for their support of this research.
FUNDING STATEMENT
This research was supported by internal faculty research funds from Harvard Kennedy School, with supplemental funding from the Ash Center for Democratic Governance and Innovation.
CONFLICT OF INTEREST
The authors declare no ethical issues or conflicts of interest in this research.
ETHICAL STANDARDS
The authors declare that the human subjects research in this article was reviewed and approved by the Institutional Review Board of the University of Georgia, and the certificate number is provided in the text. The authors also affirm that this article adheres to the principles concerning research with human participants laid out in APSA’s Principles and Guidance on Human Subject Research (2020).


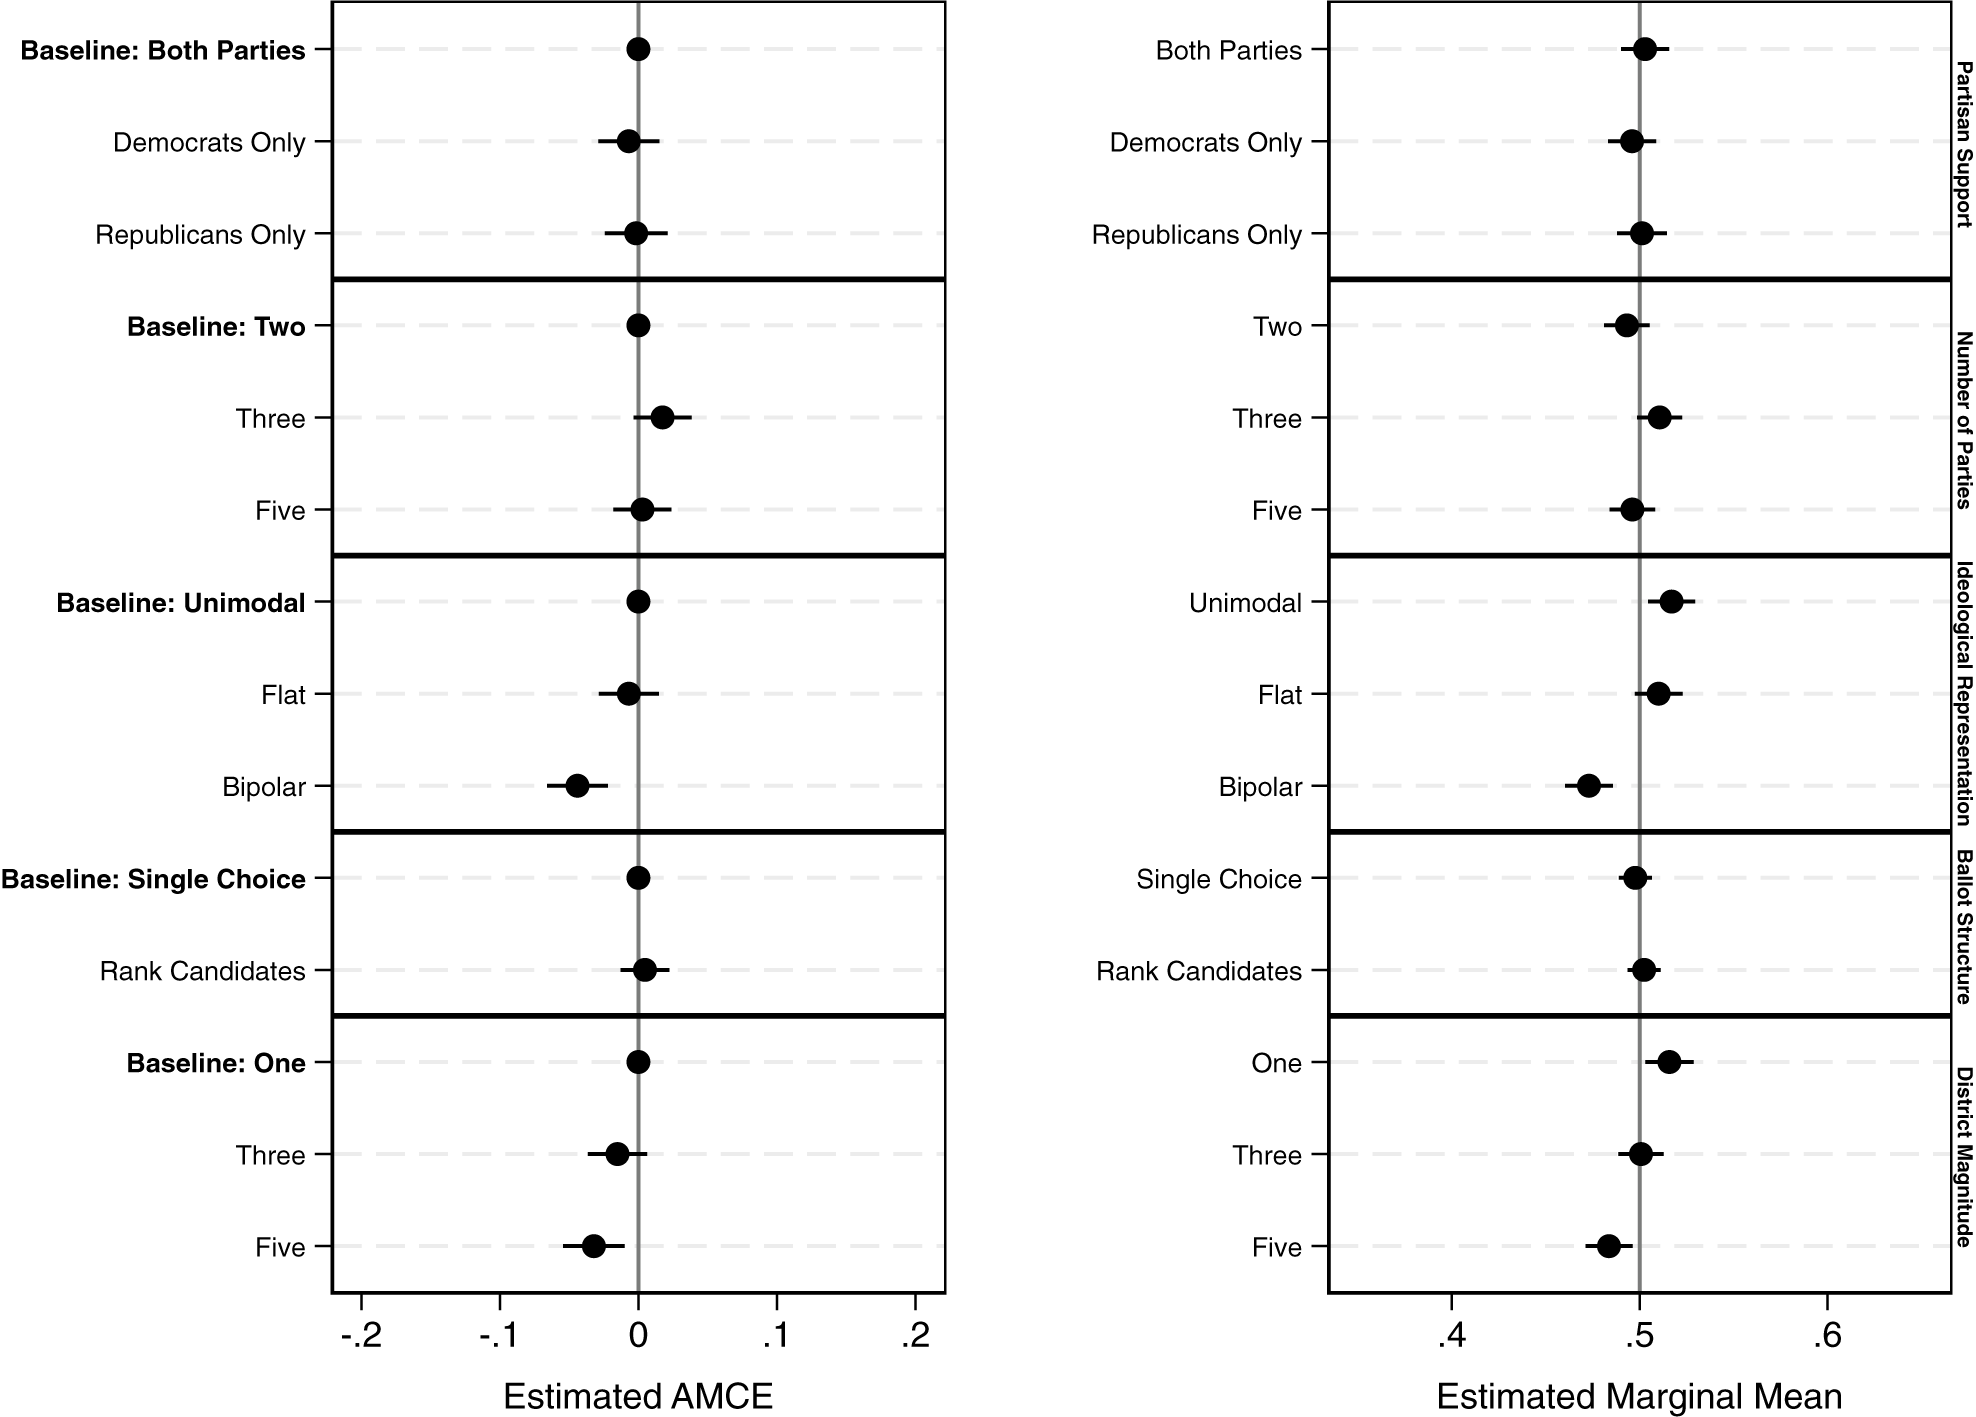

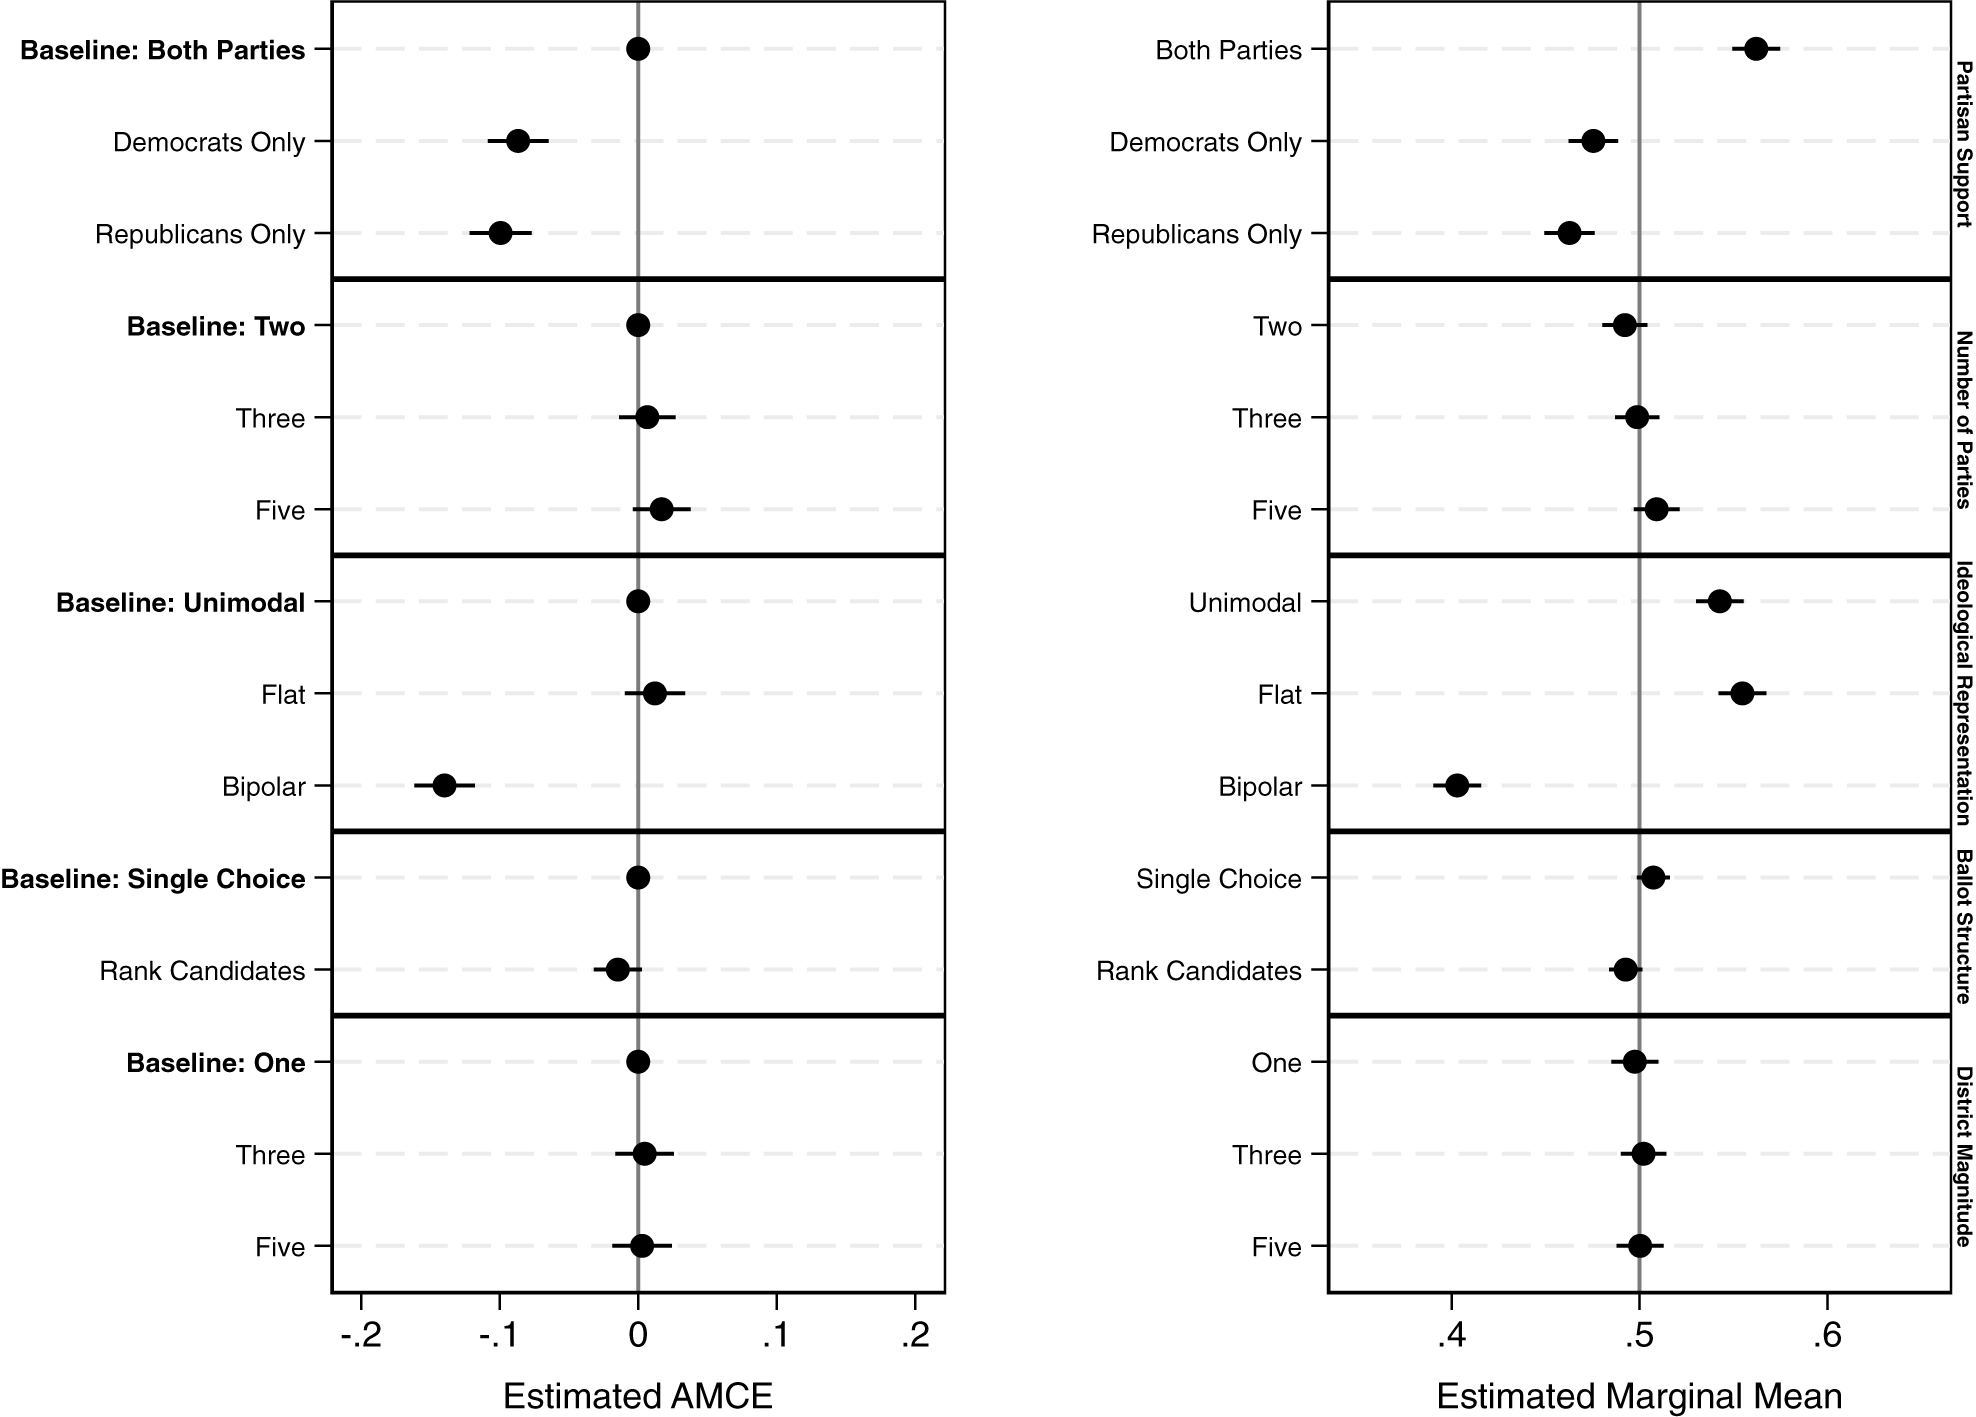

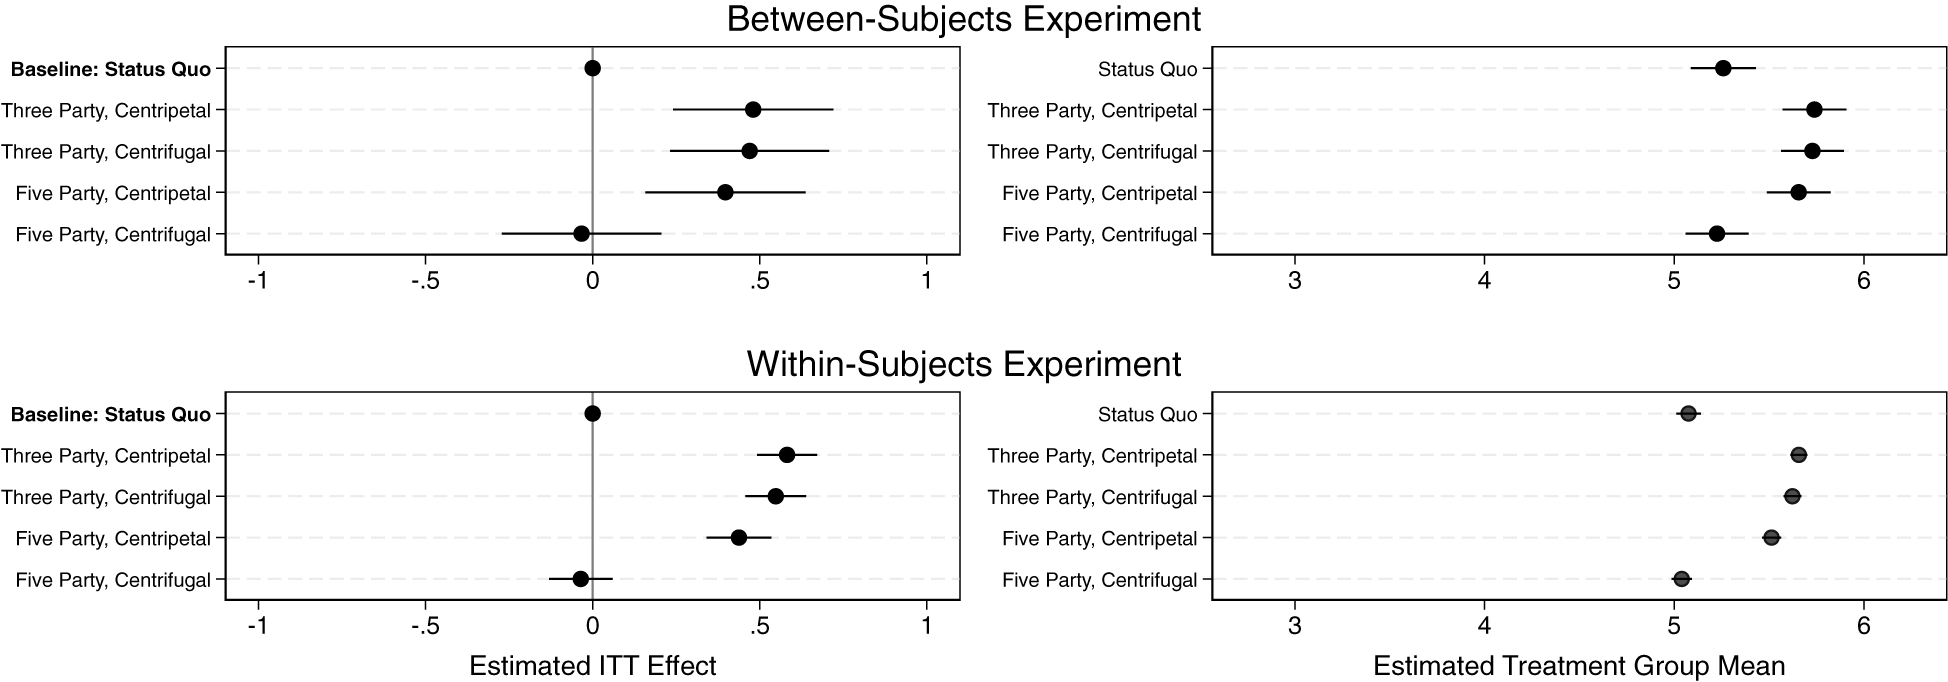
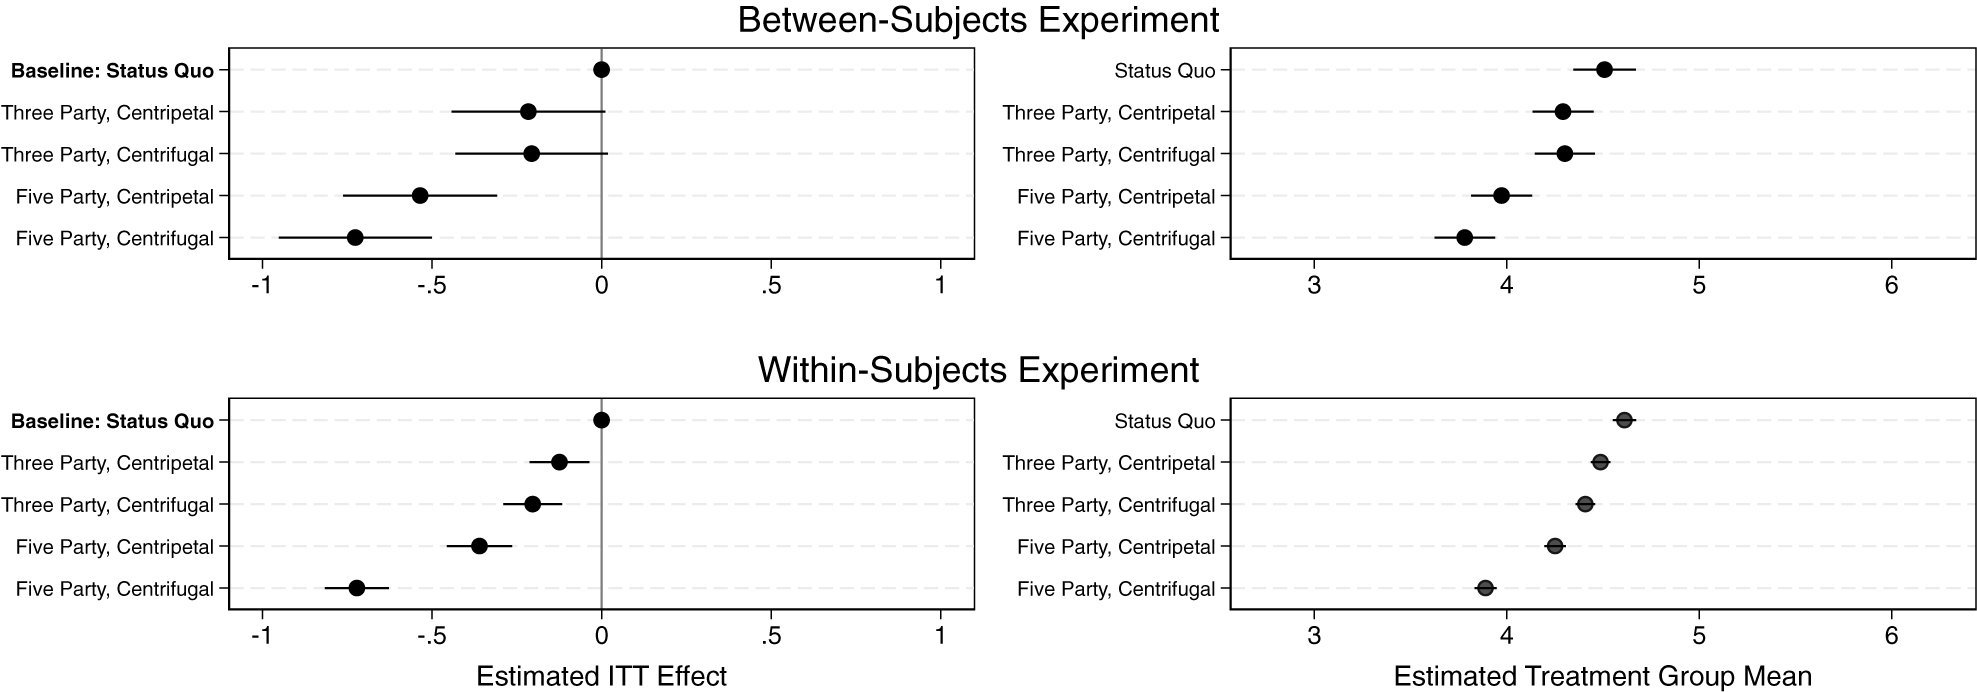
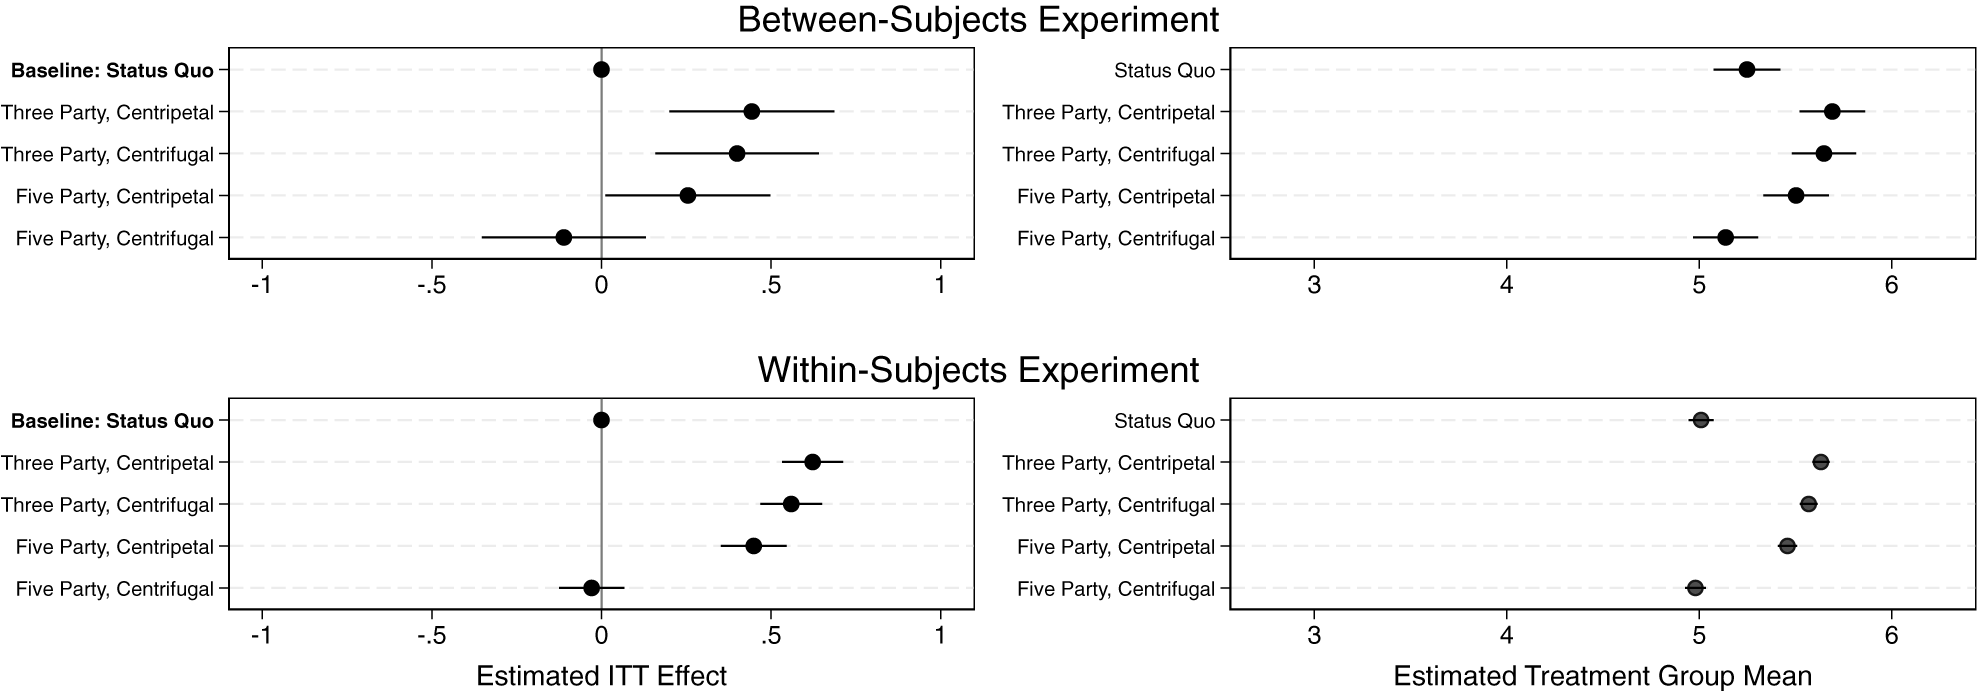


 Open access
Comments
No Comments have been published for this article.