


Introduction
Kochia is a C4 summer annual broadleaf weed and a member of the Chenopodiaceae family. It was introduced to the United States as an ornamental plant in the early 1900s (Friesen et al. Reference Friesen, Beckie, Warwick and Van Acker2009) and has now become one of the most troublesome weeds across the North American Great Plains (Kumar et al. Reference Kumar, Jha, Jugulam, Yadav and Stahlman2019a). Kochia has low seed dormancy, and most seeds remain viable for only 1 to 2 yr in the soil (Dille et al. Reference Dille, Stahlman, Du, Geier, Riffel, Currie, Wilson, Sbatella, Westra, Kniss and Moechnig2017). Kochia infestation in cropland is more prevalent under no tillage, and 90% of the nondormant seeds lay on the soil surface after dispersal and emerge in the following growing season (Anderson and Nielsen Reference Anderson and Nielsen1996; Schwinghamer and Van Acker Reference Schwinghamer and Van Acker2008; Zorner et al. Reference Zorner, Zimdahl and Schweizer1984).
Kochia is a highly invasive weed species due to its unique biological characteristics that include high tolerance to heat, cold, drought and salinity; along with its robust growth habit, prolific seed production (>100,000 seeds per plant), and wind-mediated tumbling mechanism of seed dispersal (Beckie et al. Reference Beckie, Blackshaw, Hall and Johnson2016, Reference Beckie, Blackshaw, Leeson, Stahlman, Gaines and Johnson2018; Dille et al. Reference Dille, Stahlman, Du, Geier, Riffel, Currie, Wilson, Sbatella, Westra, Kniss and Moechnig2017; Kumar et al. Reference Kumar, Jha, Jugulam, Yadav and Stahlman2019a). Kochia interference at variable densities can result in significant grain yield reductions in several field crops. For instance, 41% to 95% yield reduction in corn (Zea mays L.) (Wicks et al. Reference Wicks, Martin and Mahnken1993), 28% to 95% in sorghum [Sorghum bicolor (L.) Moench ssp. bicolor] (Wicks et al. Reference Wicks, Martin, Haack and Mahnken1994), 23% to 77% in soybean [Glycine max (L.) Merr.] (Wicks et al. Reference Wicks, Martin and Hanson1997), up to 99% in sugarbeet (Beta vulgaris L.) (Geddes and Sharpe Reference Geddes and Sharpe2022; Kumar and Jha Reference Kumar and Jha2015), 62% to 95% in sunflower (Helianthus annuus L.) (Lewis and Gulden Reference Lewis and Gulden2014), and 4% to 73% in spring wheat (Triticum aestivum L.) have been reported (Friesen et al. Reference Friesen, Mayert and Morrison1991; Torbiak et al. Reference Torbiak, Blackshaw, Brandt, Hall, Hamman and Geddes2021).
Evolution of herbicide resistance among kochia populations has become a significant challenge for producers. Reports exist of kochia populations being resistant to four herbicide sites of action, including inhibitors of photosystem II (categorized as a Group 5 herbicide by the Weed Science Society of America), acetolactate synthase (Group 2), 5-enolpyruvyl-shikimate-3-phosphate synthase (Group 9), and synthetic auxins (Group 4) (Dhanda et al. Reference Dhanda, Kumar, Manuchehri, Bagavathiannan, Dotray, Dille, Obour, Yeager and Holman2025a; Heap Reference Heap2026; Kumar et al. Reference Kumar, Engel, Currie, Jha, Stahlman and Thompson2019b). Recently, Geddes et al. (Reference Geddes, Law, Jenks, Howatt, Ikley, Jaster, Pittman, Biggers, Meiners and Porri2025) confirmed resistance to saflufenacil and carfentrazone (inhibitors of protoporphyrinogen oxidase)(Group 14) in kochia populations in North Dakota and Saskatchewan. Similarly, resistance to herbicides in Groups 2, 9, and 14 has been confirmed in a kochia population in South Dakota (Heap Reference Heap2026). Glyphosate-resistant (Gly-R) kochia is geographically widespread across the North American Great Plains (Heap Reference Heap2026). For instance, several Gly-R kochia populations have been found in Colorado, Kansas, Montana, North Dakota, Oklahoma, South Dakota, and Texas (Dhanda et al. Reference Dhanda, Kumar, Manuchehri, Bagavathiannan, Dotray, Dille, Obour, Yeager and Holman2025a; Godar et al. Reference Godar, Stahlman, Jugulam and Dille2015; Heap Reference Heap2026; Westra et al. Reference Westra, Nissen, Getts, Westra and Gaines2019; Wiersma et al. Reference Wiersma, Gaines, Preston, Hamilton, Giacomini, Buell, Leach and Westra2015). Dicamba is an auxinic herbicide that has been commercially available since the late 1960s and is widely used to control many broadleaf weeds, including Gly-R kochia in chemical fallow and growing among corn, sorghum, and other crops (Beckie et al. Reference Beckie, Hall, Shirriff, Martin and Leeson2019). However, dicamba resistance among kochia populations has been spreading rapidly since it was first discovered in a population in Montana in 1994 (Heap Reference Heap2026). Subsequently, three-way to four-way resistant (Groups 2, 5, 9, and 4) kochia populations have also been reported in Kansas, Oklahoma, and Texas (Dhanda et al. Reference Dhanda, Kumar, Manuchehri, Bagavathiannan, Dotray, Dille, Obour, Yeager and Holman2025a; Kumar et al. Reference Kumar, Engel, Currie, Jha, Stahlman and Thompson2019b; Varanasi et al. Reference Varanasi, Godar, Currie, Dille, Thompson, Stahlman and Jugulam2015).
Auxinic herbicide–based premixtures or tank-mixtures can play a crucial role in controlling Gly-R kochia. For instance, Torbiak et al. (Reference Torbiak, Blackshaw, Brandt, Hall, Hamman and Geddes2021) reported ≥90% control of Gly-R kochia with bromoxynil + fluroxypyr + 2,4-D, dichlorprop-p + MCPA + mecoprop-p, or fluroxypyr + 2,4-D tank-mixtures. A premixture containing 2,4-D, dicamba, and dichlorprop-p (Scorch EXT; Nufarm Inc., Alsip, IL) has become available and is labeled to control kochia in non-crop areas (Nufarm 2025). A recent study has shown a synergistic interaction when dicamba was tank-mixed with dichlorprop-p + 2,4-D, halauxifen/fluroxypyr + dichlorprop-p, and halauxifen/fluroxypyr + 2,4-D and resulted in 84% to 95% control of multiple herbicide-resistant kochia (Dhanda et al. Reference Dhanda, Kumar, Geier, Currie, Dille, Obour, Yeager and Holman2023). However, no previous information exists regarding the biologically effective dose of 2,4-D/dicamba/dichlorprop-p premixture in comparison to 2,4-D, dicamba, and dichlorprop-p alone for control of Gly-R kochia. Therefore, the main objective of this study was to determine and compare the biologically effective dose of a 2,4-D/dicamba/dichlorprop-p premixture for effective control of Gly-R kochia compared to the stand-alone applications of 2,4-D, dicamba, and dichlorprop-p. We hypothesized that lower doses of 2,4-D, dicamba, and dichlorprop-p would be required to control Gly-R kochia when applied as a premixture compared with stand-alone applications of these herbicides.
Materials and Methods
Separate field-based dose-response experiments were conducted during fallow periods at Kansas State University Agricultural Research Center near Hays, Kansas, during 2021 and 2022 to determine and compare the effective dose of 2,4-D, dicamba, dichlorprop-p alone, and a premixture of 2,4-D/dicamba/dichlorprop-p to control Gly-R kochia. The experiments were arranged in a randomized complete block design with four replications. The soil type was Roxbury silt loam (fine-silty, mixed, superactive, mesic Cumulic Haplustolls), pH 7.6, and with 2.1% organic matter. The field site was under no-tillage dryland wheat-sorghum-fallow rotation for more than 5 yr with a natural infestation of Gly-R kochia. The tested doses of 2,4-D (Weedone LV4; Nufarm) were 0, 269, 538 (the field-use rate), 1,076, 2,152, 4,304, and 8,608 g ae ha−1. Dicamba (Clarity; BASF, Research Triangle Park, NC) was tested at 0, 140, 280, 560 (the field-use rate), 840, and 1,120 g ae ha−1. Dichlorprop-p (Duplosan; Nufarm) was tested at doses of 0, 280, 560 (the rate for use on non-cropland), 840, 1,120, 1,400, 1,680, and 3,360 g ae ha−1. A premixture of 2,4-D/dicamba/dichlorprop-p (1:1:2) (Scorch EXT; Nufarm) was tested at 0, 373, 746, 1,119, 1,492 (the rate for use on non-cropland), and 2,238 g ae ha−1. The size of each plot was 3 m wide by 9 m long. All herbicides were applied to young actively growing kochia seedlings (7 to 9 cm tall) using a CO2-pressurized backpack sprayer equipped with XR8001E flat-fan nozzles (TeeJet Technologies, Glendale Heights, IL), calibrated to deliver 132 L ha−1 of spray solution at 276 kPa. Herbicides were applied on June 16, 2021, and May 18, 2022. Daily average air temperature and precipitation amounts during the experimental periods were collected from the Kansas Mesonet (https://mesonet.k-state.edu/) weather station.
The percent of visual control of kochia was recorded at 28 d after treatment (DAT) on a scale of 0% to 100%, where 0% equates to no control and 100% represents complete control. Visual assessments were based on the auxinic herbicide injury symptoms such as epinasty (curling, twisting, and cupping), chlorosis, and necrosis of kochia seedlings. At 28 DAT, kochia plants were manually harvested at the soil level from two randomly placed 1-m2 quadrats from each plot, and shoot dry biomass was recorded after oven-drying the samples at 65 C for 4 d. Dry shoot biomass reduction was calculated to compare the biomass of nontreated plots using Equation 1:
 $${\rm{Shoot}}\;{\rm{dry}}\;{\rm{biomass}}\;{\rm{reduction}}\;\left( \% \right) = \left[ {{{BC - BT} \over {BC}}} \right]X\;100$$
where BC is the shoot dry biomass of the nontreated control and BT is the shoot dry biomass from the treated plot.
Statistical Analyses
Data to determine the percent of visual control and shoot dry biomass reduction were subjected to ANOVA using the MIXED procedure with SAS software (v.9.3; SAS Institute, Inc., Cary, NC). The fixed effects in the ANOVA model included experimental year, herbicide doses, and their interactions for each herbicide. Replications and all interactions involving replication were considered as random effects. The data from nontreated plots were not included in the analyses. The data followed all the ANOVA assumptions as tested with the UNIVARIATE procedure in SAS. For all herbicides, experimental year-by-herbicide doses interaction was nonsignificant at P > 0.05. Therefore, data were pooled across experimental years. Percent visual control and shoot dry biomass reduction data were regressed over each herbicide dose using a four-parametric log-logistic model (Equation 2) with R software (Ritz et al. Reference Ritz, Baty, Streibig and Gerhard2015) as follows:
 $${\rm{Y}} = {\rm{c}} + \;\left\{ {{{{\rm{d}} - {\rm{c}}} \over 1} + \exp \;\left[ {{\rm{b}}\left( {\log {\rm{x}} - \log {\rm{e}}} \right)} \right]} \right\}$$
where Y is the kochia visual control (%) or shoot dry biomass reduction (% of nontreated), c is the minimum kochia visual control or shoot dry biomass reduction, d is the maximum kochia visual control or shoot dry biomass reduction (100%), e is the dose of each herbicide required for 50% kochia control (referred to as ED50 values) or shoot biomass reduction (referred to as GR50 values), x is the herbicide dose, and b represents the slope for each curve. ED90 or GR90 values (which represent the herbicide dose required for 90% kochia control or shoot biomass reduction) were estimated using the drc package in R software.
Results and Discussion
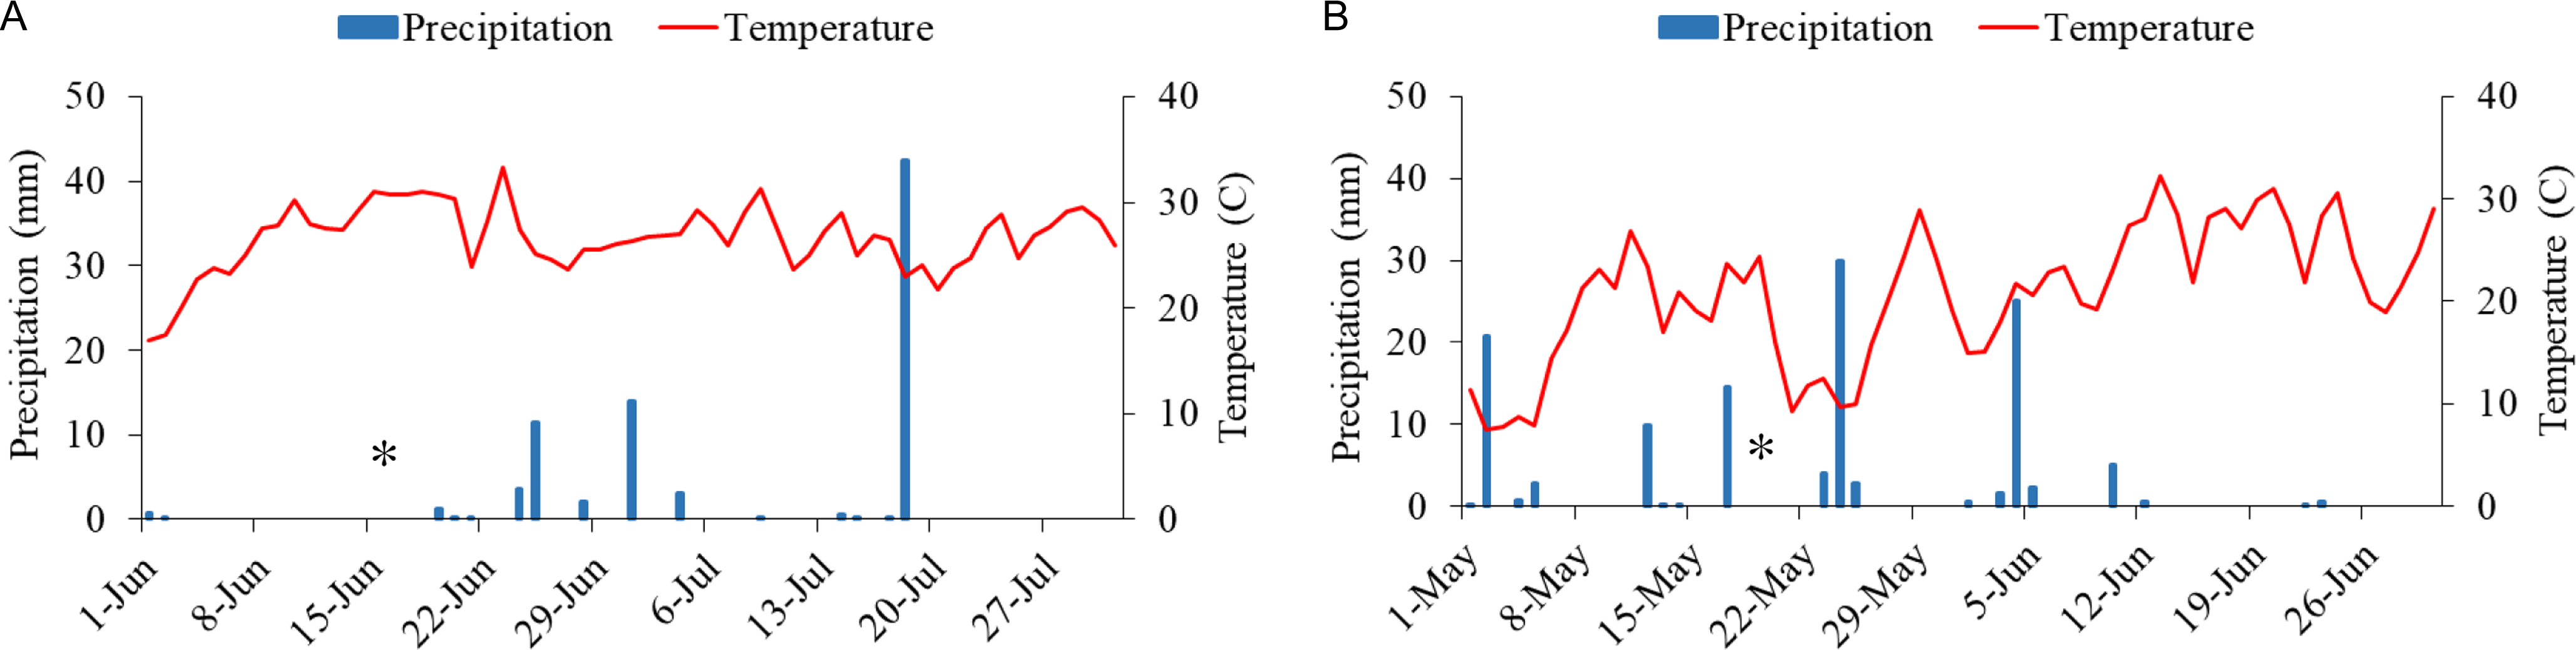
Monthly mean air temperatures during the study period ranged from 24 to 33 C in 2021 and 9 to 32 C in 2022, and the total precipitation during experimental period was 37 mm in 2021 and 72 mm in 2022 (Figure 1).
Daily average air temperature (C) and precipitation (mm) during the 2021 (A) and 2022 (B) study period. The asterisk (*) indicates the date of herbicide application.

Percent Visual Control
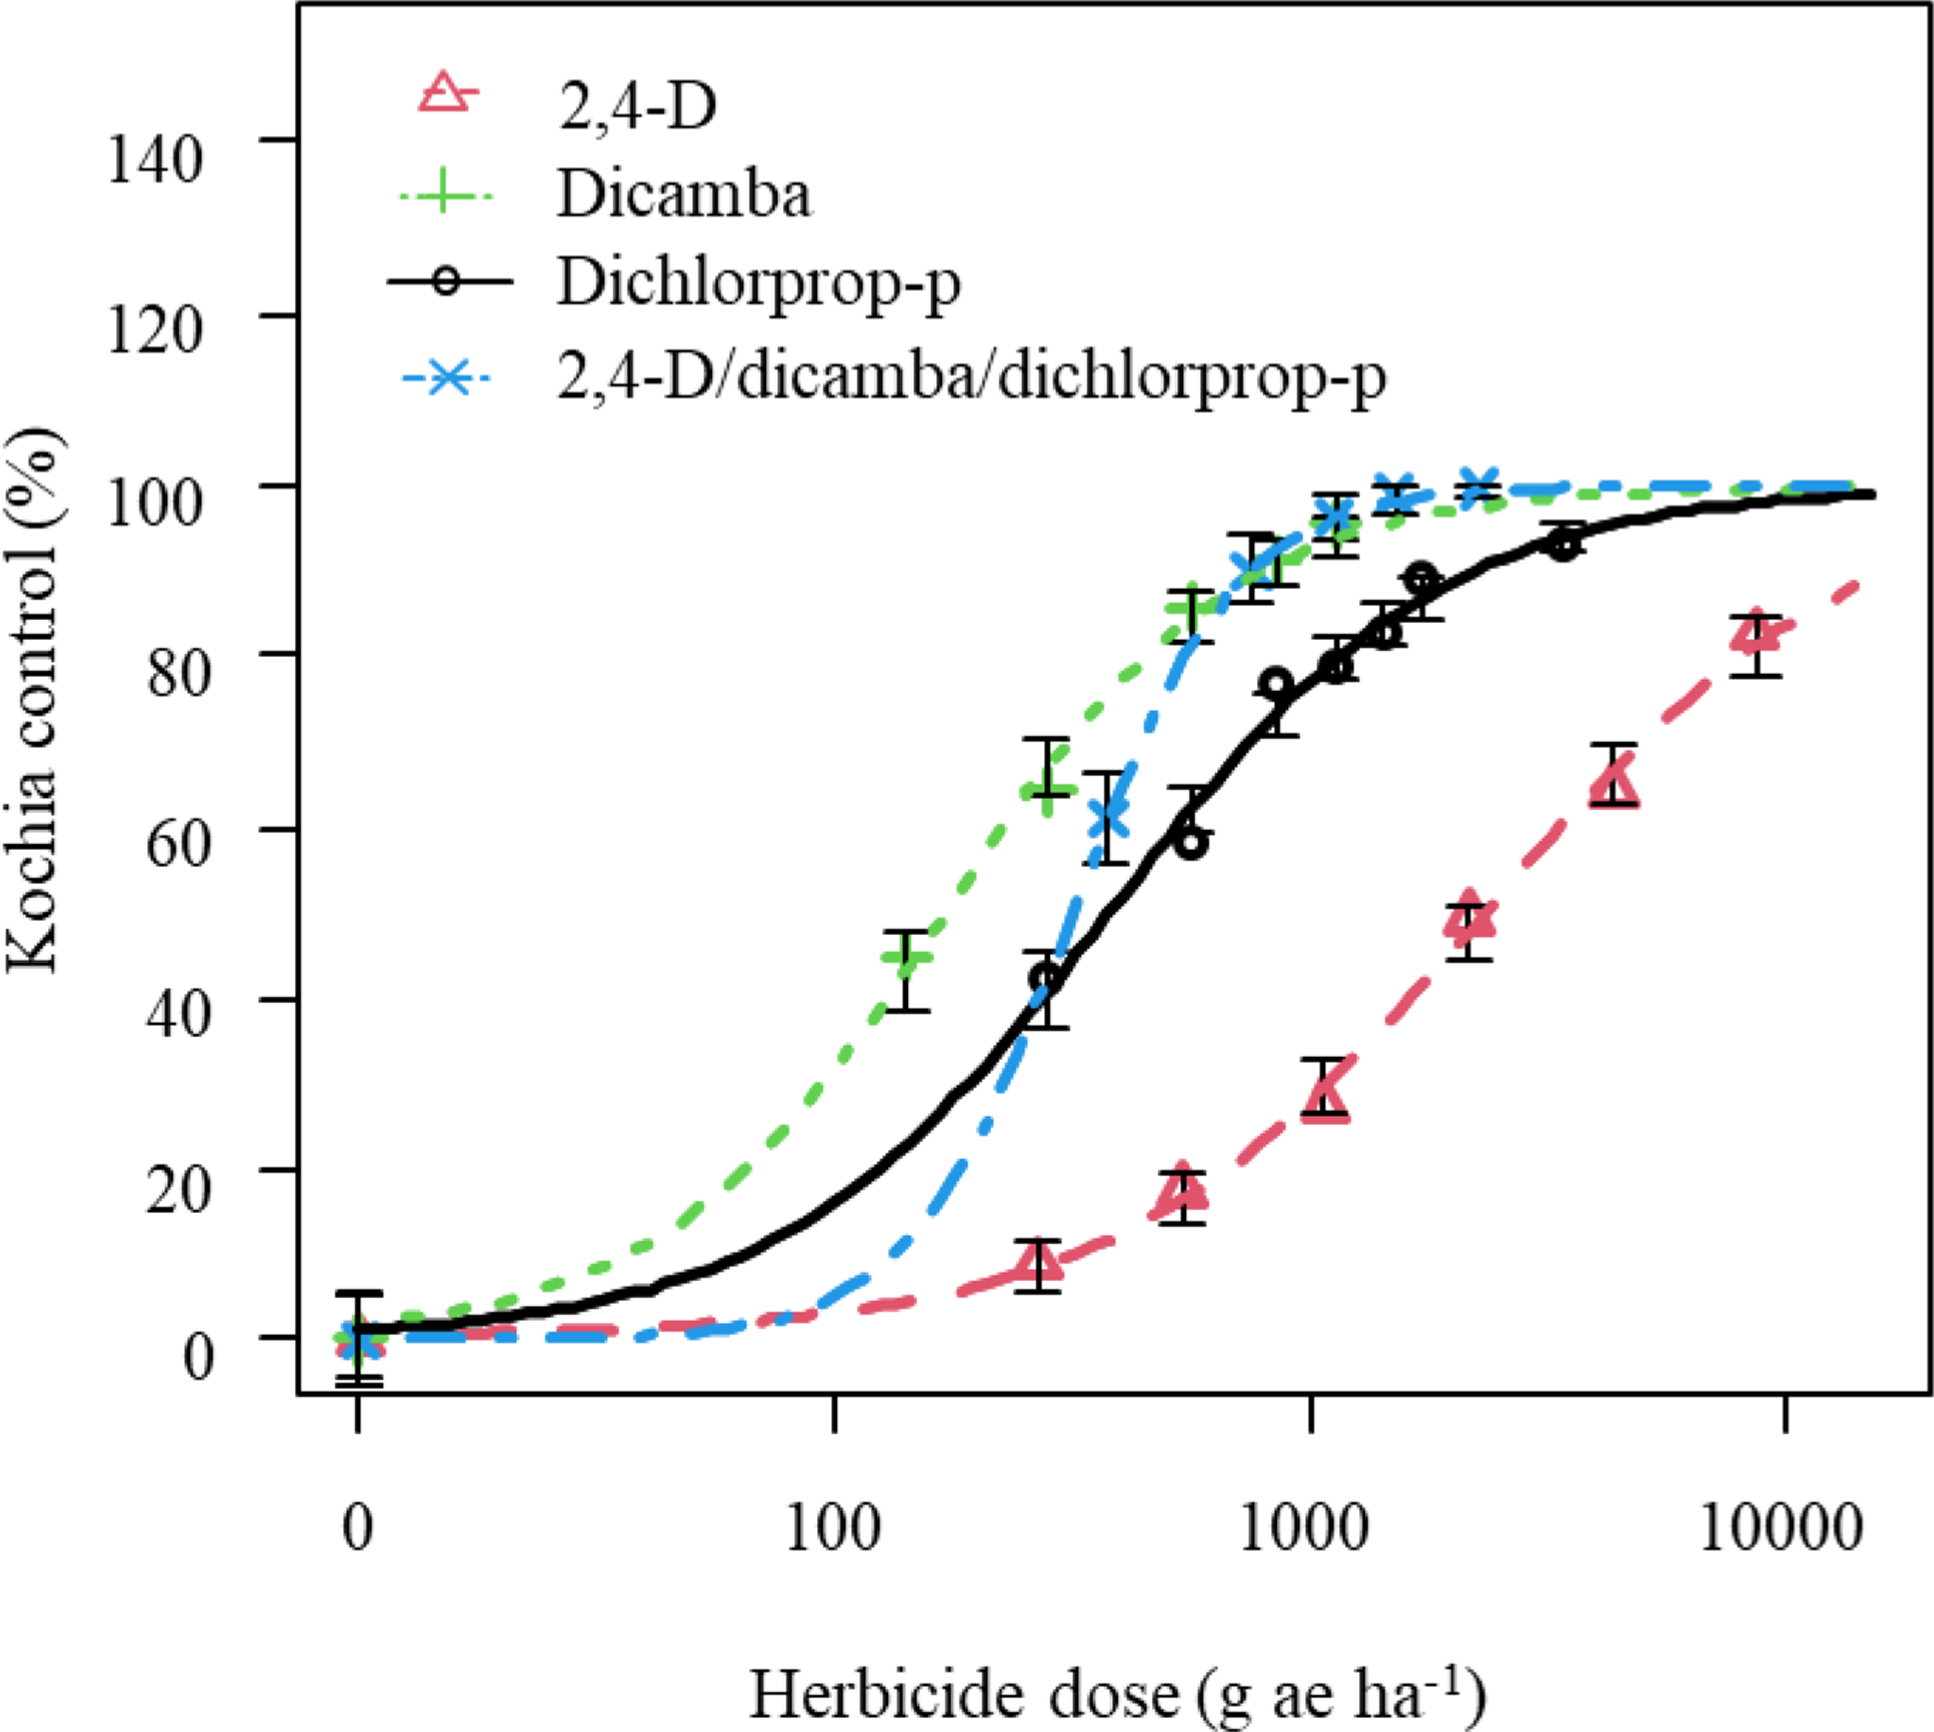
Based on the fitted log-logistic model, the 2,4-D dose predicted to obtain 50% control of Gly-R kochia was 2,346 g ha−1, which was four times the field-use rate of 538 g ha−1 (Table 1; Figure 2). The predicted dose of 2,4-D to obtain 90% control of Gly-R kochia was >8,608 g ha−1 (the highest rate tested), indicating poor control of kochia with 2,4-D applied alone. Several previous studies reported that 2,4-D applied alone did not provide an acceptable level of kochia control (Dhanda et al. Reference Dhanda, Kumar, Geier, Currie, Dille, Obour, Yeager and Holman2025b; Friesen et al. Reference Friesen, Morrison, Rashid and Devine1993; Tonks and Westra Reference Tonks and Westra1997). Nandula and Manthey (Reference Nandula and Manthey2002) reported only 49% to 75% kochia control with 2,4-D ester (570 g ha−1) at 28 DAT. The authors of that study also reported that 550 to 1,020 g ha−1 of 2,4-D was needed to obtain 50% kochia control at 28 DAT. Those results and ours indicated that 2,4-D applied alone was not an effective option for controlling Gly-R kochia, and the continuous use of 2,4-D will select for 2,4-D-resistant kochia populations. LeClere et al. (Reference LeClere, Wu, Westra and Sammons2018) reported cross-resistance to 2,4-D, fluroxypyr, and dicamba in a kochia population collected in western Nebraska.
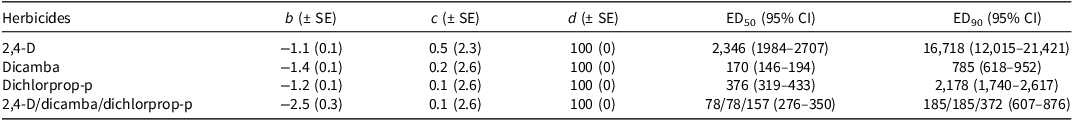
Regression parameter estimates for average percent control of glyphosate-resistant kochia at 28 d after treatment with 2,4-D, dicamba, dichlorprop-p, and 2,4-D/dicamba/dichlorprop-p premixture in separate dose-response field experiments. a

a Abbreviations: b represents the slope for each curve; c is the minimum kochia visual control; d is the maximum kochia visual control (100%) (see Equation 2). ED50 and ED90 represent the herbicide doses (in grams per hectare, g ha−1) to obtain, respectively, 50% and 90% control of glyphosate-resistant kochia. SE represents standard error of mean; CI, confidence interval. ED50 and ED90 values among herbicides are statistically different based on 95% CI.
Percent control of glyphosate-resistant kochia with various rates of 2,4-D, dicamba, dichlorprop-p, and 2,4-D/dicamba/dichlorprop-p premixture at 28 d after treatment averaged across 2021 and 2022 growing seasons. Symbols represent actual values, lines represent predicted values. Vertical bars indicate ± standard error of the mean values.

The estimated dicamba doses needed to obtain 50% and 90% control of Gly-R kochia were 170 g ha−1 and 785 g ha−1, respectively (Table 1; Figure 2). The dicamba dose for 90% control of Gly-R kochia was 1.4 times greater than the field-use rate (560 g ha−1), indicating the possibility of evolution of low-level resistance to dicamba in this field population. Westra et al. (Reference Westra, Nissen, Getts, Westra and Gaines2019) reported glyphosate and dicamba resistance in 14% to 20% of total sampled kochia accessions in eastern Colorado. Dicamba-resistant kochia has been reported in Colorado, Idaho, Kansas, Montana, Nebraska, and North Dakota (Heap Reference Heap2026). Therefore, to avoid or delay the dicamba resistance in kochia, dicamba should be used in rotation with other herbicides or it should be mixed with other herbicides.
The predicted dichlorprop-p doses to obtain 50% and 90% control of Gly-R kochia were 376 g ha−1 and 2,178 g ha−1, respectively (Table 1; Figure 2). Similar to 2,4-D and dicamba, the dichlorprop-p dose required to obtain 90% kochia control was greater than the field-use rate of 560 g ha−1, suggesting that a stand-alone application of any of these herbicides would not be effective to control Gly-R kochia. Torbiak et al. (Reference Torbiak, Blackshaw, Brandt, Hall, Hamman and Geddes2021) reported that a dichlorprop-p/2,4-D combination applied at 368/702 g ha−1 resulted in 71% control of Gly-R kochia in Alberta, Canada.
The estimated doses of 2,4-D/dicamba/dichlorprop-p premixture to obtain 50% and 90% control of Gly-R kochia were 313 g ha−1 and 742 g ha−1, respectively (Table 1; Figure 2). The 2,4-D/dicamba/dichlorprop-p premixture is formulated in a ratio of 1:1:2, meaning that only 78 g ha−1 and 185 g ha−1 of dicamba would be enough in the 2,4-D/dicamba/dichlorprop-p premixture to provide 50% and 90% control of Gly-R kochia, respectively. These results further revealed that lower doses of 2,4-D, dicamba, and dichlorprop-p by about 90 times, 4 times, and 6 times, respectively, were needed when applied as a premixture of 2,4-D/dicamba/dichlorprop-p to obtain 90% control of Gly-R kochia compared with their stand-alone application rates, respectively. These results demonstrated that a three-way mixture of auxinic herbicides can provide effective control of Gly-R kochia. Torbiak et al. (Reference Torbiak, Blackshaw, Brandt, Hall, Hamman and Geddes2021) also reported >90% control of Gly-R kochia with a three-way mixture of dicamba, 2,4-D, and mecoprop-P.
Shoot Dry Biomass Reduction
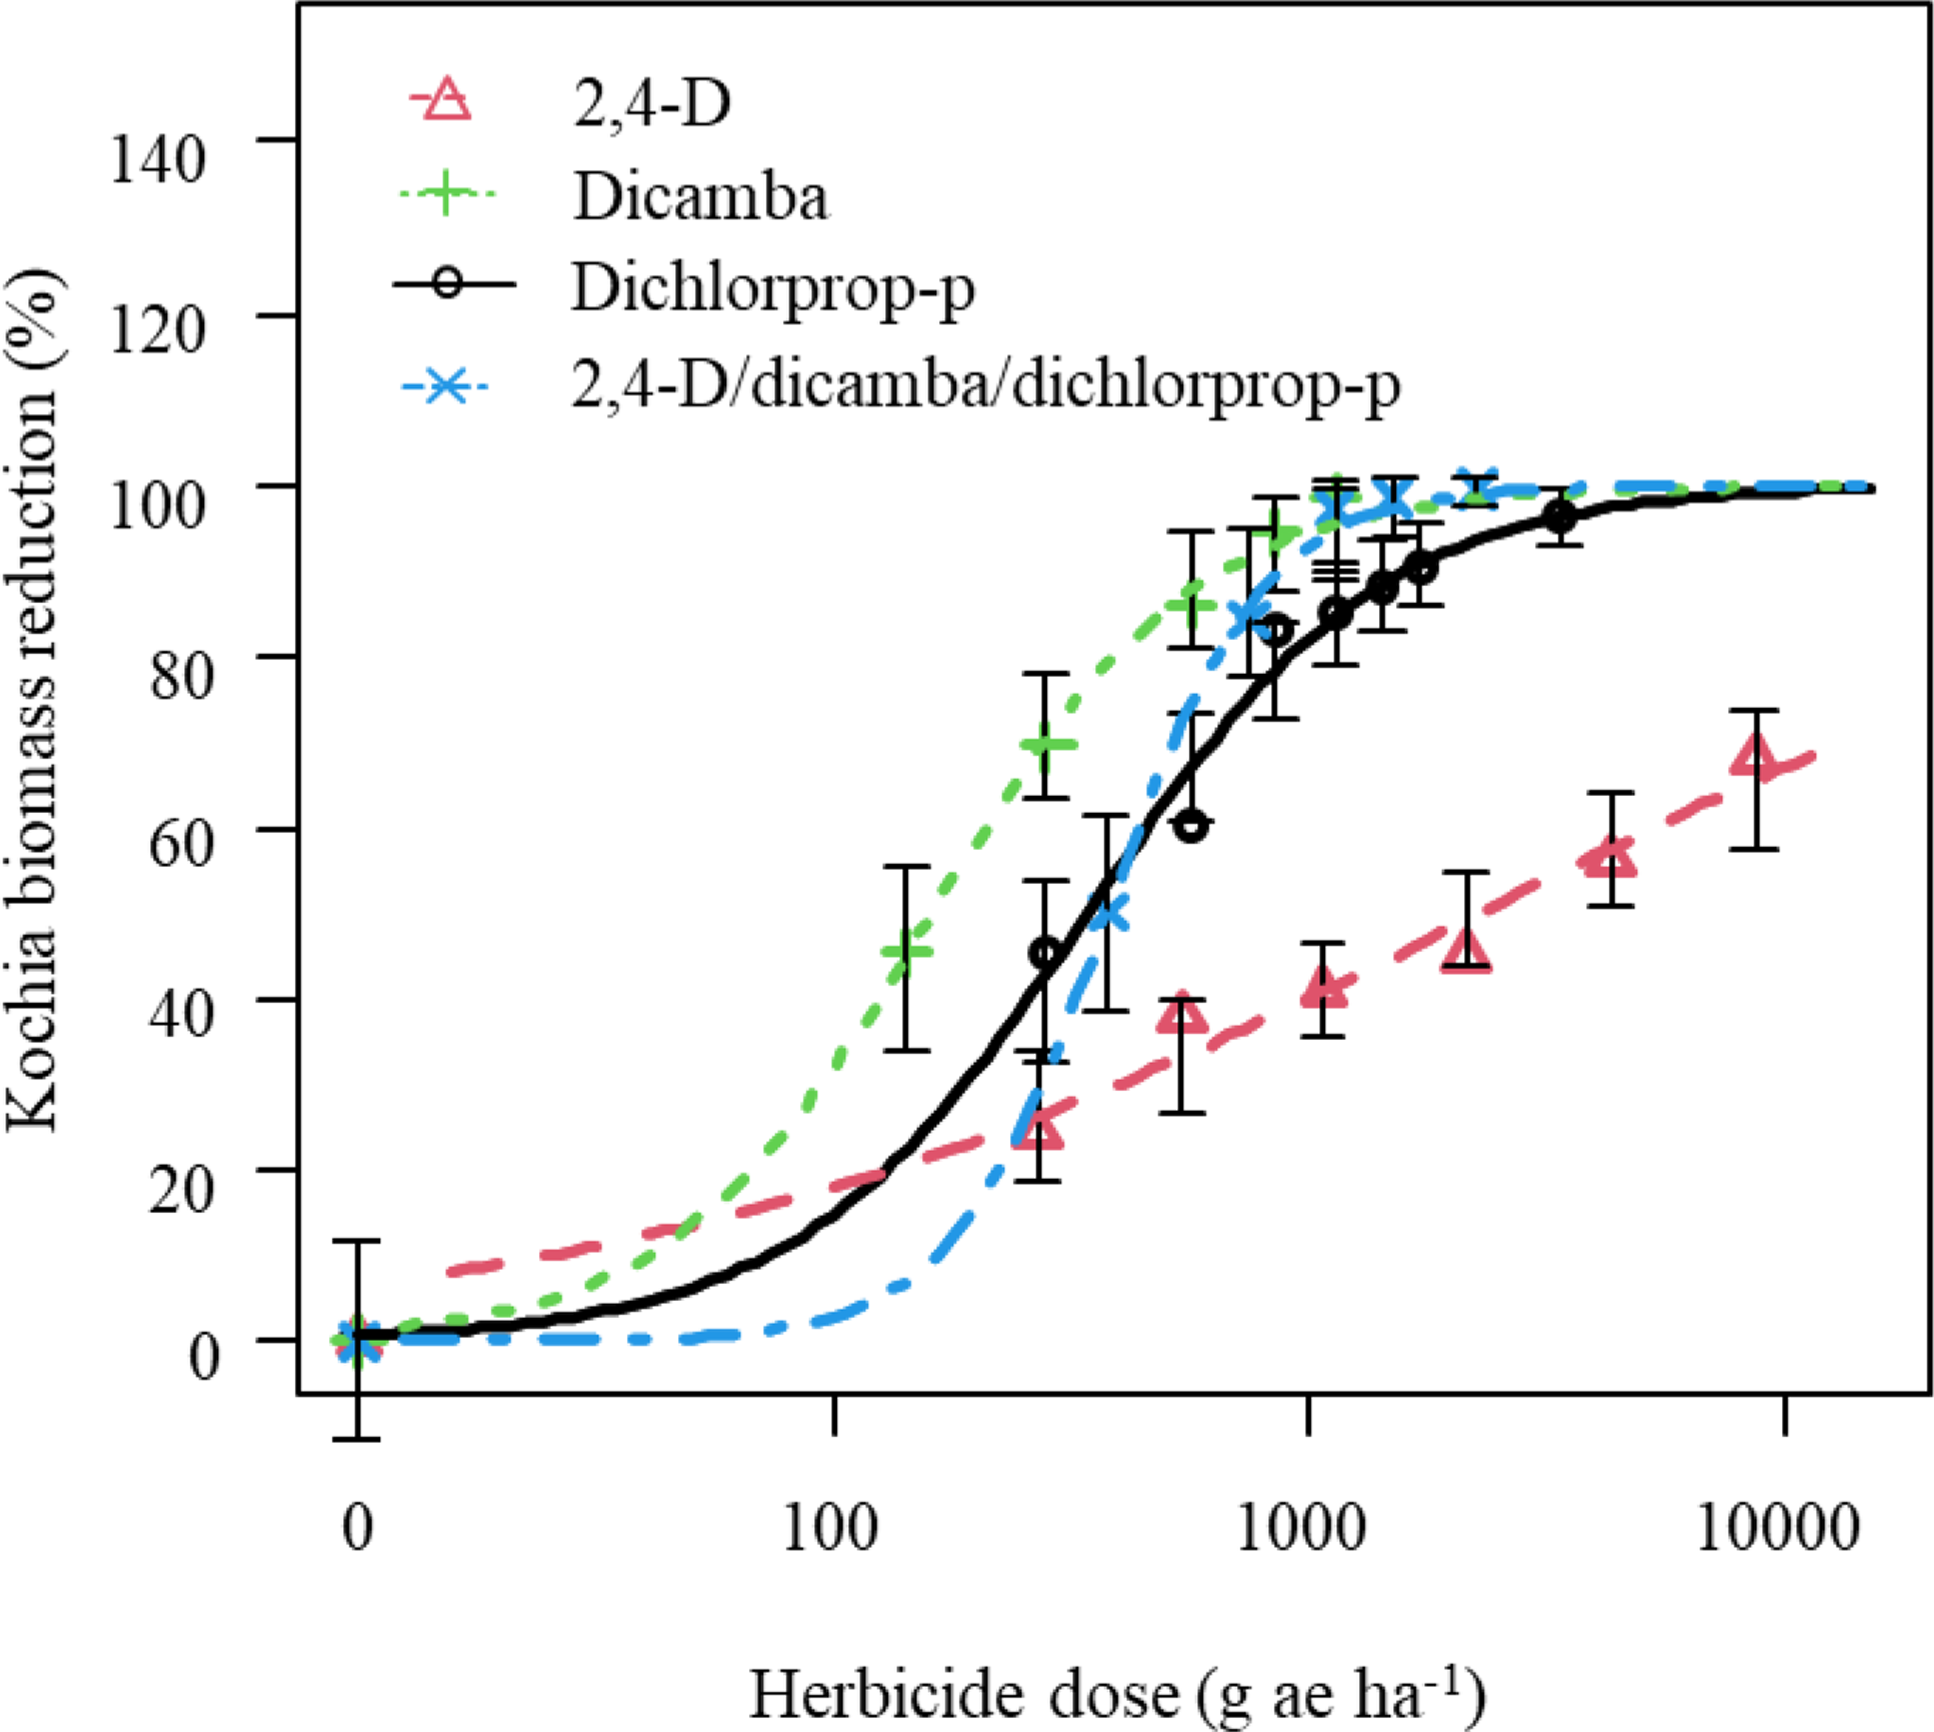
Consistent with percent visual control, the predicted dose of 2,4-D required to obtain a 50% reduction in shoot dry biomass of Gly-R kochia was 2,273 g ha−1 (Table 2; Figure 3). To obtain a 90% reduction in shoot dry biomass, >8,608 g ha−1 of 2,4-D was needed. Several researchers have reported that 2,4-D applied alone does not provide adequate control of kochia (Nandula and Manthey Reference Nandula and Manthey2002; Tonks and Westra Reference Tonks and Westra1997).
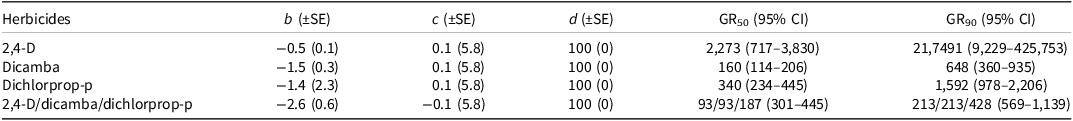
Regression parameter estimates for average shoot biomass reduction (% of nontreated) of glyphosate-resistant kochia at 28 d after treatment with 2,4-D, dicamba, dichlorprop-p, and 2,4-D/dicamba/dichlorprop-p premixture in separate dose-response field experiments. a

a Abbreviations: b represents the slope for each curve; c is the minimum shoot biomass reduction; d is the maximum kochia shoot biomass reduction (100%) (see Equation 2). GR50 and GR90 represent the herbicide doses (in grams per hectare, g ha−1) to obtain, respectively, 50% and 90% reductions in shoot biomass of glyphosate-resistant kochia. SE represents standard error of mean; CI, confidence interval. GR50 and GR90 values among herbicides are statistically different based on 95% CI.
Shoot dry biomass reduction (% of nontreated) of glyphosate-resistant kochia with various rates of 2,4-D, dicamba, dichlorprop-p, and 2,4-D/dicamba/dichlorprop-p premixture at 28 d after treatment. Symbols represent actual values, lines represent predicted values. Vertical bars indicate ± standard error of the mean values.

The predicted doses of dicamba to obtain 50% and 90% reductions in shoot dry biomass of Gly-R kochia were 160 g ha−1 and 648 g ha−1, respectively (Table 2; Figure 3). The greater dose of dicamba needed to obtain a 90% reduction in shoot biomass over the field-use rate of 560 g ha−1 indicates that this Gly-R kochia population has reduced susceptibility to the herbicide. Resistance to dicamba by kochia has been reported in several states in the Great Plains, including western Kansas (Heap Reference Heap2026; Kumar et al. Reference Kumar, Jha, Jugulam, Yadav and Stahlman2019a). Kumar et al. (Reference Kumar, Engel, Currie, Jha, Stahlman and Thompson2019b) reported that 837 g ha−1 to 1,334 g ha−1 of dicamba was needed to obtain a 50% reduction in shoot biomass of dicamba-resistant kochia populations. Similarly, Jha et al. (Reference Jha, Kumar and Lim2015) reported that 2,766 g ha−1 to 8,975 g ha−1 of dicamba was required to obtain a 90% reduction in shoot dry biomass in dicamba-resistant kochia populations. Dicamba-based herbicide mixtures with multiple sites of action could be an alternative to avoid or delay the further spread of resistance to dicamba in kochia.
To obtain reductions of 50% and 90% in shoot dry biomass, the predicted dichlorprop-p doses were 340 g ha−1 and 1,592 g ha−1, respectively (Table 2; Figure 3). Like 2,4-D and dicamba, the dose of dichlorprop-p required to obtain a 90% reduction in kochia biomass was greater than the field-use rate of 560 g ha−1, indicating that stand-alone applications of dichlorprop-p would not be sufficient to control Gly-R kochia. Torbiak et al. (Reference Torbiak, Blackshaw, Brandt, Hall, Hamman and Geddes2021) reported that dichlorprop-p/2,4-D at applied at 368 g ha−1/702 g ha−1 resulted in a 78% reduction in shoot biomass of Gly-R kochia in Alberta.
Consistent with percent visual control, the reduction in shoot dry biomass of Gly-R kochia with a premixture of 2,4-D/dicamba/dichlorprop-p followed a similar trend. Based on the nonlinear regression analysis, 50% and 90% reductions in shoot dry biomass was achieved with 373 g ha−1 and 854 g ha−1 of a 2,4-D/dicamba/dichlorprop-p premixture, respectively (Table 2; Figure 3). This equates to just 93 g ha−1 and 214 g ha−1 of dicamba to obtain, respectively, 50% and 90% reductions in shoot biomass, whereas 160 g ha−1 and 648 g ha−1 of dicamba, respectively, was required to obtain similar levels of biomass reduction when dicamba was applied alone. These results clearly showed that to obtain a 90% reduction in shoot dry biomass of Gly-R kochia, lower doses of 2,4-D, dicamba, and dichlorprop-p by about 1,021 times, 3 times, and 4 times, respectively, were needed in the 2,4-D/dicamba/dichlorprop-p premixture compared to their stand-alone applications. Torbiak et al. (Reference Torbiak, Blackshaw, Brandt, Hall, Hamman and Geddes2021) also reported a 99% biomass reduction of Gly-R kochia with a three-way mixture of dicamba, 2,4-D, and mecoprop-P.
Practical Implications
Results from this study indicate that a 2,4-D/dicamba/dichlorprop-p premixture can be an effective option for managing Gly-R kochia. The estimated dicamba dose required to achieve 90% control was approximately four times lower in the three-way premixture compared with dicamba applied alone, demonstrating improved efficacy of dicamba when used in combination with other auxinic herbicides. The ability to achieve high levels of control at lower dicamba doses has important implications for herbicide stewardship. In addition, the lower effective doses required in the premixture may provide economic benefits to growers while maintaining effective kochia control. It is important to note that all three herbicides in the 2,4-D/dicamba/dichlorprop-p premixture belong to Group 4. Therefore, repeated reliance on this premixture alone is not recommended, because continued exposure to auxinic herbicides may increase the risk of cross-resistance in kochia, as has previously been reported (LeClere et al. Reference LeClere, Wu, Westra and Sammons2018). Instead, the 2,4-D/dicamba/dichlorprop-p premixture should be used within an integrated weed management program that includes rotation with both preemergence and postemergence herbicides that have other sites of action and the incorporation of nonchemical control practices to preserve the long-term effectiveness of available herbicide options for Gly-R kochia management.
Acknowledgments
We thank Taylor Lambert and Matthew Vredenburg for their technical assistance in conducting field studies.
Funding
Financial support for this research was provided by NuFarm Company.
Competing Interests
The authors declare they have no competing interests.

 Open access