

The oral intake of the n-3 PUFA EPA and DHA is the major determinant of the levels of these fatty acids in blood lipids and in cells and tissues, including adipose tissue (AT)(Reference Hodson, Skeaff and Fielding1). However, other factors, such as age and sex, may also influence the incorporation and levels of EPA and DHA(Reference Childs, Romeu-Nadal and Burdge2, Reference Crowe, Skeaff and Green3). Fully understanding the different determinants of EPA and DHA status is important for correlating health benefits of these fatty acids with particular dietary intakes.
There is evidence, predominantly from cross-sectional analyses, suggesting that females have higher plasma DHA concentrations than males(Reference Crowe, Skeaff and Green3–Reference Garneau, Rudkowska and Paradis5). Tracer studies indicate that females may be more efficient than males at converting precursor n-3 PUFA such as α-linolenic acid into the very-long-chain n-3 PUFA EPA and DHA(Reference Pawlosky, Hibbeln and Novotny6–Reference Burdge and Wootton8). Whether sex influences the incorporation of EPA and DHA across a wide range of plasma lipid fractions and cells in response to different levels of habitual intake has, to our knowledge, not been reported.
There is also evidence suggesting that age may influence EPA and DHA concentrations in plasma fractions, cells and AT. Higher concentrations of EPA and DHA have been reported in older individuals, which appear to be independent of differences in dietary intakes(Reference Crowe, Skeaff and Green3, Reference Bolton-Smith, Woodward and Tavendale9). In response to supplementation to increase EPA and/or DHA concentrations, a greater increase in mononuclear cell EPA concentrations in older individuals has been reported(Reference Rees, Miles and Banerjee10), with no effect of age on the increase observed in plasma phosphatidylcholine concentrations(Reference Caslake, Miles and Kofler11). It is not clear whether these conflicting results are due to the different sample types used in these studies or to the n-3 fatty acid levels at which the study population was studied.
No n-3 PUFA supplementation studies have recruited and stratified participants on the basis of age and sex to explore whether these disparities reflect different intakes or rates of incorporation. Potential differences in EPA and DHA content or incorporation with age and sex have, to date, mostly been examined in post hoc analyses of plasma fractions and AT, and none has reported the effects of age and sex on EPA and DHA concentrations across a range of sample types. It is not clear whether differences in plasma fractions are reflected by similar differences in cells. Since health benefits of increased EPA and DHA consumption are widely attributed to the levels of these fatty acids present in cell membranes and hence altered cell function(Reference Calder12), it is important to determine whether age and sex similarly affect the incorporation of EPA and DHA into cells as well as into plasma lipids and AT. This will be important for better defining, and tailoring, public health messages regarding the consumption of oily fish and intakes of EPA and DHA for specific age groups and for each sex.
The aim of the present study was to determine whether age and sex influence the concentrations of EPA and DHA found in plasma fractions, cells and AT and whether age and sex account for differences in the response of plasma fractions and cells to increasing dietary intakes of EPA and DHA.
Experimental methods
Study design
The present study was carried out according to the guidelines laid down in the Declaration of Helsinki, and all procedures involving human subjects were approved by the Suffolk Local Research Ethics Committee (approval 05/Q0102/181). Written informed consent was obtained from all the participants. The study was registered at http://www.controlled-trials.com (Trial Registration: ISRCTN48398526).
The design of the present study has been described previously in detail(Reference Browning, Walker and Mander13). Briefly, the study was a double-blind, randomised, controlled intervention trial carried out over 12 months, with five parallel groups, in two centres in the UK. Participants who reported no habitual consumption of oily fish (defined as less than one portion per month) were recruited in Cambridge and Southampton, UK. Randomisation was carried out by age (‘young’ 20–39 years, ‘middle aged’ 40–59 years, and ‘old’ 60–79 years) and sex (male and female). Exclusion criteria were the diagnosis of diabetes, cancer, CVD or other chronic clinical conditions; untreated hypertension; concomitant prescription of anticoagulants, non-steroidal anti-inflammatory drugs, aspirin, steroids or immunosuppressants; allergy or intolerance to fish; consumption of fish-oil supplements in the last 3 months; consumption of oily fish more than once a month; smoking status; history of substance abuse or alcoholism; being pregnant, < 1 year postpartum or planning pregnancy; recent weight change (>2 kg in the past 1 month); planning to change dietary habits, increase physical activity, change body weight, move away from the study centre locality or take a lengthy vacation during the time of the study; and BMI < 18 or >35 kg/m2.
The intervention was capsule based to control the delivery. A total of 1·5 g EPA and 1·77 g DHA (i.e. 3·27 g EPA plus DHA) as TAG, equivalent to the amount in one portion of oily fish(14), was provided by six 0·75 g capsules. To simulate habitual consumption patterns, capsules equating one portion of oily fish were provided on 0, 1, 2 or 4 d of the week, giving the so-called ‘0 portions’, ‘1 portion’, ‘2 portions’ or ‘4 portions’ groups. To maintain the blinding of the study design, six 0·75 g placebo capsules (high-oleic sunflower oil) were given on all the remaining days of the week. For an additional group (not reported herein), the traditional design of capsule-based intervention studies was followed; this group received the equivalent amount of EPA plus DHA provided to the ‘2 portions of oily fish’ group, but distributed evenly over the 7 d (‘2C portions’). Capsules were blister packed, with day labelling to help increase compliance.
Sample preparation and fatty acid composition analysis
Fasting blood, buccal cell (BU) and AT samples were collected at baseline and 12 months. The following samples were analysed for fatty acid composition: plasma phosphatidylcholine; plasma cholesteryl esters; plasma TAG; plasma NEFA; blood mononuclear cells (MNC); erythrocyte membranes (RBC); platelets (PLAT); BU; AT.
Total lipid was extracted into chloroform–methanol (2:1, v/v) from plasma, MNC, RBC, PLAT, BU and homogenised AT samples as described previously(Reference Browning, Walker and Mander13). Plasma lipids were further separated into the four fractions described above using a solid-phase extraction procedure. Fatty acid methyl esters were prepared by incubation with methanol containing 2 % (v/v) H2SO4 at 50°C for 2 h. After allowing the tubes to cool, the samples were neutralised with a solution of 0·25 m-KHCO3 and 0·5 m-K2CO3. Fatty acid methyl esters were extracted into hexane, dried, redissolved in a small volume of hexane and separated on a Hewlett Packard 6890 gas chromatograph fitted with a BPX-70 column (30 m × 0·22 mm × 0·25 μm)(Reference Browning, Walker and Mander13). The instrument was controlled by and data were collected using the HPChemStation software (Hewlett Packard). Fatty acid methyl esters were identified by comparing their retention times with those of authentic standards run previously.
Statistical analyses
Data were analysed for participants completing the 12-month intervention. Comparisons were made between the age groups (‘middle aged’ v. ‘young’ and ‘old’ v. ‘young’) and between the sexes (male v. female). Baseline data were analysed using a linear regression model to determine age or sex differences, adjusted for BMI, and change data (12 months − baseline) were analysed using a linear regression model adjusted for study centre, treatment group (number of ‘portions per week’), BMI and average compliance (%) over the 12 months. We defined significance as P <0·05, and for these analyses, no multiplicity correction was considered. All the analyses were carried out using Stata version 11 (StataCorp LP).
Results
Compliance and dietary intakes
Compliance and dietary intake data have been reported previously(Reference Browning, Walker and Mander13). Briefly, capsule count data indicated compliance to be high (98·1 %, interquartile range 2·2, range 87·4–100 %), with 4 d unweighed food diaries indicating no significant differences in dietary variables between the intervention groups or time points(Reference Browning, Walker and Mander13). Dietary data were further analysed for the effects of sex (Table 1) and age (Table 2). MUFA intake (as a percentage of total dietary energy) was significantly higher in males than in females, but there were no differences with regard to age. There were no significant differences in the reported intakes of any of the dietary fat variables, when analysed for change between baseline and 12 months.
Sex differences in macronutrient intakes from 4 d unweighed food diaries at baseline and change with 12-month EPA+DHA intervention (Mean values and standard deviations)
* Percentage of total dietary energy per d.
† Change (12 months − baseline) expressed as a percentage of total dietary energy per d.
‡ Analysis is baseline regressed on male v. female, adjusted for BMI.
§ Analysis is change regressed on male v. female, adjusted for treatment group, compliance and BMI.
Age differences in macronutrient intakes from 4 d unweighed food diaries at baseline and change with 12-month EPA+DHA intervention (Mean values and standard deviations)
* Percentage of total dietary energy per d.
† Change (12 months − baseline) expressed as a percentage of total dietary energy per d.
‡ Analysis is baseline regressed on middle aged v. young and old v. young with a global test for age group presented, adjusted for BMI.
§ Analysis is change regressed on middle aged v. young and old v. young with a global test for age group presented, adjusted for treatment group, compliance and BMI.
Sex differences in baseline EPA and DHA concentrations in plasma fractions, cells and adipose tissue
The concentrations of EPA and DHA in the different fractions at baseline for males and females are given in Table 3. Females had a higher concentration of EPA in plasma NEFA than males. There were no other sex differences for EPA at baseline. The concentrations of DHA in MNC, BU and AT were higher in females than in males, with non-significant trends being observed for higher DHA concentrations in plasma cholesteryl ester (P= 0·07) and PLAT (P= 0·09).
Sex differences in baseline EPA and DHA concentrations in plasma fractions, cells and adipose tissue (AT) (Mean values and standard deviations; mean differences and 95 % confidence intervals)
PC, phosphatidylcholine; CE, cholesteryl esters; MNC, mononuclear cells; RBC, erythrocyte membranes; PLAT, platelets; BU, buccal cells.
* EPA or DHA expressed as a percentage of total fatty acids.
† EPA or DHA expressed as a percentage of total fatty acids for females compared with that for males adjusted for BMI.
‡ Analysis is baseline regressed on male v. female, adjusted for BMI.
Age differences in baseline EPA and DHA concentrations in plasma fractions, cells and adipose tissue
The concentrations of EPA and DHA in the different fractions at baseline for the three age categories are given in Table 4. Overall EPA concentrations in AT and DHA concentrations in plasma TAG and AT increased significantly with increasing age (i.e. across the three age categories), with similar trends being observed for EPA in MNC and DHA in BU (P= 0·07). The concentrations of EPA in MNC and those of DHA in AT were significantly higher in the middle-aged v. the young participants. The concentrations of EPA in MNC and AT and those of DHA in BU and AT were significantly higher in the old v. the young participants.
Age differences in baseline EPA and DHA concentrations in plasma fractions, cells and adipose tissue (AT) (Mean values and standard deviations; mean differences and 95 % confidence intervals)
PC, phosphatidylcholine; CE, cholesteryl esters; MNC, mononuclear cells; RBC, erythrocyte membranes; PLAT, platelets; BU, buccal cells.
* EPA or DHA expressed as a percentage of total fatty acids.
† EPA or DHA expressed as a percentage of total fatty acids between different age categories adjusted for BMI.
‡ Analysis is baseline regressed on middle aged v. young and old v. young with a global test for age group presented, adjusted for BMI.
Sex differences in response to 12-month EPA and DHA supplementation
Sex differences in EPA and DHA concentrations following 12-month supplementation in the ‘0 portions’, ‘1 portion’, ‘2 portions’ and ‘4 portions’ groups are shown in Figs. 1 and 2. There were clear dose-dependent increases in EPA (Fig. 1) and DHA (Fig. 2) concentrations in all the fractions studied for both males and females, except in RBC and BU for EPA. Adjusted mean differences in EPA and DHA concentrations between the sexes for change between baseline and 12 months are given in Table 5. The increase in EPA concentrations in plasma TAG was significantly greater in females than in males, with a similar non-significant trend being observed for PLAT (P= 0·08). There were no significant sex differences in the increase in DHA concentrations.
Sex differences in EPA concentrations in plasma fractions ((a), phosphatidylcholine, (b) cholesteryl esters, (c) NEFA and (d) TAG), cells ((e) mononuclear cells, (f) erythrocyte membranes, (g) platelets and (h) buccal cells) and (i) adipose tissue at 12 months following supplementation with EPA equivalent to 0, 1, 2 and 4 portions of oily fish per week. Values are means, with standard deviations of EPA represented by vertical bars as a percentage of total fatty acids at 12 months. □, Men; ○, women.
Sex differences in DHA concentrations in plasma fractions ((a), phosphatidylcholine, (b) cholesteryl esters, (c) NEFA and (d) TAG), cells ((e) mononuclear cells, (f) erythrocyte membranes, (g) platelets and (h) buccal cells) and (i) adipose tissue at 12 months following supplementation with DHA equivalent to 0, 1, 2 and 4 portions of oily fish per week. Values are means, with standard deviations of DHA represented by vertical bars as a percentage of total fatty acids at 12 months. □, Men; ○, women.
Sex differences in the change in EPA and DHA concentrations in plasma fractions, cells and adipose tissue (AT) following 12-month supplementation with EPA+DHA (Mean differences and 95 % confidence intervals)
PC, phosphatidylcholine; CE, cholesteryl esters; MNC, mononuclear cells; RBC, erythrocyte membranes; PLAT, platelets; BU, buccal cells.
* Change in EPA or DHA concentrations expressed as a percentage of total fatty acids for females compared with that for males adjusted for treatment group, compliance and BMI.
† Analysis is change regressed on male v. female, adjusted for treatment group, compliance and BMI.
Age differences in response to 12-month EPA and DHA supplementation
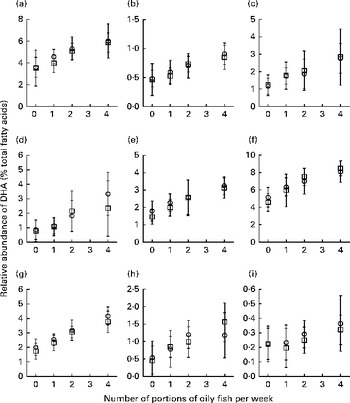
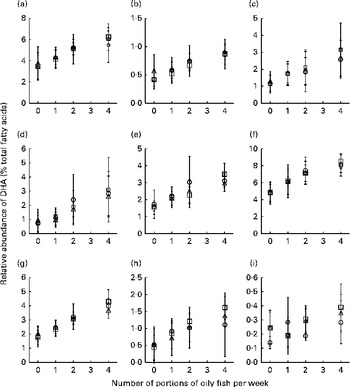
Age differences in EPA and DHA concentrations following 12-month supplementation in the ‘0 portions’, ‘1 portion’, ‘2 portions’ and ‘4 portions’ groups are shown in Figs. 3 and 4. There were clear dose-dependent increases in EPA (Fig. 3) and DHA (Fig. 4) concentrations in all the fractions studied in all the three age groups, except in RBC and BU for EPA. Adjusted mean differences in EPA and DHA concentrations between the age categories for change between baseline and 12 months are given in Table 6. Overall, the increase in EPA concentrations in plasma TAG was greater with increasing age, while the increase in DHA concentrations in AT was smaller with increasing age. The increases in EPA concentrations were greater in several fractions for the middle-aged v. the young group, reaching significance for EPA in plasma NEFA, plasma TAG and PLAT. The increase in DHA concentrations in AT was smaller in the old v. the young group.
Age differences in EPA concentrations in plasma fractions ((a), phosphatidylcholine, (b) cholesteryl esters, (c) NEFA and (d) TAG), cells ((e) mononuclear cells, (f) erythrocyte membranes, (g) platelets and (h) buccal cells) and (i) adipose tissue at 12 months following supplementation with EPA equivalent to 0, 1, 2 and 4 portions of oily fish per week. Values are means, with standard deviations of EPA represented by vertical bars as a percentage of total fatty acids at 12 months. ○, Young; □, middle aged; Δ, old.
Age differences in DHA concentrations in plasma fractions ((a), phosphatidylcholine, (b) cholesteryl esters, (c) NEFA and (d) TAG), cells ((e) mononuclear cells, (f) erythrocyte membranes, (g) platelets and (h) buccal cells) and (i) adipose tissue at 12 months following supplementation with DHA equivalent to 0, 1, 2 and 4 portions of oily fish per week. Values are means, with standard deviations of DHA represented by vertical bars as a percentage of total fatty acids at 12 months. ○, Young; □, middle aged; Δ, old.
Age differences in the change in EPA and DHA concentrations in plasma fractions, cells and adipose tissue (AT) following 12-month supplementation with EPA+DHA (Mean differences and 95 % confidence intervals)
PC, phosphatidylcholine; CE, cholesteryl esters; MNC, mononuclear cells; RBC, erythrocyte membranes; PLAT, platelets; BU, buccal cells.
* Change in EPA or DHA concentrations expressed as a percentage of total fatty acids between different age categories, adjusted for treatment group, compliance and BMI.
† Analysis is change regressed on middle aged v. young and old v. young with a global test for age group presented, adjusted for treatment group, compliance and BMI.
Discussion
The present study addressed whether the response to n-3 PUFA interventions is related to sex and age. We have previously reported a significant dose response to the EPA+DHA intervention in the same study population(Reference Browning, Walker and Mander13). Herein, we report some significant differences according to sex and age in EPA and DHA concentrations in some plasma fractions and cells at baseline and with regard to the extent of change in response to modest levels of supplementation with EPA and DHA.
Sex
We found significantly higher DHA concentrations in MNC, BU and AT in females than in males at baseline and a greater increase in EPA concentrations in plasma TAG in females in response to the supplementation with EPA and DHA for 1 year. Similar trends in DHA concentrations in plasma fractions and cells at baseline were observed, although these did not reach statistical significance. The dietary data suggest that there are no significant differences in the intake of n-6 or n-3 PUFA between males and females to account for these differences, suggesting that they reflect biological differences. The differences were not explained by differences in BMI.
Previous studies have reported differences in the DHA content of plasma fractions between the sexes similar to those found in the present study. These previous studies include both small cross-sectional studies(Reference Bakewell, Burdge and Calder4, Reference Nikkari, Luukkainen and Pietinen15, Reference Giltay, Gooren and Toorians16) and large-scale population surveillance(Reference Crowe, Skeaff and Green3, Reference Tavendale, Lee and Smith17, Reference Welch, Bingham and Ive18). However, previous studies did not purposively recruit non-consumers of oily fish and so included participants with varying consumption levels, and one study included high habitual consumers of oily fish(Reference Dewailly, Blanchet and Lemieux19). Among a population with known high intakes of oily fish, women reported significantly lower consumption of n-3 PUFA and yet were found to have significantly higher phospholipid DHA concentrations(Reference Dewailly, Blanchet and Gingras20). Where dietary data were collected, differences in dietary intakes between men and women did not explain the detected sex differences in DHA content of the plasma lipid fraction studied.
Differences in fatty acid metabolism (in synthesis, interconversion and degradation of fatty acids) may be responsible for the sex differences in DHA status observed in the present study. Studies using stable isotopes to trace fatty acid metabolism have shown increased synthesis of DHA from shorter-chain precursors in females(Reference Pawlosky, Hibbeln and Novotny6–Reference Burdge and Wootton8) and decreased retroconversion of DHA to DPA and EPA in females(Reference Brossard, Croset and Pachiaudi21). It is hypothesised that female sex hormones are responsible for these changes in n-3 PUFA metabolism(Reference Childs, Romeu-Nadal and Burdge2). Indeed, studies have shown differences in DHA status with the use of hormone replacement therapy(Reference Sumino, Ichikawa and Murakami22) and that hormone replacement therapy reduces the retroconversion of DHA(Reference Stark and Holub23). A study on the use of raloxifene implicates the oestrogen receptor in the control of n-3 PUFA metabolism(Reference Giltay, Duschek and Katan24).
In addition, we found significantly higher EPA concentrations in plasma NEFA in females than in males, though not in any of the other plasma fractions or cells. While most studies have reported no significant difference in EPA concentrations between males and females, Crowe et al. (Reference Crowe, Skeaff and Green3) reported significantly higher EPA concentrations in plasma phospholipid and cholesteryl esters, but not in TAG, in females. They did not report on plasma NEFA. In the fasting state, plasma NEFA reflects the fatty acids most recently mobilised from AT. There was no sex difference in the EPA concentrations of AT in the present study. However, we assessed the fatty acid composition of only a single depot (abdominal subcutaneous), and there is some evidence that the fatty acid composition of different depots may be different(Reference Calder, Harvey and Pond25). Thus, it may be that the different fat distribution in females compared with that in males and different rates or patterns of release of NEFA from different depots give rise to a difference in plasma NEFA composition.
The present study found no significant sex differences in the change in DHA concentrations with the EPA+DHA intervention. This is in contrast to the findings of cross-sectional studies showing higher DHA concentrations in females than in males with high consumption of oily fish(Reference Dewailly, Blanchet and Lemieux19, Reference Dewailly, Blanchet and Gingras20). The latter studies suggest that sex differences in DHA status do not only occur in the absence of dietary DHA, where they would rely predominantly on endogenous production, but also occur in the presence of higher intakes of preformed DHA. It is possible that the present study was too small to identify an effect of sex on the increase in DHA concentrations when preformed DHA is consumed. It is also possible that the effects of sex are dependent on age, especially if female sex hormones play a central role.
Age
In keeping with the reported literature, we showed an age-related increase in EPA and DHA concentrations in some of the plasma fractions and cells studied and in AT (except for DHA in AT, where there was a smaller change in DHA concentrations with increasing age). Although most studies have reported results from plasma fractions(Reference Crowe, Skeaff and Green3, Reference Tavendale, Lee and Smith17, Reference Dewailly, Blanchet and Lemieux19, Reference Dewailly, Blanchet and Gingras20, Reference Babin, Abderrazik and Favier26), there are also reports of significant age differences in EPA and DHA concentrations in RBC(Reference Sands, Reid and Windsor27, Reference Sala-Vila, Harris and Cofan28) and AT(Reference Bolton-Smith, Woodward and Tavendale9, Reference Ogura, Takada and Okuno29). Previous studies have attributed age differences in EPA and DHA concentrations to differences in dietary intakes(Reference Crowe, Skeaff and Green3, Reference Dewailly, Blanchet and Lemieux19, Reference Dewailly, Blanchet and Gingras20, Reference Sala-Vila, Harris and Cofan28), but this cannot explain the findings of the present study or others, and some studies have shown that age remains a significant determinant of EPA and DHA status after adjustment for dietary intakes(Reference Sands, Reid and Windsor27, Reference Itomura, Fujioka and Hamazaki30, Reference de Groot, van Boxtel and Schiepers31), suggesting an age-dependent effect independent of dietary intakes. The present study did not recruit habitual oily fish consumers, and therefore the intakes of preformed EPA and DHA are likely to be low. Therefore, it seems unlikely that the age-related differences in EPA and DHA concentrations at baseline are due to differences in the intake of n-3 PUFA with age. Rather, they may be related to age-related differences in endogenous production and incorporation of EPA and DHA. This could be due to hormones and hormone sensitivity, body composition and physical activity, all of which change with age.
In contrast to the observation made at baseline, we observed a smaller increase in DHA concentrations in AT with increasing age in response to the EPA+DHA intervention. This would suggest age-related differences in the handling and storage of exogenously supplied DHA. This could be related to impaired insulin sensitivity with ageing or to differences in body composition with ageing. Despite the relatively low contributions of EPA and DHA to total AT fatty acids, because of the bulk of AT, this represents a significant store of EPA and DHA, containing the equivalent of several hundred days of a typical intake.
The observed greater incorporation of EPA in relation to increasing age mostly reflected the difference between middle-aged and young adults, rather than that between old and young adults. Crowe et al. (Reference Crowe, Skeaff and Green3) showed a non-linear trend in EPA content in plasma phospholipids with age, with a bigger between-group difference at the lower end. This could be due, in part, to greater differences in female sex hormone concentrations among younger women, again suggesting that effects of age may, in part, be due to sex, and hence menopausal status is an important consideration. The present study was not large enough to determine the effects of sex and age on the EPA and DHA response to the intervention, and as such, we were unable to determine any menopausal difference in women in the present study.
Other considerations
It is conceivable that factors other than those fully considered herein may help to explain the observed differences in EPA and DHA concentrations in a given plasma fraction or cell type and their responses to intervention. Dewailly et al. (Reference Dewailly, Blanchet and Lemieux19) showed no effect of smoking on n-3 PUFA concentrations in Nunavik Inuit population consuming high quantities of oily fish, but they showed that alcohol intake, waist circumference and CVD medication use were all significant factors. In Quebec participants who also have a high oily fish intake, smoking, alcohol and waist circumference were significant determinants of EPA and DHA status(Reference Dewailly, Blanchet and Gingras20). In the Framingham Heart Study, population factors that were significantly correlated with n-3 PUFA status were age, sex, higher education, fish-oil supplement use, dietary EPA and DHA intakes, aspirin use, lipid-lowering medication use and LDL-cholesterol concentrations (all positive) and heart rate, TAG concentrations, waist girth and smoking (all negative)(Reference Harris, Pottala and Lacey32). Of these factors, the present study investigated the effects of age and sex and excluded users of fish-oil supplements and high oily fish consumers. It is possible that some of the other factors may have played a role.
Relevance to cell function and health
EPA and DHA are known to affect the function of many cell types with actions in many aspects of physiology including lipid metabolism, inflammation, immune function, platelet aggregation, smooth muscle contraction, cardiac rhythm, insulin sensitivity and bone turnover(Reference Calder12). The effects of EPA and DHA are best described in relation to a beneficial effect on cardiovascular morbidity and mortality(Reference Calder33, Reference Calder and Yaqoob34). The present study suggests that both sex and age need to be considered when anticipating any potential health advantages of EPA and DHA.
Conclusions
In the present study, we showed some age- and sex-related differences in EPA and DHA concentrations in some plasma fractions, cells and AT and some age- and sex-related differences in the increase in EPA and DHA concentrations when these fatty acids are given preformed. However, the effect sizes of both sex and age are smaller than the effect size of a modest increase in the intake of EPA+DHA equivalent to one portion of oily fish per week. Therefore, the findings of the present study do not support the development of different dietary guidelines for EPA and DHA intakes for adults according to sex or age. A possible effect of age and sex on EPA and DHA status should be investigated in future well-powered studies.
Acknowledgements
The authors acknowledge Laura Wang, Stephen Young and Sadig Lula for their contributions to fatty acid analysis, Joanna Gambell for data collection, and the research nursing team at the Wellcome Trust Clinical Research Facility, University Hospital Southampton National Health Service Foundation Trust.
The present study was funded by the UK Foods Standards Agency (N05065/66). The views expressed are those of the authors and do not necessarily reflect UK Government policy or advice. C. G. W., L. M. B., S. A. J. (U105960389) and A. P. M. (U1059.00.014) are supported by the UK Medical Council. P. C. C. is supported by the National Institute of Health Research through the NIHR Southampton Biomedical Research Centre. Equazen (Wallingford, Oxford, UK) supplied the capsules for the intervention.
The authors' contributions were as follows: L. M. B., P. C. C. and S. A. J. designed the study; L. M. B., C. G. W., J. M. and A. L. W. conducted the research; L. M. B., C. G. W. and A. P. M. analysed the data; C. G. W. and L. M. B. wrote the manuscript; all authors read and approved the final manuscript.
P. C. C. serves on the Scientific Advisory Boards of the Danone Research Centre in Specialised Nutrition, Aker Biomarine, Pronova BioPharma and Smartfish. He acts as a consultant to Mead Johnson Nutritionals, Vifor Pharma and Amarin Corporation. He has received speaking honoraria from Solvay Healthcare, Solvay Pharmaceuticals, Pronova BioPharma, Fresenius Kabi, B. Braun, Abbott Nutrition, Baxter Healthcare, Nestlé, Unilever and DSM. He is currently receiving research funding from Vifor Pharma and Abbott Nutrition. He serves on the executive board of the International Society for the Study of Fatty Acids and Lipids, an organisation that is partly supported by corporate membership fees, mainly the food and supplements industries. He is a member of the Board of Directors of the European Nutraceutical Association and of the Council of the British Nutrition Foundation; these organisations are each supported in part by the food and supplements industries. S. A. J. has previously served on the Scientific Advisory Boards for Tanita, PepsiCo, Nestlé, Coca-Cola, Californian Almond Board, Heinz and Kellogs. She is currently a member of the Tanita Medical Advisory Board and receiving a fee for nutrition articles in the Rosemary Conley Diet and Fitness Magazine. The other authors report no conflicts of interest.


