




I. INTRODUCTION
Magnetic cooling systems at room temperature have emerged as an alternative to the conventional refrigeration technology due to two breakthrough discoveries at the end of the 1990s: the magnetic refrigerator prototype developed by Zimm et al.Reference Zimm, Jastrab, Sternberg, Pecharsky, Gschneidner, Osborne, Anderson and Kittel1 in 1998 and the giant magnetocaloric effect (GMCE) discovery by Pecharsky and Gschneider reported in 1997.Reference Pecharsky and Gschneidner2 These milestones led to a remarkable increase in the number of room temperature magnetic refrigerator prototypes developed per year and exponential interest in the search for optimized magnetocaloric materials because it offered the possibility of using green energy, compared to today’s conventional cooling systems such as air conditioners and freezers.Reference Kitanovski, Tušek, Tomc, Plaznik, Ožbolt and Poredoš3,Reference Franco, Blázquez, Ingale and Conde4 One of the key points of this technology is the magnetic material since the GMCE is associated with a first-order transition, arising from the strong spin-lattice interplay thus leading to a strong magnetovolume exhibited by these materials.Reference Liu, Gottschall, Skokov, Moore and Gutfleisch5–Reference Morellon, Algarabel, Ibarra, Blasco, García-Landa, Arnold and Albertini7 Till now, several families of compounds exhibiting the magnetocaloric effect (MCE) near room temperature were discovered, such as Fe–Rh,Reference Annaorazov, Nikitin, Tyurin, Asatryan and Dovletov8 Gd–Si–Ge,Reference Pecharsky and Gschneidner2 La–Fe–SiReference Fujieda, Fujita and Fukamichi9; Ni–Mn–Ga,Reference Hu, Shen and Sun10 Mn–As,Reference Wada and Tanabe11 and manganites systems.Reference Mira, Rivas, Hueso, Rivadulla and Lopez Quintela12 Recently, another material was found, Eu2In, exhibiting remarkable magnetocaloric properties, despite its still low operational temperature.Reference Guillou, Pathak, Paudyal, Mudryk, Wilhelm, Rogalev and Pecharsky13 Since their discovery, there has been a constant effort to understand how to improve their magnetocaloric properties.Reference Liu, Phillips, Mattana, Bibes, Barthélémy and Dkhil14–Reference Morikawa and Wada18 As the prototype development and optimization continue, other challenges have appeared such as (i) the reduction of the heat exchange time between the material and the heat exchangerReference Kitanovski, Tušek, Tomc, Plaznik, Ožbolt and Poredoš3; (ii) smart thermal control via integrated thermal switchesReference Puga, Bordalo, Silva, Dias, Belo, Araújo, Oliveira, Pereira and Ventura19,Reference Wehmeyer, Yabuki, Monachon, Wu and Dames20 ; (iii) diminish the undesirable magnetic hysteresis lossReference Provenzano, Shapiro and Shull15,Reference Zhang, Shen, Xu, Zheng, Shen, Hu, Sun and Long21 ; (iv) increase the mechanical stability of the magnetic materials in order for them to be able to undergo hundreds of thousands of cycles andReference Radulov, Karpenkov, Skokov, Karpenkov, Braun, Brabänder, Gottschall, Pabst, Stoll and Gutfleisch22–Reference Radulov, Karpenkov, Specht, Braun, Karpenkov, Skokov and Gutfleisch24; (v) increase the materials MCE for low-applied field valuesReference Moore, Perkins, Bugoslavsky, Chattopadhyay, Roy, Chaddah, Pecharsky, Gschneidner and Cohen25; (vi) expanding operational temperature range by exploring further the study of cascade systems composed of several magnetocaloric materials. On materials development, the main strategies that have been adopted to cope with these challenges are chemical stoichiometry tuning, multistimulus (pressure, magnetic field, and temperature) and the size-reduction. The latter is the most unexplored strategy in this field. It is important to remark that the micro- and nanostructuring advantageous features could be brought to the macroscale by following smart bottom–up assembling strategies. In this review, we will focus on the latter by highlighting the most relevant breakthroughs on the field. The remarkable effort, intensified in the last years, to study magnetocaloric materials, or more generally materials with strong magnetovolume coupling, at the micro- and nanoscale is motivated not only by the need to solve the above-mentioned challenges in macroscopic magnetic refrigeration applications but also for opening new avenues on exploring these effects on innovative micro- and nanodevices. From the purely scientific interest, there are several fundamental questions deserving highlight: (i) the existence/absence of a critical size below which the magnetovolume coupling vanishes; (ii) impact of the symmetry (magnetic, electrical, etc.) break at the nanostructure surface; (iii) the materials atomic structure stabilization; (iv) interface film-substrate and core–shell effects; (v) the impact of intrinsic surface stress in nanoparticles; (vi) the effects of introducing micron-sized pores; (vii) the consequences of changing the grain size; (viii) the repercussion in the transition kinetics, among others.
Concerning the technological applications, the role played by the size-reduction on the engineering of innovative devices at the micro- and nanoscale is still in its early age. As fundamental research continues to further develop, novel devices/ideas are expected to arise rapidly, including microrefrigerators,Reference Kim, Ghirlanda, Adams, Bethala, Sambandam and Bhansali26–Reference Wu, Lu, Liu and He28 thermal switches,Reference Puga, Bordalo, Silva, Dias, Belo, Araújo, Oliveira, Pereira and Ventura19,Reference Wehmeyer, Yabuki, Monachon, Wu and Dames20 microfluidic pumps,Reference Love, Jansen, McKnight, Roh and Phelps29–Reference Kitanovski and Egolf31 energy harvesting devices,Reference Ozaydin and Liang32 or even at the biomedical applications such as hyperthermia or drug delivery.Reference Tishin, Spichkin, Zverev and Egolf33
In the past few years, the size-reduction efforts were reviewed by different authors. Each author has focused on one particular micro or nanostructure, as the case of the thorough review dedicated to the development of magnetocaloric thin films by Miller and coworkers, were they stress the necessity of smart engineering to take full advantage of the miniaturization novel opportunities.Reference Miller, Belyea and Kirby34 Franco and coauthors have dedicated a section to the nanostructured materials on their general materials review, where the importance of correct assessment of the materials properties at the micro- and nanoscale is addressed.Reference Miller35 More recently, Lyubina illustrated the importance of the magnetocaloric thin film development, in particular, in their potential to change the way the magnetocaloric materials are applied in a system.Reference Lyubina36 Alternatively, magnetocaloric nanoparticles have been attracting considerable attention due to their various application prospects as identified by Tishin and coworkers in their review report.Reference Tishin, Spichkin, Zverev and Egolf33
In this review, the goal is to give the reader a general overview of the miniaturization (from micro- to nanoscale) of different structures (microparticles, nanoparticles, nanowires, nanorods, and thin films) of the most important magnetocaloric materials families. As going along the groundbreaking results published so far, the major challenges that have been overcome and those that still need to be tackled will be identified. We have decided to highlight innovative results considering different points of view: unique production methods, micro- and nanoscale characterization techniques, and the discovery of unexpected results obtained in simple and complex systems. All the mentioned results will be compared with their respective bulk counterparts.
This review is divided by sections dedicated to different material families and where at least two different micro/nanostructures are covered.
II. MAGNETOCALORIC EFFECT
Before deepening onto the different materials micro- and nanostructure, a brief description of the MCE should be given. The MCE has a 2-fold definition: (i) it is a temperature change undergone by a magnetic material when a field is applied in an adiabatic process (ΔT ad) and (ii) it is an entropy change of a magnetic material when a magnetic field is applied in an isothermal process (ΔS iso). According to thermodynamics, magnetic materials can be thought of as systems comprising three main energy reservoirs: the phonons, as the vibrational excitations of the lattice, the magnetic states of the magnetic sublattice, and the electronic contribution associated with the electron bands of the system. In the thermodynamics formalism, the total entropy of a magnetic system at constant pressure can be written as S tot(T, H) = S L(T, H) + S M(T, H) + S E(T, H), where S L(T, H), S M(T, H), and S E(T, H) are the lattice, magnetic, and electronic contributions to the total entropy S(T, H), for a specific temperature and magnetic field. Hence, the MCE is intimately related to the interplay and energy flow between these three kinds of excitations. To minimize the total energy, the material magnetic moments tend to re-orientate themselves along the direction of the applied magnetic field, thus decreasing the entropy associated with the magnetic sublattice (from a disordered to an ordered state). If this process occurs under adiabatic and reversible conditions, the system must compensate the decrease of magnetic entropy (S M) by, typically, increasing the lattice entropy (S L) to maintain the total entropy constant. Thus, an entropy (energy) transfer occurs from the magnetic to the lattice reservoir, i.e., an increase in the material temperature occurs. This temperature change is experimentally mensurable and is identified as ΔT ad. On the other hand, if the magnetic field is applied in an isothermal process, where there are heat transfers to the surroundings and hence there are no constraints to the total entropy, the change in the magnetic entropy will, typically, lead to a change of the system entropy—defined as ΔS iso. Hence, MCE is characterized both by ΔT ad and ΔS iso, which can be expressed via Maxwell relations, as
 $$\Delta {S_{{\rm{iso}}}}\left( {T,H} \right) = \int_{{H_{\rm{i}}}}^{{H_{\rm{f}}}} {{{\left( {{{\partial M\left( {T,H} \right)} \over {\partial {T_H}}}} \right)}_H}} {\rm{d}}H\quad ,$$
 $$\Delta {T_{{\rm{ad}}}}\left( {T,H} \right) = - \int_{{H_{\rm{i}}}}^{{H_{\rm{f}}}} {{T \over {{C_{\rm{p}}}}}{{\left( {{{\partial M\left( {T,H} \right)} \over {\partial {T_H}}}} \right)}_H}} {\rm{d}}H\quad ,$$
where M represents the magnetization and C p represents the specific heat. Typically, most reports publish ΔS iso data instead of ΔT ad, as the former is relatively easier to measure with standard magnetometers (although a detailed protocol should be followedReference Amaral and Amaral37,Reference Tishin and Spichkin38 ). ΔT ad measurements are even more challenging at the micro- and nanoscale due to the technical difficulties to guarantee an adiabatic procedure and to the rapid thermal diffusion from the studied micro/nanostructure toward a heat/cold sink (such as the substrate in a thin film-substrate system). However, as can be noticed, both entities are strongly dependent on the materials magnetization temperature dependence curve, in particular, in its derivative. As will be seen, this fact has a major influence on the MCE at micro/nanostructures.
Furthermore, another parameter was defined by Pecharsky and GschneidnerReference Pecharsky and Gschneidner39 to help estimate materials performance—the refrigerant capacity (q), which is a measure of how much heat can be exchanged between the cold and the hot sink of an ideal refrigerator:
 $$q = \int_{{T_{\rm{c}}}}^{{T_{\rm{h}}}} {\Delta S\left( {T,P,\Delta H} \right)} {\rm{d}}T\quad ,$$
which can be approximated by a simple product:
 $${\rm{RCP}} = \Delta {S^{\max }} \cdot {\rm{FWHM}}\quad {\rm{,}}$$
of the entropy change peak (ΔS max) and the full width at half maximum (FWHM) of the ΔS (T) curve giving the relative cooling power (RCP).
III. MAGNETOCALORIC SYSTEMS
A. Single elements: Rare-earths and others
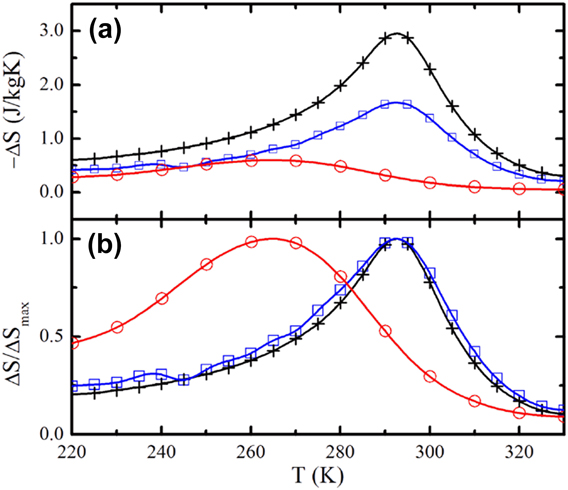
Gadolinium (Gd) presents a strong magnetovolume coupling, high magnetic moment at room temperature and is considered the benchmark material for room temperature magnetic refrigeration. For these facts, Gd micro- and nanostructures are thought to pave the way for scale-reduction magnetocaloric research. Miller’s group has been performing a thorough study on the influence of different thin film growth and preparation techniques on the structural, magnetic, and magnetocaloric properties of Gd films.Reference Miller, Belyea and Kirby34,Reference Kirby, Belyea, Willman and Miller40 Generally, they have found major differences on the film behavior when comparing to bulk: a significant reduction of the MCE (in particular the maximum magnetic entropy change, ΔS mmax), a broadening of the ΔS m (T) curve and a reduction of the temperature at which the ΔS m reaches its peak. For 30 nm Gd thin films grown by RF-sputtering onto 450 °C preheated Si oxidized substrates, Miller and coworkers have found that pregettering the sputtering chamber constitutes an important step toward the improvement of the magnetocaloric properties, namely, the maximum magnetic entropy, ΔS mmax, which is increased by ∼50%, the RCP or refrigerant capacity (RCP) by ∼30% (as can be seen in Fig. 1) and the overall saturation magnetization value by ∼35%. Such improvements are mostly attributed to the lower Gd oxide content and to an improved film roughness and morphology.
(a) ΔS m (ΔH, T) for a 30 nm thick Gd film grown at room temperature (red circles), at 450 °C after the gettering process (blue squares) and bulk Gd (black crosses) (b) Same data as in (a) but normalized to ΔS mmax. Reprinted with permission from Ref. Reference Miller, Belyea and Kirby34. Copyright 2014 American Vacuum Society.
Other interesting studies on Gd thin films are devoted to the dependence of their Curie temperatures (T C) on the thin film growth details. In the literature, a wide range of T C values can be found, ranging from 260 to 295 K (which is approximately bulk Gd T C).Reference Scheunert, Hendren, Ward and Bowman41–Reference Yamada, Okada, Jin, Tazawa and Yoshimura44 For polycrystalline thin films, such T C distribution can be directly associated with the crystallite size distribution present in the film. However, there are other factors playing an important role, such as the effect of H2 content and substrate temperature (T S) on the properties of thin (50 nm thick) Gd films grown by DC sputtering.Reference Yamada, Okada, Jin, Tazawa and Yoshimura44 In contrast to what happens when N atoms penetrate interstitially the Gd lattice, compressing it and leading to a decrease of T C, it was observed that in fact the T C increases with raising T S (higher T S promotes higher H absorption) up to a limit, after which it did not increase further. Especially, the film prepared at T S = 600 °C was found to have a T C very close to the bulk value (292.5 K), where the good crystallinity and the c-axis preferential orientation were pointed as causes for this behavior. Moreover, Scheunert and coworkersReference Scheunert, Hendren, Ward and Bowman41 have grown Gd thin films (50 nm), sandwiched into two Ta (5 nm) capping and seeding layers, by DC sputtering under ultra-high vacuum conditions (base pressure <10−9 mbar) and have studied the influence of the growth rate and also T S on the magnetic properties of these films. They have shown that a 1.23 Å/s growth rate toward a substrate heated up to 350 °C under the above-mentioned conditions attains magnetic properties very similar to the ones observed for Gd bulk single crystal: T C ∼ 293 K and saturation magnetization of ∼2.6 T. Furthermore, they claim to have discovered the reason for detrimental magnetic properties of Gd films grown at room temperature: smaller grain sizes and larger fraction of fcc Gd paramagnetic (PM) phase and residual strain arising from the growth process.Reference Scheunert, Hendren, Ward and Bowman41
In parallel, a significant effort has been undergone to produce Gd nanoparticles; however, mostly due to their high reduction potential and highly reactive nature at the nanoscale, this task has proven to be very difficult. Mathew and coworkers successfully tackled this challenge by synthesizing nanocrystalline Gd (grain size around 12 nm) through an inert-gas condensation technique using bulk Gd as the starting material. Its magnetic characterization has unveiled significant irreversibility which was attributed to intra- and interfacial anisotropies which hinder the complete alignment of the magnetic moments (saturation) and consequently significantly diminishes (in comparison to bulk) the magnetic entropy change even for fields as high as 50 kOe.Reference Mathew, Kaul, Nigam, Probst and Birringer45 Using a similar method, Aruna and coworkers have produced single Gd particles. To minimize further the oxygen content in the chamber, prior to deposition, a small amount of Gd was evaporated onto the shutters to serve as getter. The resultant 5–7 nm diameter nanoparticles have developed a core–shell morphology, with Gd2O3 and Gd–H at the outer and inner nanoparticle regions. More interestingly, they have shown a size-induced structural transformation from the hexagonal (typical of bulk Gd) to a cubic fcc structure in the 5–7 nm diameter range.Reference Aruna, Mehta, Malhotra and Shivaprasad46 These results are in accordance with the study of Morozov and coworkers developed in 1975, where they have observed the same crystallographic change (from hcp to fcc) in nanoparticles with ∼20 nm diameter, which also lead to the disappearance of any magnetic ordering above 2 K.Reference Morozov, Kostygov, Petinov and Chizhov47 The oxidation typically observed in Gd nanoparticles appears to have been greatly reduced by Ertas and coworkers who have recently developed a novel nanofabrication route based on nanosphere lithography combined with the metal reduction process. This technique resulted in the production of oxide-free Gd nanoparticles, with tunable size and monodisperse nature (up to 5%), high magnetization (206 emu/g at 2 K), and great potential in magnetic resonance imaging.Reference Ertas, Jarenwattananon and Bouchard48
Another interesting approach has been followed by Zeng and coworkers who have prepared Gd nanoparticles via an inert-gas condensation method and then have consolidated into a bulk compound through spark plasma sintering in the 250°–700 °C temperature range.Reference Zeng, Zhang, Kuang and Yue49 TEM micrographs show different grain sizes in the 15–1000 nm range, depending in the sintering temperature. Their thorough magnetic characterization has evidenced a similar to bulk second-order magnetic transition although at temperatures slightly different from the bulk part. More dramatically, they have shown that the nanometer-sized grain samples present a ΔS mmax 50% reduction when compared with micrometer-sized grains. Such reduction is associated with a broadening of the ΔS m (T) curve which in turn can be explained by an increasing magnetic and structural disorder in nanocrystalline systems caused by different phenomena such as asmagnetic symmetry breaking, nanoparticles size, and stress distribution—leading to a T C distribution, as detailed by Amaral and Amaral.Reference Amaral and Amaral50 As will be seen throughout this review, the broadening of the ΔS m (T) curve is a typical phenomenon in polycrystal micro- and nanoscale systems.
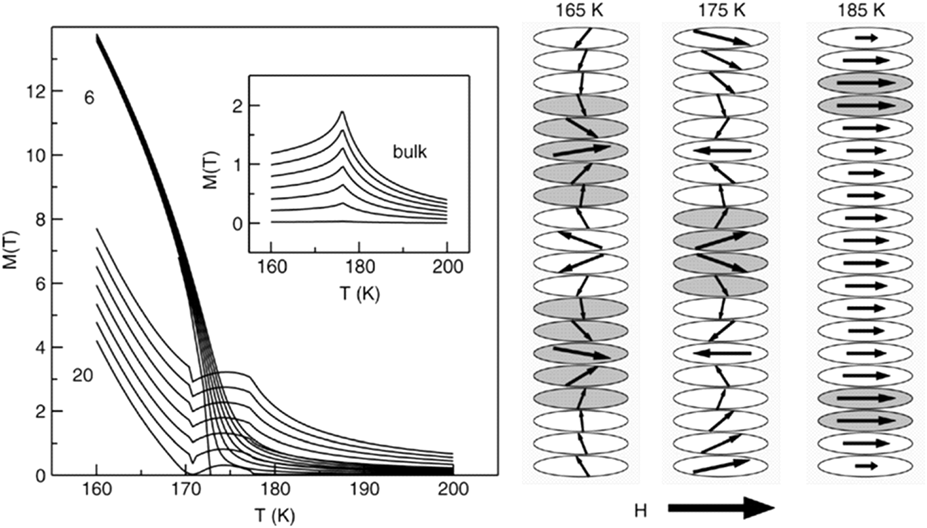
Although Gd nanostructures have received more attention (and are in itself worth of a comprehensive review) than other pure rare-earths, there has been increasing interest in the other elements of this family, triggered by the innovative theoretical studies by Mello and Filho and respective coworkers.Reference Anselmo, Mello and Vasconcelos51–Reference Mello, Dantas and Carriço53 In contrast to Gd, Terbium (Tb), Dysprosium (Dy), and Holmium (Ho) present strong anisotropic magnetic properties because of their incomplete 4f orbitals. Dy and Tb are known to have a helical magnetic structure with a period of few unit cells (<20) as a ground state. However, if a very thin film is produced with a thickness lower than this period (t < 15 nm), the helical order will be truncated. Furthermore, the spins at the film surface will experience a break in symmetry and will reduce their correlations with second neighbors.Reference Mello, Dantas and Carriço53 These theoretical studies have shown that in such circumstances, the pure ferromagnetic (FM) ordering will be favored by these spins and ultimately, by applying a magnetic field strong enough (>0.6 kOe), one is able to completely suppress the helical magnetic state in favor of a collinear FM one. Obviously, such transformation will lead to an enhanced overall magnetic moment, as can be seen in the magnetization versus temperature, M(T) curves, shown in Fig. 2. One of the many interesting consequences arising from this transformation is the enhancement of the Dy and Tb MCE in comparison with their bulk counterpart.
Seven isofield magnetization curves as a function of temperature (in the field range [0, 0.6] kOe) for a thinner (six atomic layers) and a thicker (twenty atomic layers) Dy thin film. The inset shows the same seven isofield magnetization curves but for Dy bulk material. The helicoidally spin structure in the twenty unit cells of the film for three selected temperatures is shown schematically at the right side for a constant H = 0.6 kOe. Reprinted with permission from Ref. Reference Mello, Dantas and Carriço53.
R = Tb and Dy thicker (100 nm) films deposited by DC sputtering onto an oxidized and preheated (350 °C or room temperature) Si substrate have shown magnetic transition temperatures slightly lower, as Scheunert and coworkers have shown.Reference Scheunert, Ward, Hendren, Lapicki, Hardeman, Mooney, Gubbins and Bowman43 Surprisingly, they have also found the suppression of the antiferromagnetic (AFM) helical magnetic state for such thicker films, resulting in a direct transition from PM to FM state for both the Dy and the Tb thin films, which they say is not a consequence of the surface spins, but rather a result of the lattice expansion caused by strain in these films.
The size-reduction of rare earth alloys (with other rare earths or metals) was studied by Shao and coworkers when they studied Gd–Tb, Gd–Y, and Gd–Zn nanocomposite ribbons.Reference Shao, Lai and Shek54 In this work, the authors have performed a rapid-quenching (∼105 K/s) on a melt-spinner of the arc-melted bulk alloys. Afterward, the resulting amorphous particles with ∼20 nm diameter were immersed in acetone and milled for 125 rpm for 100 h. This process induced the agglomeration and recrystallization. Interestingly, they found that the final powder, with diameter <360 nm, exhibited a higher specific heat, but lower T C and MCE in the near room-temperature range in comparison with the respective bulk.
Concerning other single elements, besides rare-earths, leads Franco and coworkers to explore Ni nanowire magnetic properties.Reference Franco, Pirota, Prida, Neto, Conde, Knobel, Hernando and Vazquez55 In fact, they initially predicted a major change in the magnetic properties of this nanostructure, promoted by the enhanced shape anisotropy in nanowires and the consequent strong magnetic anisotropy. They demonstrated experimentally and by modeling the coexistence of positive (inverse) and negative (normal) MCE in these nanowires and they found that such positive/negative nature could be tuned according to the applied field value.
B. R5(Si,Ge)4
The R5(SixGe1−x)4 (R = rare earth element) family of compounds is a fruitful example of a strongly coupled system. In 1997, a study by Pecharsky and Gschneidner leads to the rejuvenation of the magnetic refrigeration research at room temperature—as is verified by its more than 2000 citations nowadays.Reference Pecharsky and Gschneidner2 The Ames group reported a giant MCE of ∼19 J/(kg K)/15 K of ΔS iso/ΔT ad under a 50 kOe applied field for the Gd5Si2Ge2 compound at ∼290 K. Shortly after, Morellon and coworkersReference Morellon, Algarabel, Ibarra, Blasco, García-Landa, Arnold and Albertini7 found that such an effect was due to the strong coupling between magnetic and lattice orders of freedom, which resulted in the so-called magnetostructural transition. Attracting immediate materials scientist’s attention, different R5(SixGe1−x)4 (R = rare earth) families were thoroughly investigated. Their complete phase diagrams were described, revealing a complex set of phase regions and phase transitions that were classified by Miller as a “playground for material scientists”Reference Miller35 and that can be resumed into three major atomic structures and three major magnetic orders: orthorhombic O(I), orthorhombic O(II), and monoclinic (M) atomic structures and PM, FM, and AFM magnetic orders.Reference Gschneidner, Pecharsky and Tsokol56 It was also found that the GMCE was not the only consequence of the magnetostructural transition but that it also promotes giant magnetoresistiveReference Morellon, Stankiewicz, García-Landa, Algarabel and Ibarra57 and colossal magnetostriction effects.Reference Hadimani, Bartlett, Melikhov, Snyder and Jiles58 Due to all these reasons, it is surprising to observe the few amounts of studies dedicated to the study of these materials scale reduction. Nevertheless, there are a handful of interesting reports, namely, by Moore and coworkers at Imperial College, which showed for the first time that fragmenting a Gd5Ge4 bulk sample in small pieces, ∼100 µm, leads to a 20% reduction of the critical magnetic field required to complete the corresponding phase transition in comparison with the bulk counterpart.Reference Moore, Perkins, Bugoslavsky, Chattopadhyay, Roy, Chaddah, Pecharsky, Gschneidner and Cohen25 They attributed this effect to the reduction of magnetic domains per particle (approximately 3–5 domains) that implies a reduction/removal of strain fields within neighboring magnetic domains. Trevizoli and coworkers have also studied the effects of microstructuring Gd5.09Ge2.03Si1.88, via metallurgical pulverization. They found that for samples with lower particle sizes (25 < d < 53 µm), the first-order transition is suppressed during the sintering process, whereas for larger particles, the giant MCE is retained.Reference Trevizoli, Alves, Mendes, Carvalho and Gama59 One of the most popular approaches for down-sizing magnetocaloric materials has been ball-milling as Blasquez and coworkers have reviewed,Reference Blázquez, Ipus, Moreno-Ramírez, Álvarez-Gómez, Sánchez-Jiménez, Lozano-Pérez, Franco and Conde60 and this technique has been intensively used in particular for the R5(Si,Ge)4 materials.Reference Pires, Belo, Turcaud, Oliveira, Araújo, Berenov, Cohen, Lopes and Pereira61–Reference Rajkumar, Raja, Gopalan and Chandrasekaran63 It was observed that for materials with first-order magnetostructural transitions, the ball-milling and consequent size-reduction (downwards to the 0.5–5 µm range) lead to a strong attenuation of the respective MCE, which is explained by the increasing amorphization with increasing milling time. However, our group unveiled the mechanism that is ruling the different behaviors: it is an induce internal strain arising from the ball-milling process during the formation of microparticles.Reference Pires, Belo, Turcaud, Oliveira, Araújo, Berenov, Cohen, Lopes and Pereira61 We further showed that this effect, depending on the exact composition of the R5(Si,Ge)4 family, could lead to a 23% MCE enhancement of the Tb5Si2Ge2 and, by contrast, to a 35% MCE decrease for Gd5Si1.3Ge2.7 milled particles (1–10 µm).
In 2005, Sambandam and coworkersReference Sambandam, Bethala, Sood and Bhansali64 reported their attempt to produce thin films by sputtering with a DC/RF-magnetron sputtering system, a Gd5Si2Ge2 sputter target that was produced by cold-pressing and sintering GdSiGe powder into a 76 mm disc. However, they discovered that the buffer layer used, silicon nitride (Si3N4), was not effective in preventing Si diffusion from the Si substrate and consequently no major evidence of Gd5(Si,Ge)4 phase formation was detected. In 2013, Hadimani and coworkersReference Hadimani, Nlebedim, Melikhov and Jiles65 were able to deposit a Gd–Si–Ge thin film by using a femtosecond pulsed laser to ablate a Gd5Si2.09Ge1.91 target onto a 200 °C heated Si substrate. Due to its high energy pulse, the material is sputtered from the target in large amounts/grains, which then land on the substrate surface, retaining its target composition. However, the X-ray diffraction (XRD) analysis performed by the authors revealed also the presence of other phases, such as Gd5Si4 and Gd5Ge3. Its magnetic characterization shows a small transition above the 298 K, but no evidence of a first-order transition. Later, our team used the same deposition method to deposit a Gd5Si1.3Ge2.7 target resulting in an ensemble of spherical nanogranular particles with ∼80 nm mean size and total thickness ∼780 nm.Reference Hadimani, Silva, Pereira, Schlagel, Lograsso, Ren, Jiles and Araújo66 The nanogranular film presented an incomplete structural transition at ∼190 K coupled with a FM → PM magnetic transition, resulting in: (i) a colossal anisotropic lattice parameter change, Δa/a ∼ 1.2%, as can be seen in Fig. 3(a); (ii) a relatively large −ΔS mag ∼ 8.9 J/(kg K) (at ΔH = 50 kOe), that however represents only 33% of the counterpart bulk value. In accordance with the ball-milling results, here too, the low-volume O(I) phase is favored. The major magnetic and structural changes observed in the film in comparison with the bulk form were attributed to the nanoparticles’ intrinsic pressure, estimated in 8–11 kbar.
2D Contour plot of the collected and analyzed synchrotron X-ray diffracted spectra as a function of temperature ([120, 250] K range) in the [15°; 17.6°] (a) and [11.5°; 14.5°] (b) interval. Temperature dependence of the two phase fractions (d) and the majority phase lattice parameters and volume, assigned to the left and right y-axis, respectively (c). Reproduced with permission from Ref. Reference Hadimani, Silva, Pereira, Schlagel, Lograsso, Ren, Jiles and Araújo66. Copyright 2015 AIP Publishing LLC.

Further studies demonstrated that this thin film presents low-resistance to thermal cycles, leading to a suppression of its magnetostructural transition when the number of cycles increases beyond 1000.Reference Pires, Belo, Gomes, Lopes, Araújo, Pereira, Hadimani, Jiles, Hadimani, Schlagel, Lograsso, Jiles and Lograsso67 Similar to the bulk behavior, it is also possible to tune the thin film Curie temperature and its preferred atomic structure by post-heat treatments, although in contrast with the high-temperatures needed for the bulk counterparts (1000–1300 °C), in the thin film smaller temperatures are required (400–600 °C).Reference Pires, Belo, Gomes, Hadimani, Jiles, Fernandes, Tavares, Araújo, Lopes and Pereira68
C. FeRh
Iron–rhodium (FeRh) is a binary system, which became well known at its bulk form due to its positive GMCE. In fact, it presents one of the highest refrigerant capacities at room temperature, surpassing the popular Gd5Si2Ge1.9F0.1 and MnFeP0.45As0.55 negative GMCE.Reference Annaorazov, Nikitin, Tyurin, Asatryan and Dovletov8 The bulk FeRh presents a first-order transition resultant of the coupling between the magnetic and the structural transitions; however, its MCE is not fully reversible under laboratorial applied fields. Hence, the expectation of producing it in the thin film form was obviously large. In fact, FeRh films were first grown in the 1966, when their magnetic and electrical transport measurements were first performed. Lommel,Reference Lommel69 to surpass the significantly different vapor pressures of Fe and Rh, adopted a smart strategy, which consisted in depositing a multilayer system composed by Fe and Rh layers alternately grown by electron beam melting on a glass substrate that was held at 300 °C during the deposition. As to promote interlayer diffusion and crystallization of the 1:1 phase, Lommel performed an annealing treatment at 565 °C for 5 h. This author also tried two different strategies: (i) direct co-deposition of Fe and Rh by electron beam melting; (ii) by sputtering a Fe0.50Rh0.545 target.Reference Lommel69 However, only the alternate approach successfully synthesized the FeRh phase. Both the electrical transport and magnetic measurements evidenced the presence of the first-order transition, despite it being broader (about 200 K) in comparison with the (∼15 K) observed in bulk, as can be seen in Fig. 4(a). Also, the thin film overall magnetic moment was about one third of the bulk one.
(a) Magnetization curves as a function of temperature for a FeRh bulk and thin film sample. (b) Magnetic entropy change of FeRh, FeRhPd3, and FeRhPd5 thin films as a function of temperature. Reproduced with permission from (a) Ref. Reference Lommel69 and (b) Ref. Reference Zhou, Cher, Shen, Hu and Yuan70.
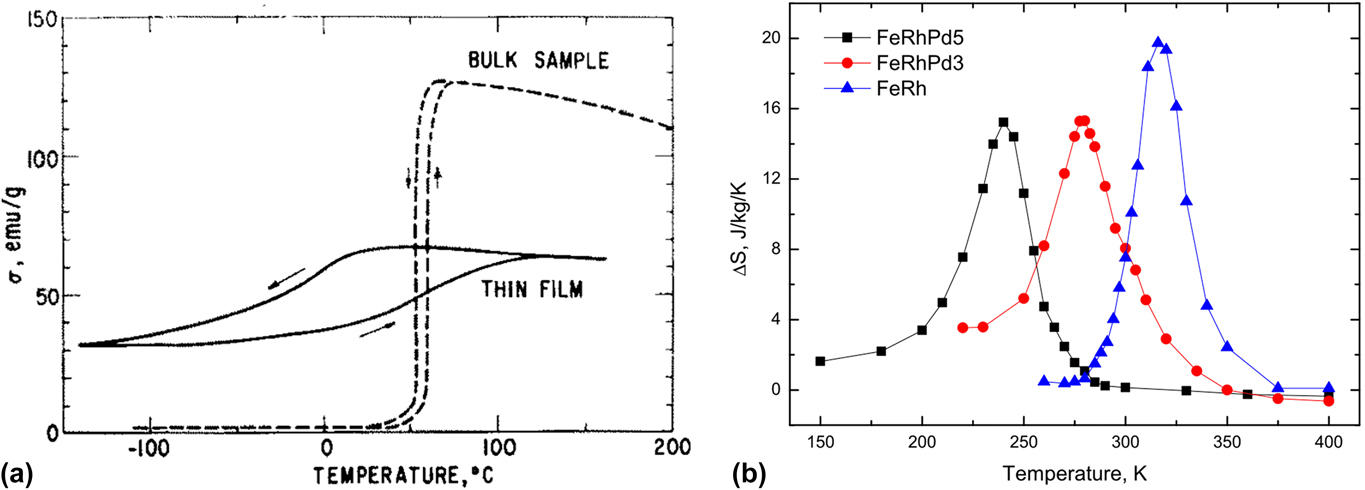
It was 50 years later that Zhou and coworkersReference Zhou, Cher, Shen, Hu and Yuan70 published their work on FeRh films, but making use of nowadays modern technology—a DC magnetron sputtering under high vacuum conditions. They have epitaxially grown FeRh 100 nm thin films on MgO (0 0 1) single crystals heated up to 400 °C at 4 × 10⁻³ mbar argon working pressure. XRD analysis as a function of temperature unveiled a giant lattice parameter change of ∼0.66% (almost twice the value obtained for the bulk) across the transition temperature (∼325 K), which they attributed to a distortion of the tetragonal structure due to the growth relationship between the film and the substrate. Magnetic measurements have also shown thermal and magnetic hysteresis [in M(T) and M(H) curves, respectively], confirming the first-order nature of this transition. Such an effect resulted in a GMCE, in fact the highest intrinsic effect measured in thin films so far: ΔS mmax ∼ 20 J/(kg K) for a ΔH = 50 kOe, as can be seen in Fig. 4(b).Reference Zhou, Cher, Shen, Hu and Yuan70
Recently, important breakthroughs were achieved to solve the major drawback of the FeRh system, namely, the irreversibility of the effect. First, Cherifi and coworkers explored the voltage control of magnetization in a system composed by a FeRh epitaxially grown on top of a BaTiO3 substrate. They have demonstrated how a low electric field was able to induce an AFM-FM magnetic transition on the FeRh film via voltage-induced strains in BaTiO3.Reference Cherifi, Ivanovskaya, Phillips, Zobelli, Infante, Jacquet, Garcia, Fusil, Briddon, Guiblin, Mougin, Ünal, Kronast, Valencia, Dkhil, Barthélémy and Bibes71 Later, they extended the study of the effects of electric voltage application on this system and found that the large hysteresis typically observed in this system can be transferred into an elastic cycle. It is important to stress that this strain mediated effect does not rely on the presence/absence of any structural transition in the BaTiO3 substrate, in contrast with recent studies.Reference Moya, Hueso, Maccherozzi, Tovstolytkin, Podyalovskii, Ducati, Phillips, Ghidini, Hovorka, Berger, Vickers, Defay, Dhesi and Mathur72 Therefore, Liu and coworkers suggest a smart-multicaloric refrigeration cycle that could take advantage of this hysteresis suppression via a dual-stimulus (magnetic and electric) approach. In parallel, FeRh mesoscale stripes have also been attracting significant attention since this mesoscale is the same as the typical crystallographic grains present in bulk FeRh and hence its study allows to inspect the FeRh phase transition within its heterogeneity range. Uhlir and coworkers have grown epitaxial FeRh thin films with 25 nm thickness on top of the MgO substrate and later have patterned it into stripes with different widths, such as 550 and 1100 nm. They have unveiled a significantly larger (orders of magnitude) asymmetry in the electrical resistivity heating and cooling curves on the 550 nm width stripes in comparison with typical wider thin films, which they ascribed to the rapid nucleation of the AFM region throughout the stripes, whereas in thin films, there are much more nucleation sites and the nucleation occurs along a wider temperature region.Reference Uhlíř, Arregi and Fullerton73 In contrast with thin films, stripes and larger nanoparticles, Hillion and coworkers found that small (<5 nm) nanoparticles retained the high-temperature FM state until low temperatures (down to 3 K) suggesting a rich size-dependent phase diagram for the FeRh system.Reference Hillion, Cavallin, Vlaic, Tamion, Tournus, Khadra, Dreiser, Piamonteze, Nolting, Rusponi, Sato, Konno, Proux, Dupuis and Brune74
As numerous examples illustrate, the FeRh system is probably the magnetocaloric system that has profited the most from the size-reduction route, unveiling promising technological advantages (such as the reduction of the magnetic irreversibility) and interesting new physical states. In the near future, more detailed nanoparticles size-dependent studies should help understand what are the main mechanisms driving the magnetic ordering at this scale.
D. MnAs
The binary bulk MnAs compound was first synthesized in the 1950s and its adiabatic temperature change ΔT ad was measured for the first time in 1980 by Kuhrt and coworkers,Reference Kuhrt, Schittny and Barner75 delivering a rather small value of ∼0.2 K for a ΔH = 6.5 kOe. Nevertheless, this initial measurement did not convince Wada and Tanabe,Reference Wada and Tanabe11 who decided, after the advent of the Pecharsky and Gschneidner discover,Reference Pecharsky and Gschneidner2 to remeasure the MnAs magnetocaloric properties and surprisingly they measured a giant magnetocaloric response: −ΔS max ∼ 40 J/(K kg) for a ΔH ad = 50 kOe and obtained a ΔT ad ∼ 2.5 K for ΔH ad = 10 kOe (almost ten times the ΔT ad/ΔH ad ratio obtained by Kuhrt).Reference Kuhrt, Schittny and Barner75 It was found that in the MnAs-based materials, the MCE is associated with a complex magnetostructural phase transition. The α-MnAs phase crystallizes in a FM hexagonal NiAs-type structure, which is stable up to 318 K, when it transforms into orthorhombic β-MnAs by a first-order phase transition.Reference Willis and Rooksby76 In 2004, Gama and coworkersReference Gama, Coelho, De Campos, Magnus, Carvalho, Gandra, Von Ranke and De Oliveira77 had reported a MnAs colossal entropy change [267 J/(K kg)] induced both by pressure and magnetic field, which was later interpreted as the impossibility of using Maxwell state equation at first order transitions, resulting then in the appearance of MCE measurements standards to suppress these limitations.Reference Amaral and Amaral78,Reference Caron, Ou, Nguyen, Cam Thanh, Tegus and Bruck79
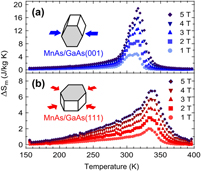
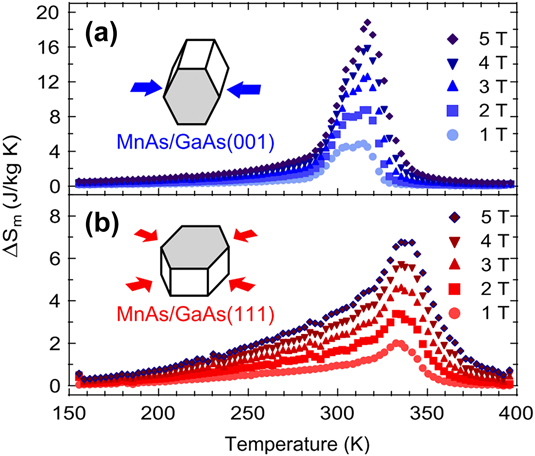
At the nanoscale, in 2008 Mosca and coworkers,Reference Mosca, Vidal and Etgens80 acknowledging the fact that MnAs FM interactions are strongly anisotropic and susceptible to subtle structural changes, decided to grow epitaxially MnAs films on top of two gallium arsenide (GaAs) substrates with different orientations [(0 0 1) and (1 1 1)]. They grew MnAs 70 nm epilayers by molecular beam epitaxy on heat-treated (260 °C) substrates. To prevent oxidation and achieve optimal surface quality, the substrates were heat treated at 580 °C under As flux and then were deposited with a GaAs buffer layer. The complete process was monitored by reflection high-energy electron diffraction diagrams, which together with XRD allowed to ensure the desired epitaxial relations. Due to the large mismatch between the substrate and film unit cells, the (1 1 1) substrate induces a strong (0.82%) compressive strain in the basal plane leading to a premature appearance of the β phase and consequently to a broadening of the magnetostructural transition, as is clearly observed in its magnetization as a function of temperature curves.Reference Mosca, Vidal and Etgens80 This did not happen in the (1 0 0) case due to the different configuration of the unit cells, and hence its transition occurs in a narrower temperature interval. Kaganer and coworkersReference Kaganer, Jenichen, Schippan, Braun, Däweritz and Ploog81 had already demonstrated this wider phase coexistence, although they did not present the complementary magnetic study. As expected, such constraining reflects on the MCE of both cases leading to a sharper and higher MCE under a ΔH = 50 kOe for the (1 0 0) case: ∼20 J/(K kg) in comparison with ∼7 J/(K kg) for the (1 1 1) case, as can be seen in Fig. 5. These results were in good agreement with simple thermodynamic model considering a homogeneous strain across the MnAs epilayers and underlined the importance of MnAs compatibility with worldwide used Si (0 0 1) and GaAs semiconductors concerning the potential development of micromagnetic-refrigerators.
Magnetic entropy changes as a function of temperature and field for (a) MnAs/GaAs (0 0 1) and (b) MnAs/GaAs (1 1 1) epilayers. Magnetic field was applied in the direction of the easy magnetic axis of MnAs epilayers. Reprinted figure with permission from Ref. Reference Mosca, Vidal and Etgens80.
In 2014, Trassineli and coworkersReference Trassinelli, Marangolo, Eddrief, Etgens, Gafton, Hidki, Lacaze, Lamour, Prigent, Rozet, Steydli, Zheng and Vernhet82 presented an alternative to reduce the thermal hysteresis in these MnAs/GaAs systems: a highly charged ion bombardment. Magnetic force microscopy images clearly show the increasing number of random defects as the ion fluence increases. Furthermore, such defects facilitate the nucleation of one phase with respect to the other in the magnetostructural transition, which consequently accelerates the phase transition and leads to a decrease of its thermal hysteresis. Mosca and coworkersReference Mosca, Vidal and Etgens80 certainly paved the way for other interesting possibilities on MnAs/GaAs structures. One example is that of Duquesne and coworkers,Reference Duquesne, Prieur, Agudo Canalejo, Etgens, Eddrief, Ferreiram and Marangolo83 whom have deposited a multilayer system: 1 µm zinc oxide (ZnO) piezoelectric layer deposited on the top of a gold buffer layer (300 nm), which was on top of the epitaxially grown MnAs epilayer with 100 nm on top of a GaAs substrate. By emitting an acoustic surface wave triggered by using an electrical emitter patterned on the ZnO piezoelectric layer in an interval range around room temperature (0–60 °C), the authors observed that ultrasonic waves (170 MHz) are strongly attenuated by the MnAs phase coexistence (up to 150 dB/cm). They showed that such attenuation was caused by the MnAs MCE and hence they demonstrated the two-way relationship between mechanical control and magnetic properties and their (almost) endless opportunities. Already in 2014, another interesting idea arose from Spezzani and coworkers,Reference Spezzani, Ferrari, Allaria, Vidal, Ciavardini, Delaunay, Capotondi, Pedersoli, Coreno, Svetina, Raimondi, Zangrando, Ivanov, Nikolov, Demidovich, Danailov, Popescu, Eddrief, De Ninno, Kiskinov and Sacchi84 as they were able to reverse Fe magnetization on a Fe/MnAs/GaAs multilayer structure through the action of a 100-femtosecond optical pulse (used to trigger local thermal variations) and a 100-femtosecond X-ray pulse to probe the magnetic and structural dynamics of such multilayer. They were able to observe both the Fe magnetization reversal and the MnAs structural transition, despite the time interval between them was only of a few picoseconds.Reference Spezzani, Ferrari, Allaria, Vidal, Ciavardini, Delaunay, Capotondi, Pedersoli, Coreno, Svetina, Raimondi, Zangrando, Ivanov, Nikolov, Demidovich, Danailov, Popescu, Eddrief, De Ninno, Kiskinov and Sacchi84
E. La(Fe,Si)13 family
The La(Fe,Si)13 family of materials is, together with Mn–Fe–P–Si, one of the most promising magnetocaloric materials to be used in room temperature magnetic refrigeration applications. They have been thoroughly studied in the past 10 years; however, surprisingly, very few studies dedicated to their micro- and nanostructuring can be found. One of the first attempts to change the microstructure of La–Fe–Si was ingeniously developed by Lyubina and coworkers when they introduced up to 30% of porosity in a bulk La–Fe–Si sample by crushing an arc-melted button and further press the resulting powder under vacuum using a hot-press setup. Increasing the density of pores in the final pellets resulted in: a reduction of thermal hysteresis (from 2.3 K in the bulk down to below 0.5 K in the porous material), a great improvement of mechanical stability (bulk counterpart loses mechanical integrity after less than 10 cycles, in contrast with the porous which remains stable even after more than 600 cycles), and a 20% decrease in ΔT ad. These results were interpreted as a consequence of the removal of the internal constraints, such as the grain boundaries, in the porous material.Reference Lyubina, Schaefer, Martin, Schultz and Gutfleisch85 Lyubina extended this study on porous materials down to nanometer-sized crystallites shortly after,Reference Lyubina86 where it was observed: an advantageous attenuation of the magnetic hysteresis, but a detrimental strong (40/60%) reduction of the ΔS max for 70/44 nm sized crystallites, respectively. In conclusion, the authors proposed that an optimal magnetocaloric compound should be comprised off: micro- and single crystalline particles with a uniform size distribution to sharpen the magnetic transition and consequently enhance its MCE. Also for this family, most of the size-reduction studies were performed through up–bottom approach, by using ball-milling process,Reference Phejar, Paul-Boncour and Bessais87–Reference Ligang and Tegus90 or simply hand grinded particles.Reference Ipus, Borrego, Moreno-Ramírez, Blázquez, Franco and Conde88,Reference Huang, Sun, Liu, Ge, Zhang, Liu and Si91,Reference Zhang, Long, Niu, Shao, Shen, Zhang, Long, Niu, Shao, Shen, Hu, Sun and Shen92 Hu and coworkers have found that the hysteresis loss reduces as the particle size is decreased and such reduction can be as high as 61% for particles within the 20–50 µm range. Furthermore, they have narrowed an optimal size interval, 20–120 µm, where the hysteresis loss is greatly reduced but the large entropy change is retained.Reference Hu, Chen, Wang, Bao, Sun and Shen89 They have attributed this reduction to the reduction of the so-called extrinsic hysteresis, associated with the heat transfer kinetics, as also identified by Gutfleisch and coworkers.Reference Gutfleisch, Gottschall, Fries, Benke, Radulov, Skokov, Wende, Gruner, Acet, Entel and Farle93 In particular, Hu and coworkers estimate that there is a 27-time reduction of the surface area versus volume ratio while decreasing from the bulk-like particles (>100 µm) toward smaller size (∼20 µm), which will greatly increase the thermal exchanges between the particles and the surrounding.Reference Hu, Chen, Wang, Bao, Sun and Shen89 This point is particularly important considering the fact that, due to its poor mechanical properties, La–Fe–Si is planned to be immersed in a polymer/metal matrix to form a composite—the magnetic refrigerant to be used in a real magnetic refrigeration device. Consequently, the smaller the magnetocaloric particles are, the denser and the harder will be the final composite material. In fact, several studies have been published during the last years devoted to the optimal construction of such a composite.Reference Radulov, Skokov, Karpenkov, Braun, Gutfleisch and Darmstadt23,Reference Lanzarini, Barriere, Sahli, Gelin, Dubrez, Mayer, Pierronnet and Vikner94,Reference Zhang, Sun, Li, Wu, Long, Shen, Hu, Sun and Shen95 Interestingly, due to the above-mentioned dramatic increase of the surface area versus volume ratio, the particle-size reduction has also proven to be useful during the hydrogenation of LaFeSi compounds: enabling an homogeneous distribution, a greater mechanical stability, and a large magnetic entropy change, as shown by Zhang and coworkers.Reference Zhang, Long, Niu, Shao, Shen, Zhang, Long, Niu, Shao, Shen, Hu, Sun and Shen92 While further decreasing the size toward the nanoscale, an important theoretical study performed by Zhang and coworkers deserves highlight. They have applied Landau–Ginzburg expansion of the free energy density and the Arrhenius–Néel statistical switching model to simulate the magnetization behavior within the metamagnetic transition temperature region and have found that the smallest nucleation site possible for a new phase to emerge is about 4.2 nm: i.e., this is the critical size below which no metamagnetic transition is expected. This year a report was published dedicated to the LaFeSi nanostructure produced by spark ablation of LaFeSi bulk rods.Reference Feng, Geutjens, Thang, Li, Guo, Kéri, Basak, Galbács, Biskos, Nirschl, Zandbergen, Brück and Schmidt-Ott96 In this attempt, the 6 nm (mean size) produced LaFeSi nanoparticles exhibited a much broader magnetic transition than the bulk counterpart in accordance with the magnetic behavior exhibited by NPs of other magnetocaloric materials. Moreover, they have demonstrated that the NPs’ Curie temperature can be tuned by controlling ablation parameters toward room temperature. This work is expected to open for once the pathway toward nanoscale for LaFeSi compounds, enabling to explore size-reduction effects and confirm the existence of a critical size for the presence of the metamagnetic transition.
F. Fe2P family
The (Mn–Fe)2(P,As,Si,B) materials derive from iron phosphide—Fe2P and together with the La–Fe–Si family, are the most promising magnetocaloric materials for room temperature magnetic refrigeration applications. Tegus and coworkers have shown first that these materials stabilize in the hexagonal Fe2P structure and undergo sharp magnetic transition at room temperature, leading to a giant MCE, with a ΔS max twice the one observed for pure gadolinium and similar to the one exhibited by Gd5Si2Ge2.Reference Tegus, Bruck, Buschow and de Boer97 Later, Dung and coworkers demonstrated that the T C of this family could be tuned in a wide temperature interval, 200–400 K, by adjusting the metal to nonmetal ratio and by chemical substitution, in particular with boron.Reference Dung, Zhang, Ou and Brck98,Reference Dung, Ou, Caron, Zhang, Thanh, de Wijs, de Groot, Buschow and Brück99 Despite its leading role in the magnetocaloric race at bulk scale, there are few reports dedicated to the scale reduction effect on its magnetic properties. However, the first attempts toward this goal were developed already in 1995, when Lukehart and coworkers have shown that a covalent incorporation of an organoiron complex into a silica xerogel matrix resulted in a single-source for two different nanocomposites: Fe2P and Fe2O3. In this work, they demonstrated that thermal treatments under hydrogen atmosphere promoted the production of an ensemble of nanocrystals, including Fe2P hexagonal-like nanocrystals with ∼4.7 nm typical size. Their incomplete magnetic characterization unveiled a super PM behavior at room temperature, whereas at 10 K, a typical mixture of FM and PM components was found.Reference Lukehart, Milne, Stock, Shull and Wittig100 Almost ten years later, Park and co-authors have published a report on the first 1D Fe2P systems produced by a novel synthesis method comprising thermal decomposition of continuously supplied iron pentacarbonyl in trioctylphosphane using a syringe pump. By varying the injection rate, they were able to tailor the Fe2P nanorod lengths (88, 107, and 209 nm) while retaining similar width (5–6 nm). More interestingly, they have shown that these nanorods self-assemble in a long-range order 3D hexagonal super-structure. Their atomic structure is hexagonal, like in bulk counterpart; however, their magnetic behavior depends on their lengths, in particular, their blocking temperature increases with the length size, up to ∼250 K.Reference Park, Koo, Hwang, Bae, An, Park and Park101 In addition, Fe2P nanoparticle research triggered another application for these transition metal alloys as catalysts for photocatalytic hydrogen evolution.Reference Pan, Wang, Li, Iqbal and Liu102–Reference Zhang, Zhang, Feng, Liu and Wang103 Several studies demonstrate the low-cost Fe2P nanoparticles formation, their enhanced surface area, excellent electrochemical properties, and mechanical stability after thousands of cycles. The same motivation led Schipper and coworkers to grow FeP, Fe2P, and Fe3P thin films recently.Reference Schipper, Zhao, Thirumalai, Leitner, Donaldson, Kumar, Qin, Wang, Grabow, Bao and Whitmire104 The films were grown by metal–organic chemical vapor deposition using single-source molecular precursors (Fe(CO)4PH3) on fluorine-doped tin oxide to evaluate the system performance in hydrogen evolution. Both the experimental and the density functional theory calculations results show a higher hydrogen coverage for Fe-rich nanoparticles in comparison with P-rich. Following the same procedure, the same group of authors produced the Mn substituted, (MnFe)2P, 1–3 µm thick films on top of alumina and quartz substrates. They have found a nanogranular-like morphology with triangular and spherical shapes for quartz and alumina substrates, whereas both exhibit the typical Fe2P hexagonal crystal structure. Both films exhibit a FM and superparamagnetic nature due to their small crystallite sizes.Reference Leitner, Schipper, Chen, Colson, Rusakova, Rai and Whitmire105 It is important to remark the stability of the Fe2P hexagonal phase in all the above-mentioned nanostructures in contrast with the metastable nature of this phase in the bulk compounds, typically requiring a long series of high temperature thermal treatments. Unfortunately, there are no published reports completely dedicated to the influence of size-reduction on the magnetocaloric properties of Fe2P or more generally (Mn,Fe)2(P,Si). Due to the increasing relevance, this material has been receiving at the macroscale, and its size-reduction studies are certainly an open avenue yet to explore.
G. FM shape memory alloys
Ferromagnetic shape memory alloys (FSMAs) or magnetic shape memory alloys (MSMAs) are terms technically attributed to the materials that have the ability to show deformations when subjected to magnetic fields and that present two (typically, austenite and martensite) or more crystallographic phases for which reversible transitions from one to the other occur through diffusion-less transformations.Reference Shirani and Kadkhodaei106 The MSMAs were discovered in 1996 when the Ni2MnGaReference Ullakko, Huang, Kantner, O’Handley and Kokorin107 was first studied. A few years later, Hu et al.Reference Hu, Shen and Sun10 unveiled that Ni51.5Mn22.7Ga25.8 displays a large MCE due to the martensitic to austenitic structural transition. So, basically from the interplay between martensitic transformations and magnetism, two important mechanisms are identifiable: (i) magnetic field induced martensitic transformation (magnetic field dependence of the martensitic transformation temperature) and (ii) the magnetically induced reorientation of variants in the martensitic phase (high magnetocrystalline anisotropy and low elastic shear modulus of martensite that enables twin boundary displacement in response to the application of a magnetic field).Reference Ranzieri, Fabbrici, Nasi, Righi, Casoli, Chernenko, Villa and Albertini108,Reference Planes, Mañosa and Acet109
Off the FSMA, we highlight the Heusler alloys—the most widely studied materials. Two families of Heusler alloys are reported: (i) half Heusler alloys with chemical composition XYZ and (ii) full Heusler alloys that are represented by the chemical composition: X2YZ (X and Y are transition metals or lanthanides, rare-earth elements, and Z a main group metal or a semimetal). Ni2MnGa belongs to this last category and stabilizes in the L21 crystal structure at room temperature exhibiting the martensitic transformation for this exact stoichiometryReference Wang, Meyer, Teichert, Auge, Rausch, Balke, Hütten, Fecher and Felser110; whereas, the Ni–Mn–X (X = In, Sn; Sb) exhibits a martensitic transformation in an off-stoichiometric composition range.Reference Teichert, Auge, Yüzüak, Dincer, Elerman, Krumme, Wende, Yildirim, Potzger and Hütten111 In this category, MSMAs with low dimensionality have been steadily gaining interest and are indeed the most studied magnetocaloric materials at the micro- and nanoscale. Dunand and Mullner have reviewed this effort thoroughly, covering the major achievements in size-reduction the Ni–Mn–Ga system.Reference Dunand and Müllner112 In particular, they focus on the importance of substituting grain boundaries by surfaces (engineering Ni–Mn–Ga nanostructures with a typical size similar to grain size) enabling a free pathway for the twin boundary motion and consequently leading to colossal (2–10%) magnetic field induced strains (MFIS). Several examples illustrate this principle, such as (i) clever introduction of pores smaller than the grain sizes in Ni–Mn–Ga polycrystalline sample by Chmielus and coworkers, enabling 2–3.5% MFIS that remain operational after more than 200,000 cyclesReference Chmielus, Zhang, Witherspoon, Dunand and Müllner113; (ii) the 1% MFIS in a bamboo-like ensemble of fibers with 40–100 µm diameterReference Thomas and Heczko114; (iii) 0.15% MFIS in directional solidified plate-shaped samples.Reference Potschke, Weiss, Gaitzsch, Cong, Hu, Roth and Schultz115 In addition, FM Heusler thin films have been highlighted in the literature as promising components in spintronic devices.Reference Wang, Meyer, Teichert, Auge, Rausch, Balke, Hütten, Fecher and Felser110 Basically, phase stability, grain size, and surface effect are referred as the main differences between the bulk and thin films. Further interesting properties have been already found in thin films, such as a large MCE, giant magnetoresistance, and MFIS.Reference Wang, Meyer, Teichert, Auge, Rausch, Balke, Hütten, Fecher and Felser110,Reference Dunand and Müllner112 As typically, the maximum values of these properties are usually obtained around martensitic transformation temperature, which for thin films can be affected by the substrate choice,Reference Roytburd, Kim, Su, Slutsker and Wuttig116 size effect (grain size and thickness),Reference Malygin117 phase compatibility (between martensite–low temperature–and austenite–high temperature), and heat treatment procedures.Reference Vinodh Kumar, Singh, Seenithurai, Bysakh, Manivel Raja and Mahendran118 It has been shown that the choice of the substrate is very important because it influences the thin film growth, possibly leading to a stress-induced martensite or a preferential austenite phase at the interface.Reference Teichert, Auge, Yüzüak, Dincer, Elerman, Krumme, Wende, Yildirim, Potzger and Hütten111,Reference Buschbeck, Niemann, Heczko, Thomas, Schultz and Fähler119–Reference Liu and Huang122 Several substrates have been used so far in the deposition of FSMA thin films, such as silicon (Si),Reference Vinodh Kumar, Singh, Seenithurai, Bysakh, Manivel Raja and Mahendran118,Reference Vishnoi, Singhal and Kaur123 aluminum oxide (Al2O3),Reference Kallmayer, Pörsch, Eichhorn, Schneider, Jenkins, Jakob and Elmers124 magnesium oxide (MgO),Reference Teichert, Auge, Yüzüak, Dincer, Elerman, Krumme, Wende, Yildirim, Potzger and Hütten111,Reference Thomas, Heczko, Buschbeck, Rößler, McCord, Scheerbaum, Schultz and Fähler120 strontium titanate (STO),Reference Heczko, Thomas, Buschbeck, Schultz and Fähler125 and Yttria-stabilized zirconia (YSZ).Reference Zhang, Hughes, Britten, Preston, Botton and Niewczas126 In the literature, the use of MgO(001) substrates is very common due to its low lattice mismatch with FSMA, enabling epitaxial growth (i.e., Ni–Mn based Heusler alloy thin films). As they grow with a preferential orientation, the reorientation mechanisms of epitaxial thin films will be affected.Reference Teichert, Auge, Yüzüak, Dincer, Elerman, Krumme, Wende, Yildirim, Potzger and Hütten111 For example, for GaAS(001) and Al2O3(110), Roytburd and coworkers found the austenite phase at room temperature, whereas for MgO(100), two phases (austenite or martensite) were observed.Reference Roytburd, Kim, Su, Slutsker and Wuttig116
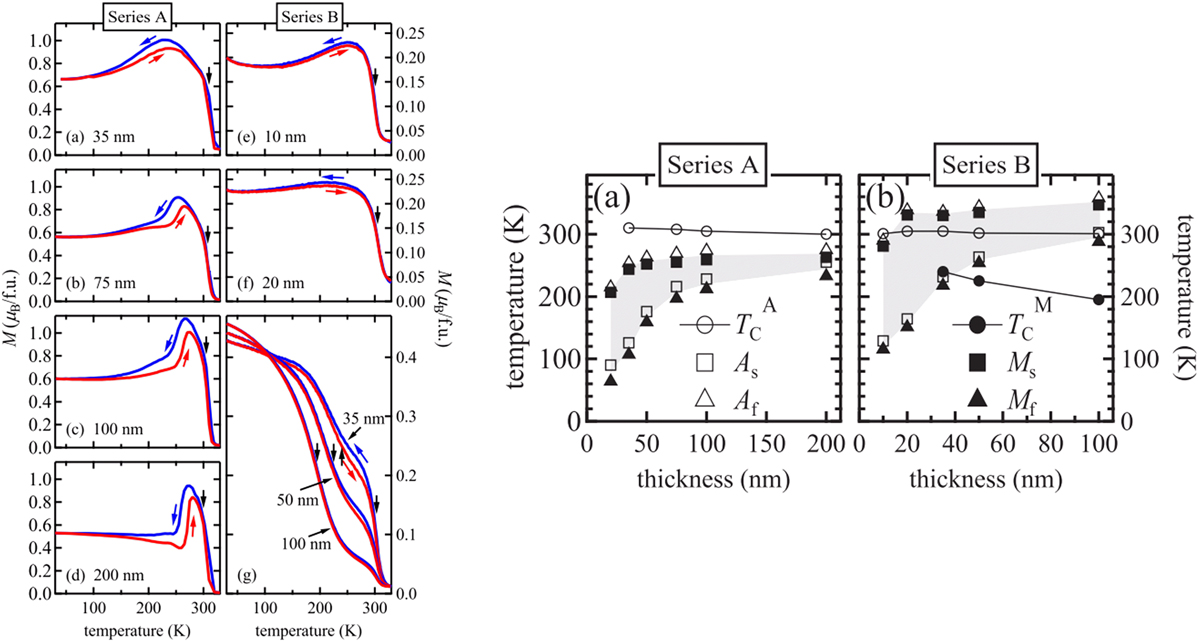
Other studies were focused on the influence of the thickness in the martensitic transformation in Heusler alloys and the existence of a critical size limit. Ranzieri et al.Reference Ranzieri, Fabbrici, Nasi, Righi, Casoli, Chernenko, Villa and Albertini108 have investigated epitaxial Ni–Mn–Ga films on MgO(1 0 0), of 10 and 100 nm thickness and have showed that martensitic transformations occur for thicknesses above 40 nm. For nonepitaxial thin films, Vishnoi et al.Reference Vishnoi, Singhal and Kaur123 studied the Ni–Mn–Sn on Si substrates in the thickness range of 120–2500 nm and found a suppression of the martensitic transformation below 410 nm. More recently, Teichert et al.Reference Teichert, Auge, Yüzüak, Dincer, Elerman, Krumme, Wende, Yildirim, Potzger and Hütten111 studied epitaxial Ni51.6Mn32.9Sn15.5 and Ni51.6Mn34.9Sn13.5 thin films on MgO(0 0 1) in the thickness range of 10–200 nm and found that the thicker films (100 and 200 nm) show bulk-like transformation behavior, but when the film thickness is decreased, these transformations become less pronounced and the transformation temperatures also decrease, as shown in Fig. 6(a). In Fig. 6(b), the thickness dependence of the martensitic transformation and the T C is evidenced. It is observed that for this composition, the austenite starting temperature (A s) and finish martensite temperature (M f) show a strong dependence on the film thickness.
To the left, M(T) curves at low field for Ni51.6Mn32.9Sn15.5 (Series A) and Ni51.6Mn34.9Sn13.5 (Series B) onto MgO (0 0 1) thin film with different thicknesses and to the right, phase diagram of the two materials as a function of thickness. The blue arrow indicates field cooling and the red arrow field heating. Series A was measured with an applied field of 5 mT and series B with 15 mT. Phase diagrams of the both series. Note that the light gray area shows the temperature range of the martensitic transformation. Reprinted from Ref. Reference Dunand and Müllner112 with permission from Elsevier.
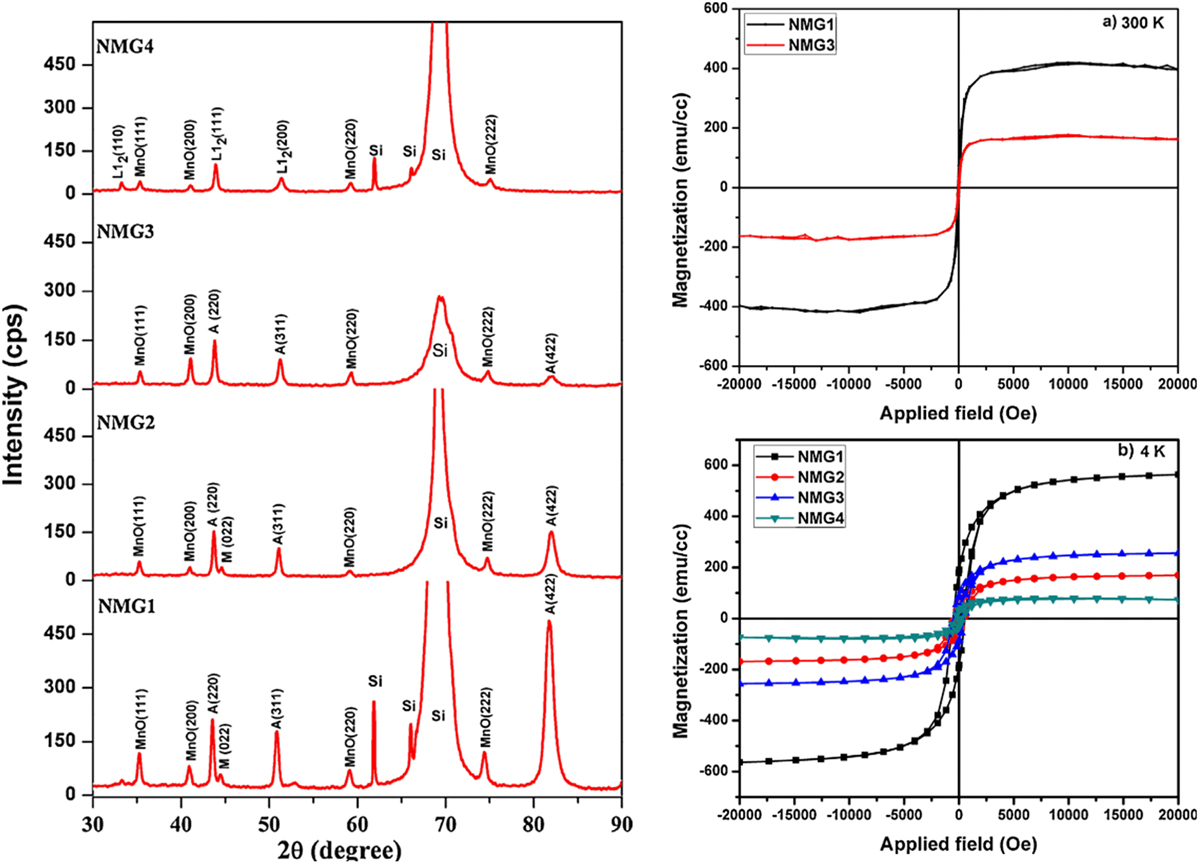
Thermal treatments were also reported regarding the optimization of the magnetic and structural properties of the Heusler alloys.Reference Vinodh Kumar, Singh, Seenithurai, Bysakh, Manivel Raja and Mahendran118,Reference Zhu, Lu, Lai and Ding127 Kumar et al.,Reference Vinodh Kumar, Singh, Seenithurai, Bysakh, Manivel Raja and Mahendran118 for example, have produced Ni–Mn–Ga on Si(100) substrates using DC magnetron sputtering and studied postannealings in these films. The authors performed an annealing at 600 °C for 30 min and observed that: a FM ordering is recovered and the quasi-amorphous structure has changed to nanocrystalline structure. At low film thickness (<300 nm), the annealed films exhibited a mixture of cubic austenite (L21) and martensite phases, while at thicknesses greater than 1000 nm, an ordered L12 phase was observed. The magnetic properties were found to strongly depend on the structure of the constituent phases present in the films. At higher thicknesses, annealed films presented weak FM ordering, as shown in Fig. 7.Reference Vinodh Kumar, Singh, Seenithurai, Bysakh, Manivel Raja and Mahendran118 Note that recently the origin of the martensitic transition in the MSMA Ni–Mn–Ga was described by Schubert et al.,Reference Schubert, Schaefer, Mayer, Laptev, Hettich, Merklein, He, Rummel, Ristow, Großmann, Luo, Gusev, Samwer, Fonin, Dekorsy and Demsar128 like a complex charge-density wave tuned by magnetic ordering and strong electron-lattice coupling. Moreover Zhang et al.Reference Zhang, Hughes, Britten, Dube, Preston, Botton and Niewczas129 showed the advantage of tailoring the thin film composition so that the magnetostructural martensitic transformation and the FM ordering of the austenitic phase occurred simultaneously. The MCE of Ni–Mn–Ga films, while reduced in comparison with the bulk counterpart, still shows a large entropy change of ΔS max ∼ 8.5 J/(kg K) for a ΔH = 60 kOe field change.Reference Recarte, Pérez-Landazábal, Sánchez-Alárcos, Chernenko and Ohtsuka130
Thickness-dependent magnetic properties and phase structure evolution in annealed Ni–Mn–Ga thin films. Thickness of NMG4 > NMG1. Reprinted Ref. Reference Buschbeck, Niemann, Heczko, Thomas, Schultz and Fähler119 with permission from Elsevier.
With the aim of optimizing magnetic properties like MCE, several approaches have been undertaken, where doping is most common. Akkera et al.Reference Akkera, Choudhary and Kaur121 demonstrated that the aluminum (Al) content in N49.8Mn32.97Al4.43Sb12.8 FSMA thin films leads to an increase in the martensitic transformation temperature. The authors established this correlation through temperature-dependent magnetization and resistance measurements and observed a higher ΔS max value of 23 mJ/(cm3 K) at 300 K for a magnetic field change of ΔH = 20 kOe that is associated with a large magnetovolume coupling.Reference Akkera, Choudhary and Kaur121 Another work reported the study of different Ni–Co–Mn–Al thin film compositions deposited onto MgO(001) substrates and concluded that the structure of the martensite phase is 14 M and the metamagnetic martensite transformation occurs from the strongly FM austenite to the weakly magnetic martensite.Reference Teichert, Kucza, Yildirim, Yuzuak, Dincer, Behler, Weise, Helmich, Boehnke, Klimova, Waske, Elerman and Hütten131 The Ni41Co10.4Mn34.8Al13.8 films have shown an inverse GMCE with a peak value of ΔS max ∼ J/(kg K) for ΔH = 50 kOe.Reference Teichert, Kucza, Yildirim, Yuzuak, Dincer, Behler, Weise, Helmich, Boehnke, Klimova, Waske, Elerman and Hütten131
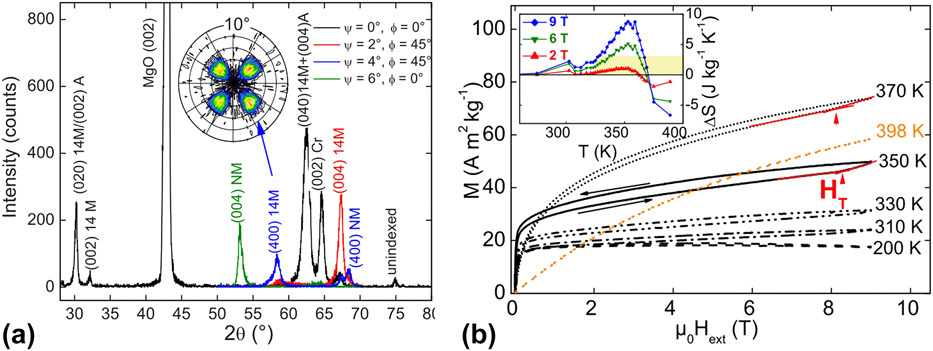
Other important Heusler alloy is the Ni–Co–Mn–In alloy, whose magnetization increases on heating as a result of a structural transition, and consequently shows an inverse MCE.Reference Niemann, Heczko, Schultz and Fähler132 One advantage of growing these materials in thin film form is the potential of reducing the first-order nature of their transition, due to the strong coupling to the substrate. Niemann et al.Reference Niemann, Heczko, Schultz and Fähler132 found that in epitaxial Ni–Co–Mn–In on MgO (0 0 1), the portion of the film immediately coupled to the substrate remained in the FM austenite phase, indicating that the coupling completely suppressed the martensitic transformation (Fig. 8). These films exhibit an inverse MCE with a maximum of ΔS max ∼ 8.8 J/(kg K) at 353 K, under a ΔH = 90 kOe applied field.
(a) Four-circle XRD analyses of the martensitic state at room temperature by θ–2θ-scans (Philips X’Pert, Cu Kα, λ = 0.15406 nm). (b) Specific magnetization as a function of external field consecutively measured after undercooling to 50 K. The inset shows the specific change in entropy calculated from all consecutive M(H) measurements. Around the metamagnetic martensitic transition, a positive ΔS with a maximum of 8.8 J/(kg K) at 353 K is observed. Reproduced from Ref. Reference Niemann, Heczko, Schultz and Fähler132 with the permission of AIP Publishing.
H. ABO3 perovskites
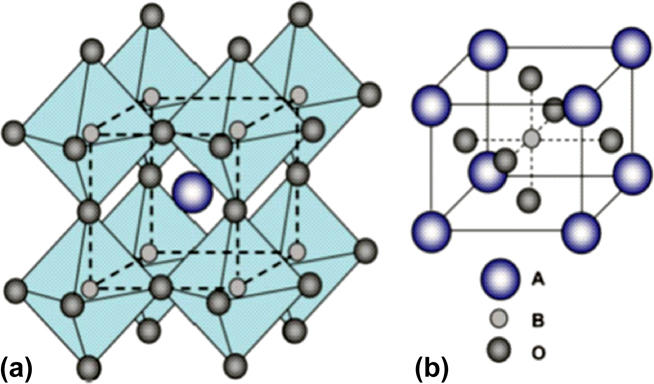
Magnetic oxides are another family presenting a strong coupling between spin and lattice degrees of freedom. The materials scientists’ interest is due to their multifunctional nature, which made them widely studied and applied in today technological devices. In this section, few examples are given to show the facets of interesting physical properties of magnetic oxide thin films as well as their potential applications in areas such as electronics, spintronics, refrigeration, and strictive. Two of the most important families are ABO3 perovskites and AB2O4 spinels (A and B can be 3d or 4f elements) as they are fertile in different forms of magnetism. Their rich and complex magnetism arises mainly due to the atomic structure that leads to new bonding geometries and their electronic states nature. Thus, the magnetic oxides’ thin film nanostructures allow the exploration of the exchange interaction lengths and their tuning on an atomic length scale—fundamental for the emergence of new functionalities. In a cubic unit cell, type “A” atoms (violet spheres in Fig. 9) sit at cube corner positions (0, 0, 0), type “B” atoms (smaller and light gray spheres) sit at body-centered position (1/2, 1/2, 1/2), and oxygen atoms (larger and darker gray spheres) sit at face-centered positions (1/2, 1/2, 0). This arrangement can also be seen as a set of octahedra, where the “B” atoms lie in the center and are coordinated by six O atoms lying in the vertices.Reference Zhang, Sunarso, Shao, Zhou, Sun and Liu133
Schematics of magnetic oxide heterostructures. Reproduced from Ref. Reference Zhang, Sunarso, Shao, Zhou, Sun and Liu133 with permission of The Royal Society of Chemistry.
The interstitial A-sites are occupied by a cation (3d or 4f elements), whose oxidation state is dependent on the B-site transition metal. Also, the geometry plays an important role on the magnetism, namely, the B–O–B network, which forms a perfectly cubic ABO3 unit cell with 180° B–O–B bond angles. The A–O and B–O bond lengths are such that the Goldschmidt tolerance factor t = (rA–rO)/(√2(rB + rO)) is 1.0,Reference Goldschmidt134 where rA, rB, and rO are the radii of the A-cation, B-cation, and anion, respectively. For a large number of magnetic oxides, it is constrained to 0.71–1, where the coordination between atoms and constraints of three-dimensional connectivity are accommodated by cooperative distortions such as tilts and rotations of the constituent octahedra.Reference Glazer135 Thus, the pseudocubic structures, such as orthorhombic, tetragonal, or rhombohedra symmetries are observed for low distortions. Moreover, the change of the B–O–B bond angles leads to multiple competing magnetic interaction exchange (in direction and strength), which are mediated through these bonds. Another important parameter is the oxidation state of the B atom since it can also strongly influence the nature of the magnetic state. In special cases, B represents a mixed valence that leads to a double-exchange interaction mechanism, which is mainly responsible for the appearance of the FM state. In the case of presenting only one magnetic state, the magnetic mechanism is called of super-exchange anti-FM or weak FM state—GKA rules proposed by Goodenough,Reference Goodenough136 Kanamori,Reference Kanamori137 and AndersonReference Anderson138 explained in detail this mechanism. Another important parameter that should be taken into account is the presence of structural distortions. These can lead to the appearance of Jahn–Teller effect, which in turn is responsible for the crystal field splittingReference Glazer135 and consequently, the mediation of the magnetic state.
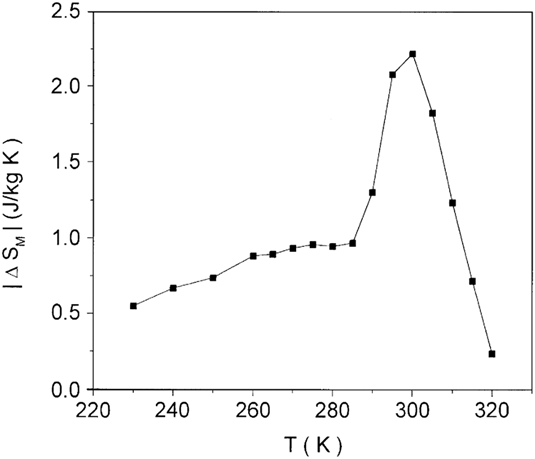
Considering the scale reduction studies of this system of materials, one of the major achievements was carried out by Jin and co-authors in 1994,Reference Jin, Tiefel, McCormack, Fastnacht, Ramesh and Chen139 in La1−xCaxMnO3 (with x ∼ 0.67), when they deposited a thin film by pulsed laser ablation exhibiting a negative isotropic magnetoresistance effect more than three orders of magnitude higher than the typical value observed in superlattice films. These epitaxial films exhibit magnetoresistance values as high as 127,000% near 77 K and approximately 1300% near room temperature.Reference Jin, Tiefel, McCormack, Fastnacht, Ramesh and Chen139 Furthermore, a thorough report by Lampen and coworkers highlighted the impact of size-reduction on samples with different typical sizes, namely, a 150 nm thick film deposited by PLD on top of the MgO substrate and two sets of sol–gel chemically prepared powders of 15 and 33 nm typical size. They remark the major impact of size-reduction: the broadening of the magnetic transition and the reduction of the T C, magnetic moment, and ΔS max associated with a weakening of the magnetic transition first-order nature.Reference Lampen, Bingham, Phan, Kim, Osofsky, Piqué, Phan, Yu and Srikanth140 Wang et al.Reference Wang, Tang, Wang, Zhang and Du141 in 2002 were one of the first to study the MCE of a laser pulsed deposited La0.78Ag0.22MnO3 thin film, reporting ΔS max ∼ −2.22 J/(kg K) at room temperature under ΔH = 10 kOe (Fig. 10).
Magnetic entropy change maximum obtained by Wang et al. under a magnetic field of 1 T as a function of the temperature. Reprinted from Ref. Reference Wang, Tang, Wang, Zhang and Du141 with permission from Elsevier.
In 2009, a thorough study of the MCE was performed in La0.75Ba0.1M0.15MnO3 (M = Na, Ag, and K) thin films. The values achieved were ΔS max ∼ 2.26, 1.72, and 2.44 J/(kg K), respectively, under a magnetic field change of ΔH = 20 kOe.Reference Koubaa, Koubaa and Cheikhrouhou142 In 2011, Prellier et al.Reference Prellier, Lecoeur and Mercey143 grew a series of (La0.7Sr0.3MnO3/SrRuO3) superlattices, where the effect of varying SrRuO3 layer thickness was examined. A room-temperature MCE was obtained owing to the finite size effect, which reduced the T C of La0.7Sr0.3MnO3 layers. While the working temperature ranges were enlarged, the −ΔS max values remained similar to the values in polycrystalline La0.7Sr0.3MnO3. Consequently, the RCPs were significantly improved, the microscopic mechanism that is related to the effect at the interfaces at La0.7Sr0.3MnO3/SrRuO3, and higher nanostructural disorder. This pioneering study indicated that artificial oxide superlattices/multilayers might provide an alternative pathway in the search for efficient room-temperature magnetic refrigerators for (nano) microscale systems.Reference Puga, Bordalo, Silva, Dias, Belo, Araújo, Oliveira, Pereira and Ventura19,Reference Belyea, Santos and Miller144
Other epitaxial thin films were presented in 2012 by Goktas et al.Reference Goktas, Mutlu and Kawashi145 when they deposited manganite La0.67Ag0.33MnO3 (LAgMO) and La0.67K0.33MnO3 (LKMO) films on the top of LaAlO3 (1 0 0) and quartz substrates by using the sol–gel dip-coating technique. This work showed that the LAgMO and LKMO epitaxial films present different metal-insulator transition temperatures (T-MI) and PM-FM phase transition temperatures (T C).Reference Goktas, Mutlu and Kawashi145 In the same year, Belyea and co-authorsReference Belyea, Santos and Miller144 investigated the MCE of two epitaxial multilayer manganite heterostructures following the strategy of Prellier work,Reference Prellier, Lecoeur and Mercey143 i.e., a multilayer composed by a single layer of the La0.56Sr0.44MnO3 alloy with randomly distributed La and Sr cations, the other a digitally synthesized superlattice of LaMnO3 and SrMnO3 fabricated to be compositionally identical to the alloy. The magnetic entropy change and the RCP were larger for the alloy than for the superlattice, though both are suppressed relative to their bulk counterparts. These results indicate that the disorder of the A-site cation species in the perovskite structure may play a crucial role in defining the MCE in complex oxide materials.Reference Belyea, Santos and Miller144
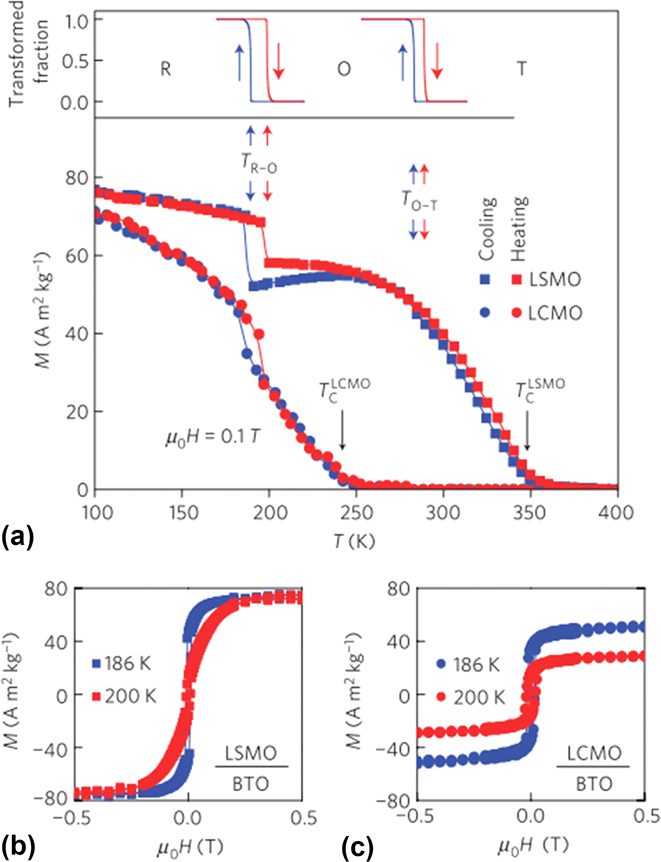
A major breakthrough was smartly engineered and successfully experimentally achieved by Moya et al.Reference Moya, Hueso, Maccherozzi, Tovstolytkin, Podyalovskii, Ducati, Phillips, Ghidini, Hovorka, Berger, Vickers, Defay, Dhesi and Mathur72 in 2013 when they presented a giant and reversible extrinsic MCE in the La0.7Ca0.3MnO3//BaTiO3 thin film by using the strain-mediation between the substrate and the film near the substrate first-order structural phase transition temperature (Fig. 11). This extrinsic effect led to an impressive enhancement of ΔS mmax up to 9 J/(kg K), ten times higher than the intrinsic effect observed in the La0.7Ca0.3MnO3 thin film 0.7 J/(kg K) for the same ΔH = 10 kOe.
M(T) of LSMO/BTO and LCMO/BTO: (a) M(T) measured on cooling (blue circles, LCMO; blue squares, LSMO) and heating (red circles, LCMO; red squares, LSMO), showing magnetic jumps near TR-O ∼ 200 K below film T C ∼ 350 K (LSMO) and T C ∼ 240 K (LCMO). (b) M(H) for LSMO/BTO and (c) LCMO/BTO. Reprinted by permission from Ref. Reference Moya, Hueso, Maccherozzi, Tovstolytkin, Podyalovskii, Ducati, Phillips, Ghidini, Hovorka, Berger, Vickers, Defay, Dhesi and Mathur72, copyright 2013.
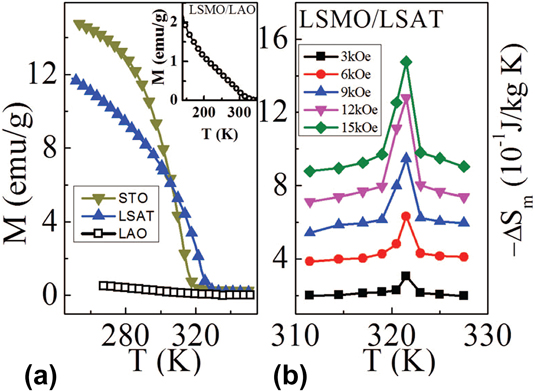
In the same year, strain-dependent magnetocaloric properties of La0.67Sr0.33MnO3 thin films deposited on three different substrates: (0 0 1) LaAlO3 (LAO), (0 0 1) SrTiO3 (STO), and (0 0 1) La0.3Sr0.7Al0.65Ta0.35O9 (LSAT) corresponding to a less compressive (LAO), nearly lattice matched (LSAT) and largely tensile strained (LAO) have been investigated. Interestingly, the authors found that the sample with larger tensile strain (LSMO/STO) was the one exhibiting higher RCP values, suggesting that strain can effectively tune the magnetocaloric properties in thin films and opening the possibility to use similar tool to tune the MCE in bulk samples too (Fig. 12).Reference Kumar, Chukka, Chen, Yang and Chen146
(a) M(T) for LSMO/STO, LSMO/LSAT, and LSMO/LAO under a field of 50 Oe, in the temperature range 250–350 K and (b) ΔS m for LSMO/LSAT in the temperature range 310 K < T < 327 K, under a field change of 1.5 T. Reprinted from Ref. Reference Kumar, Chukka, Chen, Yang and Chen146, licensed under a Creative Commons Attribution (CC BY) license.
Similarly, Giri et al.Reference Giri, Dasgupta, Poddar, Sahoo, Paladhi and Nath147 deposited epitaxial Sm0.55Sr0.45MnO3 thin films onto the LAO (001), LSAT (001), and STO (001) single crystalline substrates by pulsed laser deposition technique. They found that the film on the LAO substrate is under compressive strain and undergoes a transition at a Curie temperature of 165 K. On the other end, the films on STO and LSAT substrates, which are under tensile strain, exhibited a Curie temperature at 120 K and 130 K, respectively. Most interestingly, both normal (i.e., negative ΔS) and inverse (i.e., positive ΔS) MCEs have been observed around T C and above their metal-insulator transition (T p), respectively, for Sm0.55Sr0.45MnO3 thin films onto STO and LSAT substrates with a maximum value of MCE ∼ 10 J/(kg K). The Sm0.55Sr0.45MnO3 on STO exhibits a large RCP of 142 J/kg for a magnetic field change of 10 kOe.Reference Giri, Dasgupta, Poddar, Sahoo, Paladhi and Nath147
Other exotic spin-lattice related effects were observed while playing with the relative strain between the substrates and La1−xSrxMnO3 films, such as anomalies in magnetostriction and thermal expansion, electric resistivity with a relevant dependence on film thickness, and the formation of magnetic stripe domains due to inhomogeneities and coexistence of different magnetic phases.Reference Lanzarini, Barriere, Sahli, Gelin, Dubrez, Mayer, Pierronnet and Vikner94–Reference Tegus, Bruck, Buschow and de Boer97 Furthermore, the magnetovolume coupling of manganites and cobaltites thin film oxides have been thoroughly studied. Kundys and SzymczakReference Kundys and Szymczak148 explored the magnetostriction for both kind of thin films as a function of temperature and magnetic field. They showed that the giant magnetostriction in cobaltites arises from two phenomena: the orbital instability of Co3+ ions that under a magnetic field leads to a transition from a nondegenerated orbital low-spin state to a degenerated orbital intermediate-spin state and the increase of the FM cluster volume with the increase of magnetic field intensity. It seems that the last mechanism is common for all materials that present FM clusters embedded into non-FM matrix.
IV. TECHNOLOGICAL APPLICATIONS: MICRO- AND NANODEVICES
As mentioned in Sec. I, the micro- and nanoscale open a new pathway for innovative technological applications which take advantage of the materials miniaturization. Rosensweig workReference Rosensweig149,Reference Rosensweig150 was fundamental for the identification of several interesting applications for magnetocaloric fluids, composed of micro- and nanoparticles immersed in a liquid medium, long time before the thorough study of magnetocaloric micro- and nanostructures. Later, and following the path of Brown’s room temperature magnetic refrigerator,Reference Brown151 Burnet published a patent of a room temperature magnetic refrigerator where instead of having a solid magnetocaloric material one would have a magnetocaloric ferrofluid, enabling a simpler machine design and potentially higher operational frequencies.Reference Burnett152 The obvious miniaturization of refrigerators for cooling small volumes has also been explored.Reference Kim, Ghirlanda, Adams, Bethala, Sambandam and Bhansali26–Reference Wu, Lu, Liu and He28,Reference Shirron, Canavan, DiPirro, Jackson, King, Panek and Tuttle153,Reference Ross154 In 2001, Shirron’s goal was to construct a 10 µW refrigerator to continuously cool a <10 kg mass load at sub-Kelvin temperature.Reference Shirron, Canavan, DiPirro, Jackson, King, Panek and Tuttle153 Kim and coworkers have constructed the first near room temperature magnetocaloric microcoolerReference Kim, Ghirlanda, Adams, Bethala, Sambandam and Bhansali26 using Gd5Si2Ge2 bulk disc bonded to a Si chip, where microchannels were patterned, to attain a 7 K temperature change. On a different approach, Silva and coworkers proposed, by numerical simulations, an innovative solid-state microrefrigerator concept, whose main advantage is the absence of any liquid heat exchange medium and consequently enabling a much simpler design, as can be seen in Figs. 13(a) and 13(b).Reference Silva, Bordalo, Pereira, Ventura and Araújo27 The numerical study resulted in a 2.75 W/cm2 value for the coefficient of performance for an operating temperature around 296 K by simulating a Gd thin layer sandwiched by two thermal switches that are externally actuated by a magnetic field.
(a and b) Proposed magnetic solid state device mechanism by Silva and coworkers. The two adiabatic processes occur during the application and removal of H (e and f) while the two isofield processes take place during the heat flux between the cold reservoir and MCM (d) and between the MCM and the hot reservoir (g). The variation of the thermal conductivity with H can establish a temperature gradient from the cold to the hot reservoir. The inset shows the entropy–temperature diagram of the Brayton cycle. Reproduced from Ref. Reference Wu, Lu, Liu and He27 with the permission of Elsevier. (c) Rendering diagram of the novel solid-state magnetic refrigeration system proposed by Wu and coworkers. Reproduced from Ref. Reference Wu, Lu, Liu and He28 with the permission of Elsevier.
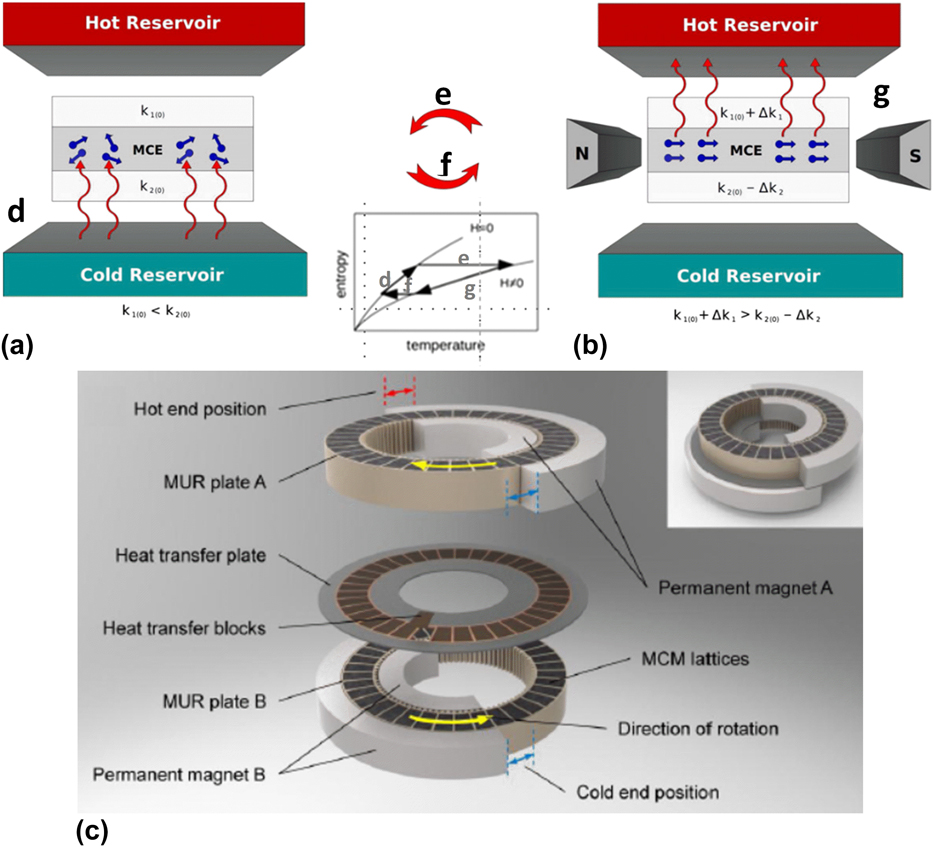
This concept was further explored by Wu and coworkers, who recently published their concept design [Fig. 13(c)] and a comprehensive simulation study of the geometrical parameters. Using gadolinium as the magnetocaloric material and an applied magnetic field of 15 kOe, a maximum no-load temperature span of 50.9 K is reached for a 72-lattice configuration.
Such refrigerators could have an important role on the cooling of the microprocessors, but also in other optical, electrical, or biological applications. This work has prompted the emergence of innovative thermal switch solutions such as those composed by a ferrofluid,Reference Puga, Bordalo, Silva, Dias, Belo, Araújo, Oliveira, Pereira and Ventura19 thermoelectric materials,Reference Tomc, Tušek, Kitanovski and Poredoš155 or magnetic materials whose thermal conductivity changes significantly upon the application of a magnetic field. For the latter case, materials presenting first-order transitions have great potential since drastic changes can be induced by a magnetic field on both the magnetic, structural, and electronic reservoirs of these materials, consequently leading to sharp variations on their thermal conductivity. Scarce thermal conductivity studies have been performed, namely, on the manganites sytemReference Turcaud, Morrison, Berenov, Alford, Sandeman and Cohen156,Reference Davarpanah, Amaral and Amaral157 and on the Fe2P family of materials.Reference Davarpanah, Amaral and Amaral157
The ferrofluid containing magnetic particles immersed in a liquid solution has been further developed for microfluidic pumps.Reference Love, Jansen, McKnight, Roh and Phelps29,Reference Dave, Virpura and Bhatnagar158,Reference Chaudhary, Wang, Ray, Sridhar and Ramanujan159 The concept also introduced by Rosensweig is as follows: since magnetic materials lose their magnetization as the temperature approaches the material T C, then by exposing a column of magnetic fluid to a uniform magnetic field coincident with a temperature gradient will produce a pressure gradient in the magnetic fluid. As the fluid heats up, it loses its attraction to the magnetic field and is then displaced by the cooler fluid. Love and coworkers have thoroughly studied this system, including the ferrofluid synthesis and the pump design and performance.Reference Love, Jansen, McKnight, Roh and Phelps29 They highlight the advantage of not having movable mechanical parts in contrast with other microtechnologies such as piezoelectric, thermopneumatic, or shape memory actuation, where there is always a mechanical movement at high frequencies leading to short device duration. In particular, they stress that a magnetocaloric micropump would be particularly useful for lab-on-a-chip applications, where typically there is a requirement for thermal cycling for certain chemical processes, which could additionally control the microfluidic pump. The authors stress the importance of tailoring the magnetocaloric particles toward increased pyromagnetic coefficients (i.e., higher ∂M/∂T values). Since Love’s report, the majority of the reports have been focused on the optimization of ferrite nanoparticles, whereas to our knowledge, there are no reports on the application of strong magnetovolume-coupled nanoparticles for this purpose.
The miniaturization of magnetocaloric materials and, in particular, of the strongly magnetovolume-coupled materials inspired applications in other areas such as energy harvesting or hyperthermia. Cleveland and co-authors have illustrated the energy harvesting/conversion concept by producing a composite material composed of a piezoelectric (PVDF) and a magnetocaloric material (Gd5Si2Ge2).Reference Cleveland and Liang160 Even by using as small as 4 weight percent of the magnetocaloric material immersed in PVDF, the authors were able to collect 34.5 W/m2 when the device was under a thermal cycle (from −10 °C to +10 °C). Shortly after, Ozaydin and coworkers found promising results also for a similar composite for the conversion magnetic-to-electrical energy,Reference Ozaydin and Liang32 as shown schematically in Fig. 14(a). Barkley and co-authors engineered another energy harvesting composite by mixing micron-sized particles of Gd5Si2Ge2 and aluminum toward tribological applications in automobile industry.Reference Barkley, Sanchez and Liang161
(a) Mechanism of energy conversion proposed by Ozaydin and Liang comprising a piezoelectric (PVDF) and a magnetostrictive material (Gd5Si2Ge2). Reproduced from Ref. Reference Ozaydin and Liang32 with the permission of AIP. (b) Change in temperature as a function of induction heating time under H = 55 Oe at f = 279 kHz for LaFe11.57Si1.43H1.75, MgFe2O4, and Fe3O4 suspensions. Reproduced from Ref. Reference Barati, Selomulya, Sandeman and Suzuki162 with the permission of AIP.
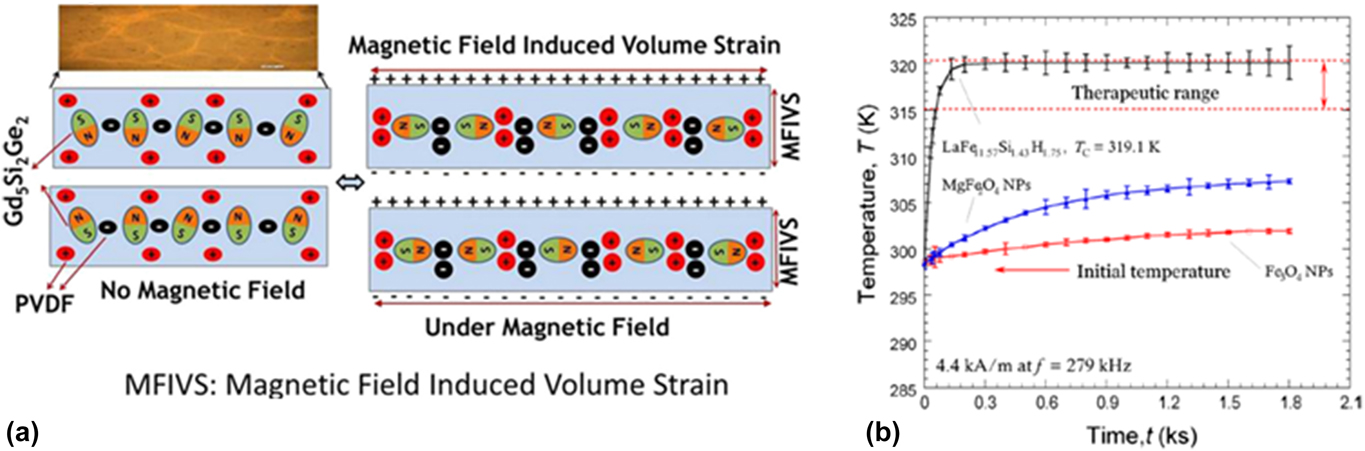
The magnetocaloric materials miniaturization will certainly impact biotechnologies as well. Barati, Sandeman, and coworkers have recently explored the induction heating performance of the La–Fe–Si magnetocaloric material.Reference Barati, Selomulya, Sandeman and Suzuki162 As can be seen in Fig. 14(b), a suspension with LaFe11.57Si1.43H1.75 particles exhibits a much faster heating than Fe-based suspensions, such as MgFe2O4 and Fe3O4, under the same alternating magnetic field intensity (∼55 Oe) and frequency (279 kHz). In addition, there is a temperature stabilization for the La–Fe–Si suspension at T ∼ 319 K, lying within the therapeutic temperature window for hyperthermia treatments. The authors attribute the remarkable fast heating effect to the large magnetic hysteresis present in these materials and the temperature stabilization to their sharp magnetic transition at T = T C = 319 K. Moreover, they envisage a promising route for La–Fe–Si particles in hyperthermia treatments due to their extraordinary induction heating performance and the ability to tune their Curie temperature by chemical stoichiometry.
V. FINAL REMARKS AND OUTLOOK
During the present review, a thorough review is presented concerning size-reduction (micro- and nanoscale) studies in the most promising magnetocaloric material families known to date. As clearly exemplified, this field is in the early stage and demands a thorough and methodic work. We emphasize several practical challenges arising at these scales, such as oxidation (few nm thick oxidation layer have a great impact on the final properties of a several nm thick magnetocaloric thin film), the optimization of the crystallinity; narrowing nanoparticles size-distribution; enhancing substrate–film interfaces; the disorder reduction, the tuning of T C, among others.
Despite being in its first steps, the micro- and nanoscale studies appear to have already achieved encouraging results aimed to (i) tackle the challenges of macroscopic magnetic refrigeration, (ii) help respond to the fundamental questions arising with size-reduction, and (iii) open new possibilities for micro- and nanodevices applications. Therefore, the recent years have shown that there is a fertile ground for micro- and nanoscale studies and this effort is expected to continue growing.
There are common features observed in the majority of these studies that seems to be generalized to all the nanosystems. Concerning the magnetic properties, there is a typical broadening of the magnetic transition and consequently a broadening of the ΔS (T) curve (enhancement of FWHM), the reduction of ΔS max and of the saturation magnetization. These effects are consequences of the higher impact that the disorder has in these smaller systems, namely: strain fields, atomic disorder, uncompensated surface spins, chemical inhomogeneities, grain size distribution, etc.
Another common factor to the majority of the studies is the enhanced role that stress plays in these systems, in particular, at nanoparticle surface or at the substrate–film interface, mimicking the effects of applying hydrostatic pressure in their bulk counterparts. This effect is more relevant in systems with strong magnetovolume coupling: for the Gd5(Si,Ge)4 nanoparticles, where the intrinsic surface stress leads to a T C increase, and the manganite-BaTiO3 film-substrate, where the structural transition in the substrate leads to an extrinsic large MCE-are good examples of the new underlying mechanisms arising at these scales.
The manganite system and the FSMAs are the two material families that have been explored in greater detail from the nano- (nanoparticles, nanowires) to the microscale (microstructure engineering). By contrast and surprisingly, few reports on the size-reduction of the La–Fe–Si and the Mn–Fe–P–Si materials have been published until now and therefore it is expected a significant increase in the following years. Whereas, the Fe–Rh system has presented itself as one of the most proficuous playgrounds for material scientists at reduced scales, with surprising results such as the suppression of its irreversibility in the thin film form.
There is a promising future ahead for the micro- and nanostructuring of strong magnetovolume coupled materials that can be unfolded in three main branches: help tackling the challenges observed nowadays on macroscale magnetic refrigeration, investigate the role of the different underlying physical mechanisms emerging at these reduced dimensions, and drive the development of new application devices.
Finally, from the technological point of view, the uniqueness ability of producing nanomaterials will open a wide range of new applications such as microrefrigeration, microfluidic pumps, thermal switches, multiferroic devices, energy harvesting, drug delivery, and hyperthermia. These new fields expand the possible applications for magnetocaloric/or strongly magnetovolume coupled materials at reduced dimensions and consequently will attract an increasing number of material scientists and engineers to develop further the seminal ideas planted so far and potentially engineer new applications in the existing and in other fields. Finally, it is expected that new functionalities and devices will emerge when the fabrication of the materials and their control at the micro- and nanoscale is in a more mature state.
ACKNOWLEDGMENTS
The authors acknowledge Fundação para a Ciência e a Tecnologia for financial support through the projects: CERN/FIS-NUC/0004/2015, EXPL/EMS-ENE/2315/2013, and FEDER/POCTIn0155/94. J.H. Belo thanks FCT for the Grant SFRH/BD/88440/2012 and CICECO-Aveiro Institute of Materials, POCI-01-0145-FEDER-007679 (FCT Ref. UID /CTM /50011/2013), financed by national funds through the FCT/MEC and when appropriate co-financed by FEDER under the PT2020 Partnership Agreement. A.M. Pereira acknowledges the project NORTE-070124-FEDER-000070 for financial support.


 Open access

