


Introduction
Sea-ice and snow thickness are important variables in the global climate system and for prediction of future climate change (e.g. Reference Holland, Bitz, Hunke, Lipscomb and SchrammHolland and others, 2006a). They influence fluxes of heat and gas between ocean and atmosphere (Reference Kurtz, Markus, Farrell, Worthen and BoisvertKurtz and others, 2011; Reference RysgaardRysgaard and others, 2011), limit the amount of radiation reaching the ocean (Reference PerovichPerovich, 1996) and change the amount of fresh water stored in the ice cover and exported from the Arctic (Reference Holland, Finnis and SerrezeHolland and others, 2006b). The presence and characteristics of the sea-ice cover play a major role in the Arctic ecosystem. Among other aspects, it is closely linked to the planktonic community (Reference Arrigo, Van Dijken and PabiArrigo and others, 2008a; Reference Søreide, Leu, Berge, Graeve and Falk-PetersenSøreide and others, 2010) and determines the availability of habitat for organisms living in or on the ice (Reference Kovacs, Lydersen, Overland and MooreKovacs and others, 2011). In recent decades, the Arctic ice cover has changed dramatically. Large export events of multi-year ice and continuous thinning of the ice cover in general have led to thinner and younger ice than previously observed (Reference Maslanik, Fowler, Stroeve, Drobot and ZwallyMaslanik and others, 2007; Reference Haas, Pfaffling, Hendricks, Rabenstein, Etienne and RigorHaas and others, 2008; Reference Hunke and BitzHunke and Bitz, 2009; Reference Kwok, Cunningham, Wensnahan, Rigor, Zwally and YiKwok and others, 2009). Observations and predictions suggest that the Arctic will become dominated by first-year ice (Reference Hunke and BitzHunke and Bitz, 2009; Reference Kwok, Cunningham, Wensnahan, Rigor, Zwally and YiKwok and others, 2009; Reference ComisoComiso, 2012). The ice cover north of Svalbard is characterized by a large fraction of first-year and potentially second-year ice with few intrusions of old ice. It is therefore a valuable example of the potentially dominant ice type of the future Arctic Ocean.
Large-scale measurements of sea-ice thickness remain difficult, and spaceborne observations require further calibration and validation. Data obtained from NASA’s Ice, Cloud and land Elevation Satellite (ICESat) mission have provided insight into the evolution of ice thickness and ice volume in the Arctic (Reference Kwok, Cunningham, Wensnahan, Rigor, Zwally and YiKwok and others, 2009), and more data are expected from the European Space Agency’s (ESA) CryoSat-2 (Reference WinghamWingham and others, 2006). The use of airborne electromagnetic (EM) induction devices (so-called EM-birds; Reference Haas, Lobach, Hendricks, Rabenstein and PfafflingHaas and others, 2009) towed above the ice by aeroplane or helicopter has proven to be suitable to obtain data to bridge the gap between small-scale in situ on-ice measurements and satellite data. So far, the focus of airborne campaigns has been mostly on the sea ice in the Transpolar Drift (e.g. Reference Haas, Pfaffling, Hendricks, Rabenstein, Etienne and RigorHaas and others, 2008) and on the multi-year ice north of Greenland and the Canadian Archipelago (e.g. Reference Haas, Hendricks, Eicken and HerberHaas and others, 2010; Reference Prinsenberg and PetersonPrinsenberg and Peterson, 2011). These are also primary regions for the calibration and validation of the ESA CryoSat-2 and NASA IceBridge projects (e.g. the CryoVEx (CryoSat Validation Experiment) 2011 Campaign Implementation Plan). Studies of the large-scale sea-ice thickness distribution in the European Arctic, especially north of Svalbard, have been sparse and have consisted mostly of in situ point measurements during sea-ice station or ship-based observations along the ship track (e.g. Reference Haas and EickenHaas and Eicken, 2001; Reference PerovichPerovich and others, 2009). However, in the light of observed changes in the Arctic towards a mostly seasonal ice cover, more effort needs to be focused on better understanding of the characteristics of first-year ice. In this study, we present the results of airborne EM surveys during 2007–11 in the region north of Svalbard in the European Arctic.
Methods
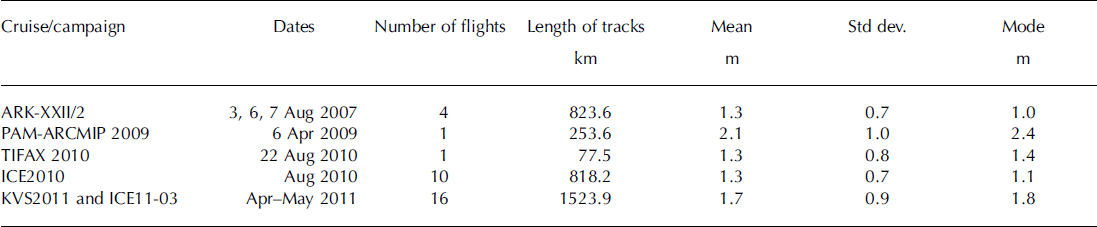
Extensive airborne surveys of the sea-ice cover north of Svalbard using an EM-bird were performed by the Norwegian Polar Institute (NPI) and the Alfred Wegener Institute (AWI). In August 2007, RV Polarstern was used as the base for helicopter operations during cruise ARK-XXII/2. Measurements in April 2009 and on 22 August 2010 were performed using the AWI Polar-5 aeroplane as part of the Pan-Arctic Measurements and Arctic Regional Climate Model Intercomparison Project (PAM-ARCMIP) and Thick Ice Feeding Arctic Export (TIFAX) campaigns (Reference HerberHerber and others, 2012), respectively. During the NPI science cruises in August 2010 (ICE2010) and April-May 2011 (KVS2011 and ICE11-03), RV Lance and KV Svalbard served as helicopter bases. For details and flight tracks see Table 1 and Figure 1.
Overview of EM-bird campaigns and basic ice thickness statistics
Maps of all EM-bird flights north of Svalbard included in this study. The overview map shows the flight locations by campaign. The grey symbols show the positions of ice stations when snow thickness data were collected (x: August 2010, +: April/May 2011). The right map shows ice thickness averaged over 5 km profile length. The grey lines indicate the average position of the open-drift ice (40% ice concentration) edge according to met.no ice charts during the NPI cruises in August 2010 and April-May 2011.

The principle of the EM-bird ice thickness measurements is described in detail by Reference Haas, Lobach, Hendricks, Rabenstein and PfafflingHaas and others (2009). We therefore include only a short description of the method. EM induction for observations of sea-ice thickness utilizes the large differences in conductivity between sea water (in our study region generally >2400mSm−1) and sea ice (near 0mSm−1). Using a set of coils in the EM-bird, a secondary EM field is induced at the ice/water interface, and its amplitude and phase are used to derive the distance from the EM-bird to the bottom of the sea ice. A laser altimeter mounted in the EM-bird provides the distance from the instrument to the top of the ice (top of the snow in the case of snow-covered sea ice). The difference between these two distances is the total snow and ice thickness (in the following referred to as ice thickness). Over level sea ice, the accuracy of the EM measurements is within ±0.1 m of drillhole measurements (Reference Haas, Lobach, Hendricks, Rabenstein and PfafflingHaas and others, 2009). Melt ponds, which cover extensive areas of sea ice in summer, do not significantly affect the accuracy of the measurements due to their predominantly freshwater composition (Reference Haas, Gerland, Eicken and MillerHaas and others, 1997; Reference Eicken, Tucker and PerovichEicken and others, 2001). However, over melt ponds, the retrieved total ice thickness corresponds to the ice plus melt pond thickness. Due to smoothing effects within the footprint of the EM-bird (∼40–50m), the maximum thickness of ridges can be underestimated by as much as 50% (Reference Haas, Pfaffling, Hendricks, Rabenstein, Etienne and RigorHaas, 2008).
As part of the NPI campaigns, extensive snow thickness surveys were conducted during on-ice work in addition to the helicopter flights. Snow thickness was measured every 5 m along transects on the ice using a metal probe. In total, 969 and 2383 data points were collected during August 2010 and April-May 2011, respectively.
Both ice and snow thickness distributions were computed in the form of probability density functions (PDF) with a bin width of 0.1 and 0.05 m, respectively. The modal thicknesses given in Table 1 were then defined as the maxima of the ice thickness distributions. For the TIFAX flight on 22 August 2010, the maximum of the distribution is in the 0–0.2 m (open water/very thin ice) bin, whereas the true modal ice thickness is represented by a second local maximum at 1.4 m, which is the value included in Table 1.
The positions of the sea-ice edges during the surveys were derived from met.no (Norwegian Meteorological Institute) ice charts (available at http://met.no/Hav_og_is). The ice charts are produced daily except for weekends, and use high-resolution synthetic aperture radar (SAR) data from Envisat and RADARSAT-2 as well as visual and infrared data from the Moderate Resolution Imaging Spectroradiometer (MODIS) and other satellites when available. The charts include the following ice classes: open water (0–10% ice concentration), very open drift ice (10–40%), open drift ice (40–70%), close drift ice (70–90%), very close drift ice (90–100%) and fast ice. For the purpose of this study, we defined the ice edge as the boundary between the very open and the open drift ice at 40%. The distance of the ice thickness measurements from the ice edge was calculated using ice charts for the respective day of the flight. When flights took place during the weekend, the ice chart produced closest in time was used, i.e. the Friday chart for Saturday flights, and the Monday chart for Sunday flights. For analysis of the ice thickness versus latitude and distance from the ice edge, ice thicknesses were binned in 0.18 and 10km bins, respectively, and mean and modal thicknesses were calculated in those bins.
Results
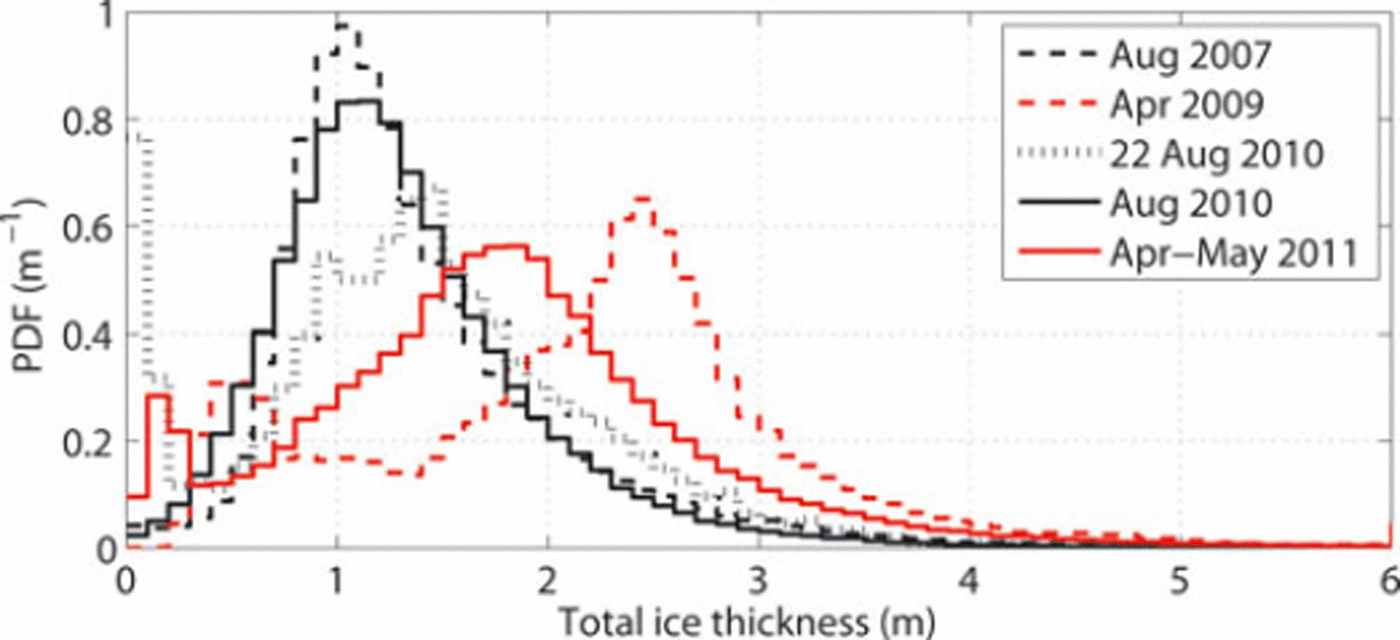
Sea-ice thicknesses north of Svalbard display distinct seasonal differences. During the spring campaigns in April 2009 and April–May 2011 (PAM-ARCMIP 2009 and KVS2011/ICE11-03), both mean and modal ice thicknesses are significantly larger than during the summer campaigns in August 2007 and 2010 (ARK-XXII/2, TIFAX 2010 and ICE2010; Table 1). The standard deviation of the mean ice thickness is generally low compared to Reference Haas, Hendricks, Eicken and HerberHaas and others (2010), which combined with the small means is due to the presence of first-year ice with mostly large, level and homogeneous floes. The seasonal signal is also visible in the ice thickness distributions (Fig. 2). During spring, the distributions are broader with larger modal thicknesses and, especially in spring 2011, a very wide peak. Ice-core data from the NPI spring cruises in 2011 show sea-ice salinities typical for first-year ice (unpublished data). The larger amount of thicker ice in the April 2009 distribution is related to the flight track as it reaches much further north than the flights in April–May 2011 and probably includes more second-year and multi-year ice (see also the thickness along the flight tracks in Fig. 1). In 2009 and 2011, local maxima in the distributions at around 0.2 and 0.5 m indicate the presence of young ice formation in refrozen leads. The thickness distributions from the summer campaigns show large overlaps. Despite the 3 year gap between the flights during ARK-XXII/2 and ICE2010 in August 2007 and 2010, respectively, both the modes and the shapes of the tails of the distributions (ice thicker than 2 m; Fig. 2) are nearly the same. The distributions are characteristic of first-year ice at the end of the melt season, with large coverage by melt ponds and little thick ice. The part of the TIFAX 2010 flight included in this study, however, is different, with a larger open water fraction, several local maxima in the distribution, and a higher modal thickness. This is likely due to the geographical location further west and close to the outflow region in Fram Strait, with more divergent ice motion and part of the ice observed originating from regions in the Transpolar Drift and being older.
Ice thickness distributions of all campaigns. Bin width is 0.1 m. Red lines indicate spring campaigns, black lines late-summer campaigns.
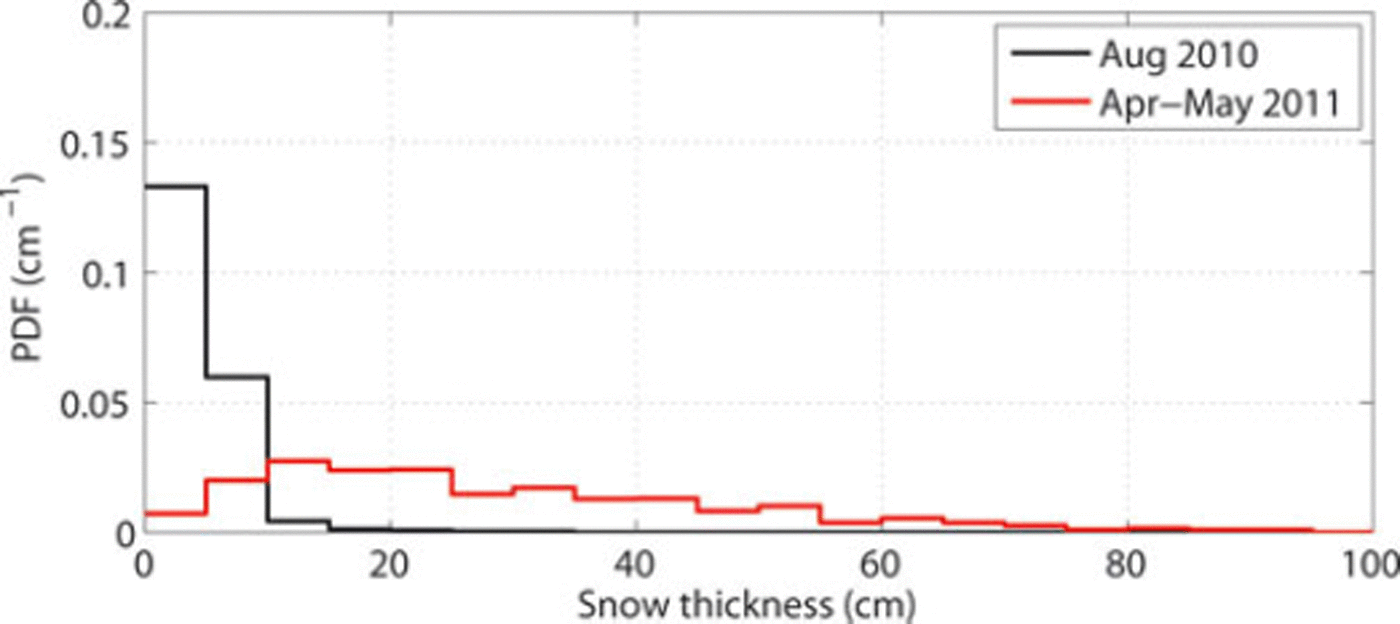
The snow cover varies a lot seasonally (Fig. 3). In spring 2011, snow depths ranged from as little as a few centimetres to >1 m, with high variability even within the area of a single floe (J. Haapala and others, unpublished information), leading to a broad peak in the distribution. The locally very large snow depth led to flooding of the ice floes and negative freeboards. In summer, however, the ice cover is nearly snow-free, with most of the snow either melted, drained or removed by wind or other processes. Snow pit observations during the on-ice work in summer 2010 showed the ice to be covered by a layer of deteriorated ice and a thin layer of snow after some snowfall during the cruise. Distinguishing between this fresh snow and deteriorated ice during snow thickness surveys using a metal probe is difficult, and the snow thickness data presented here do not differentiate between the two. Observations made in summer 2010 were less extensive than in spring 2011, but both spring and summer observations agree well with snow thickness data from other regions (Warren, 1999a; Reference Forsstrom, Gerland and PedersenForsstrom and others, 2011; Reference Gerland and HaasGerland and Haas, 2011). Mean snow thicknesses during summer 2010 and spring 2011 north of Svalbard were 2.4 and >32.3 cm, respectively (snow depths of >1m encountered in spring 2011 were recorded as >100 cm; therefore the average of all measurements is biased low). Reference WarrenWarren and others (1999) present climatological values of 36.93 and 4.64 cm for May and August, respectively, on multi-year ice at the North Pole, and Reference Forsstrom, Gerland and PedersenForsstrom and others (2011) found snow thickness on multi-year ice in Fram Strait to average 17.0 and 7.7 cm in May and August, respectively.
Snow thickness distributions measured during the NPI campaigns in August 2010 (ICE2010; black) and April–May 2011 (KVS2011 and ICE11-03; red). Bin width is 5cm.
SAR imagery provides further insights into the large-scale differences in the spring and summer ice cover (Fig. 4). In spring, the ice cover is continuous and homogeneous, with large connected floes and only few leads, and the ice edge is well defined (Fig. 4b). In summer, however, the ice cover is much more broken up, with separate floes visible on the SAR image, large leads and a fuzzy ice edge (Fig. 4a). This confirms the origin of the open water peaks in the summer ice thickness distributions (Fig. 2). The thickness profiles along the tracks flown during the respective days show similar variability in thickness on both days, independent of the position within the ice pack and distance from the ice edge.
Envisat Advanced SAR (ASAR) wide swath images from 22 August 2010 (a) and 2 May 2011 (b). The northern coast of Svalbard is visible on the right of each scene. Flight tracks from 22 August 2010 (a) and 30 April (b) are shown in red with selected ice thickness profiles along the tracks.

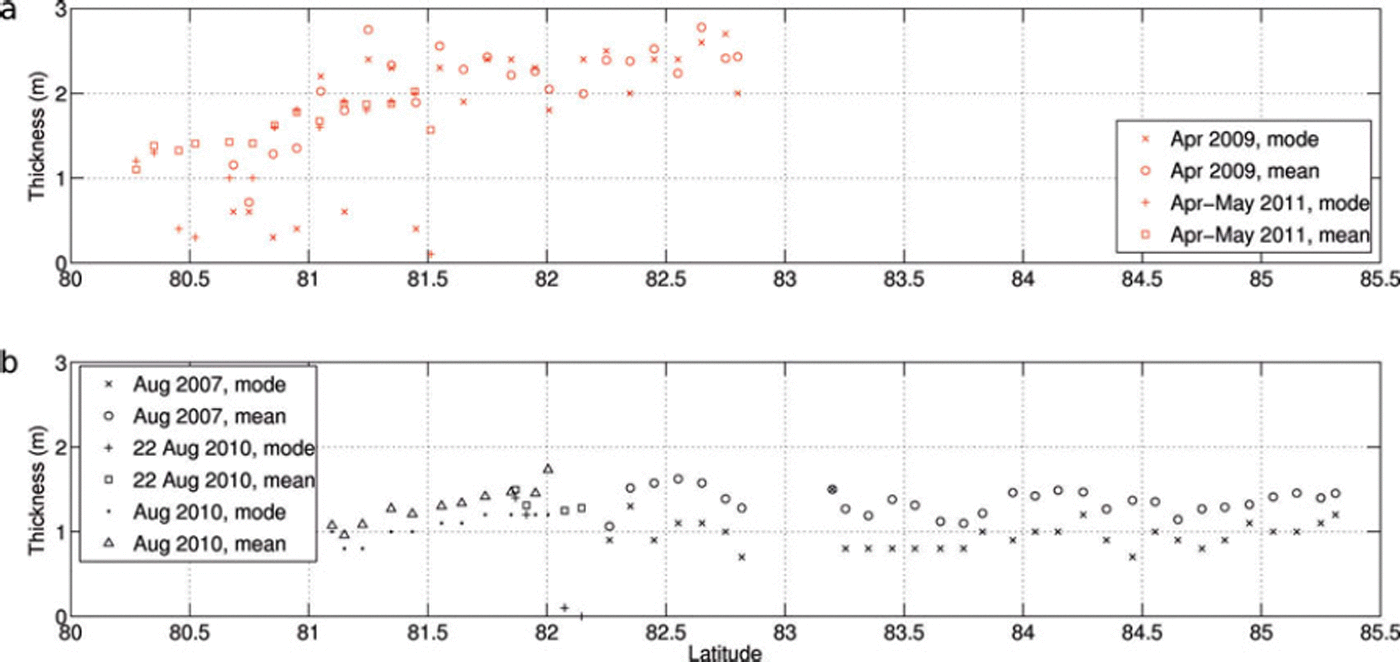
To investigate further the distribution of ice thickness within the inner ice pack (Fig. 1), we calculated the modal and mean ice thickness as functions of latitude (Fig. 5) and of distance from the ice edge (Fig. 6). The NPI and the AWI flight campaigns have very little spatial overlap. Due to the restricted reach of RV Lance, KV Svalbard and the helicopters on board, as well as combined multidisciplinary research activity during the cruises, the NPI flights took place mostly near the ice edge, whereas the AWI campaigns on board RV Polarstern and the Polar 5 aeroplane could reach farther north. Despite the additional temporal difference of campaigns taking place in different years, the thickness data in Figures 5 and 6 show nearly seamless transitions between the data points from the different campaigns.
Modal and mean ice thickness by latitude for (a) spring campaigns and (b) summer campaigns. Ice thicknesses were binned in latitudinal bins of 0.18 width for derivation of modal and mean thickness.
Modal and mean ice thickness by distance from the ice edge for (a) spring campaigns and (b) summer campaigns. Ice thicknesses were binned in distance bins of 10km width for derivation of modal and mean thickness.
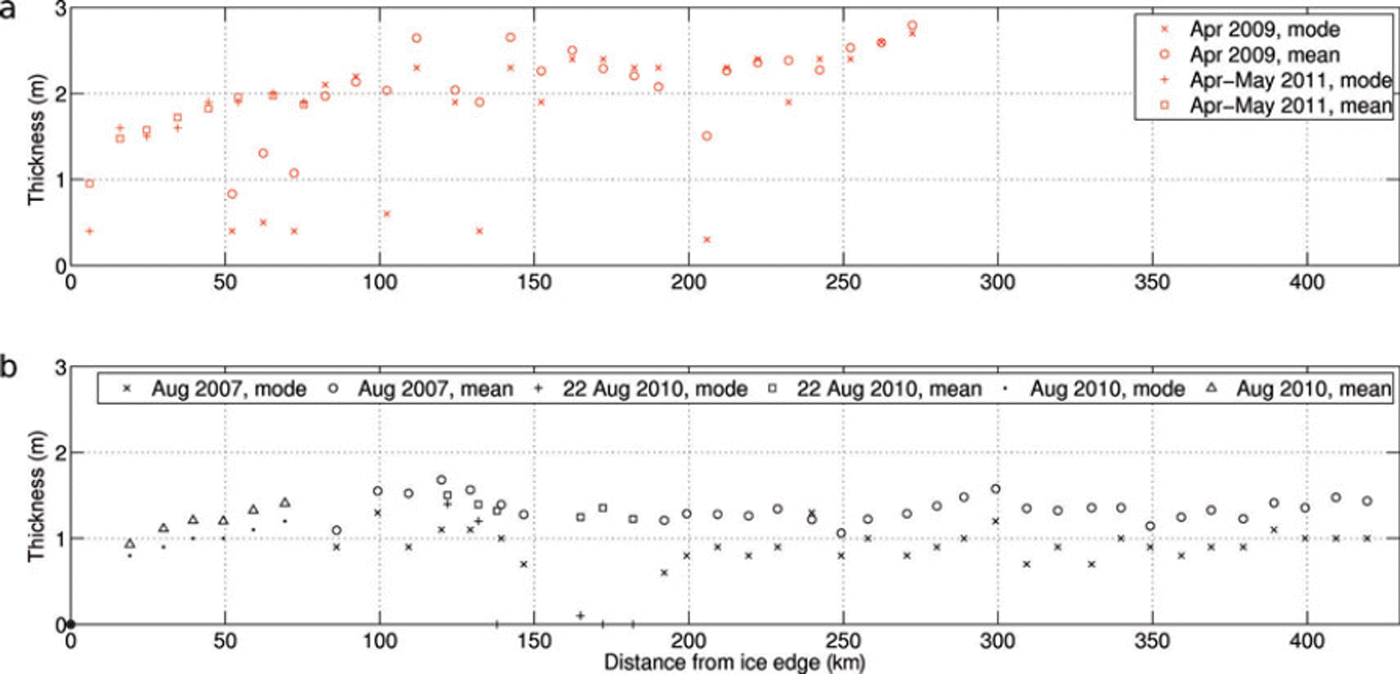
In spring, ice thicknesses increase both in mean and mode from 80.28 N to 81.38 N, and north of that remain variable but >2 m (Fig. 5). In general, mean and mode are mixed, without a clear pattern of one being higher than the other throughout, which hints at only a few ridges being present in the pack ice. In summer, mean and modal ice thicknesses increase from ∼81 8 N to 828 N, but north of that do not change much. Mode and mean are significantly different, and at almost all latitudes the mode is lower than the mean. The distribution of ice thickness relative to the distance to the ice edge displays a similar behaviour to that seen relative to the latitude (Fig. 6). In spring, the relationship is less obvious, with larger variability especially in the band 50–150 km from the edge. This is potentially due to shifts in ice edge positions following wind events in the period of the NPI cruises in spring 2011. In summer, however, differences between the distribution by latitude and by distance from the ice edge are negligible. Again, the transition between campaigns from different years is very smooth, suggesting good comparability of data collected in various years and little interannual variability of ice thickness in the region.
Discussion and Conclusions
The observations presented in this study were collected in different years over sea ice consisting of predominantly first-or second-year ice with only a few intrusions of older multi-year ice. While we found large seasonal differences in modal and mean ice thickness, the interannual variability was low and observations from the same season in different years could be combined. This suggests that the ice north of Svalbard is little influenced by ice evolution in previous years as would be expected for first-year ice. Instead, the region benefits from homogeneous conditions over a large area. Lack of physical barriers (e.g. islands or extended coastlines as in the Canadian Arctic) reduces dynamical processes such as ridging and rafting due to pressure against land or through narrow gaps. Little localized freshwater input from, for example, rivers (as in the Siberian Arctic), and almost constant oceanographic conditions over the deep Eurasian Basin of the Arctic Ocean allow for similar thermodynamic ice growth in the study area, as opposed to the continental slope around Svalbard where heat from inflowing Atlantic Water leads to decreased ice formation. These conditions allow us to combine observations from different years.
The surprisingly low interannual variability is potentially also a result of the longer-term changes in the Arctic. The earliest of the flights included in this study took place in late summer 2007, when large amounts of thick, old ice were exported through Fram Strait and a drop in ice thickness occurred in the North Pole region. The measurements conducted since then and presented here suggest that at least since 2007 the ice cover in the region north of Svalbard has not experienced large thickness changes between years.
The homogeneity of the ice pack in our study region results in mean and modal ice thicknesses that are almost independent of latitude or distance from the ice edge when north of approximately 82° N despite variable ice edge positions. In the region where ice thickness increases with increasing latitude (in the case of our observations, ∼80.2-82° N), the relationship is almost linear. This holds for both spring and summer. In general, the summer modal ice thickness is smaller than the mean, whereas there is no clear pattern in spring. This is a result of the composition of the ice cover, with different fractions of thin new ice, level ice and ridges in spring and summer. In two studies from before summer 2007, Reference Haas and EickenHaas and Eicken (2001) found clear linear gradients of modal ice thickness versus latitude in the Siberian Arctic from drillhole and ground-based EM measurements, and Reference WadhamsWadhams (1997) showed a similar gradient in ice draft in Fram Strait from submarine data. Reference Rabenstein, Hendricks, Martin, Pfaffhuber and HaasRabenstein and others (2010) use data from 2004 and 2007 (some of which are included in this study) and find a different gradient and a weaker correlation between ice thickness and latitude in Fram Strait than Reference WadhamsWadhams (1997), and only a slightly positive gradient across the central Arctic. They attribute the first to potentially younger ice further north towards the North Pole while old ice has been advected south in Fram Strait. The almost constant modal ice thickness away from the ice edge found in this study is another indicator of the trend towards younger ice over larger areas in the pack ice.
In line with previous studies, our observations demonstrated high intra-annual variability of snow thickness, and comparison with Reference Forsstrom, Gerland and PedersenForsstrom and others (2011) and Reference Gerland and HaasGerland and Haas (2011) indicates interannual and regional variability. Campaigns without any in situ or airborne snow measurements need to take this into account when processing and interpreting ice thickness observations. This is particularly important for measurement techniques that derive ice thickness from freeboard measurements. The dataset presented here is used together with results described in J. Haapala and others (unpublished information) for CryoSat-2 calibration and validation studies, aiming to contribute validation results for typical Arctic first-year ice. This paper has presented first results from the EM-bird data collected in the region north of Svalbard. Future work will investigate in more detail the relationship of sea-ice thickness, roughness and freeboard for first-year ice and implications for the Arctic ice cover, its development and current approaches to observing ice thickness.
Acknowledgements
We are grateful for the support provided by the crews and captains of RV Lance, KV Svalbard and RV Polarstern, the helicopter and Polar-5 crews and the many helpers on the sea ice. We thank Ola Brandt and Harvey Goodwin for extracting information on sea-ice edge positions from met.no sea-ice charts, and help with the SAR images. ESA Envisat ASAR data were obtained from Polarview. This study was supported financially by the Centre for Ice, Climate and Ecosystems at the NPI, the ‘Sea Ice in the Arctic Ocean, Technology and Systems of Agreements’ project of the Fram Centre, and the Norwegian Space Centre and ESA PRODEX project ‘CryoSat postlaunch validation study for sea ice’.



