


1 Introduction
Two main issues related to magnetic confinement fusion are the turbulent transport, and the dynamics of energetic particles (EP), produced by fusion reactions, or injected for heating purposes. Zonal (i.e. axisymmetric) electric fields are observed to interact with turbulence in tokamaks, in the form of zero-frequency zonal flows (ZF) (Hasegawa, Maclennan & Kodama Reference Hasegawa, Maclennan and Kodama1979; Rosenbluth & Hinton Reference Rosenbluth and Hinton1998; Diamond et al.
Reference Diamond, Itoh, Itoh and Hahm2005) and finite-frequency geodesic acoustic modes (GAM) (Winsor, Johnson & Dawson Reference Winsor, Johnson and Dawson1968; Zonca & Chen Reference Zonca and Chen2008). Geodesic acoustic modes, due to their finite frequency, can also interact with EP via inverse Landau damping, leading to EP-driven GAM (EGAM) given that EP drive is sufficient to overcome the threshold condition induced by GAM Landau damping and continuum damping (Fu Reference Fu2008; Qiu, Zonca & Chen Reference Qiu, Zonca and Chen2010, Reference Qiu, Zonca and Chen2011, Reference Qiu, Zonca and Chen2012; Zarzoso et al.
Reference Zarzoso, Garbet, Sarazin, Dumont and Grandgirard2012; Wang, Todo & Kim Reference Wang, Todo and Kim2013; Girardo et al.
Reference Girardo, Zarzoso, Dumont, Garbet, Sarazin and Sharapov2014; Miki & Idomura Reference Miki and Idomura2015; Wang et al.
Reference Wang, Todo, Ido and Osakabe2015; Qu, Hole & Fitzgerald Reference Qu, Hole and Fitzgerald2016; Sasaki et al.
Reference Sasaki, Kasuya, Itoh, Hallatschek, Lesur, Kosuga and Itoh2016, Reference Sasaki, Kasuya, Itoh, Kosuga, Lesur, Hallatschek and Itoh2017). The mechanism of EGAM excitation can be understood with the analogy to the well-known beam-plasma instability, where a supra-thermal electron beam interacts with a one-dimensional (1-D) plasma in a strong axial magnetic field, and the mode is driven unstable by inverse Landau damping (Berk & Zhou Reference Berk and Zhou2010; Qiu et al.
Reference Qiu, Zonca and Chen2011). The similarity lies in the low frequency ( $\unicode[STIX]{x1D714}\ll \unicode[STIX]{x1D6FA}_{i}$
, with
$\unicode[STIX]{x1D714}\ll \unicode[STIX]{x1D6FA}_{i}$
, with $\unicode[STIX]{x1D6FA}_{i}$
being the cyclotron frequency) and toroidally symmetric mode structure of the GAM, which leads to the conservation of
$\unicode[STIX]{x1D6FA}_{i}$
being the cyclotron frequency) and toroidally symmetric mode structure of the GAM, which leads to the conservation of $\unicode[STIX]{x1D707}$
and
$\unicode[STIX]{x1D707}$
and $P_{\unicode[STIX]{x1D719}}$
, i.e. respectively the magnetic momentum and the toroidal angular momentum. As a result, the EGAM dynamics is quasi-one-dimensional in (
$P_{\unicode[STIX]{x1D719}}$
, i.e. respectively the magnetic momentum and the toroidal angular momentum. As a result, the EGAM dynamics is quasi-one-dimensional in ( $J$
,
$J$
, $\unicode[STIX]{x1D703}$
) space (with
$\unicode[STIX]{x1D703}$
) space (with $J$
being here the action conjugate to the poloidal angle
$J$
being here the action conjugate to the poloidal angle $\unicode[STIX]{x1D703}$
). This quasi-1-D feature of the EGAM determines not only the linear excitation, but also the nonlinear dynamics. Understanding the dynamics of EGAMs is crucial due to their interaction with turbulence, which can modify the turbulent transport (Zarzoso et al.
Reference Zarzoso, Sarazin, Garbet, Dumont, Strugarek, Abiteboul, Cartier-Michaud, Dif-Pradalier, Ghendrih and Grandgirard2013, Reference Zarzoso, Migliano, Grandgirard, Latu and Passeron2017). Moreover, a strong nonlinear interaction of EGAM with EP is observed in tokamaks (Lauber Reference Lauber2014; Horváth et al.
Reference Horváth, Papp, Lauber, Por, Gude, Igochine, Geiger, Maraschek, Guimarais and Nikolaeva2016), leading potentially to a strong redistribution of the EP in phase space.
$\unicode[STIX]{x1D703}$
). This quasi-1-D feature of the EGAM determines not only the linear excitation, but also the nonlinear dynamics. Understanding the dynamics of EGAMs is crucial due to their interaction with turbulence, which can modify the turbulent transport (Zarzoso et al.
Reference Zarzoso, Sarazin, Garbet, Dumont, Strugarek, Abiteboul, Cartier-Michaud, Dif-Pradalier, Ghendrih and Grandgirard2013, Reference Zarzoso, Migliano, Grandgirard, Latu and Passeron2017). Moreover, a strong nonlinear interaction of EGAM with EP is observed in tokamaks (Lauber Reference Lauber2014; Horváth et al.
Reference Horváth, Papp, Lauber, Por, Gude, Igochine, Geiger, Maraschek, Guimarais and Nikolaeva2016), leading potentially to a strong redistribution of the EP in phase space.
In order to predict the importance of the interaction of EGAMs with turbulence and with EP, it is important to understand their nonlinear saturation mechanisms. One of the reasons of saturation for EGAMs is the wave–particle nonlinear interaction. In this case, the saturation occurs due to the EP nonlinear redistribution in phase space, and the consequent decrease of the energy exchange between the EP and the EGAM. The wave–particle nonlinear dynamics of EGAMs has been investigated analytically in the framework of the gyrokinetic (GK) theory in Qiu et al. (Reference Qiu, Zonca and Chen2011), where the analogy with the beam-plasma instability has been pointed out, and numerically with the hybrid MHD-GK code MEGA in Wang et al. (Reference Wang, Todo and Kim2013), where in particular the frequency chirping due to the creation of structures in the EP phase space has been studied. Another possible reason of EGAM saturation is the wave–wave coupling. This can occur for an EGAM interacting with another EGAM and generating zonal sidebands, or for an EGAM with non-zonal modes, e.g. turbulence. The wave–wave nonlinear dynamics of EGAMs has been studied analytically in Qiu et al. (Reference Qiu, Chavdarovski, Biancalani and Cao2017), focusing in particular on the EGAM self-coupling. Numerical investigations of the dynamics of EGAMs with wave–particle and wave–wave nonlinearities have been carried out with the hybrid MHD-GK code MEGA (Ido et al. Reference Ido, Itoh, Osakabe, Lesur, Shimizu, Ogawa, Toi, Nishiura, Kato and Sasaki2016), with a reduced 1-D model solved with the code COBBLES (Lesur et al. Reference Lesur, Itoh, Ido, Osakabe, Ogawa, Shimizu, Sasaki, Ida, Inagaki and Itoh2016) and with the GK semi-Lagrangian code GYSELA (Zarzoso et al. Reference Zarzoso, Garbet, Sarazin, Dumont and Grandgirard2012) in the absence of turbulence, and with GYSELA in the presence of turbulence (Zarzoso et al. Reference Zarzoso, Sarazin, Garbet, Dumont, Strugarek, Abiteboul, Cartier-Michaud, Dif-Pradalier, Ghendrih and Grandgirard2013). Although much has been understood on the linear and nonlinear dynamics of EGAMs, thanks to the abovementioned studies, nevertheless, to the present day no theory exists to predict the EGAM saturation level. This study, in the regime of a dominant wave–particle nonlinearity, is the goal of this paper.
The nonlinear saturation of EGAMs is investigated here by means of electrostatic simulations with the gyrokinetic particle-in-cell code ORB5 (Jolliet et al. Reference Jolliet, Bottino, Angelino, Hatzky, Tran, Mcmillan, Sauter, Appert, Idomura and Villard2007; Bottino et al. Reference Bottino, Vernay, Scott, Brunner, Hatzky, Jolliet, McMillan, Tran and Villard2011; Bottino & Sonnendrücker Reference Bottino and Sonnendrücker2015). ORB5 has been successfully verified against analytical theory and benchmarked against other gyrokinetic codes, for the linear dynamics of GAMs (Biancalani et al. Reference Biancalani, Bottino, Ehrlacher, Grandgirard, Merlo, Novikau, Qiu, Sonnendrücker, Garbet and Görler2017), and EGAMs (Biancalani et al. Reference Biancalani, Bottino, Lauber and Zarzoso2014; Zarzoso et al. Reference Zarzoso, Biancalani, Bottino, Lauber, Poli, Girardo, Garbet and Dumont2014). A detailed comparison with the beam-plasma instability (BPI) (O’Neil Reference O’Neil1965; O’Neil & Malmberg Reference O’Neil and Malmberg1968) in a 1-D uniform plasma is also done, following the scheme anticipated in Qiu et al. (Reference Qiu, Zonca and Chen2011), Qiu, Chen & Zonca (Reference Qiu, Chen and Zonca2014). Similarly to the BPI, the saturation level of EGAM is shown to scale quadratically with the linear growth rate. A similar investigation was also previously done for Alfvén modes (see, for example, Briguglio et al. (Reference Briguglio, Wang, Zonca, Vlad, Fogaccia, Di Troia and Fusco2014)). As a main result of these considerations, we provide here the theoretical prescription for the quantitative prediction of the EGAM saturation level. The EGAM frequency is also studied, and shown to evolve in time when approaching the saturation, like the BPI (see, for example, Morales & O’Neil (Reference Morales and O’Neil1972), Armon & Friedland (Reference Armon and Friedland2016)). The chirping rate is observed to become of the order of magnitude of the square of the EP bounce frequency near the saturation. This denotes a transition from adiabatic to non-adiabatic regimes. The importance of understanding whether the EGAM nonlinear dynamics is adiabatic or non-adiabatic is linked to the underlying mechanisms of the saturation, i.e. whether the saturation is accessed through the local flattening of particle distribution in the resonance region due to wave–particle trapping (Qiu et al. Reference Qiu, Zonca and Chen2011) or through the avalanches of phase space mode structures (Zonca et al. Reference Zonca, Chen, Briguglio, Fogaccia, Vlad and Wang2015) due to the feedback of EP distribution and mode structure in phase space.
The paper is organized as follows. The adopted gyrokinetic model is described in § 2, and the equilibrium and case definition in § 3. The linear dynamics is described in § 4. The saturation levels are investigated in § 5. The regimes of different adiabaticity are investigated by means of the analysis of the frequency, in § 6. Finally, a summary of the results is given in § 7.
2 The model
The main damping mechanism of GAM and EGAM is the Landau damping, which makes the use of a kinetic model necessary. In this paper we use the global gyrokinetic particle-in-cell code ORB5 (Jolliet et al. Reference Jolliet, Bottino, Angelino, Hatzky, Tran, Mcmillan, Sauter, Appert, Idomura and Villard2007). ORB5 was originally developed for electrostatic ITG turbulence studies, and recently extended to its multi-species electromagnetic version in the framework of the NEMORB project (Bottino et al. Reference Bottino, Vernay, Scott, Brunner, Hatzky, Jolliet, McMillan, Tran and Villard2011; Bottino & Sonnendrücker Reference Bottino and Sonnendrücker2015). In this paper, collisionless electrostatic simulations are considered.
The model equations of the electrostatic version of ORB5 is made by the trajectories of the markers, and by the gyrokinetic Poisson law for the scalar potential $\unicode[STIX]{x1D719}$
. These equations are derived in a Lagrangian formulation (Bottino & Sonnendrücker Reference Bottino and Sonnendrücker2015), based on the gyrokinetic Vlasov–Maxwell equations of Sugama, Brizard and Hahm (Sugama Reference Sugama2000; Brizard & Hahm Reference Brizard and Hahm2007). The equations for the marker trajectories (in the electrostatic version of the code) are (Bottino & Sonnendrücker Reference Bottino and Sonnendrücker2015):
$\unicode[STIX]{x1D719}$
. These equations are derived in a Lagrangian formulation (Bottino & Sonnendrücker Reference Bottino and Sonnendrücker2015), based on the gyrokinetic Vlasov–Maxwell equations of Sugama, Brizard and Hahm (Sugama Reference Sugama2000; Brizard & Hahm Reference Brizard and Hahm2007). The equations for the marker trajectories (in the electrostatic version of the code) are (Bottino & Sonnendrücker Reference Bottino and Sonnendrücker2015):
 $$\begin{eqnarray}\displaystyle & \displaystyle \dot{\boldsymbol{R}}=\frac{1}{m_{s}}p_{\Vert }\frac{\boldsymbol{B}^{\ast }}{B_{\Vert }^{\ast }}+\frac{c}{q_{s}B_{\Vert }^{\ast }}\boldsymbol{b}\times [\unicode[STIX]{x1D707}\unicode[STIX]{x1D735}B+q_{s}\unicode[STIX]{x1D735}\tilde{\unicode[STIX]{x1D719}}] & \displaystyle\end{eqnarray}$$
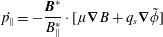 $$\begin{eqnarray}\displaystyle & \displaystyle \dot{p_{\Vert }}=-\frac{\boldsymbol{B}^{\ast }}{B_{\Vert }^{\ast }}\cdot [\unicode[STIX]{x1D707}\unicode[STIX]{x1D735}B+q_{s}\unicode[STIX]{x1D735}\tilde{\unicode[STIX]{x1D719}}] & \displaystyle\end{eqnarray}$$
 $$\begin{eqnarray}\displaystyle & \displaystyle \dot{\unicode[STIX]{x1D707}}=0. & \displaystyle\end{eqnarray}$$
The coordinates used for the phase space are $(\boldsymbol{R},p_{\Vert },\unicode[STIX]{x1D707})$
, i.e. respectively the gyrocentre position, canonical parallel momentum
$(\boldsymbol{R},p_{\Vert },\unicode[STIX]{x1D707})$
, i.e. respectively the gyrocentre position, canonical parallel momentum $p_{\Vert }=m_{s}v_{\Vert }$
and magnetic momentum
$p_{\Vert }=m_{s}v_{\Vert }$
and magnetic momentum $\unicode[STIX]{x1D707}=m_{s}v_{\bot }^{2}/(2B)$
(with
$\unicode[STIX]{x1D707}=m_{s}v_{\bot }^{2}/(2B)$
(with $m_{s}$
and
$m_{s}$
and $q_{s}$
being the mass and charge of the species).
$q_{s}$
being the mass and charge of the species). $v_{\Vert }$
and
$v_{\Vert }$
and $v_{\bot }$
are respectively the parallel and perpendicular component of the particle velocity. The gyroaverage operator is labelled here by the tilde symbol
$v_{\bot }$
are respectively the parallel and perpendicular component of the particle velocity. The gyroaverage operator is labelled here by the tilde symbol $\tilde{\text{}}$
.
$\tilde{\text{}}$
. $\boldsymbol{B}^{\ast }=\boldsymbol{B}+(c/q_{s})\unicode[STIX]{x1D735}\times (\boldsymbol{b}p_{\Vert })$
, where
$\boldsymbol{B}^{\ast }=\boldsymbol{B}+(c/q_{s})\unicode[STIX]{x1D735}\times (\boldsymbol{b}p_{\Vert })$
, where $\boldsymbol{B}$
and
$\boldsymbol{B}$
and $\boldsymbol{b}$
are the equilibrium magnetic field and magnetic unitary vector.
$\boldsymbol{b}$
are the equilibrium magnetic field and magnetic unitary vector.
Kinetic effects of the electrons are neglected. This is done by calculating the electron gyrocentre density directly from the value of the scalar potential as (Bottino & Sonnendrücker Reference Bottino and Sonnendrücker2015):
 $$\begin{eqnarray}n_{e}(\boldsymbol{R},t)=n_{e0}+\frac{q_{s}n_{e0}}{T_{e0}}(\unicode[STIX]{x1D719}-\bar{\unicode[STIX]{x1D719}}),\end{eqnarray}$$
where $\bar{\unicode[STIX]{x1D719}}$
is the flux-surface averaged potential, instead of treating the electrons with markers evolved with (2.1)–(2.3).
$\bar{\unicode[STIX]{x1D719}}$
is the flux-surface averaged potential, instead of treating the electrons with markers evolved with (2.1)–(2.3).
We focus on the dynamics of zonal perturbations, by filtering out all non-zonal components (this is to avoid interactions of zonal/non-zonal modes). Wave–wave coupling is neglected, by evolving the bulk ion and electron markers along unperturbed trajectories. This means that, in (2.1)–(2.3) for the bulk ions, the last terms, proportional to the EGAM electric field, are dropped. The nonlinear wave–particle dynamics is studied by evolving the EP markers along the trajectories which include perturbed terms associated with the EGAM electric field. This means that the EP markers are evolved with (2.1)–(2.3) where the terms proportional to the EGAM electric field are retained.
The gyrokinetic Poisson equation is (Bottino & Sonnendrücker Reference Bottino and Sonnendrücker2015):
 $$\begin{eqnarray}-\unicode[STIX]{x1D735}\boldsymbol{\cdot }\frac{n_{0}m_{i}c^{2}}{B^{2}}\unicode[STIX]{x1D735}_{\bot }\unicode[STIX]{x1D719}=\mathop{\sum }_{s\neq e}\int \text{d}Wq_{s}\tilde{\unicode[STIX]{x1D6FF}f_{s}}-n_{e}(\boldsymbol{R},t),\end{eqnarray}$$
with $n_{0}m_{i}$
being here the total plasma mass density (approximated as the ion mass density). The summation over the species is performed for the bulk ions and for the EP, whereas the electron contribution is given by
$n_{0}m_{i}$
being here the total plasma mass density (approximated as the ion mass density). The summation over the species is performed for the bulk ions and for the EP, whereas the electron contribution is given by $-n_{e}(\boldsymbol{R},t)$
. Here
$-n_{e}(\boldsymbol{R},t)$
. Here $\unicode[STIX]{x1D6FF}f=f-f_{0}$
is the gyrocentre perturbed distribution function, with
$\unicode[STIX]{x1D6FF}f=f-f_{0}$
is the gyrocentre perturbed distribution function, with $f$
and
$f$
and $f_{0}$
being the total and equilibrium (i.e. independent of time, assumed here to be a Maxwellian) gyrocentre distribution functions. The integrals are over the phase space volume, with
$f_{0}$
being the total and equilibrium (i.e. independent of time, assumed here to be a Maxwellian) gyrocentre distribution functions. The integrals are over the phase space volume, with $\text{d}W=(2\unicode[STIX]{x03C0}/m_{i}^{2})B_{\Vert }^{\ast }\text{d}p_{\Vert }\text{d}\unicode[STIX]{x1D707}$
being the velocity–space infinitesimal volume element.
$\text{d}W=(2\unicode[STIX]{x03C0}/m_{i}^{2})B_{\Vert }^{\ast }\text{d}p_{\Vert }\text{d}\unicode[STIX]{x1D707}$
being the velocity–space infinitesimal volume element.
3 Equilibrium and simulation parameters
The tokamak magnetic equilibrium is defined by a major and minor radii of $R_{0}=1~\text{m}$
and
$R_{0}=1~\text{m}$
and $a=0.3125~\text{m}$
, a magnetic field on axis of
$a=0.3125~\text{m}$
, a magnetic field on axis of $B_{0}=1.9~\text{T}$
, a flat safety factor radial profile, with
$B_{0}=1.9~\text{T}$
, a flat safety factor radial profile, with $q=2$
, and circular flux surfaces (with no Grad–Shafranov shift). Flat temperature and density profiles are considered at the equilibrium for all species. The bulk plasma temperature is defined by
$q=2$
, and circular flux surfaces (with no Grad–Shafranov shift). Flat temperature and density profiles are considered at the equilibrium for all species. The bulk plasma temperature is defined by $\unicode[STIX]{x1D70C}^{\ast }=\unicode[STIX]{x1D70C}_{s}/a$
, with
$\unicode[STIX]{x1D70C}^{\ast }=\unicode[STIX]{x1D70C}_{s}/a$
, with $\unicode[STIX]{x1D70C}_{s}=c_{s}/\unicode[STIX]{x1D6FA}_{i}$
, with
$\unicode[STIX]{x1D70C}_{s}=c_{s}/\unicode[STIX]{x1D6FA}_{i}$
, with $c_{s}=\sqrt{T_{e}/m_{i}}$
being the sound speed. Three increasing values of bulk plasma temperature are considered, for investigating the dependence of our results on the Landau damping, corresponding to:
$c_{s}=\sqrt{T_{e}/m_{i}}$
being the sound speed. Three increasing values of bulk plasma temperature are considered, for investigating the dependence of our results on the Landau damping, corresponding to: $\unicode[STIX]{x1D70C}_{1}^{\ast }=1/256=0.0039$
,
$\unicode[STIX]{x1D70C}_{1}^{\ast }=1/256=0.0039$
, $\unicode[STIX]{x1D70C}_{2}^{\ast }=1/128=0.0078$
and
$\unicode[STIX]{x1D70C}_{2}^{\ast }=1/128=0.0078$
and $\unicode[STIX]{x1D70C}_{3}^{\ast }=1/64=0.0156$
(
$\unicode[STIX]{x1D70C}_{3}^{\ast }=1/64=0.0156$
( $\unicode[STIX]{x1D70F}_{e}=T_{e}/T_{i}=1$
for all cases described in this paper).
$\unicode[STIX]{x1D70F}_{e}=T_{e}/T_{i}=1$
for all cases described in this paper).
All parameters defined so far, are adopted by ORB5 with no consideration of the mass of the bulk ion species. The choice of the bulk ion mass is done only during the post-processing of the results of ORB5, if we need to know the values of equilibrium or perturbed quantities in non-normalized units. In particular, in the case of a hydrogen plasma, we get a value of the ion cyclotron frequency of $\unicode[STIX]{x1D6FA}_{i}=1.82\times 10^{8}~\text{rad}~\text{s}^{-1}$
. With this choice of bulk species, we can calculate the plasma temperature and sound frequency. The three values of plasma temperature are
$\unicode[STIX]{x1D6FA}_{i}=1.82\times 10^{8}~\text{rad}~\text{s}^{-1}$
. With this choice of bulk species, we can calculate the plasma temperature and sound frequency. The three values of plasma temperature are $T_{i1}=515~\text{eV}$
,
$T_{i1}=515~\text{eV}$
, $T_{i2}=2060~\text{eV}$
and
$T_{i2}=2060~\text{eV}$
and $T_{i3}=8240~\text{eV}$
. The sound frequency is defined as
$T_{i3}=8240~\text{eV}$
. The sound frequency is defined as $\unicode[STIX]{x1D714}_{s}=2^{1/2}v_{\text{ti}}/R$
(with
$\unicode[STIX]{x1D714}_{s}=2^{1/2}v_{\text{ti}}/R$
(with $v_{\text{ti}}=\sqrt{T_{i}/m_{i}}$
, which for
$v_{\text{ti}}=\sqrt{T_{i}/m_{i}}$
, which for $\unicode[STIX]{x1D70F}_{e}=1$
reads
$\unicode[STIX]{x1D70F}_{e}=1$
reads $v_{\text{ti}}=c_{s}$
). We obtain the following three values of the sound velocity:
$v_{\text{ti}}=c_{s}$
). We obtain the following three values of the sound velocity: $c_{s1}=2.22\times 10^{5}~\text{m}~\text{s}^{-1}$
,
$c_{s1}=2.22\times 10^{5}~\text{m}~\text{s}^{-1}$
, $c_{s2}=4.44\times 10^{5}~\text{m}~\text{s}^{-1}$
,
$c_{s2}=4.44\times 10^{5}~\text{m}~\text{s}^{-1}$
, $c_{s3}=8.88\times 10^{5}~\text{m}~\text{s}^{-1}$
. These correspond to the following three values of the sound frequency:
$c_{s3}=8.88\times 10^{5}~\text{m}~\text{s}^{-1}$
. These correspond to the following three values of the sound frequency: $\unicode[STIX]{x1D714}_{s1}=3.14\times 10^{5}~\text{rad}~\text{s}^{-1}$
,
$\unicode[STIX]{x1D714}_{s1}=3.14\times 10^{5}~\text{rad}~\text{s}^{-1}$
, $\unicode[STIX]{x1D714}_{s2}=6.28\times 10^{5}~\text{rad}~\text{s}^{-1}$
and
$\unicode[STIX]{x1D714}_{s2}=6.28\times 10^{5}~\text{rad}~\text{s}^{-1}$
and $\unicode[STIX]{x1D714}_{s3}=1.25\times 10^{6}~\text{rad}~\text{s}^{-1}$
.
$\unicode[STIX]{x1D714}_{s3}=1.25\times 10^{6}~\text{rad}~\text{s}^{-1}$
.
Initial EP distribution function for a simulation with $n_{\text{EP}}/n_{i}=0.12$
,
$n_{\text{EP}}/n_{i}=0.12$
, $v_{\text{bump}}/v_{\text{ti}}=4$
.
$v_{\text{bump}}/v_{\text{ti}}=4$
.
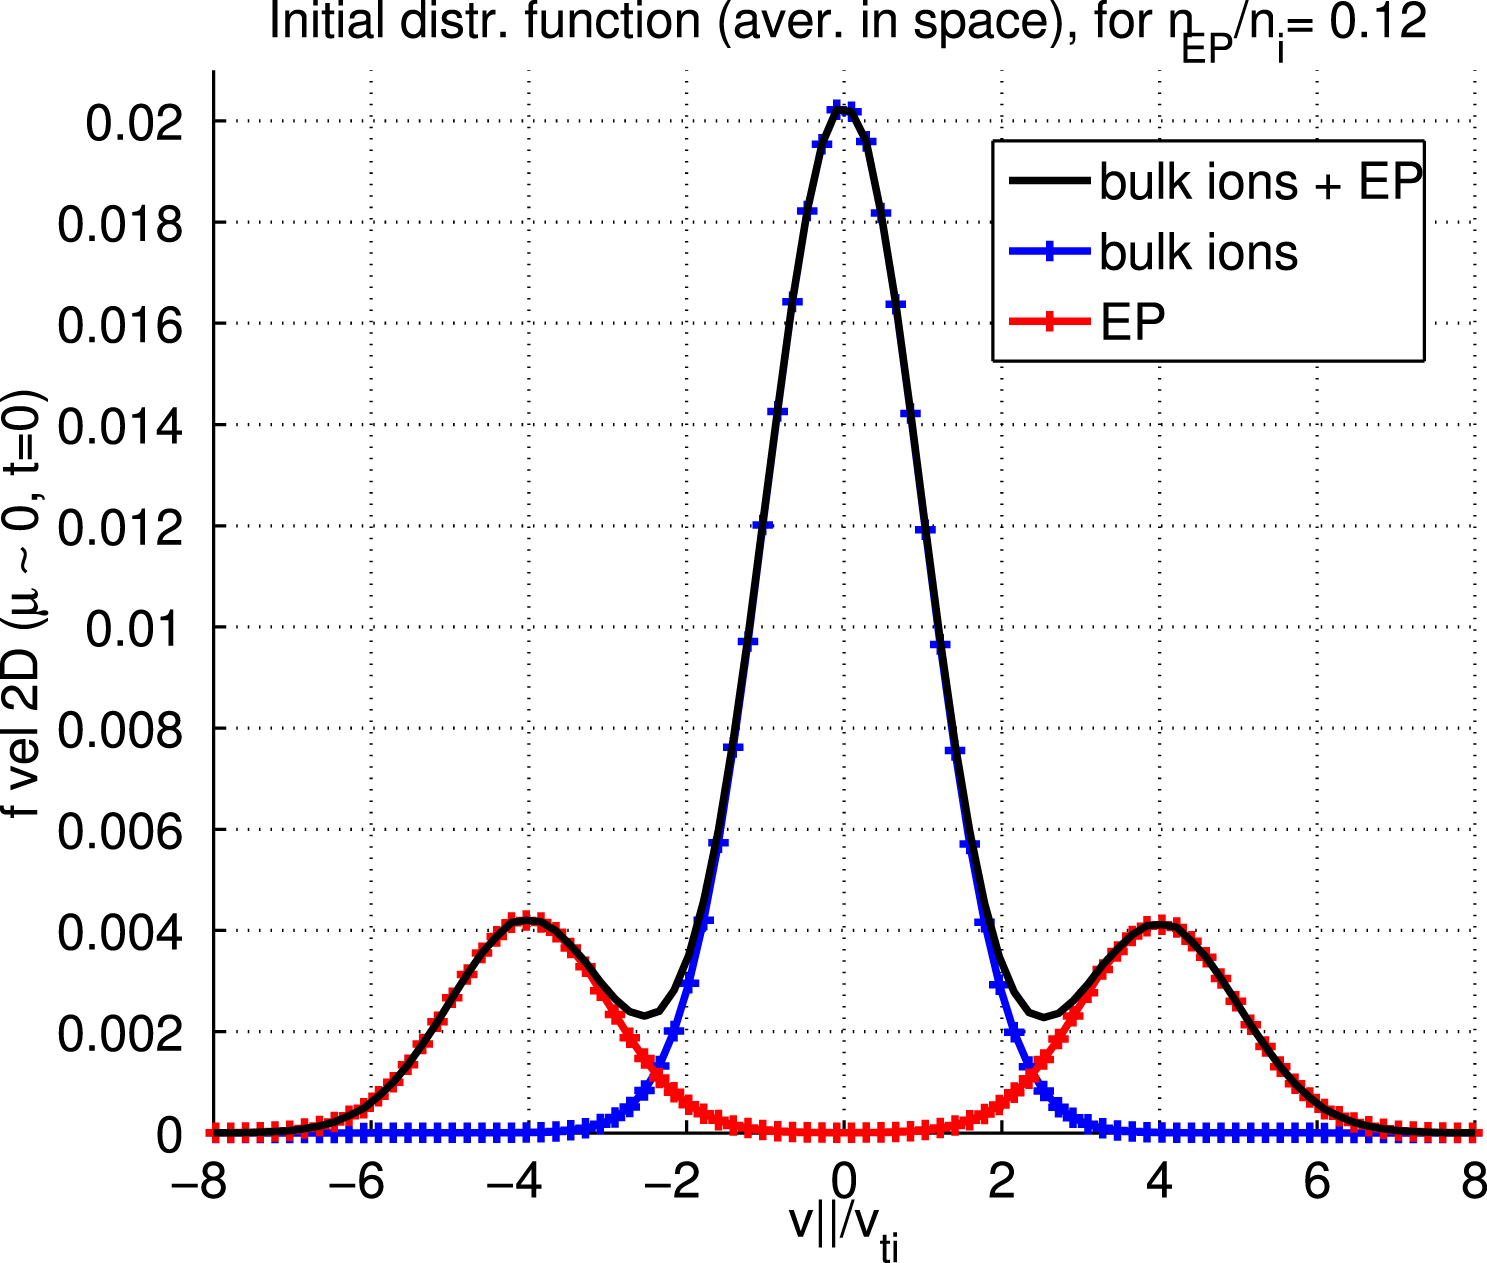
The energetic particle distribution function is a double bump-on-tail, with two bumps at $v_{\Vert }=\pm v_{\text{bump}}$
(see figure 1), as in Biancalani et al. (Reference Biancalani, Bottino, Lauber and Zarzoso2014). In this paper,
$v_{\Vert }=\pm v_{\text{bump}}$
(see figure 1), as in Biancalani et al. (Reference Biancalani, Bottino, Lauber and Zarzoso2014). In this paper, $v_{\text{bump}}=4v_{\text{ti}}$
is chosen. In order to initialize a distribution function which is function of constants of motion only, the modified variable
$v_{\text{bump}}=4v_{\text{ti}}$
is chosen. In order to initialize a distribution function which is function of constants of motion only, the modified variable $\tilde{v}_{\Vert }=\sqrt{2(E-\unicode[STIX]{x1D707}B_{\max })/m/v_{\text{ti}}}$
is used instead of
$\tilde{v}_{\Vert }=\sqrt{2(E-\unicode[STIX]{x1D707}B_{\max })/m/v_{\text{ti}}}$
is used instead of $v_{\Vert }=\sqrt{2(E-\unicode[STIX]{x1D707}B(r,\unicode[STIX]{x1D703}))/m/v_{\text{ti}}}$
(similarly to Zarzoso et al. (Reference Zarzoso, Garbet, Sarazin, Dumont and Grandgirard2012), Biancalani et al. (Reference Biancalani, Bottino, Lauber and Zarzoso2014), Zarzoso et al. (Reference Zarzoso, Biancalani, Bottino, Lauber, Poli, Girardo, Garbet and Dumont2014)). Neumann and Dirichlet boundary conditions are imposed to the scalar potential, respectively at the inner and outer boundaries,
$v_{\Vert }=\sqrt{2(E-\unicode[STIX]{x1D707}B(r,\unicode[STIX]{x1D703}))/m/v_{\text{ti}}}$
(similarly to Zarzoso et al. (Reference Zarzoso, Garbet, Sarazin, Dumont and Grandgirard2012), Biancalani et al. (Reference Biancalani, Bottino, Lauber and Zarzoso2014), Zarzoso et al. (Reference Zarzoso, Biancalani, Bottino, Lauber, Poli, Girardo, Garbet and Dumont2014)). Neumann and Dirichlet boundary conditions are imposed to the scalar potential, respectively at the inner and outer boundaries, $s=0$
and
$s=0$
and $s=1$
.
$s=1$
.
4 Linear dynamics
The linear dynamics of EGAMs in an equilibrium similar to the one considered in § 3, has been investigated in Zarzoso et al. (Reference Zarzoso, Biancalani, Bottino, Lauber, Poli, Girardo, Garbet and Dumont2014) for a bulk plasma temperature given by $\unicode[STIX]{x1D70C}^{\ast }=1/64=0.0156$
, by means of ORB5 simulations and analytical theory. A scan on the EP concentration is performed here, similarly to what was done in Zarzoso et al. (Reference Zarzoso, Biancalani, Bottino, Lauber, Poli, Girardo, Garbet and Dumont2014), but with three different values of bulk plasma temperature, corresponding to three different values of
$\unicode[STIX]{x1D70C}^{\ast }=1/64=0.0156$
, by means of ORB5 simulations and analytical theory. A scan on the EP concentration is performed here, similarly to what was done in Zarzoso et al. (Reference Zarzoso, Biancalani, Bottino, Lauber, Poli, Girardo, Garbet and Dumont2014), but with three different values of bulk plasma temperature, corresponding to three different values of $\unicode[STIX]{x1D70C}^{\ast }$
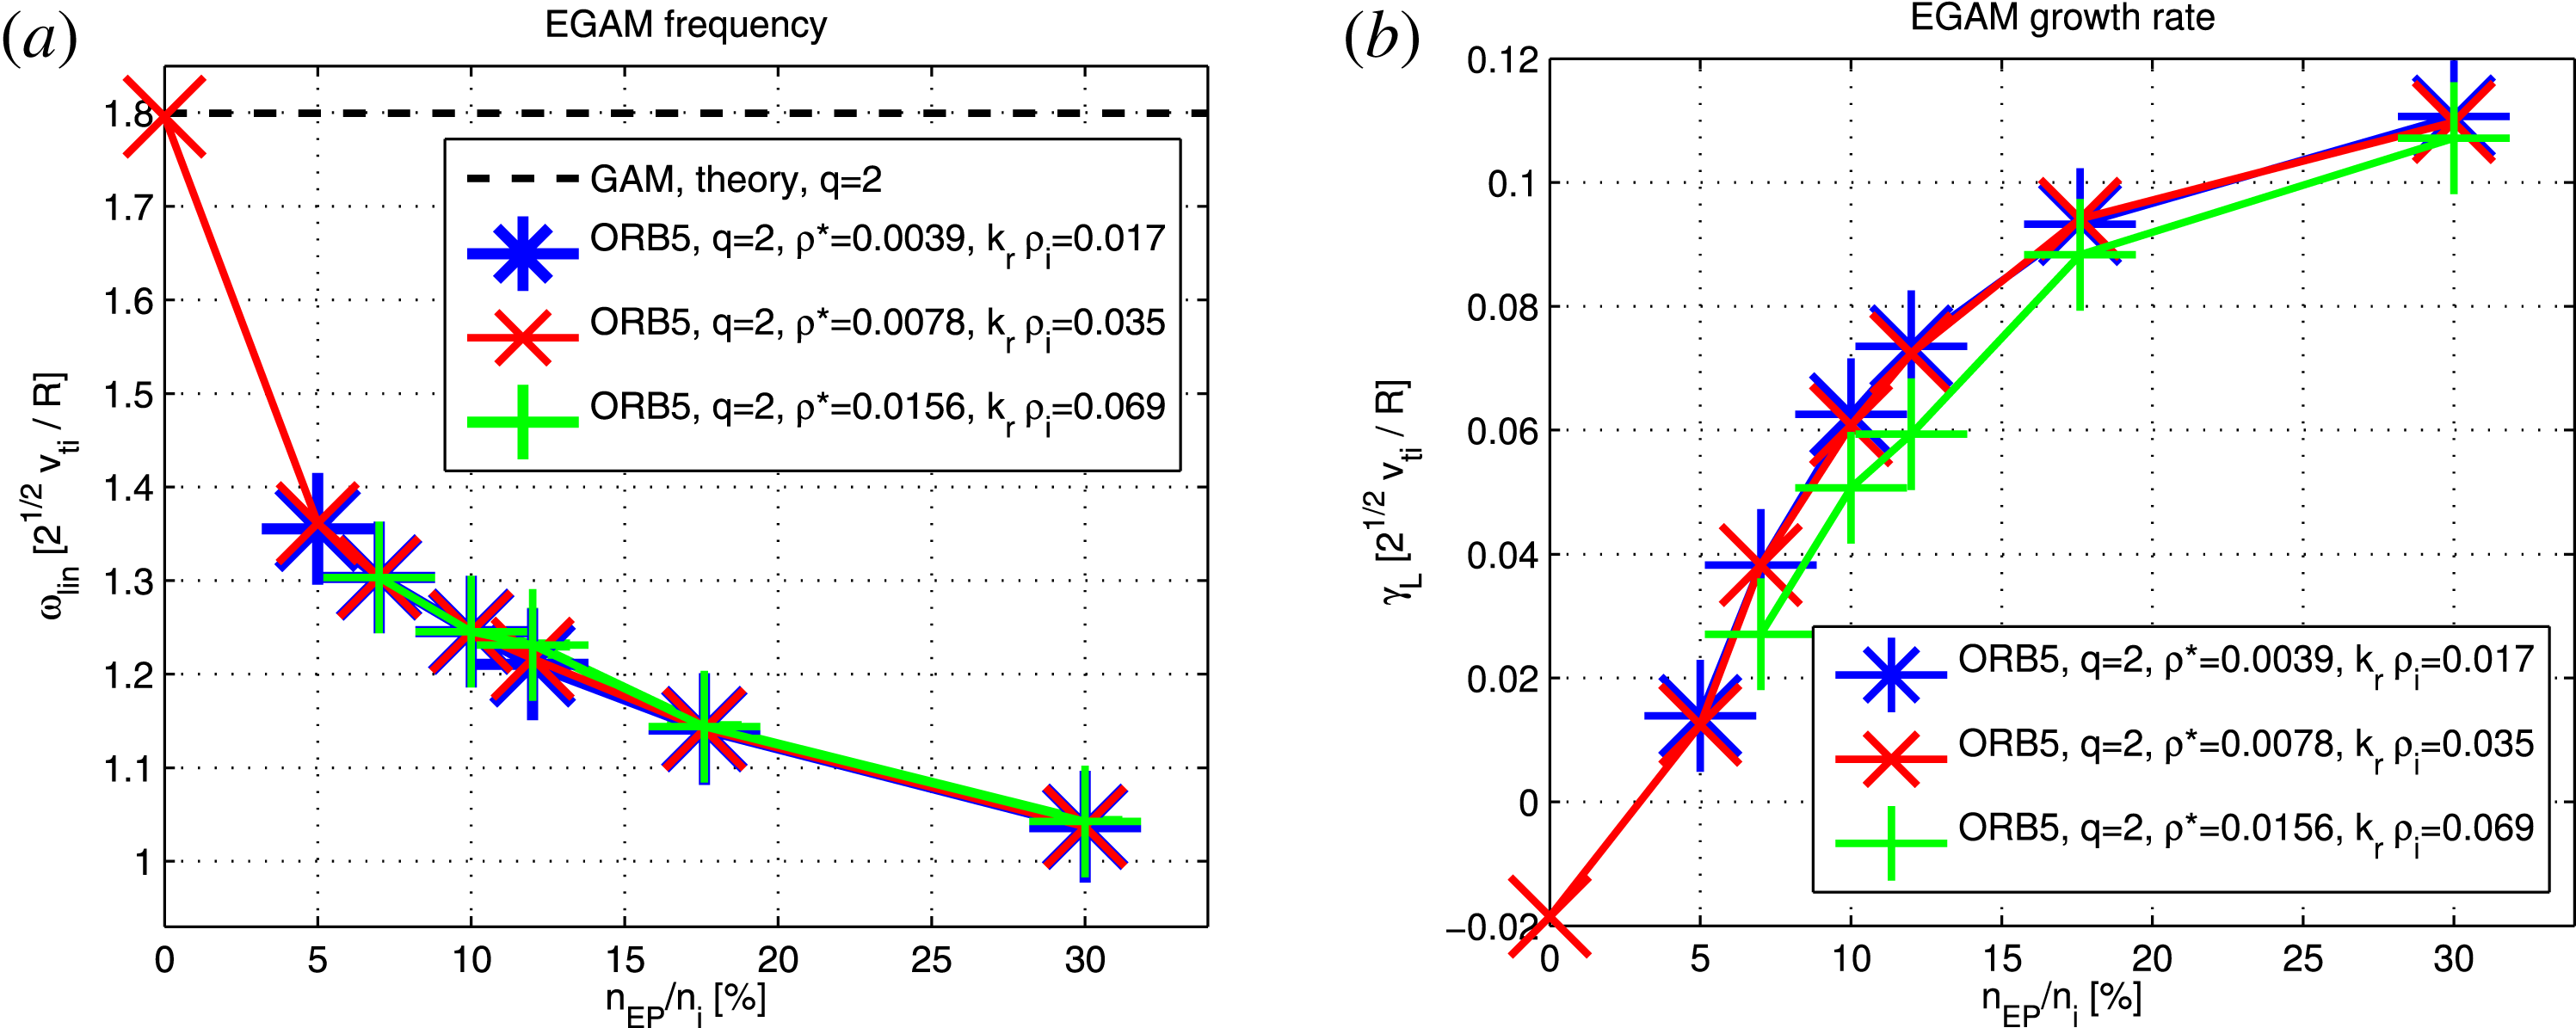
, as described in § 3. The dependence of the linear dynamics (frequency and growth rate) on the EP concentration is shown in figure 2. Both the frequency and the growth rates are observed to follow the qualitative scalings as described in Biancalani et al. (Reference Biancalani, Bottino, Lauber and Zarzoso2014) and Zarzoso et al. (Reference Zarzoso, Biancalani, Bottino, Lauber, Poli, Girardo, Garbet and Dumont2014). Note, in particular, that the growth rate does not grow linearly with
$\unicode[STIX]{x1D70C}^{\ast }$
, as described in § 3. The dependence of the linear dynamics (frequency and growth rate) on the EP concentration is shown in figure 2. Both the frequency and the growth rates are observed to follow the qualitative scalings as described in Biancalani et al. (Reference Biancalani, Bottino, Lauber and Zarzoso2014) and Zarzoso et al. (Reference Zarzoso, Biancalani, Bottino, Lauber, Poli, Girardo, Garbet and Dumont2014). Note, in particular, that the growth rate does not grow linearly with $n_{\text{EP}}$
.
$n_{\text{EP}}$
.
The dependence of the frequency on the EP concentration is not observed to change with $\unicode[STIX]{x1D70C}^{\ast }$
. Regarding the growth rate, no change is observed when going from
$\unicode[STIX]{x1D70C}^{\ast }$
. Regarding the growth rate, no change is observed when going from $\unicode[STIX]{x1D70C}_{3}^{\ast }=0.0039$
to
$\unicode[STIX]{x1D70C}_{3}^{\ast }=0.0039$
to $\unicode[STIX]{x1D70C}_{2}^{\ast }=0.0078$
, meaning that the measured growth rate is basically given by the value of the drive, and the Landau damping here is negligible for the chosen values of EP concentration. On the other hand, when further increasing the temperature, and going to
$\unicode[STIX]{x1D70C}_{2}^{\ast }=0.0078$
, meaning that the measured growth rate is basically given by the value of the drive, and the Landau damping here is negligible for the chosen values of EP concentration. On the other hand, when further increasing the temperature, and going to $\unicode[STIX]{x1D70C}_{1}^{\ast }=0.0156$
, a smaller value of growth rate is measured, meaning a higher Landau damping. The transit resonance velocity of the EP can be calculated by knowing the EGAM frequency of a specific simulation. Considering a case with
$\unicode[STIX]{x1D70C}_{1}^{\ast }=0.0156$
, a smaller value of growth rate is measured, meaning a higher Landau damping. The transit resonance velocity of the EP can be calculated by knowing the EGAM frequency of a specific simulation. Considering a case with $n_{\text{EP}}/n_{i}=0.12$
as an example, the frequency is measured as:
$n_{\text{EP}}/n_{i}=0.12$
as an example, the frequency is measured as: $\unicode[STIX]{x1D714}_{L}=1.2\unicode[STIX]{x1D714}_{s}$
. For comparison, the GAM frequency for these parameters is
$\unicode[STIX]{x1D714}_{L}=1.2\unicode[STIX]{x1D714}_{s}$
. For comparison, the GAM frequency for these parameters is $\unicode[STIX]{x1D714}_{\text{GAM}}=1.8\unicode[STIX]{x1D714}_{s}$
. Then, the transit resonance velocity in the linear phase is calculated as
$\unicode[STIX]{x1D714}_{\text{GAM}}=1.8\unicode[STIX]{x1D714}_{s}$
. Then, the transit resonance velocity in the linear phase is calculated as $v_{\Vert 0}=qR\unicode[STIX]{x1D714}_{L}=3.4v_{\text{ti}}$
, with
$v_{\Vert 0}=qR\unicode[STIX]{x1D714}_{L}=3.4v_{\text{ti}}$
, with $\unicode[STIX]{x1D714}_{L}$
being the EGAM linear frequency.
$\unicode[STIX]{x1D714}_{L}$
being the EGAM linear frequency.
Frequency (a) and growth rate (b) versus EP concentration, for simulations with $\bar{\unicode[STIX]{x1D701}}=v_{\text{bump}}/v_{\text{th}}=4$
. The theoretical value of the GAM frequency is also shown as a black dashed line (Zonca & Chen Reference Zonca and Chen2008).
$\bar{\unicode[STIX]{x1D701}}=v_{\text{bump}}/v_{\text{th}}=4$
. The theoretical value of the GAM frequency is also shown as a black dashed line (Zonca & Chen Reference Zonca and Chen2008).
5 Scaling of the saturated amplitudes
In this section, we focus on the value of the saturated electric field $\bar{\unicode[STIX]{x1D6FF}E_{r}}$
, and we investigate its dependence on the value of the linear growth rate and of the damping. The corresponding scaling of
$\bar{\unicode[STIX]{x1D6FF}E_{r}}$
, and we investigate its dependence on the value of the linear growth rate and of the damping. The corresponding scaling of $\bar{\unicode[STIX]{x1D6FF}E_{r}}$
sheds light on the mechanism which is responsible for the saturation. A one-to-one comparison with the saturation mechanism of the BPI is also described.
$\bar{\unicode[STIX]{x1D6FF}E_{r}}$
sheds light on the mechanism which is responsible for the saturation. A one-to-one comparison with the saturation mechanism of the BPI is also described.
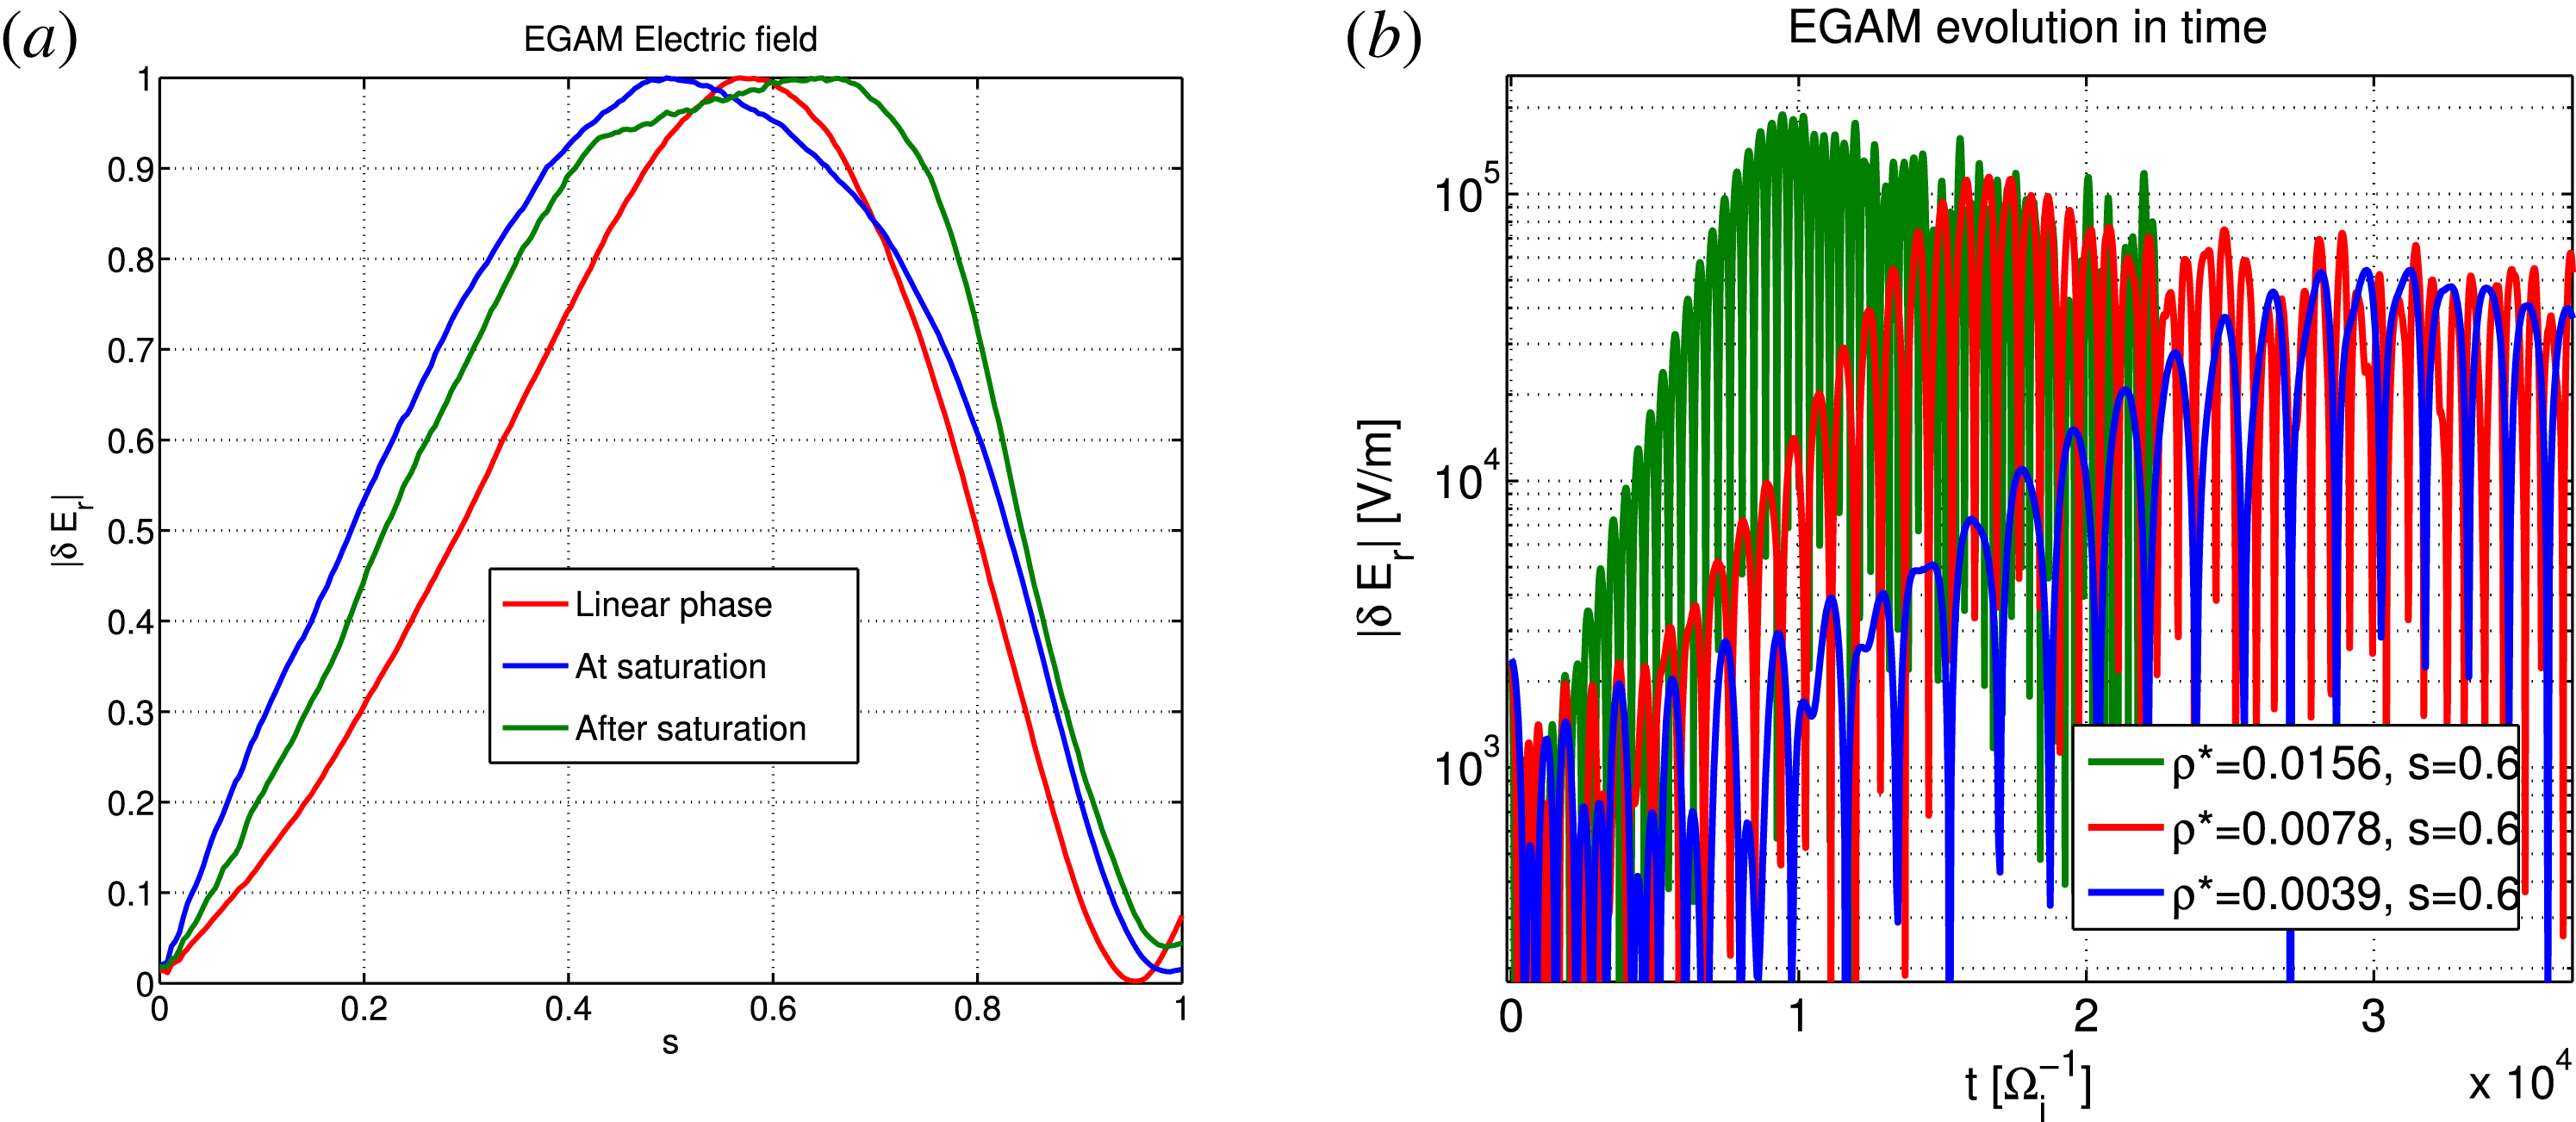
The amplitude of the EGAM at saturation has been measured in different simulations performed with ORB5. The wave–particle nonlinearity only has been considered, by pushing on perturbed trajectories the EP population only. Therefore, even if the linear resonance velocity falls near the tail of the bulk ions (see figure 1), no nonlinear interaction of those bulk ions with the EGAM is considered in our model. More in general, the nonlinear interaction of the bulk ions with the EGAM is expected to be important: this has been studied in part analytically in Qiu et al. (Reference Qiu, Chavdarovski, Biancalani and Cao2017), and its study with ORB5 is in progress. Different values of the bulk temperature, and the EP concentration, have been considered. As an example, the radial structure of a nonlinear simulation with $\unicode[STIX]{x1D70C}^{\ast }=0.0156$
,
$\unicode[STIX]{x1D70C}^{\ast }=0.0156$
, $n_{\text{EP}}/n_{i}=0.176$
is depicted in figure 3(a). No sensible change in the radial wavenumber is observed when going from the linear phase, to the saturation or after the saturation. This confirms that in this particular configuration, where all equilibrium radial profiles are flat, EGAM can be treated as a 1-D problem where the radial direction does not play an important role.
$n_{\text{EP}}/n_{i}=0.176$
is depicted in figure 3(a). No sensible change in the radial wavenumber is observed when going from the linear phase, to the saturation or after the saturation. This confirms that in this particular configuration, where all equilibrium radial profiles are flat, EGAM can be treated as a 1-D problem where the radial direction does not play an important role.
When varying only the bulk temperature, both the linear frequency and growth rate are observed to scale with the sound frequency, which is a good normalization frequency (consistently with figure 2). The saturation level increases with the linear growth rate, similarly to other instabilities like the BPI in a uniform system and the Alfvén instabilities in tokamaks. This is depicted in figure 3(b), where non-normalized units are used (in particular, the ion cyclotron frequency is selected as a time unit not depending on the temperature).
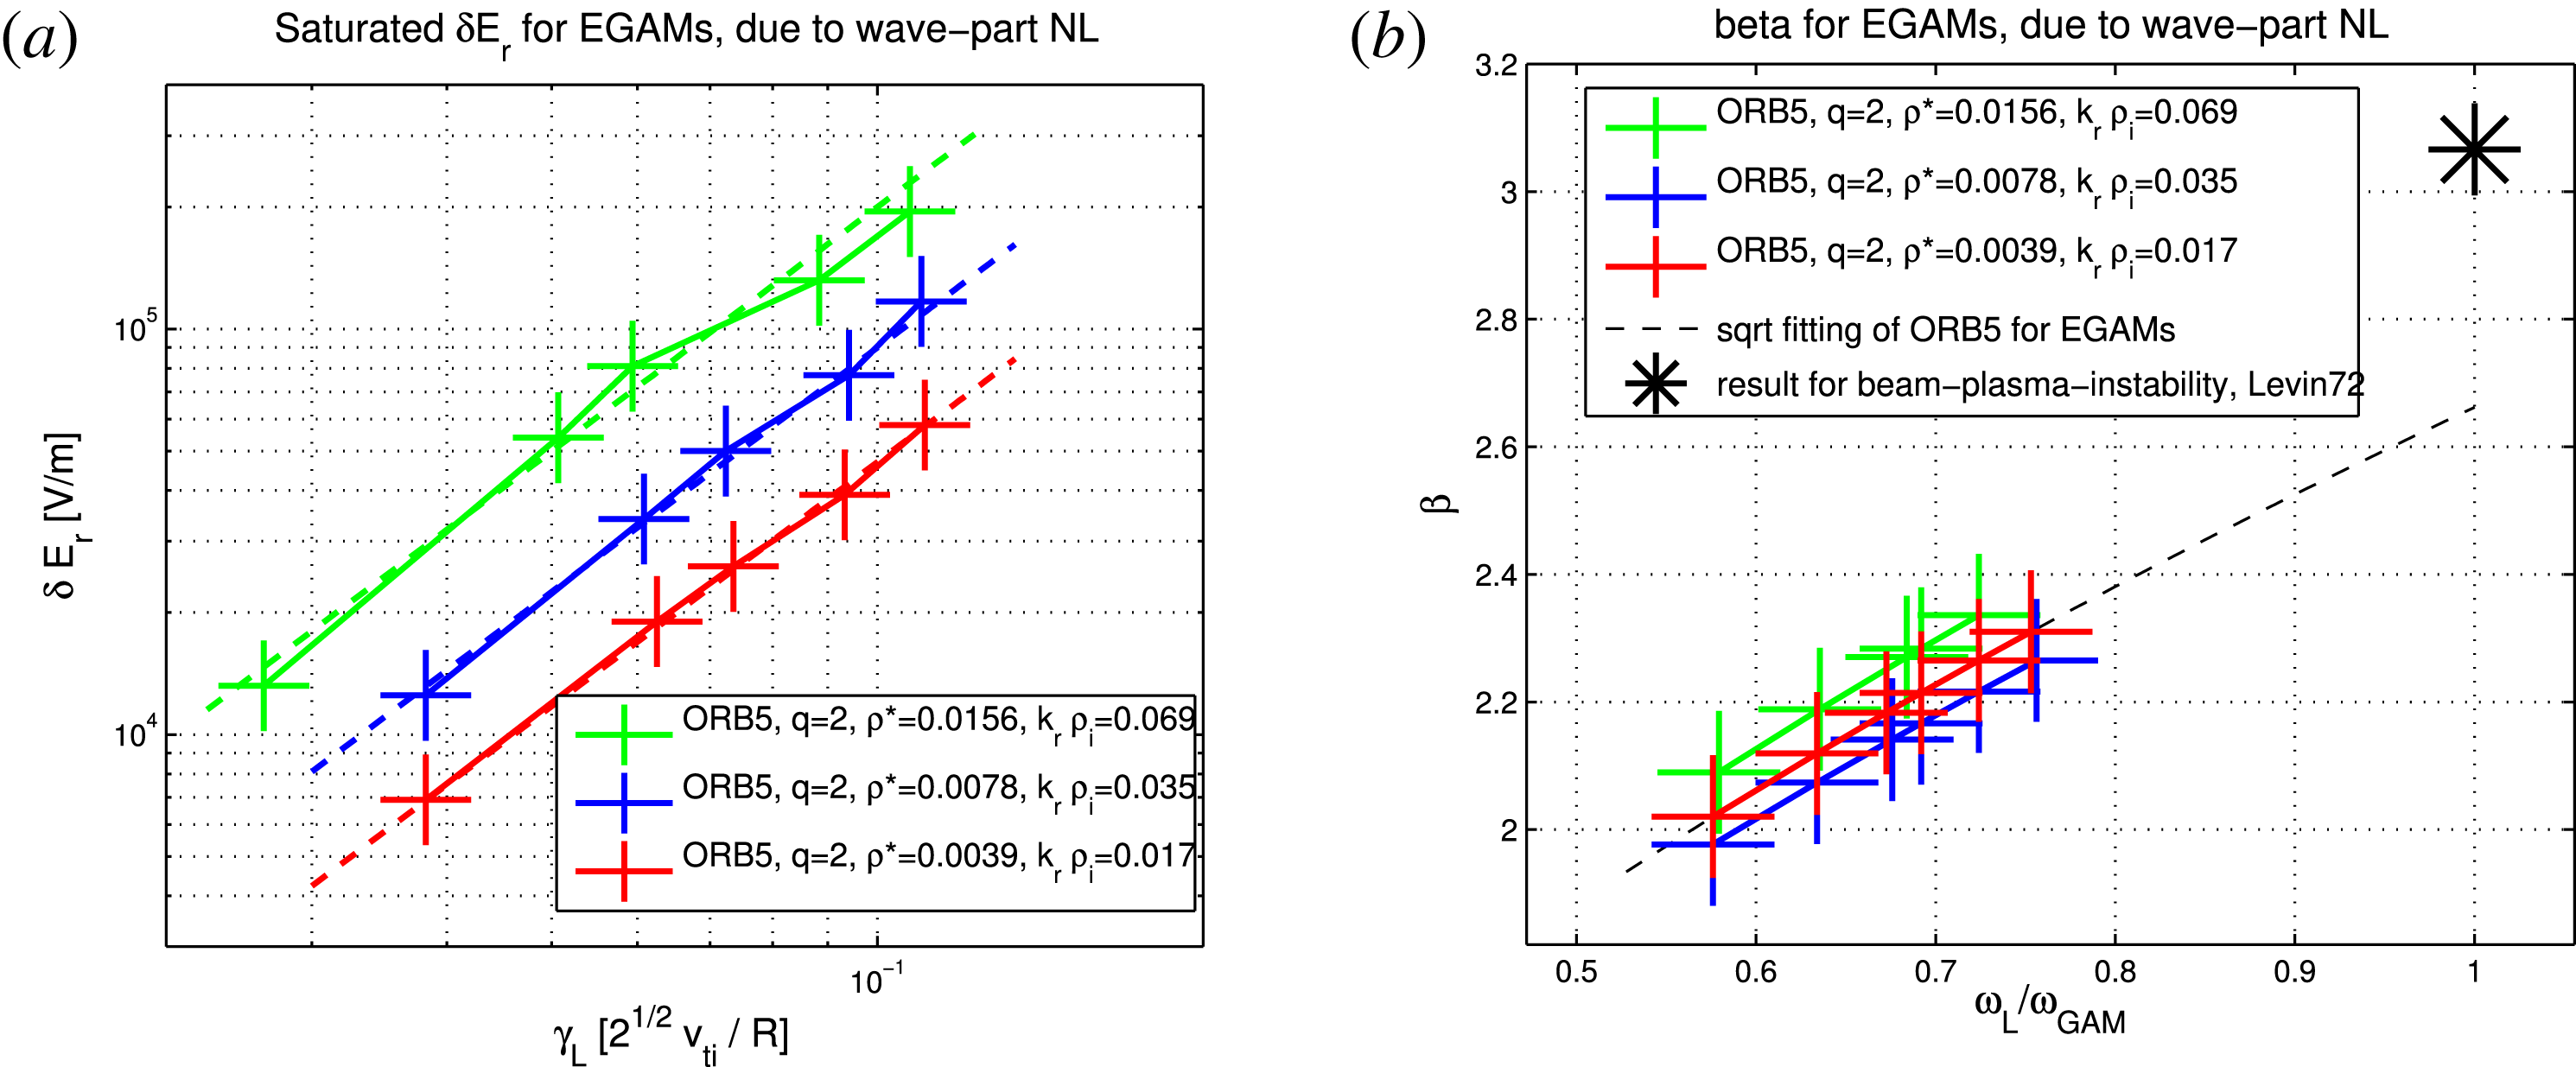
The scalings with the energetic particle concentration are also investigated. The results are shown in figure 4(a). We obtain that, in the considered regime, the saturated level scales as the quadratic power of the linear growth rate. This quadratic scaling is typical for marginally stable bump-on-tail instabilities, as derived by O’Neil (Reference O’Neil1965), O’Neil & Malmberg (Reference O’Neil and Malmberg1968).
(a) EGAM normalized radial structure for $\unicode[STIX]{x1D70C}^{\ast }=0.0156$
,
$\unicode[STIX]{x1D70C}^{\ast }=0.0156$
, $n_{\text{EP}}/n_{i}=0.176$
. (b) Absolute value of the electric field measured at the position of the peak,
$n_{\text{EP}}/n_{i}=0.176$
. (b) Absolute value of the electric field measured at the position of the peak, $s=0.6$
, for three different simulations with respectively
$s=0.6$
, for three different simulations with respectively $\unicode[STIX]{x1D70C}^{\ast }=0.0039$
(blue),
$\unicode[STIX]{x1D70C}^{\ast }=0.0039$
(blue), $\unicode[STIX]{x1D70C}^{\ast }=0.0078$
(red),
$\unicode[STIX]{x1D70C}^{\ast }=0.0078$
(red), $\unicode[STIX]{x1D70C}^{\ast }=0.0156$
(green). All simulations here have
$\unicode[STIX]{x1D70C}^{\ast }=0.0156$
(green). All simulations here have $n_{\text{EP}}/n_{i}=0.30$
. The time is expressed in units of
$n_{\text{EP}}/n_{i}=0.30$
. The time is expressed in units of $\unicode[STIX]{x1D6FA}_{i}^{-1}$
.
$\unicode[STIX]{x1D6FA}_{i}^{-1}$
.
We can consider the problem to be similar to a monochromatic beam-plasma system, in which particles are moving in the potential well of the perturbed electric field. Depending on the energy, some particles are trapped inside the well and execute bounce motion with frequency $\unicode[STIX]{x1D714}_{b}$
in the frame moving with the wave phase velocity. The resonant particles exchange energy with the mode, causing the amplitude to grow and the particles to redistribute in phase space, flattening the velocity distribution in the vicinity of the resonant parallel velocity
$\unicode[STIX]{x1D714}_{b}$
in the frame moving with the wave phase velocity. The resonant particles exchange energy with the mode, causing the amplitude to grow and the particles to redistribute in phase space, flattening the velocity distribution in the vicinity of the resonant parallel velocity $v_{\Vert }=\unicode[STIX]{x1D714}qR_{0}$
. The drive is due to the positive slope of the particle distribution in the velocity space at the resonant parallel velocity, which acts as an inverse Landau damping. In the initial stage
$v_{\Vert }=\unicode[STIX]{x1D714}qR_{0}$
. The drive is due to the positive slope of the particle distribution in the velocity space at the resonant parallel velocity, which acts as an inverse Landau damping. In the initial stage $\unicode[STIX]{x1D714}_{b}\ll \unicode[STIX]{x1D6FE}_{L}$
, the mode grows exponentially with a linear growth rate, making more and more particles become trapped in the phase space. After some significant particle velocity redistribution, the power exchange between the wave and the particles is balanced, causing the wave amplitude to saturate.
$\unicode[STIX]{x1D714}_{b}\ll \unicode[STIX]{x1D6FE}_{L}$
, the mode grows exponentially with a linear growth rate, making more and more particles become trapped in the phase space. After some significant particle velocity redistribution, the power exchange between the wave and the particles is balanced, causing the wave amplitude to saturate.
(a) Maximum value of the EGAM radial electric field, versus linear growth rate, for the same simulations as in figure 2. The red, blue and green crosses refer respectively to $\unicode[STIX]{x1D70C}^{\ast }=0.0039$
,
$\unicode[STIX]{x1D70C}^{\ast }=0.0039$
, $\unicode[STIX]{x1D70C}^{\ast }=0.0078$
,
$\unicode[STIX]{x1D70C}^{\ast }=0.0078$
, $\unicode[STIX]{x1D70C}^{\ast }=0.0156$
. The dashed lines are the quadratic fitting formulas. (b) The value of
$\unicode[STIX]{x1D70C}^{\ast }=0.0156$
. The dashed lines are the quadratic fitting formulas. (b) The value of $\unicode[STIX]{x1D6FD}$
as given in (5.5), versus the linear frequency, for the same simulations. The black dashed line is the square root interpolation. For a reference, the black star shows the result obtained for the BPI in Levin et al. (Reference Levin, Lyubarskiǐ, Onishchenko, Shapiro and Shevchenko1972).
$\unicode[STIX]{x1D6FD}$
as given in (5.5), versus the linear frequency, for the same simulations. The black dashed line is the square root interpolation. For a reference, the black star shows the result obtained for the BPI in Levin et al. (Reference Levin, Lyubarskiǐ, Onishchenko, Shapiro and Shevchenko1972).
Since the initial perturbation is negligible, the saturation level is determined by the exchange of energy between the mode and a band of resonant particles (Levin et al.
Reference Levin, Lyubarskiǐ, Onishchenko, Shapiro and Shevchenko1972). The chirping of the mode seen in figure 5 is a strongly nonlinear effect that occurs when the amplitude is large enough to have the trapped (and more generally resonant) particles with $\unicode[STIX]{x1D714}_{b}\sim \unicode[STIX]{x1D6FE}_{L}$
drastically change the dynamics of the mode through the modification of the distribution function and non-perturbative fast particle response. Namely, the mode dynamics is determined by all resonant particles that exhibit a continuous oscillation, trapping and detrapping in the potential well of the mode, thus contributing (non-perturbatively) to the non-adiabatic behaviour observed in the simulation.
$\unicode[STIX]{x1D714}_{b}\sim \unicode[STIX]{x1D6FE}_{L}$
drastically change the dynamics of the mode through the modification of the distribution function and non-perturbative fast particle response. Namely, the mode dynamics is determined by all resonant particles that exhibit a continuous oscillation, trapping and detrapping in the potential well of the mode, thus contributing (non-perturbatively) to the non-adiabatic behaviour observed in the simulation.
The quadratic scaling of the saturation level with the damping obtained with our simulations is similar to the saturation of the BPI, where it occurs due to wave–particle trapping (O’Neil Reference O’Neil1965). For the BPI, the original reference gives a value of $\unicode[STIX]{x1D714}_{b}=3.06\unicode[STIX]{x1D6FE}_{L}$
at saturation (Levin et al.
Reference Levin, Lyubarskiǐ, Onishchenko, Shapiro and Shevchenko1972) (for comparison, note that more recent numerical calculations find
$\unicode[STIX]{x1D714}_{b}=3.06\unicode[STIX]{x1D6FE}_{L}$
at saturation (Levin et al.
Reference Levin, Lyubarskiǐ, Onishchenko, Shapiro and Shevchenko1972) (for comparison, note that more recent numerical calculations find $\unicode[STIX]{x1D714}_{b}=3.2\unicode[STIX]{x1D6FE}_{L}$
(Lesur, Idomura & Garbet Reference Lesur, Idomura and Garbet2009; Carlevaro et al.
Reference Carlevaro, Milovanov, Falessi, Montani, Terzani and Zonca2016a
; Carlevaro, Montani & Terzani Reference Carlevaro, Montani and Terzani2016b
)). For EGAMs, the bounce frequency is given by (Qiu et al.
Reference Qiu, Zonca and Chen2011):
$\unicode[STIX]{x1D714}_{b}=3.2\unicode[STIX]{x1D6FE}_{L}$
(Lesur, Idomura & Garbet Reference Lesur, Idomura and Garbet2009; Carlevaro et al.
Reference Carlevaro, Milovanov, Falessi, Montani, Terzani and Zonca2016a
; Carlevaro, Montani & Terzani Reference Carlevaro, Montani and Terzani2016b
)). For EGAMs, the bounce frequency is given by (Qiu et al.
Reference Qiu, Zonca and Chen2011):
 $$\begin{eqnarray}\unicode[STIX]{x1D714}_{b}^{2}=\unicode[STIX]{x1D6FC}_{1}\bar{\unicode[STIX]{x1D6FF}E_{r}},\quad \text{with }\unicode[STIX]{x1D6FC}_{1}\equiv \frac{e\hat{V}_{\text{dc}}}{2m_{\text{EP}}v_{\Vert 0}qR_{0}},\end{eqnarray}$$
with $m_{\text{EP}}$
being the mass of the energetic particle species, considered equal to the bulk ion mass in this paper,
$m_{\text{EP}}$
being the mass of the energetic particle species, considered equal to the bulk ion mass in this paper, $v_{\Vert 0}$
the velocity matching the resonance condition, and
$v_{\Vert 0}$
the velocity matching the resonance condition, and $\hat{V}_{\text{dc}}=m_{\text{EP}}v_{\Vert 0}^{2}/(eBR)$
the magnetic curvature drift. Therefore we have:
$\hat{V}_{\text{dc}}=m_{\text{EP}}v_{\Vert 0}^{2}/(eBR)$
the magnetic curvature drift. Therefore we have:
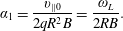 $$\begin{eqnarray}\unicode[STIX]{x1D6FC}_{1}=\frac{v_{\Vert 0}}{2qR^{2}B}=\frac{\unicode[STIX]{x1D714}_{L}}{2RB}.\end{eqnarray}$$
We emphasize that the value of $\unicode[STIX]{x1D6FC}_{1}$
depends on
$\unicode[STIX]{x1D6FC}_{1}$
depends on $\unicode[STIX]{x1D714}_{L}$
. This is a main difference with respect to the BPI, where there is only one value
$\unicode[STIX]{x1D714}_{L}$
. This is a main difference with respect to the BPI, where there is only one value $\unicode[STIX]{x1D714}_{\text{lin}}=\unicode[STIX]{x1D714}_{\text{pe}}$
, with
$\unicode[STIX]{x1D714}_{\text{lin}}=\unicode[STIX]{x1D714}_{\text{pe}}$
, with $\unicode[STIX]{x1D714}_{\text{pe}}$
being the plasma frequency.
$\unicode[STIX]{x1D714}_{\text{pe}}$
being the plasma frequency.
The dependence of the maximum electric field on the linear growth rate can be measured with the results of the numerical simulations. For the simulations shown in figure 4, we find:
 $$\begin{eqnarray}\bar{\unicode[STIX]{x1D6FF}E_{r}}=\unicode[STIX]{x1D6FC}_{2}\unicode[STIX]{x1D6FE}_{L}^{2}.\end{eqnarray}$$
The values of $\unicode[STIX]{x1D6FC}_{2}$
are found to depend on the bulk temperature. For the three chosen increasing values of
$\unicode[STIX]{x1D6FC}_{2}$
are found to depend on the bulk temperature. For the three chosen increasing values of $\unicode[STIX]{x1D70C}^{\ast }$
, i.e.
$\unicode[STIX]{x1D70C}^{\ast }$
, i.e. $\unicode[STIX]{x1D70C}^{\ast }=0.0039$
, 0.0078 and 0.0156, we have respectively
$\unicode[STIX]{x1D70C}^{\ast }=0.0039$
, 0.0078 and 0.0156, we have respectively $\unicode[STIX]{x1D6FC}_{2}=0.47\times 10^{7}$
,
$\unicode[STIX]{x1D6FC}_{2}=0.47\times 10^{7}$
, $0.9\times 10^{7}$
and
$0.9\times 10^{7}$
and $2.0\times 10^{7}~\text{V}~\text{m}^{-1}$
. Finally the relationship between the EP bounce frequency and the linear growth rate is obtained:
$2.0\times 10^{7}~\text{V}~\text{m}^{-1}$
. Finally the relationship between the EP bounce frequency and the linear growth rate is obtained:
 $$\begin{eqnarray}\unicode[STIX]{x1D714}_{b}=\unicode[STIX]{x1D6FD}\unicode[STIX]{x1D6FE}_{L},\end{eqnarray}$$
where $\unicode[STIX]{x1D6FD}$
is calculated as
$\unicode[STIX]{x1D6FD}$
is calculated as $\unicode[STIX]{x1D6FD}=(\unicode[STIX]{x1D6FC}_{1}\unicode[STIX]{x1D6FC}_{2})^{1/2}/\unicode[STIX]{x1D714}_{s}$
, which yields:
$\unicode[STIX]{x1D6FD}=(\unicode[STIX]{x1D6FC}_{1}\unicode[STIX]{x1D6FC}_{2})^{1/2}/\unicode[STIX]{x1D714}_{s}$
, which yields:
 $$\begin{eqnarray}\unicode[STIX]{x1D6FD}=\unicode[STIX]{x1D6FD}_{0}\left(\frac{\unicode[STIX]{x1D714}_{L}}{\unicode[STIX]{x1D714}_{\text{GAM}}}\right)^{1/2},\quad \text{with }\unicode[STIX]{x1D6FD}_{0}=\frac{1}{\unicode[STIX]{x1D714}_{s}}\left(\frac{\unicode[STIX]{x1D714}_{\text{GAM}}\unicode[STIX]{x1D6FC}_{2}}{2RB}\right)^{1/2}.\end{eqnarray}$$
Note that here, $\unicode[STIX]{x1D6FD}$
depends on the EGAM frequency, which changes with the intensity of the drive, given here by the EP concentration (see figure 2). As a comparison, note that in the problem of the BPI, solved in O’Neil (Reference O’Neil1965), O’Neil & Malmberg (Reference O’Neil and Malmberg1968), Levin et al. (Reference Levin, Lyubarskiǐ, Onishchenko, Shapiro and Shevchenko1972), on the one hand, the mode frequency is assumed to be constant and equal to the frequency measured in the absence of EP. On the other hand, the values of
$\unicode[STIX]{x1D6FD}$
depends on the EGAM frequency, which changes with the intensity of the drive, given here by the EP concentration (see figure 2). As a comparison, note that in the problem of the BPI, solved in O’Neil (Reference O’Neil1965), O’Neil & Malmberg (Reference O’Neil and Malmberg1968), Levin et al. (Reference Levin, Lyubarskiǐ, Onishchenko, Shapiro and Shevchenko1972), on the one hand, the mode frequency is assumed to be constant and equal to the frequency measured in the absence of EP. On the other hand, the values of $\unicode[STIX]{x1D6FD}$
are found not to depend on the damping, which changes with the three different bulk temperatures: an interpolation can be drawn for all considered simulations, and shown to depend on
$\unicode[STIX]{x1D6FD}$
are found not to depend on the damping, which changes with the three different bulk temperatures: an interpolation can be drawn for all considered simulations, and shown to depend on $\unicode[STIX]{x1D714}_{L}$
only (see figure 4
b). In this sense, the formula given in (5.5) is universal for the chosen regime, because it does not depend on the bulk plasma temperature.
$\unicode[STIX]{x1D714}_{L}$
only (see figure 4
b). In this sense, the formula given in (5.5) is universal for the chosen regime, because it does not depend on the bulk plasma temperature.
The considered equilibrium has been chosen in order to excite EGAMs out of a GAM, and not out of a Landau pole, as described in Zarzoso et al. (Reference Zarzoso, Biancalani, Bottino, Lauber, Poli, Girardo, Garbet and Dumont2014). This choice of the mode is made in order to have a one-to-one correspondence with the BPI, where the mode which is excited by the energetic electron beam is the Langmuir wave which is an eigenmode of the system in the absence of EP. Following this consideration, we can consider the interpolation of the results shown in figure 4, and take the extrapolation to $\unicode[STIX]{x1D714}_{L}\rightarrow \unicode[STIX]{x1D714}_{\text{GAM}}$
, which is the limit assumed in the resolution of the BPI. In this case, the extrapolation gives a unique value, which defines the EGAM instability, i.e.
$\unicode[STIX]{x1D714}_{L}\rightarrow \unicode[STIX]{x1D714}_{\text{GAM}}$
, which is the limit assumed in the resolution of the BPI. In this case, the extrapolation gives a unique value, which defines the EGAM instability, i.e. $\unicode[STIX]{x1D6FD}_{0}=\unicode[STIX]{x1D6FD}(\unicode[STIX]{x1D714}_{L}/\unicode[STIX]{x1D714}_{\text{GAM}}=1)=2.66$
. This is to be compared with the value of
$\unicode[STIX]{x1D6FD}_{0}=\unicode[STIX]{x1D6FD}(\unicode[STIX]{x1D714}_{L}/\unicode[STIX]{x1D714}_{\text{GAM}}=1)=2.66$
. This is to be compared with the value of $\unicode[STIX]{x1D6FD}$
obtained for the BPI (Levin et al.
Reference Levin, Lyubarskiǐ, Onishchenko, Shapiro and Shevchenko1972; Lesur et al.
Reference Lesur, Idomura and Garbet2009; Carlevaro et al.
Reference Carlevaro, Milovanov, Falessi, Montani, Terzani and Zonca2016a
,Reference Carlevaro, Montani and Terzani
b
), i.e.
$\unicode[STIX]{x1D6FD}$
obtained for the BPI (Levin et al.
Reference Levin, Lyubarskiǐ, Onishchenko, Shapiro and Shevchenko1972; Lesur et al.
Reference Lesur, Idomura and Garbet2009; Carlevaro et al.
Reference Carlevaro, Milovanov, Falessi, Montani, Terzani and Zonca2016a
,Reference Carlevaro, Montani and Terzani
b
), i.e. $\unicode[STIX]{x1D6FD}_{\text{BPI}}=3.2$
(originally estimated as
$\unicode[STIX]{x1D6FD}_{\text{BPI}}=3.2$
(originally estimated as $\unicode[STIX]{x1D6FD}_{\text{BPI}}=3.06$
by Levin).
$\unicode[STIX]{x1D6FD}_{\text{BPI}}=3.06$
by Levin).
Finally, by using (5.1), (5.2), (5.4) and (5.5), we can write the formula for the saturated electric field as a function of the linear characteristics of the mode:
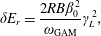 $$\begin{eqnarray}\unicode[STIX]{x1D6FF}E_{r}=\frac{2RB\unicode[STIX]{x1D6FD}_{0}^{2}}{\unicode[STIX]{x1D714}_{\text{GAM}}}\unicode[STIX]{x1D6FE}_{L}^{2},\end{eqnarray}$$
with the value of $\unicode[STIX]{x1D6FD}_{0}=2.66$
in the regime considered in this paper.
$\unicode[STIX]{x1D6FD}_{0}=2.66$
in the regime considered in this paper.
6 Frequency
In this section, we show the results of the measurement of the time evolution of the EGAM frequency. In § 5, we have shown that a quadratic scaling of the saturated electric field on the linear growth rate is found. This quadratic scaling, has a one-to-one correspondence on the Langmuir wave problem investigated by O’Neil, where the saturation occurs due to wave–particle trapping. The wave–particle trapping mechanism is usually referred to as adiabatic, meaning that a slowly increasing potential well traps more and more energetic particles. In this adiabatic regime, the mode frequency varies very slowly with respect to the bounce frequency. On the other hand, in the EGAM case considered here, we show that the saturation is not strictly adiabatic, but a transition between adiabatic and non-adiabatic regime occurs at the time of the saturation.
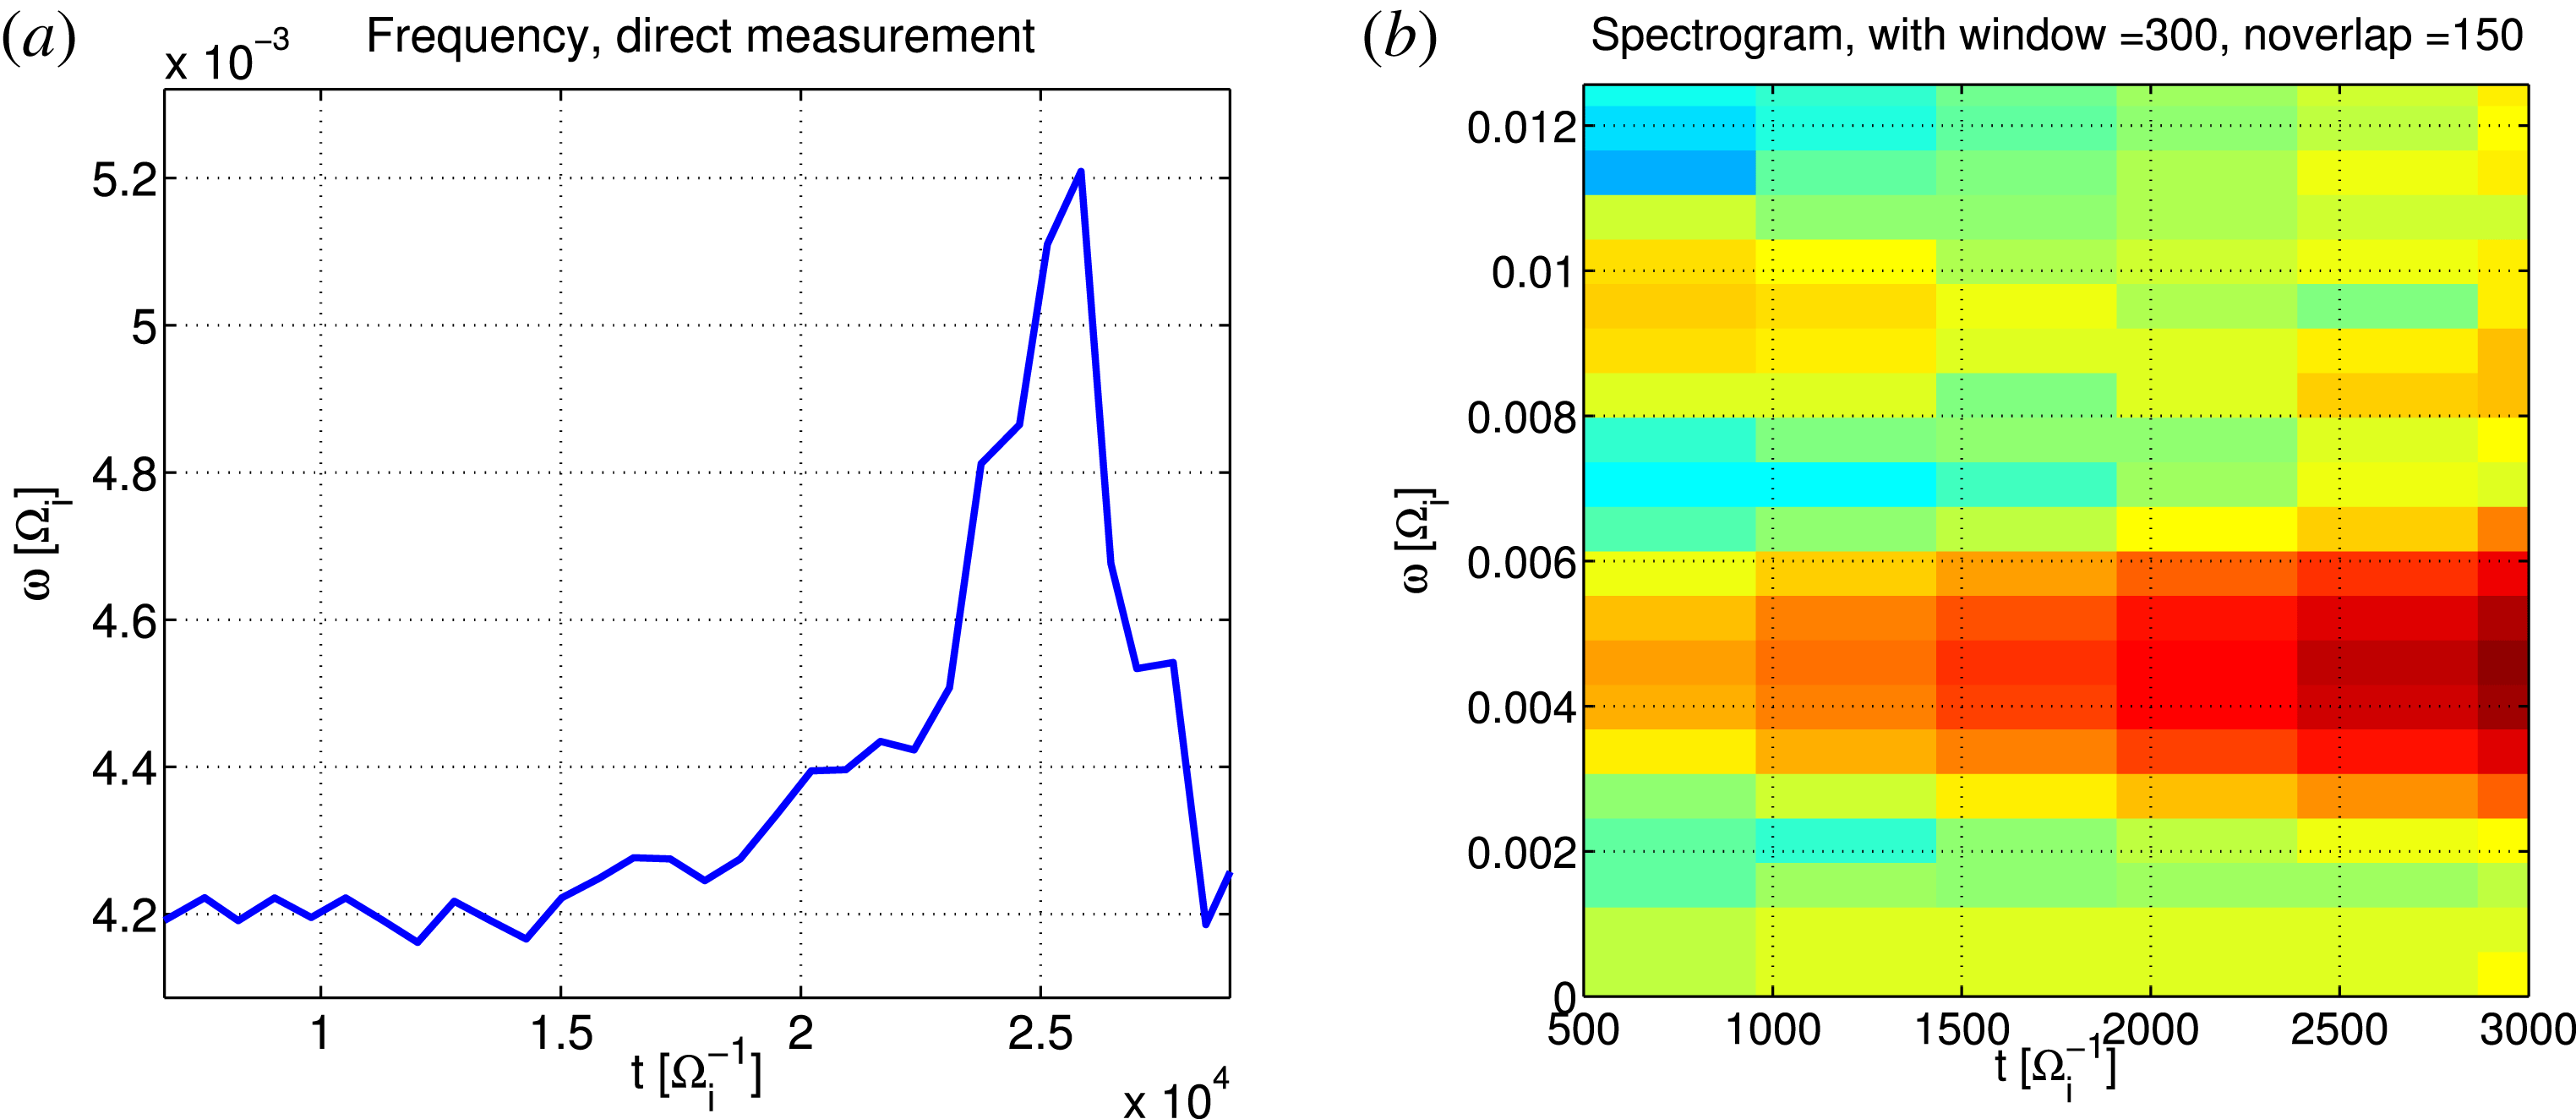
Nonlinear evolution of the frequency, measured as a short-time average of the period between the peaks (a) or with a short-time Fourier transform (b), for $\unicode[STIX]{x1D70C}^{\ast }=0.0078$
,
$\unicode[STIX]{x1D70C}^{\ast }=0.0078$
, $n_{\text{EP}}/n_{i}=0.12$
.
$n_{\text{EP}}/n_{i}=0.12$
.
In this section, we take again the EGAM case with $\unicode[STIX]{x1D70C}^{\ast }=0.0078$
,
$\unicode[STIX]{x1D70C}^{\ast }=0.0078$
, $n_{\text{EP}}/n_{i}=0.12$
, as a typical case, and we investigate the variation of the frequency in time in comparison with the bounce frequency. For the measurement of the frequency, we use the radial zonal electric field measured at
$n_{\text{EP}}/n_{i}=0.12$
, as a typical case, and we investigate the variation of the frequency in time in comparison with the bounce frequency. For the measurement of the frequency, we use the radial zonal electric field measured at $s=0.5$
. The measurement of the frequency is performed in two different ways: (a) as an average of the period between several EGAM oscillation peaks, as shown in figure 5(a); (b) and with a short-time Fourier transform (STFT), as shown in figure 5(b).
$s=0.5$
. The measurement of the frequency is performed in two different ways: (a) as an average of the period between several EGAM oscillation peaks, as shown in figure 5(a); (b) and with a short-time Fourier transform (STFT), as shown in figure 5(b).
With the first technique, namely measuring the frequency by inversion of the period between neighbouring peaks, an upward chirping is observed in the nonlinear phase, of the order of 10 % of the linear frequency. This means that the resonance condition changes in time, with resonance velocity slightly increasing at the time of the saturation or in the later phase (see figure 5 a). A dominantly upward chirping of EGAMs was previously observed and documented in Berk et al. (Reference Berk, Boswell, Borba, Figueiredo, Johnson, Nave, Pinches, Sharapov and EFDA contributors2006), Wang et al. (Reference Wang, Todo and Kim2013). In the cases of interest, the frequency changes with a similar time scale as the evolution of the amplitude. In this regime, we refer to this change of the frequency in time as nonlinear frequency shift, i.e. frequency chirping.
The second technique, consists in measuring the frequency with a short-time Fourier transform (STFT) on a Hamming time window. With this technique, the error bar in frequency is large (due to the small number of oscillations in the nonlinear regime around the saturation), namely of the order of 10–20 % (see figure 5
b). With such a big error bar, no clear upward chirping is observed. Near the time of the saturation, i.e. $t\simeq 2.2\unicode[STIX]{x1D6FA}_{i}^{-1}$
, only one mode is observed. This is the condition of application of the direct technique of measurement of the frequency described above, where the frequency can be measured as the inverse of the period among peaks.
$t\simeq 2.2\unicode[STIX]{x1D6FA}_{i}^{-1}$
, only one mode is observed. This is the condition of application of the direct technique of measurement of the frequency described above, where the frequency can be measured as the inverse of the period among peaks.
Squared bounce frequency (a) and adiabaticity (b) for the EGAM with $\unicode[STIX]{x1D70C}^{\ast }=0.0078$
,
$\unicode[STIX]{x1D70C}^{\ast }=0.0078$
, $n_{\text{EP}}/n_{i}=0.12$
.
$n_{\text{EP}}/n_{i}=0.12$
.
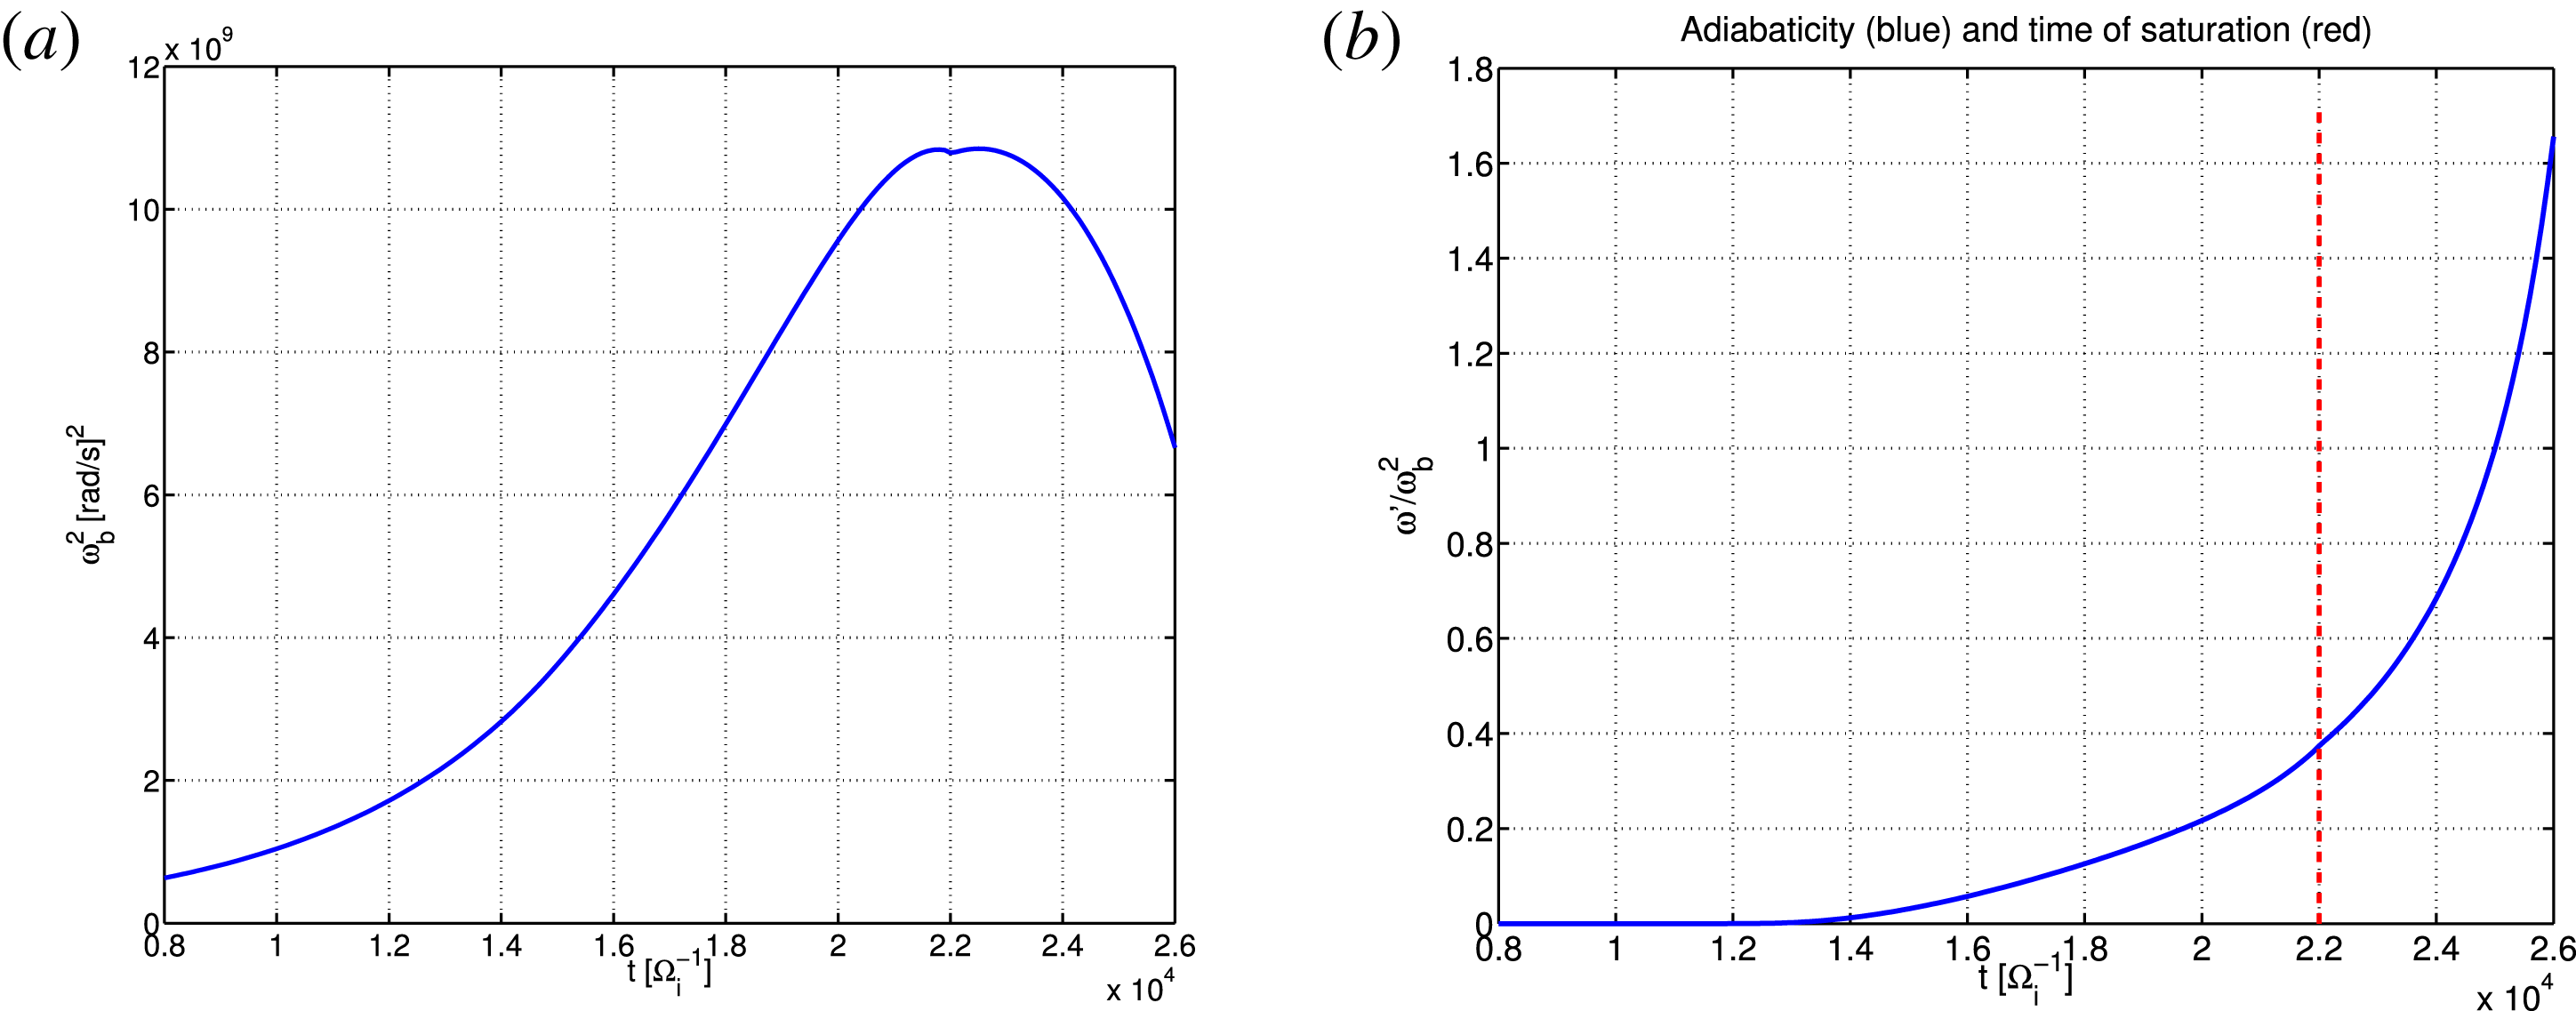
As mentioned above, the EP bounce frequency $\unicode[STIX]{x1D714}_{b}$
depends on the mode amplitude. For this case, the mode amplitude grows during a linear phase, then enters the nonlinear phase and saturates at the time
$\unicode[STIX]{x1D714}_{b}$
depends on the mode amplitude. For this case, the mode amplitude grows during a linear phase, then enters the nonlinear phase and saturates at the time $t=2.3\times 10^{4}\unicode[STIX]{x1D6FA}_{i}^{-1}$
. The corresponding value of
$t=2.3\times 10^{4}\unicode[STIX]{x1D6FA}_{i}^{-1}$
. The corresponding value of $\unicode[STIX]{x1D714}_{b}^{2}$
for the considered simulation is shown in figure 6(a). When the EGAM frequency evolves slowly in time with respect to the inverse of the bounce frequency, then the EP can bounce back and forth many times, and this is called adiabatic dynamics. The adiabaticity parameter, defined as
$\unicode[STIX]{x1D714}_{b}^{2}$
for the considered simulation is shown in figure 6(a). When the EGAM frequency evolves slowly in time with respect to the inverse of the bounce frequency, then the EP can bounce back and forth many times, and this is called adiabatic dynamics. The adiabaticity parameter, defined as $\unicode[STIX]{x1D714}^{\prime }/\unicode[STIX]{x1D714}_{b}^{2}$
, measures the level of adiabaticity of the dynamics. Here,
$\unicode[STIX]{x1D714}^{\prime }/\unicode[STIX]{x1D714}_{b}^{2}$
, measures the level of adiabaticity of the dynamics. Here, $\unicode[STIX]{x1D714}^{\prime }$
is the time derivative of the frequency. The time evolution of the adiabaticiy parameter for the considered simulation is depicted in figure 6(b) (with
$\unicode[STIX]{x1D714}^{\prime }$
is the time derivative of the frequency. The time evolution of the adiabaticiy parameter for the considered simulation is depicted in figure 6(b) (with $\unicode[STIX]{x1D714}$
being the instantaneous mode frequency). A transition from adiabatic to non-adiabatic dynamics near the saturation is observed. In particular, near the saturation, the EP do not have the time to perform many bounces during the nonlinear modification of the wave. In this respect, the EGAM dynamics and the BPI are not analogous. The details of the EGAM saturation mechanism will be investigated with a power-balance diagnostics in phase space, and discussed in a separate paper, where a comparison with the nonlinear dynamics described in Berk et al. (Reference Berk, Boswell, Borba, Figueiredo, Johnson, Nave, Pinches, Sharapov and EFDA contributors2006), Wang et al. (Reference Wang, Todo and Kim2013) will be discussed.
$\unicode[STIX]{x1D714}$
being the instantaneous mode frequency). A transition from adiabatic to non-adiabatic dynamics near the saturation is observed. In particular, near the saturation, the EP do not have the time to perform many bounces during the nonlinear modification of the wave. In this respect, the EGAM dynamics and the BPI are not analogous. The details of the EGAM saturation mechanism will be investigated with a power-balance diagnostics in phase space, and discussed in a separate paper, where a comparison with the nonlinear dynamics described in Berk et al. (Reference Berk, Boswell, Borba, Figueiredo, Johnson, Nave, Pinches, Sharapov and EFDA contributors2006), Wang et al. (Reference Wang, Todo and Kim2013) will be discussed.
7 Summary and discussion
The importance of understanding the nonlinear dynamics of EGAM, i.e. energetic particle (EP) driven geodesic acoustic modes (GAM), is due to their possible role in interacting with turbulence and with the EP population present in tokamak plasmas as a result of nuclear reactions and/or heating mechanisms. In particular, the level of the nonlinear saturation of EGAMs is directly related to their efficiency in regulating turbulence or redistributing EP in phase space.
In this paper, we have investigated the problem of the nonlinear saturation of EGAM with the gyrokinetic particle-in-cell code ORB5, focusing on the wave–particle nonlinearity. Electrostatic collisionless simulations have been considered, with circular flux-surface magnetic equilibria, and neglecting the kinetic effects of electrons.
The level of the saturated electric field has been shown to scale quadratically with the linear growth rate, similarly to the beam-plasma instability (BPI) in 1-D uniform plasmas, and to Alfvén Eigenmodes (AE) near marginal stability. We note that, due to the flat density and temperature profiles assumed for all species at the equilibrium, the EGAM has a strict 1-D dynamics similar to the BPI. In fact, the EGAM electric perturbation is low frequency ( $\unicode[STIX]{x1D714}\ll \unicode[STIX]{x1D6FA}_{i}$
) and zonal (
$\unicode[STIX]{x1D714}\ll \unicode[STIX]{x1D6FA}_{i}$
) and zonal ( $m=n=0$
) and when radial non-uniformities are negligible, like in our case, the direction parallel to the equilibrium magnetic field becomes the only relevant direction for the wave–particle interaction, i.e. for the inverse Landau damping. We also note that, in the case of beta-induced AE, due to the finite radial mode structure compared to resonant particle radial excursion, deviation from the
$m=n=0$
) and when radial non-uniformities are negligible, like in our case, the direction parallel to the equilibrium magnetic field becomes the only relevant direction for the wave–particle interaction, i.e. for the inverse Landau damping. We also note that, in the case of beta-induced AE, due to the finite radial mode structure compared to resonant particle radial excursion, deviation from the $\unicode[STIX]{x1D6FF}E_{r}\propto \unicode[STIX]{x1D6FE}_{L}^{2}$
is observed due to the competition of resonance detuning and radial decoupling (Wang et al.
Reference Wang, Briguglio, Chen, Di Troia, Fogaccia, Vlad and Zonca2012; Zhang, Lin & Holod Reference Zhang, Lin and Holod2012). A similar deviation is anticipated as one further increases the drive of EPs, from the correspondence of EP pitch angle scattering by frequency chirping EGAMs and the radial wave–particle pumping by frequency chirping finite-
$\unicode[STIX]{x1D6FF}E_{r}\propto \unicode[STIX]{x1D6FE}_{L}^{2}$
is observed due to the competition of resonance detuning and radial decoupling (Wang et al.
Reference Wang, Briguglio, Chen, Di Troia, Fogaccia, Vlad and Zonca2012; Zhang, Lin & Holod Reference Zhang, Lin and Holod2012). A similar deviation is anticipated as one further increases the drive of EPs, from the correspondence of EP pitch angle scattering by frequency chirping EGAMs and the radial wave–particle pumping by frequency chirping finite- $n$
BAEs. This will be the content of our next publication.
$n$
BAEs. This will be the content of our next publication.
We have also investigated the relationship of the bounce frequency of the EP in the field of the EGAM, with the linear growth rate, finding a linear dependence, similarly to the BPI. The linear coefficient, in the case of the EGAM problem, is proportional to the square root of the EGAM frequency, and is not a constant like in the beam-plasma instability. In the limit of $\unicode[STIX]{x1D714}_{L}/\unicode[STIX]{x1D714}_{\text{GAM}}\rightarrow 1$
, which corresponds to the BPI problem when the mode frequency does not move sensibly from the value of the plasma frequency
$\unicode[STIX]{x1D714}_{L}/\unicode[STIX]{x1D714}_{\text{GAM}}\rightarrow 1$
, which corresponds to the BPI problem when the mode frequency does not move sensibly from the value of the plasma frequency $\unicode[STIX]{x1D714}_{p}$
, a unique value of the linear coefficient can be estimated:
$\unicode[STIX]{x1D714}_{p}$
, a unique value of the linear coefficient can be estimated: $\unicode[STIX]{x1D6FD}_{0}=2.66$
, to be compared with the factor
$\unicode[STIX]{x1D6FD}_{0}=2.66$
, to be compared with the factor $\unicode[STIX]{x1D6FD}_{\text{BPI}}\simeq 3.2$
of the BPI. This value of
$\unicode[STIX]{x1D6FD}_{\text{BPI}}\simeq 3.2$
of the BPI. This value of $\unicode[STIX]{x1D6FD}_{0}=2.66$
defines the EGAM in the regime of interest. As a main result, the formula for the saturation level has been provided. The investigation of the dependence of
$\unicode[STIX]{x1D6FD}_{0}=2.66$
defines the EGAM in the regime of interest. As a main result, the formula for the saturation level has been provided. The investigation of the dependence of $\unicode[STIX]{x1D6FD}$
on equilibrium parameters like the safety factor, the magnetic flux surface elongation, the EP distribution function and the effect of kinetic electrons is left to a future work.
$\unicode[STIX]{x1D6FD}$
on equilibrium parameters like the safety factor, the magnetic flux surface elongation, the EP distribution function and the effect of kinetic electrons is left to a future work.
Finally, we have investigated the temporal variation of the EGAM frequency during the saturation phase. The initial adiabatic regime, defined as the regime where the time derivative of the EGAM frequency is much smaller than the squared EP bounce frequency, has been shown to have a transition to a non-adiabatic regime at the saturation. The exact analytical model of this phenomenon is still a work in progress and will be the first expansion of this work. The simplified picture is that the mode will chirp to maintain maximal exchange of power with the energetic particles (Chen & Zonca Reference Chen and Zonca2016), while balancing the Landau damping. The mode frequency is at the same time bound by the wave dispersion relation and plasma equilibrium, making their simultaneous examination with the power exchange equation necessary for determining the rate and direction of chirping. The non-adiabatic behaviour is enabled by the non-perturbative response of the energetic particles, which consists of significant distortion of the distribution function in the resonant region, as well as of the particle trapping and detrapping (Chen & Zonca Reference Chen and Zonca2016). Differently, the adiabatic chirping is connected with either externally driven fluctuations, or slow energetic particle redistribution, provided that the drive is sufficiently weak (Breizman et al. Reference Breizman, Berk, Pekker, Porcelli, Stupakov and Wong1997).
Acknowledgements
Interesting discussions with N. Carlevaro, G. Montani, F. Zonca on the nonlinear dynamics of the energetic particles are acknowledged. Interesting discussions with A. Mishchenko and B. Finney McMillan on the treatment of EGAMs with ORB5, and with the whole ORB5 team, are also acknowledged. Part of this work has been carried out within the framework of the EUROfusion Consortium and has received funding from the Euratom research and training programme 2014–2018 under grant agreement no 633053, within the framework of the Nonlinear energetic particle dynamics (NLED) European Enabling Research Project, WP 15-ER-01/ENEA-03 and Nonlinear interaction of Alfvénic and Turbulent fluctuations in burning plasmas (NAT) European Enabling Research Project, CfP-AWP17-ENR-MPG-01. The views and opinions expressed herein do not necessarily reflect those of the European Commission. Part of this work has been funded by the Centre de Coopération Universitaire Franco-Bavarois – Bayerisch-Französisches Hochschulzentrum, for the grant FK 30_15. Simulations were performed on the Marconi supercomputer within the framework of the OrbZONE and ORBFAST projects. Part of this work was done while two of the authors (A.B. and I.N.) were visiting LPP-Palaiseau, whose team is acknowledged for the hospitality. One of the authors (I.C.) wants to thank the Max Planck Princeton Center for the support during this work. This paper is dedicated to Professor Francesco Pegoraro.



