
The authors report here, that in their recent paper (Timans et al. Reference Timans, van Zon, Nuytinck and Stech2025), the legend in Fig. 4 needs amending. It had indicated that the respective map represented values of the urban heat index (UHI), which is the relative contribution that is made to average temperatures by urbanization. However, the Fig. 4 values represented the perceived temperature in degrees Celsius (°C) during hot summer days, which is nevertheless closely related to the UHI. The perceived temperature map presents an indication of urban heat stress at a higher resolution (2 × 2 m), compared to typically coarser resolution UHI maps.
The correct figure, published here, has the following changes: urban heat island (UHI) effect legend is replaced by perceived temperature. The data source is corrected to read ‘Esri Nederland, Klimaateffectatlas (2025, https://www.klimaateffectatlas.nl/nl/; for metadata see https://www.arcgis.com/home/item.html?id=61e098fb10754714adf492f301a493c2).’
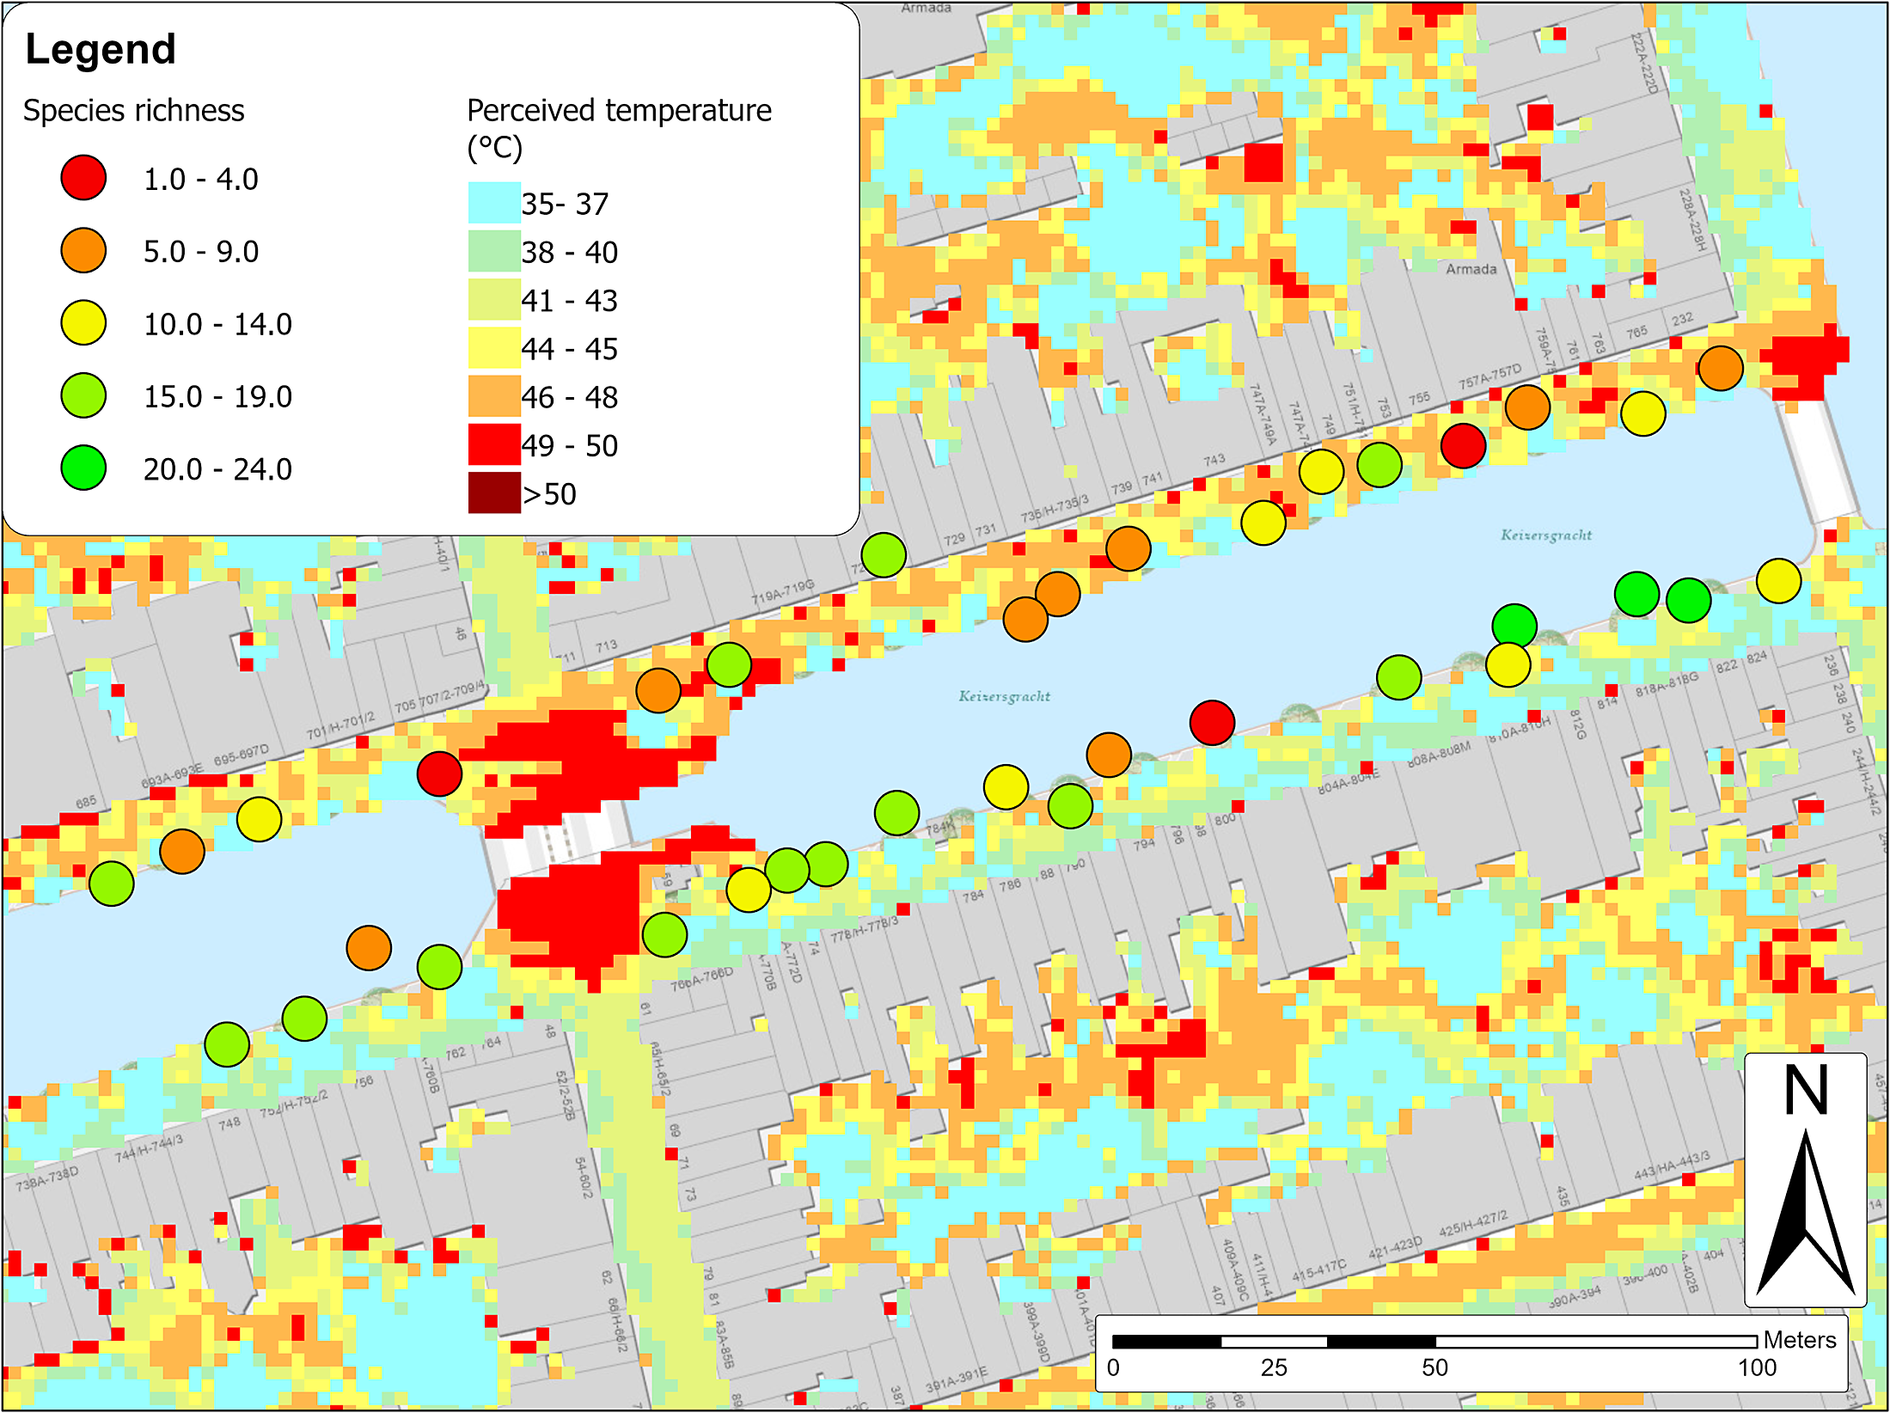
The correction has no consequences for the results and conclusions of the paper, but the manuscript requires a rectification under Material and Methods (‘Data analysis’), to concur with the corrected figure and to avoid confusion. The sentence ‘To analyze the potential of lichens for indicating the local UHI effect, a UHI effect map of the Netherlands utilized through the ArcGis program was used as an overlay for studied phorophytes of one location (Fig. 1; location 11), visualizing species richness for each phorophyte on a heat map of the sampling locality (Fig. 4).’ should read: ‘To analyze the potential of lichens for indicating the local UHI effect, species richness for each phorophyte of one sampling locality (Fig. 1; location 11) was visualized on an overlaid heat-stress map based on perceived temperatures in the Netherlands, utilized through the ArcGis program as a proxy for the UHI effect (Fig. 4).’
Corrected figure and caption:
(corrected) Lichen species richness on individual Tilia × europaea trees (circles) at sampling location Keizersgracht (Fig. 1, location 11), with a heat-map overlay showing heat-stress indicated by perceived temperature in degrees Celsius (°C) during a hot summer day. This figure was made specifically as an example to indicate the local differences in urban heat stress and observed lichen species richness. Shade from canal buildings covers the southern side, but not the northern side of the canal. The exposed hotter northern side has noticeably more phorophytes with (very) low species richness (red) when compared with the shaded southern side of the canal and corresponds to hotter zones on a heat map. Xerophytes characterize the phorophytes bearing low species richness on the northern side, while bryophytes (Syntrichia sp.) dominate phorophytes bearing low lichen species richness on the southern side. We used perceived temperature as a proxy to indicate local differences in the UHI effect and observed lichen species richness, because the perceived temperature map had the highest available resolution (2 × 2 m) and represents urban heat stress more accurately than UHI-maps (10 × 10 m). Figure by Harold Timans and Joost de Bruijn. Heat-map based on: Esri Nederland, Klimaateffectatlas (2025, https://www.klimaateffectatlas.nl/nl/; for metadata see https://www.arcgis.com/home/item.html?id=61e098fb10754714adf492f301a493c2).


 Open access