


Rebellion and unrest have long been central subjects of inquiry for social scientists and historians. Social conflict reflects underlying discontent as well as competition over power disparities, contested values, perceptions of fairness, and expectations for the future. Because of its critical role in social transformation and long-term development (Skocpol Reference Skocpol1979; Thompson Reference Thompson1964; Tilly Reference Tilly1986), scholars have examined how conflict shapes phenomena as wide-ranging as state formation (Slater Reference Slater2010), political consciousness (Porchnev Reference Porchnev1963; Thompson Reference Thompson1971), regime durability (Levitsky and Way Reference Levitsky and Way2013), and identity and beliefs (Ladurie Reference Ladurie1966). Many early students of conflict focused on episodes of violence and unrest in early modern Europe, a period marked by rapid social, cultural, and economic change alongside the emergence of centralized states (Ladurie Reference Ladurie1966; Porchnev Reference Porchnev1963; Thompson Reference Thompson1971; Tilly Reference Tilly1986). Because of the historical importance and prominence of such disorder, as well as rapid improvements in data availability and processing, a branch of emerging scholarship has turned to reexamining rebellion and unrest in this era.Footnote 1
We contribute to this growing literature by focusing on eighteenth-century France in the run-up to the French Revolution. While the Revolution has played an outsized role in history and is one of the most studied political events of the past two centuries, the thousands of localized uprisings that erupted across the French territory in the preceding decades have received comparatively little attention. These rebellions often simmered and were periodically suppressed by state agents, yet they ultimately fed into the broader revolutionary upheaval. At the same time, the monarchy heavily invested in state-building throughout the eighteenth century (Burguière and Revel Reference Burguière and Revel1989). A central element of this effort was the expansion of the horse-post relay network, which nearly doubled in size over the period. These relays established attended lodging quarters and a well-prepared set of fresh horses for messengers carrying information for the royal administration where there had previously been no support. The horse post represented one of the primary means of consolidating the hierarchical French state’s informational capacity as it sought to rule and control a fragmented territory (Marchand Reference Marchand2006).
Did this intensive expansion of the state’s informational capacity through the horse-post relay network generate backlash among populations exposed to these state-building efforts? To investigate this question, we combine original data on the development of the horse-post relay network over the eighteenth century with a comprehensive database of rebellions in pre-Revolutionary France. Using a staggered difference-in-differences framework centered on parishes—the most granular territorial unit then—we show that the introduction of a new horse-post relay in a parish was associated with more local rebellions in subsequent decades. We attribute this finding mainly to the material consequences of state efforts at penetrating and ordering local society as it centralized and enhanced its informational capacity.
The increasingly present state that was behind and facilitated by new horse-post relays became a target of popular ire for its activities, such as heavy-handed efforts at forced conscription, tax enforcement, monopolization of the roads, and inflexible enforcement of royal acts and laws perceived as unfair (Aubert Reference Aubert2015; Nicolas Reference Nicolas2002). Accordingly, we find that horse-post relays were strongly associated with rebellions against agents with coercive powers to maintain and enforce order: the military, the police, and the judiciary. They were also associated with rebellions against various forms of taxation as well as rebellions by notables that had private interests along postal roads. Furthermore, while these relationships broadly prevail and encompass the lion’s share of rebellions, we also find a disproportionate response of rebellions to horse-post relays in places of pre-existing state fragmentation and territorial divisions. These findings demonstrate an increasingly powerful state that nonetheless struggled to control local activity across a heterogeneous territory as many of its efforts were contested.
Our empirical approach and additional data give us a unique opportunity to evaluate and challenge several alternative explanations—namely, the erosion of traditional social hierarchies, the role of war zones and war involvement, information and collective action possibly spurred by the contemporaneous letter-post system, changes in the recording of rebellions by police brigades (maréchaussée) charged with keeping order, and the contemporaneous transit infrastructure. These latter three alternatives are often challenging to dismiss in more commonly studied cases where communication and transportation networks are built together from scratch and can be widely used. In eighteenth-century France, however, the horse-post relay network was built atop existing transit routes and served as a state-monopolized communications network. Moreover, the development of police brigades and the letter-post system followed a different logic than the horse post.
Our findings have implications for the scholarly understanding of the co-evolution of states, order, and disorder, as well as for the vast corpus of work on the origins of the French Revolution. While greater state capacity may ultimately support political stability and order, the process of state-building itself can be disruptive to pre-existing social structures and contested, even for decades at a time. This process likely fueled the accumulation of grievances and repertoires of resistance that ultimately exploded during the Revolution.
THE LONG AND CONTESTED PROCESS OF STATE FORMATION
There is a broad, rich literature on state formation, including the emergence of states, state centralization and consolidation, and the exercise of power. This literature makes clear that building a strong state is a long, complex, and often contested process. As Elias (Reference Elias[1939] 1994) emphasizes, it has taken most states centuries to overcome powerful fragmented regional and religious elites that had private armies and taxation rights, and many states around the world still face fundamental weaknesses (Centeno et al. Reference Centeno, Kohli, Yashar and Mistree2017; Soifer Reference Soifer2015). In Europe, monarchies slowly absorbed feudal capacities as they centralized their administration and bureaucracy, a process that Elias (Reference Elias[1939] 1994) describes as not only coercive and political but also social, as regional consciousness declined and increasing state presence in society created “civilizing” norms of state control over the use of violence.
Weber (Reference Weber1968) prominently described the newly powerful states that ultimately resulted from this process as defined by a monopoly over the use of violence within their territory, which entails the legitimation of authority and a centralized hierarchy of administration that embodies and enforces a legal-rational domination of society. Subsequent seminal scholarship elaborated concepts, such as state capacity and autonomy (Evans, Rueschemeyer, and Skocpol Reference Evans, Rueschemeyer and Skocpol1985) and underscored the importance of a strong state to establishing and maintaining social order (Fearon and Laitin Reference Fearon and Laitin2003; Huntington Reference Huntington1968; Skocpol Reference Skocpol1979).Footnote 2
State formation in Europe advanced through both external pressures and internal incentives and innovations. Tilly (Reference Tilly1990) emphasizes how military and fiscal demands associated with regional competition and warfighting pressured early states to accelerate their efforts at centralization and extraction in order to build the capacity to wage war and defend their territory.Footnote 3 Eventually, state efforts to penetrate society and build capacity became fortified by institutional innovations that responded to disparate interests and in doing so, fostered greater compliance with extraction (Levi Reference Levi1989).
However, most states spent numerous decades and even centuries attempting to penetrate society and centralize control and administration. A core component of those efforts has been the expansion of transportation and communication routes to facilitate the penetration of the state’s reach into society and the administration of its territory. This is closely tied to what Mann (Reference Mann1984) termed infrastructural power—namely, the capacity of the central state to penetrate its territories and logistically implement its decisions. This implicates both the state’s material capabilities and its territoriality (Soifer Reference Soifer2008). As Mann (Reference Mann1984) underscores, infrastructural power can vary separately from the despotic power used to impose mandates over society. It can also be very uneven across the territory (Boone Reference Boone2003; Pierskalla, De Juan, and Montgomery Reference Pierskalla, De Juan and Montgomery2019).
Historically, states and empires built paths, stone roads, postal routes, ports, and canals to reach remote populations, transmit information and correspondence, and deploy military forces (Bulliet Reference Bulliet1990; Rogowski et al. Reference Rogowski, Gerring, Maguire and Cojocaru2022). Today, governments continue to build and improve roads in remote rural areas, expand railway networks, construct telecommunications infrastructure, and establish stations and outposts for their security apparatus. Alongside these efforts—and in some cases facilitated by them—states typically seek to centralize their administration, strengthen tax collection and police presence, and provide public goods as they broaden their ability to project power and penetrate more deeply into society (Centeno et al. Reference Centeno, Kohli, Yashar and Mistree2017; Lindvall and Teorell Reference Lindvall and Teorell2016; Müller-Crepon, Hunziker, and Cederman Reference Müller-Crepon, Hunziker and Cederman2021).Footnote 4
Disruption and Contention During State Centralization
While stronger states can effectively monopolize violence, enforce rules, and centrally administer territory and social groups (Weber Reference Weber1968), the process of state-building itself can be contested and contentious (Boone Reference Boone2003; Garfias and Sellars Reference Garfias and Sellars2022). We build on seminal theories of state formation that emphasize the development and consolidation of a centralized administrative network across the territory. Transportation and communication infrastructures that connect localities more directly to central government authorities enhance the ability of the state to penetrate society through the control and administration of local activity and rules, extraction in the form of taxation and military service, and the disruption of existing social relations and expectations. In France, as throughout Europe, this historic process entailed the extension of authority over—and even the absorption of—disparate regional nobles, lords, church authorities, and other elites (Elias Reference Elias[1939] 1994).
Our focus, however, highlights how this process was characterized by frictions with society more broadly, and to a lesser degree, by frictions with regional elites. Indeed, the material consequences of increased but incomplete state power can generate social contestation and popular resistance stemming from the greater local capacity of the state to enforce taxes, carry out rules of justice, and conscript civilians into military service. It can also result from the crowding out of private interests and activities in spaces that the state comes to dominate. These consequences of state expansion disrupt status-quo activities and expectations, generating grievances.Footnote 5 At the same time, the state may lack sufficient coercive power and legitimacy to deter popular challenges, a dynamic that has been documented in other contexts of state-building (e.g., Pruett Reference Pruett2024).
The extent of contestation stirred by state efforts at expansion and centralization may also vary across the territory in accordance with pre-existing fragmentation in authority and administration. Centralizing states routinely encounter regional divisions linked to historical competing authorities and power centers across their territorial expanse, which can, as Migdal (Reference Migdal1988) highlights, condition the interactions between society and the state. That poses a challenge to the state’s ability to effectively penetrate and order society in a consistent fashion across space and can raise regionalized grievances and backlash. This raises the potential for the link between state-building and unrest to be characterized at least in part by heterogeneity across space in accordance with fragmentation.
We explore these dynamics in pre-Revolutionary France, where increased connectivity and penetration of society associated with state centralization fostered disruption and social unrest. While this relationship prevailed across the entire French territory, it also varied to some extent with pre-existing administrative fragmentation: where fragmentation mapped onto historic disparities in the mode of ruling and extent of intended extraction by the state, opposition to the state’s imposition of central authority through new horse-post relays varied accordingly.
STATE-BUILDING AND REBELLION IN THE RUN-UP TO THE FRENCH REVOLUTION
Eighteenth-century France remained an overwhelmingly rural society, undergoing gradual yet profound transformations with deep historical roots (Ladurie Reference Ladurie1966). In the countryside, the state, the nobility, and the Church competed for dominance, generating persistent frictions and local conflicts. By Lefebvre’s (Reference Lefebvre1947) classic account, this competition gave rise to a dense web of taxes, tithes, and seigneurial dues that weighed increasingly heavily on the peasantry in run-up to the Revolution. Canonical studies have examined how these burdens spurred grievances and uprisings, and resulted in a revolution (de Tocqueville Reference de[1856] 2010; Shapiro and Markoff Reference Shapiro and Markoff1998). Recent scholarship points to additional factors behind peasant revolts during this period, such as adverse climatic shocks (Chambru Reference Chambru2019; Waldinger Reference Waldinger2024) and the degree of centralization of the tax collection system (Degrave Reference Degrave2023).
There is broad consensus, however, that the monarchy made significant strides during this period in centralizing and extending its authority, as its influence spread across the kingdom and into peripheral provinces (Burguière and Revel Reference Burguière and Revel1989). As the state expanded and assumed a more prominent role in controlling daily life—though still far from an all-encompassing one—it disrupted the delicate balance of relationships, obligations, and expectations that had long structured society. A key element of this expansion was the monarchy’s exclusive communication network: the horse post (poste aux chevaux).
The Functioning of the Horse-Post Relay Network
From its inception under Louis XI in the late 1470s, the horse post served as a pivotal state-building instrument of the royal authority to consolidate its informational capacity across the kingdom, particularly in its outlying provinces (Marchand Reference Marchand2006, 183–221).Footnote 6 This infrastructure consisted of a nationwide network of relays where horse-post messengers (postillons) could exchange their horses for fresh ones in order to ensure the rapid transportation of directives, reports, and other communications of the royal administration (Jamaux-Gohier Reference Jamaux-Gohier2001; Marchand Reference Marchand2006; Gazagnadou Reference Gazagnadou2013, 109–16). Relays were spaced at regular intervals of 10–15 kilometers, allowing riders to switch horses after an hour or two of travel. This system enabled postillons to maintain high speeds while minimizing the risk of injury to the horse, in line with their physiological limits (Minetti Reference Minetti2003).Footnote 7 The horse-post relay network was connected by a road infrastructure maintained by the Bridges and Roads (Ponts et Chaussées) administration, which operated independently of the horse post (Arbellot Reference Arbellot1973).
Located at the entrances to towns or at rural crossroads, horse-post relays were relatively large buildings—comprising stables, lodging quarters, and often a tavern—that stood out prominently in the rural landscape (see Panel a of Figure 1). The postillons who galloped postal roads day and night were typically young local laborers, easily identifiable by their distinctive uniforms: a royal-blue vest, a round leather hat, leather breeches, heavy black boots, and an arm badge bearing the name of their relay (Jamaux-Gohier Reference Jamaux-Gohier2001, 237–40; Marchand Reference Marchand2006, 258–64). Their horses, bred in royal stud farms, were superior to those of private horse renters and bore distinctive markings, such as a knotted or trimmed tail (Jamaux-Gohier Reference Jamaux-Gohier2001, 262–7; Marchand Reference Marchand2006, 270–5). Together, postillons’ uniforms and horses made them instantly recognizable in the public space (see Panel b of Figure 1).
Depictions of the Horse Post
Note: This figure displays contemporary depictions of an eighteenth-century horse-post relay in Panel a and a postillon galloping two horses back to a relay in Panel b. Sources: in Panel a, lithography by Victor-Jean Adam and Louis-Philippe-Alphonse Bichebois, based on a painting of Jean-Antoine Duclaux, La malle au relai [sic], 1817; in Panel b, painting of the French School, Postillon en livrée ramenant deux chevaux au galop, mid-nineteenth century. © Musée de La Poste, La Poste, photographs by Thierry Debonnaire.

In addition to the short distance between relays—which allowed for frequent changes of horses—a series of regulations enabled the horse-post system to achieve a higher speed of information transmission than alternative postal systems available to the general public, such as the letter post or private messenger companies (Jamaux-Gohier Reference Jamaux-Gohier2001, 100–8).Footnote 8 Indeed, postillons held a monopoly on galloping and on traveling at night on roads connecting relays, which were generally better maintained by the Bridges and Roads administration than other roads and directly connected to administrative centers (Arbellot Reference Arbellot1973, 766). The horse post also held a monopoly on horse rentals along these roads, effectively preventing private travelers from switching horses when traveling along them.Footnote 9 In addition, it had priority access to hay for feeding horses and the right of passage on congested roads. Postmasters (maîtres de postes) profited substantially from these privileges and were quick to report violations to their intendant—the provincial representative of the monarchy—who usually swiftly enforced these regulations (Vaillé Reference Vaillé1953, 166–70; Jamaux-Gohier Reference Jamaux-Gohier2001, 101–4).
The establishment of horse-post relays provided the opportunity for the royal authority to form alliances with and co-opt local elites who came to serve as postmasters. Postmasters were typically recruited among wealthy local notables—bourgeois farmers and innkeepers aspiring to noble status (Jamaux-Gohier Reference Jamaux-Gohier2001, 189–94; Marchand Reference Marchand2006, 223–8). Each held a postal certificate (brevet de poste) that granted them the exclusive right to operate a given relay. The certificate imposed several obligations on postmasters: they were required to reside at the relay, to manage their relay directly (faire-valoir direct) and not farm out its operations, and to maintain its proper functioning—such as keeping at least five or six healthy horses available at all times. In addition, they were expected to serve as intelligence agents and auxiliary police on behalf of the central administration (Vaillé Reference Vaillé1953, 268–71; Marchand Reference Marchand2006, 210–4). Their duties included monitoring passengers passing through the relay—by the late eighteenth century, this involved keeping records of names, occupations, and destinations—as well as reporting notable local political events to their intendant.
Overall, the horse-post relay network positioned the state as the sole authority controlling rapid communications in France, significantly expanding its ability to monitor society and exert control over its territory.
Consequences of the Horse Post for Local Order and Rebellion
The development of the horse-post relay network had several distinct consequences. At the national level, it enabled the rapid communication essential to the effective functioning of the state. For instance, it allowed central officials, tax farmers (fermiers généraux), and provincial intendants and local tax officials (élus) to coordinate swiftly through directives, reports, and fiscal orders on matters of tax collection and enforcement. That included efforts to suppress salt smuggling (faux-saunage) across the kingdom’s disparate and consequential salt-tax zones (gabelles). This coordination required frequent and timely exchanges between central administrators and local agents, who were responsible for estimating tax yields and implementing their collection (Caillou Reference Caillou2005, 177–293; Deharbe Reference de2010, 243–344). The speed of communication was especially critical in times of crisis, such as in the aftermath of natural disasters (Favier Reference Favier and Legay2007). The horse-post system also facilitated the transmission and enforcement of military recruitment orders, enabling directives to travel efficiently from central authorities to intendants and onward to local recruitment and conscription officers (Corvisier Reference Corvisier1964, 147–61).
Beyond these nationwide implications, the expansion of the horse-post relay network disrupted local social equilibria. A range of local actors benefited from these developments. Chief among them were postmasters. In addition to the profits they derived from their exclusive right to operate a relay, postmasters enjoyed a wide range of privileges, including substantial exemptions from taxation—most notably, from the onerous taille—as well as relief from military obligations, from accommodating passing soldiers, and from churchwarden responsibilities (Demangeon Reference Demangeon1995, 44–8; Tonnaire Reference Tonnaire2005, 48–59). They were also exempt from taxes on ancillary activities tied to relay operations, such as the sale of wine in the relay’s tavern. These material advantages fostered broad loyalty to the monarchy among postmasters (Vaillé Reference Vaillé1953, 233–48; Jamaux-Gohier Reference Jamaux-Gohier2001, 189–235; Marchand Reference Marchand2006, 200–46).Footnote 10 Other local groups also derived material benefits from the introduction of horse-post relays: innkeepers benefited from the increased traffic along roads connecting relays (Tonnaire Reference Tonnaire2005, 59–63), and families allied with postmasters often enhanced their local influence through closer ties to representatives of the royal authority (Tonnaire Reference Tonnaire2005, 48).
Local elites also likely benefited from the establishment of horse-post relays, as improved communication with provincial and central authorities may have enhanced their influence and elevated their status. For instance, historical accounts suggest that tax agents often relied on the knowledge and assistance of local notables as they traveled along the relay network in preparation for their annual round of tax collection (Caillou Reference Caillou2005, 177–293; Deharbe Reference de2010, 243–344). These interactions may have fostered mutually beneficial relationships, reinforcing the authority of local elites and further integrating them into the state’s administrative and logistical apparatus. Local notables may also have engaged with military officials and royal agents passing through or lodging at relays, for instance, by sharing local information, though such ties were likely kept discreet and remain difficult to corroborate in historical records.
By contrast, the various monopolies associated with the horse post crowded out competing private interests. First and foremost, horse-rental businesses were severely disrupted by the ban on renting their horses along roads connecting horse-post relays. Indeed, examples of horse renters attempting to violate this ban abound (e.g., Jamaux-Gohier Reference Jamaux-Gohier2001, 101–4).Footnote 11 Local farmers and innkeepers situated off postal roads also lost out, as postmasters had priority access to hay and animal fodder for their relays—a shortage potentially worsened by the increased demand brought on by rising traffic along postal roads (Tonnaire Reference Tonnaire2005, 61–4). More broadly, the monopolization of these roads by the monarchy through the horse post imposed constraints on travelers as privately owned horses were restricted to trotting during daytime and could not be exchanged at horse-rental establishments.Footnote 12
Additional social groups, such as commoners, peasants, and merchants, may have also lost out with the establishment of horse-post relays as they brought increased surveillance and stricter enforcement of state regulations. Indeed, enhanced state communication through the horse-post relay network likely made it easier for authorities to monitor and enforce tax collection, military conscription, and judicial decisions. In addition, local residents could have been subjected to new burdens, including maintaining postal roads through the unpaid labor system of the corvée (Tonnaire Reference Caillou2005, 65–86; Conchon Reference Conchon2016).
We hypothesize that these disruptions to local society fueled grievances, and eventually rebellion, though the material consequences of a new horse-post relay likely took time to fully materialize and for discontent to boil over. Adverse events such as repeated food shortages, tax enforcement campaigns, labor requisitions, or conscription orders, combined with policy changes such as tax increases or stricter judicial procedures or penal codes, could have tipped simmering discontent into open rebellion. State agents who contributed to—or were perceived as contributing to—these pressures could have become targets of local hostility. Counterfactual parishes that did not host new horse-post relays were less exposed to such state intrusion and thus avoided the same stratifying pressures that divided communities into winners and losers of state centralization. Hence, residents of these parishes may not have experienced these adverse events to the same degree, and where they did experience them, they might have been less inclined to attribute them to the presence or actions of state agents.
Several rebellious events in our data exhibit just such reactions against state agents and activities. One example occurred in 1781 in the town of Mirande, in the southwestern généralité of Auch. A decade earlier, the establishment of a new horse-post relay marked a deeper state presence in this formerly isolated region of the kingdom, as before the 1770s, this généralité had only two relays, in Pau and Orthez. Military recruitment in the area had long been among the lowest in France, but the increased needs resulting from the Anglo-French War (1778–83) brought renewed scrutiny to local enlistment.Footnote 13 In this context, the new horse-post relay facilitated information gathering on draft-eligible men. In 1781, as the subdélégué (the local representative of the monarchy), military officers, and local notables assembled in Mirande to conduct a conscription draw, draft-eligible peasants and farmers emerged from the forest with sticks and knives, shouting at the authorities, “They should all be killed!” A confrontation over draft resistance followed, resulting in several arrests before a local notable managed to defuse the situation.
A rebellion in the coastal town of Blaye in Gironde in 1783, just three years after the introduction of a horse-post relay, offers another revealing example. Members of a patache brigade—widely despised mobile tax-farming agents charged with collecting gabelles and seizing contraband—attempted to inspect the load of a Breton ship.Footnote 14 Following the establishment of a series of new relays connecting La Rochelle to Bordeaux along the eastern shore of the Gironde Estuary in the early 1780s, patache patrol boats began to more closely monitor maritime commerce in the region, including in Blaye. When the patache approached, the ship’s crew resisted inspection and joined forces with local residents to stone the patache agents once ashore at the encouragement of the ship’s captain and the owner of the merchandise. Members of the crew denounced the patache brigade as an “enemy of society” that had come to “outrage citizens” who were merely going about their usual business. In short, heightened tax enforcement facilitated by the recent expansion of the horse-post relay network sparked a wave of local resentment that quickly escalated into open resistance.
Other examples illustrate how the introduction of horse-post relays could have crowded out private interests. About a decade after a series of relays was established along the route between Dijon and Auxerre, members of the local bourgeoisie complained that inns near the new relays were monopolizing supplies of food and animal fodder (Tonnaire Reference Tonnaire2005, 63–4). In response, the subdélégué issued a ban preventing innkeepers from making early purchases at local markets to preserve access for other buyers—setting, for instance, an 8 a.m. cutoff in Avallon. Tensions between innkeepers and the bourgeoisie escalated, and although the restriction remained in place despite numerous complaints from innkeepers, many of the underlying grievances persisted. In another such example in 1775 in Picardy, in the context of the Flour War, a crowd of townspeople in Chauny attacked and ransacked the local horse-post relay on rumors that the postmaster had stockpiled wheat despite the local shortage. A detachment of troops was unable to stop the crowd.
Of course, horse-post relays could have impacted rebellion through other channels beyond those illustrated in these examples. For instance, they could have generated local income shocks, disrupted traditional social hierarchies, introduced more policing, and called attention to the recording and registration of rebellious activities. We examine these and other potential alternative mechanisms below.
DATA
Our analysis dataset comprises a panel of 35 thousand parishes of the kingdom of France as of 1789—except for Corsica—spanning eight decades from the 1710s to the 1780s. Parishes were the smallest units of administration in Ancien Régime France and no prior study has analyzed this period at such a granular level.Footnote 15 Further details on data sources are provided in the Data Appendix section of the Supplementary Material. For replication data, see Albertus and Gay (Reference Albertus and Gay2025).
The Horse-Post Relay Network
To document the development of the horse-post relay network over the eighteenth century, we construct an original historical geographic information system (GIS) based on administrative sources.Footnote 16 Beginning in 1708, the General Superintendent of Posts had a list of horse-post relays printed and updated annually: the Liste générale des postes de France (Arbellot Reference Arbellot1980, 100–2; Reference Arbellot1992, 110–4). This publication was designed to provide state messengers with the locations of horse-post relays together with distances between them. Each Liste des postes was organized by itinerary, with departure and destination relays clearly marked.Footnote 17 Distances were reported in postes—a measure of distance equivalent to 8–12 kilometers (Bretagnolle and Verdier Reference Bretagnolle and Verdier2006, 68–9).Footnote 18
We digitized one edition of the Liste des postes per decade from the 1710s through the 1790s.Footnote 19 From each edition, we extracted all the segments between relays as listed by itinerary and matched each location to the corresponding parish. We then reconstructed itineraries by drawing straight lines between successive relays and combining the resulting segments. Figure 2 displays the spatial distribution of the horse-post relay network at the beginning and end of our period of analysis.Footnote 20 We also report the number of horse-post relays along with the length of associated postal roads for each edition of the Liste des postes included in our sample in Panel a of Figure 3.
The Horse-Post Relay Network
Note: This figure displays the horse-post relay network based on the 1714 and 1790 editions of the Liste des postes. Horse-post relays correspond to black dots while horse-post roads, to red segments. The underlying shapefile of the kingdom of France as of 1789 is based on Gay, Gobbi, and Goñi’s (Reference Gay, Gobbi and Goñi2024a) jurisdictions database.

The spatial configuration of the horse-post relay network at the beginning of the eighteenth century reflected the monarchy’s long-standing strategic and military concerns vis-à-vis neighboring adversaries, consistent with accounts of subnational state-building efforts that emphasize responses to prevailing geopolitical and bellicist threats (Boone Reference Boone2003; Tilly Reference Tilly1990). In the late fifteenth century, relays were established in Bordeaux, Dijon, Lyon, Arras, and Amiens due to their strategic positions relative to the Kingdoms of Spain and England, the Duchies of Burgundy and Savoy, the County of Flanders, and the Holy Roman Empire (Gazagnadou Reference Gazagnadou2013, 112). During the sixteenth century, postal routes expanded toward the kingdom’s borders, with relays established in Bayonne under Louis XII and in Nantes under Henry III. This strategic expansion continued throughout the seventeenth century, following territorial conquests: northeastward to Strasbourg after the Peace of Westphalia (1648), southwestward to Narbonne after the Treaty of the Pyrenees (1659), and eastward to Besançon after the Treaties of Nijmegen (1678–79) (Marchand Reference Marchand2006, 186–8). These strategic and military concerns led to a center-periphery logic resulting in a star-shaped network radiating from Paris and reinforced by key nodes along the kingdom’s borders.Footnote 21
In contrast, the eighteenth century was a period of internal densification of the horse-post relay network (Bretagnolle and Verdier Reference Bretagnolle and Verdier2005; Reference Bretagnolle, Verdier and Roux2007; Verdier Reference Verdier2009). By then, the horse post had become a key instrument in the monarchy’s strategy to assert a more uniform and centralized control over the territory and to project its power into the remotest parts of the kingdom (Marchand Reference Marchand2006, 189).Footnote 22 The network first densified in the north following the permanent establishment of the royal court at Versailles in 1682 and the consolidation of the kingdom’s territorial boundaries. From the mid-eighteenth century onward, the network expanded around regional centers, such as Bordeaux, Lyon, Dijon, Toulouse, and Rennes. By the end of the century, the horse post had evolved into a national network structured around the political center in the north and connected to secondary centers, creating the conditions for the emergence of an integrated city system (Bretagnolle and Franc Reference Bretagnolle and Franc2017).
Evolution of the Horse-Post Relay Network
Note: Panel a displays the evolution of the number of horse-post relays and the length of postal roads in kilometers from 1714 to 1790. Panel b displays the mean and standard deviation of the distance from the 35 thousand parishes in our sample to the nearest horse-post relay in kilometers. Horse-post relay data are based on various editions of the Liste des postes.

We quantify the expansion of the horse-post relay network over the eighteenth century in Panel a of Figure 3. The network grew steadily, essentially doubling both in length and density over the period. Whereas in 1714, it comprised 841 relays spanning 11 thousand kilometers of postal roads, by 1790, it had expanded to 1,403 relays covering 24 thousand kilometers.Footnote 23 This expansion substantially improved local accessibility to the network, as the average distance between a parish and the nearest relay decreased from 22 kilometers in 1714 to 13 kilometers in 1790, as shown in Panel b of Figure 3. These gains were spread across all parishes, as the standard deviation of this distance also fell from 26 to 13 kilometers.Footnote 24 More broadly, the proportion of parishes located near a horse-post relay rose substantially, from 18% in 1714 to 31% in 1790.Footnote 25
However, the development of the horse-post relay network was not entirely linear as it was periodically reconfigured at the local level (Bretagnolle and Verdier Reference Bretagnolle, Verdier and Roux2007; Verdier Reference Verdier2009). While net gains amounted to 562 relays over the eighteenth century, this reflected the creation of 1,001 relays and the retirement of 439 of them.Footnote 26 In particular, substantial reconfigurations occurred in the interior of the country in the 1740s and 1750s—between Bordeaux and Limoges, Bordeaux and Poitiers, Poitiers and Tours, and Lyon and Clermont-Ferrand. These reconfigurations were generally driven by local practical considerations, such as the retirement of a postmaster or the development of nearby roads in better condition (Arbellot Reference Arbellot1980, 106).Footnote 27 A comparison of the spatial distribution of newly established and retired relays by decade reveals that retired relays were, on average, 11 kilometers away from the nearest new relay.
While the initial configuration and expansion of the horse-post relay network were largely shaped by national strategic considerations, its local development over the eighteenth century was driven by practical constraints. Beyond the quality of the road network, the specific placement of relays was primarily determined by the need to maintain regular 10–15 kilometer intervals—reflecting the physiological limits of horses (Minetti Reference Minetti2003). As a result, many relays were located in small towns and villages situated along routes between administrative centers, often on riverbanks or on foothills.Footnote 28 Accordingly, about one-third of relays were located in cities with more than two thousand inhabitants—typically administrative centers—while nearly half were in towns with fewer than a thousand inhabitants, and 19% in villages with fewer than five hundred inhabitants.Footnote 29 Horse-post relays established after 1714 were even more likely to be located in smaller towns and villages.
Summary statistics on the horse-post relay network at the parish-decade level are reported in Panel A of Table 1.Footnote 30
Summary Statistics across Parish-Decades

Note: This table reports summary statistics for the main variables used in the analysis, excluding the city of Paris. The unit of observation is a parish-decade from the 1710s to the 1780s. There are 282,288 parish-decade observations in the dataset. State authorities include the fiscal, military, and judiciary authorities. Non-state authorities include the nobility, seigneurial and municipal authorities, and the Church.
Rebellions
We collect data on eighteenth-century rebellions from the Jean Nicolas survey (Nicolas Reference Nicolas and Nicolas1985; Reference Nicolas2002).Footnote 31 Compiled from extensive archival research conducted from the early 1980s to the late 1990s, this survey documents 8,516 rebellions that occurred between 1661 and 1789 (Gay Reference Gay2025, 7–11). It focuses on popular uprisings aimed at challenging authorities, protesting subsistence crises, or resisting state and local policies and actions—it excludes brigandage and strictly criminal activities. The survey sets an inclusive threshold, recording any uprising that lasted only a few hours or involved as few as four individuals. These criteria thus cast a wide net, making the Jean Nicolas survey an unparalleled thermometer of the rebellious fever that swept through France in the run-up to the Revolution.
Figure 4 depicts trends in rebellious activity between 1714 and 1789, our period of analysis. Rebellions began to intensify in the 1740s before accelerating sharply in the 1760s, with more than a hundred events per year from that point onward. This escalation coincided with the growing presence of the state across the territory and rising levels of taxation (Burguière and Revel Reference Burguière and Revel1989).Footnote 32 Rebellious activities further intensified until the outbreak of the Revolution. Their territorial spread—over about three thousand locations—is shown in Figure 5.Footnote 33
Annual Number of Rebellions
Note: This figure displays the annual number of rebellions from 1714 to 1789 based on Nicolas’s (Reference Nicolas2002) original survey along with a decade-moving average.

We digitized all forty thousand original coding sheets of Nicolas’s (Reference Nicolas2002) survey to construct a comprehensive database of the 6,000 rebellions that took place in 3,172 parishes within the boundaries of the kingdom of France between 1714 and 1789.Footnote 34 In addition to recording the date and location of each event, we also collected information on its motives, size, and the characteristics of its participants.Footnote 35 To measure rebellious activity, we create a variable that counts the number of rebellions per parish and decade. We report summary statistics in Panel B of Table 1.Footnote 36
Spatial Distribution of Rebellions (1714–89)
Note: This figure displays the spatial distribution of rebellions from 1714 to 1789 based on Nicolas’s (Reference Nicolas2002) original survey. Each point corresponds to a parish that experienced at least one rebellion over the period—6,000 rebellions across 3,172 parishes in total. The underlying shapefile of the kingdom of France as of 1789 is based on Gay, Gobbi, and Goñi’s (Reference Gay, Gobbi and Goñi2024a) jurisdictions database.

Nearly half of all rebellions (46%) that occurred from 1714 to 1789 were of moderate size, involving between 11 and 50 participants. Another 21% were relatively large, with more than 50 participants. State authorities were targeted in 60% of rebellions, while 11% were directed against non-state actors—the nobility, seigneurial and municipal authorities, and the Church. Among rebellions against the state, most were aimed at taxation (66%), followed by the military (19%) and the judiciary (23%).Footnote 37 Finally, 69% of rebellions in our sample include information on the social categories of their participants. Among these, 39% involved laborers; 32%, craftsmen; 23%, notables; and 22%, socially marginalized individuals.Footnote 38 The rebellions in our dataset thus span a broad range of the social strata of French society.
While Nicolas’s (Reference Nicolas2002) survey remains the most comprehensive source of rebellious activity in France prior to the Revolution, its use requires careful attention to potential gaps and reporting biases common to historical data (Gay Reference Gay2025, 29–46). These include not only the archival recording of events, but also the possibility that the establishment of a horse-post relay may have increased the capacity of state or local authorities to record rebellions. We address these concerns below by assessing the robustness of our results to these potential sources of bias, showing that they are unlikely to account for our findings.
Administrative and Territorial Divisions
Central for our empirical strategy, parishes were embedded within a hierarchical system of administrative and territorial divisions. The largest of these were généralités. Created in the fourteenth century, these broad territorial divisions served as the basis for the administration of the territory under the authority of intendants (Gorry Reference Gorry and Zadora-Rio2014). On the eve of the Revolution, there were 32 généralités.Footnote 39 Subdélégations were territorial divisions established in the mid-seventeenth century as subdivisions of généralités to extend the territorial reach of the royal authority at the local level. The prerogatives of subdélégués—the royal agents who administered subdélégations under the authority of the intendant of their généralité—increased during the eighteenth century to encompass the fiscal, military, economic, social, and sanitary administration of their territory (Goubert, Arbellot, and Laclau Reference Goubert, Arbellot, Laclau, Nordman, Ozouf-Marignier and Laclau1989). By 1789, there were nearly 700 subdélégations. A more localized territorial unit was the canton, which held various electoral and judicial functions (Ozouf-Marignier, Graziani, and Bonin Reference Ozouf-Marignier, Graziani, Bonin, Nordman, Ozouf-Marignier and Laclau1989). Alongside parishes, cantons represented the most granular level of administration, totaling over 4,500.Footnote 40 Although they were only formally created in 1790 along with départements and districts, their territorial scope closely reflected pre-existing patterns of local interaction and daily exchange between parishes (Tanguy, Le Bihan, and Lagadec Reference Tanguy, Bihan and Lagadec2009). At the median, each généralité had 988 parishes, 782 thousand inhabitants (as of 1793), and covered a radius of 70 kilometers; each subdélégation had 39 parishes, 31 thousand inhabitants, and a radius of 15 kilometers; and each canton had 7 parishes, 5 thousand inhabitants, and a radius of 6 kilometers.
Other Data
We supplement our parish-level data with additional sources, although data for this time period remain relatively sparse. Our research design explicitly accounts for this constraint. In particular, we construct a parish-level measure of decade-average wheat prices based on data from Ridolfi (Reference Ridolfi2019), so as to control for shifting local economic conditions and for potential income shocks associated with the local development of the horse-post relay network—subsistence crises and broader changes to the price of staple foods were common triggers of collective action in eighteenth-century France (Bouton Reference Bouton1993; Chambru Reference Chambru2019; Markoff Reference Markoff1985).Footnote 41 In addition, we measure the size of each parish by its population in the 1793 census—the first census conducted in France. We also assess the connectivity of parishes to the road network based on Cassini’s maps published in 1756–90. Furthermore, we determine whether a parish served as the seat of an administrative division, and we collect information on the type of gabelle taxation regime to which it was subject. Finally, we construct a historical GIS of both the letter-post system and maréchaussée brigades, which we describe in more detail below.
RESEARCH DESIGN
The substantial variation in rebellious activity and the expansion of the horse-post relay network over the eighteenth century offer a unique opportunity to examine how state-building efforts affected unrest in the run-up to the French Revolution. Our primary estimand of interest is the causal effect of the establishment of a horse-post relay in a parish on subsequent rebellious activity in that parish over time. While rebellions ultimately stem from social and economic changes, the introduction of a relay could have triggered these changes and their associated grievances.
We employ a staggered difference-in-differences design that compares changes in rebellion in parishes that received (or lost) a horse-post relay to those that would later receive (or lose) one. This strategy accounts for fixed parish-level characteristics that might influence both the likelihood of receiving a relay and the propensity for rebellion, such as a prior history of political activism, ease of collective action, the structure of civil society, or the presence of natural resources. It relies on the identifying assumption that, absent the introduction of a relay, parishes that received a new relay and those that did not would have followed parallel trends in rebellion. While this assumption is fundamentally untestable, we assess its plausibility through event-study regressions below.
Our treatment is staggered, binary, and non-absorbing, as parishes could both enter and exit treatment over time. Within our sample, 33,602 parishes (95.2%) were never treated—they never hosted a horse-post relay between 1714 and 1789. Another 586 (1.7%) were always treated—they maintained a relay throughout the period. The remaining 1,099 (3.1%) were “ever treated” parishes that experienced at least one change in treatment status over time. Of these, 203 (18.5%) began with a relay in 1714 but lost it at some point, while 896 (81.5%) entered treatment at least once. Among the latter, 387 (43.1%) exited treatment at least once.Footnote 42
To account for the specific features of this empirical design, we follow de Chaisemartin and D’Haultfœuille (Reference de Chaisemartin and D’Haultfœuille2024), which provide consistent and unbiased estimators for staggered difference-in-differences models in which treatment effects may be heterogeneous as well as dynamic over time.Footnote 43 Specifically, de Chaisemartin and D’Haultfœuille’s (Reference de Chaisemartin and D’Haultfœuille2024) approach estimates period-specific average treatment effects $ {\delta}_{\ell } $
of having been treated rather than untreated for
$ {\delta}_{\ell } $
of having been treated rather than untreated for $ \ell $
periods by comparing switchers to not-yet switchers with the same period-one treatment.Footnote 44 This setup also ensures that the coefficients are not “contaminated” by assuming continual exposure when parishes could exit treatment. We implement this approach at the parish-decade level by estimating the following regression equation:
$ \ell $
periods by comparing switchers to not-yet switchers with the same period-one treatment.Footnote 44 This setup also ensures that the coefficients are not “contaminated” by assuming continual exposure when parishes could exit treatment. We implement this approach at the parish-decade level by estimating the following regression equation:
 $$ \begin{array}{r}{\mathrm{rebellions}}_{pda}={\alpha}_p+{\lambda}_d+{\displaystyle \sum_{\begin{array}{c}\ell =-t\\ {}t\ne 0\end{array}}^{+T}}{\delta}_{\ell}\times \unicode{x1D7D9}[{\mathrm{horse}\_\mathrm{post}}_{pd}=1]\\ {}\times \unicode{x1D7D9}[d=\ell ]+{\mathrm{prices}}_{pd}+{\gamma}_{da}+{\varepsilon}_{pda,}& \end{array} $$
where $ {\mathrm{rebellions}}_{pda} $
denotes the number of rebellions that occurred in decade d and parish p that is part of administrative division a. Index d ranges from 1 to 8, corresponding to decades 1710 to 1780. The indicator variable
$ {\mathrm{rebellions}}_{pda} $
denotes the number of rebellions that occurred in decade d and parish p that is part of administrative division a. Index d ranges from 1 to 8, corresponding to decades 1710 to 1780. The indicator variable $ {\mathrm{horse}\_\mathrm{post}}_{pd} $
equals one if parish p hosted a horse-post relay in decade d.
$ {\mathrm{horse}\_\mathrm{post}}_{pd} $
equals one if parish p hosted a horse-post relay in decade d. $ {\alpha}_p $
denotes parish fixed effects;
$ {\alpha}_p $
denotes parish fixed effects; $ {\lambda}_d $
, decade fixed effects;
$ {\lambda}_d $
, decade fixed effects; $ {\mathrm{prices}}_{pd} $
, average wheat prices in parish p and decade d; and
$ {\mathrm{prices}}_{pd} $
, average wheat prices in parish p and decade d; and $ {\gamma}_{da} $
, decade-by-administrative division fixed effects, where we alternatively consider subdélégations and cantons. This last term enables the coefficients
$ {\gamma}_{da} $
, decade-by-administrative division fixed effects, where we alternatively consider subdélégations and cantons. This last term enables the coefficients $ {\delta}_{\ell } $
to be identified through the comparison of parishes within the same administrative division, thus accounting for administrative division-specific time trends. We cluster standard errors at the parish level.
$ {\delta}_{\ell } $
to be identified through the comparison of parishes within the same administrative division, thus accounting for administrative division-specific time trends. We cluster standard errors at the parish level.
An important practical consideration is the timing of the assignment of horse-post relays and rebellions. Our baseline approach links rebellions in a given decade to the edition of the Liste des postes published at the beginning of that decade. For instance, for the 1720 decade, we use the 1721 edition of the Liste des postes together with rebellions that occurred between 1721 and 1730.Footnote 45 A second consideration is the number of leads (t) and lags (T) to include in the estimation. While de Chaisemartin and D’Haultfœuille’s (Reference de Chaisemartin and D’Haultfœuille2024) methodology allows for up to three leads and seven lags in our setting, the preferred number of leads and lags should ensure that the estimation is based on a sufficiently comparable sample of switchers. While we report estimates for the full range, our preferred specification follows de Chaisemartin and D’Haultfoeuille’s (Reference de Chaisemartin and D’Haultfœuille2024, 39–40) rule of thumb, which recommends including only those leads and lags for which at least half of ever-treated parishes contribute to the estimation. This corresponds to including two leads and three lags in our setting.
IDENTIFICATION
A causal interpretation of estimates resulting from Equation 1 requires that the development of the horse-post relay network be exogenous with respect to rebellion dynamics at the parish level. As discussed above, the initial spatial configuration of the network reflected long-standing strategic political and military concerns (Panel a of Figure 2). In contrast, its development over the eighteenth century was primarily driven by the state’s efforts to expand and centralize its authority across the interior of the kingdom, resulting in the densification of the network around major regional nodes (Panel b of Figure 2).Footnote 46 However, the opening of new horse-post relays in growing urban centers may have been endogenous to population dynamics—a potential determinant of rebellious activity. To address this concern, our preferred specification exploits local variation through decade-by-administrative division fixed effects ( $ {\gamma}_{da} $
). Indeed, while the establishment of a relay in an urban center may be endogenous, the precise location of a relay between regional nodes was ultimately constrained by the need to establish rest stops every 10–15 kilometers due to the physiological limits of horses (Minetti Reference Minetti2003).
$ {\gamma}_{da} $
). Indeed, while the establishment of a relay in an urban center may be endogenous, the precise location of a relay between regional nodes was ultimately constrained by the need to establish rest stops every 10–15 kilometers due to the physiological limits of horses (Minetti Reference Minetti2003).
We illustrate this argument in Figure 6, which maps the postal route between Auxerre and Dijon—two regional centers and subdélégation seats in Burgundy that hosted horse-post relays throughout the eighteenth century. Since the early seventeenth century, this route had run northbound along pre-existing roads and waterways via the subdélégation seat of Montbard and eleven additional relays, spaced 11 kilometers apart on average (Nougaret Reference Nougaret1960, 30–2). However, only two of these were located in the most populous parishes of their respective cantons; the remaining nine were located in villages with fewer than five hundred inhabitants. This relay configuration formed a relatively straight route, minimizing the travel distance between the two regional centers. And although the road passed right near the subdélégation seat of Bussy-le-Grand, no relay was ever established there. In 1742, this postal route was rerouted southward through the subdélégation seat of Vitteaux and ten other relays, following road improvements carried out in the early 1730s (Nougaret Reference Nougaret1960, 32, 125–6; Tonnaire Reference Caillou2005, 98–9). As before, relays were spaced 11 kilometers apart on average, and only three of these relays were located in the most populous parishes of their respective cantons; the remaining seven were located in villages with fewer than five hundred inhabitants. This new configuration also formed a relatively straight route, minimizing travel distance between the two regional centers.
The Horse-Post Road from Auxerre to Dijon
Note: This figure displays the postal road from Auxerre to Dijon in Burgundy between 1714 and 1741 (northerly red dashed lines) and between 1751 and 1789 (southerly blue dashed lines). The extent of the map corresponds to the subdélégations (thick boundaries) and cantons (thin boundaries) through which this postal road passed. It also displays the spatial distributions of parishes in the area (marking the most populous ones by canton and subdélégation) and of 1756–90 roads (white lines). Horse-post relay data are based on various editions of the Liste des postes, and 1793 census data, on Cristofoli et al. (Reference Cristofoli, Vouloir, Duménieu and Motte2021). The shapefile of subdélégations is based on information in Cristofoli et al. (Reference Cristofoli, Vouloir, Duménieu and Motte2021), that of cantons, on information in cassini.ehess.fr (Motte and Vouloir Reference Motte and Vouloir2007; Motte et al. Reference Motte, Séguy, Théré and Tixier-Basse2003), and that of roads, on Perret, Gribaudi, and Barthelemy (Reference Perret, Gribaudi and Barthelemy2015).

This example illustrates that while the placement of central nodes of the horse-post relay network was likely endogenous to regional population dynamics, its local configuration between these nodes was plausibly exogenous, as it was designed to minimize travel time along pre-existing roads, subject to the constraint that relays be spaced 10–15 kilometer apart. We therefore exploit local variation in the network through decade-by-administrative division fixed effects. Because this assumption is more credible the finer the scale of analysis, our preferred specification relies on within-canton variation—the average canton contained only two towns with more than a thousand inhabitants in 1793, compared to ten per subdélégation.
This strategy restricts the sampling variation available for identification, as it requires that a canton contains at least two parishes with the same initial treatment status, and that one of them changes treatment status over time. This restriction implies four non-mutually exclusive exclusions from the sample: (i) 201 cantons composed of a single parish; (ii) 3,694 cantons where no parish ever switched treatment—either because none ever hosted a horse-post relay or those that did never lost it; (iii) 105 cantons where only one parish switched treatment and no other parish had the same initial treatment status—typically cantons where a single parish began with a relay, then lost it, while no others ever hosted one; and (iv) 14 cantons where all parishes that ever had a relay followed identical treatment paths. Together, these restrictions remove 3,847 cantons (84% of all cantons) when decade-by-canton fixed effects are introduced. This leaves 732 cantons (out of 1,342 that ever hosted a relay) for identification.Footnote 47
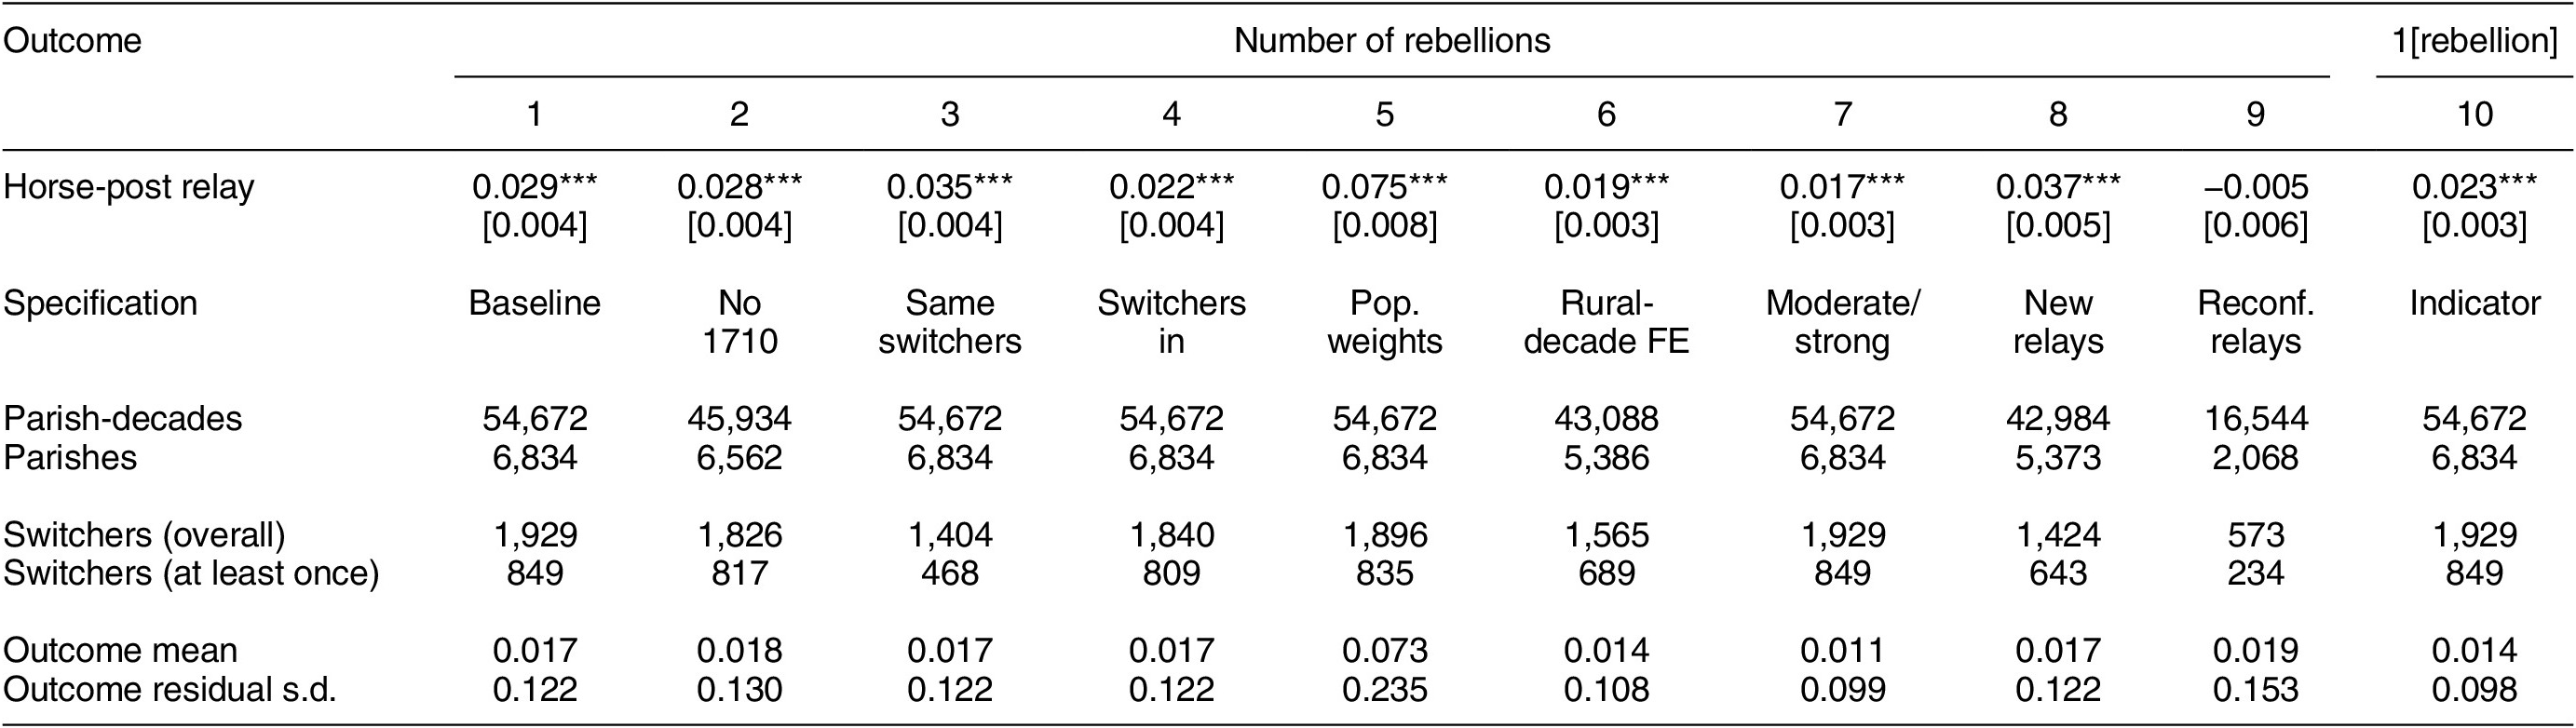
MAIN RESULTS
Table 2 reports the main results on the impact of the development of the horse-post relay network on rebellion across eighteenth-century France. Specifically, we report the average total effect of decade-specific event-study estimates $ {\delta}_{\ell } $
, which represents the sum of cumulated period-specific treatments (de Chaisemartin and D’Haultfœuille Reference de Chaisemartin and D’Haultfœuille2024, 24–5). This table further provides the effective number of parishes-decade and parish observations used for identification, the number of parish-decades that switched treatment, as well as the outcome mean and residual standard deviation calculated on the effective sample.Footnote 48
$ {\delta}_{\ell } $
, which represents the sum of cumulated period-specific treatments (de Chaisemartin and D’Haultfœuille Reference de Chaisemartin and D’Haultfœuille2024, 24–5). This table further provides the effective number of parishes-decade and parish observations used for identification, the number of parish-decades that switched treatment, as well as the outcome mean and residual standard deviation calculated on the effective sample.Footnote 48
Average Total Effect of New Horse-Post Relays on Rebellions

Note: This table reports the average total effect of non-normalized event-study effects $ {\delta}_{\ell } $
estimated through Equation 1. All regressions include parish and decade fixed effects. Parish-decades and Parishes denote the number of observations effectively used in the estimation. Switchers (overall) denotes the number of parish-decade observations that switched treatment over the period, while Switchers (at least once) denotes the number of parishes that switched at least once. Outcome residual s.d. denotes the outcome standard deviation once decade, parish fixed effects, and other controls are accounted for. Summary statistics are calculated relative to the effective sample used in the estimation. Periods (
$ {\delta}_{\ell } $
estimated through Equation 1. All regressions include parish and decade fixed effects. Parish-decades and Parishes denote the number of observations effectively used in the estimation. Switchers (overall) denotes the number of parish-decade observations that switched treatment over the period, while Switchers (at least once) denotes the number of parishes that switched at least once. Outcome residual s.d. denotes the outcome standard deviation once decade, parish fixed effects, and other controls are accounted for. Summary statistics are calculated relative to the effective sample used in the estimation. Periods ( $ -t;+T $
) denotes the number of event-study effects and placebos estimated. Estimates are calculated using de Chaisemartin et al.’s (Reference de Chaisemartin, Ciccia, D’Haultfœuille, Knau, Malézieux and Sow2023) did_multiplegt_dyn Stata command. Standard errors are clustered at the parish level and reported in brackets.
$ -t;+T $
) denotes the number of event-study effects and placebos estimated. Estimates are calculated using de Chaisemartin et al.’s (Reference de Chaisemartin, Ciccia, D’Haultfœuille, Knau, Malézieux and Sow2023) did_multiplegt_dyn Stata command. Standard errors are clustered at the parish level and reported in brackets. $ {}^{***}p\le 0.01.\hskip2.21384pt {\hskip2.21384pt }^{**}p\le 0.05.\hskip2.21384pt {\hskip2.21384pt }^{*}p\le 0.10 $
.
$ {}^{***}p\le 0.01.\hskip2.21384pt {\hskip2.21384pt }^{**}p\le 0.05.\hskip2.21384pt {\hskip2.21384pt }^{*}p\le 0.10 $
.
Column 1 reports results from a model without controls estimated using the maximum number of leads and lags allowed by the structure of the data. The establishment of a horse-post relay in a parish was associated with a subsequent increase in rebellion. The average total effect implies an increase in the number of rebellions by 0.057. This represents a little more than twice the average incidence of rebellion and one-quarter of its residual standard deviation. Column 2 restricts the number of periods used in the estimation to two leads and three lags. The coefficient decreases to 0.029 but remains significant at the 1% level and of sizable magnitude, corresponding to the average incidence of rebellion and one-tenth of its residual standard deviation. Column 3 introduces wheat prices as a time-varying control to assess whether local income shocks following the establishment of a relay might account for the results. The estimate remains unchanged, suggesting that the introduction of a relay was unrelated to changing local economic conditions that could have triggered rebellion. This finding aligns with evidence from Tonnaire (Reference Tonnaire2005, 44–62), who concludes on the basis of taille and capitation information that parishes along the postal road between Auxerre and Dijon that received a relay in the 1740s did not become wealthier in subsequent decades. If anything, her evidence points toward distributional effects, consistent with the mechanisms we propose below. Columns 4 and 5 introduce decade-by-administrative division fixed effects to compare parishes over time within the same subdélégation or canton.Footnote 49 Results are consistent with the baseline at 0.029, suggesting limited heterogeneity in treatment effects across administrative divisions. Finally, column 6 further controls for wheat prices. The resulting coefficient of 0.029 is again essentially identical to the baseline in column 2. However, its relative magnitude is about twice as large due to the reduced sampling variation after accounting for the additional controls used in this specification.
Event-Study Effects of New Horse-Post Relays on Rebellions
Note: The top half of this figure reports event-study effects $ {\delta}_{\ell } $
estimated through Equation 1 along with 95% confidence intervals. The specifications correspond to Columns 1 and 2 in Table 3. Dark blue estimates correspond to restricting the estimation to two leads and three lags, while light blue estimates use the full three leads and seven lags in the estimation. The bottom half of this figure reports the number of switchers used for the identification of each event-study effect. The red dashed line denotes half of first-period switchers. The full set of results is available in Table A5 in the Supplementary Material.
$ {\delta}_{\ell } $
estimated through Equation 1 along with 95% confidence intervals. The specifications correspond to Columns 1 and 2 in Table 3. Dark blue estimates correspond to restricting the estimation to two leads and three lags, while light blue estimates use the full three leads and seven lags in the estimation. The bottom half of this figure reports the number of switchers used for the identification of each event-study effect. The red dashed line denotes half of first-period switchers. The full set of results is available in Table A5 in the Supplementary Material.

Figure 7 presents an event-study plot that encapsulates the estimates from columns 1 and 2. This figure serves three purposes: first, to assess the plausibility of the parallel-trends assumptions; second, to examine the temporal dynamics of the treatment effect; and third, to display event-study coefficients without restricting the number of leads and lags. Placebo lead estimates show no evidence of differential pre-trends between treated and untreated parishes, supporting the credibility of the parallel-trends assumption. In contrast, post-treatment estimates reveal substantial dynamic treatment effects: rebellions increase in the second decade after a horse-post relay is established and continue to grow thereafter. Additional analyses using sliding decadal intervals in rebellions indicate that the treatment effect begins to materialize generally within the first decade and grows thereafter.Footnote 50 Finally, the figure indicates that the third placebo lead and the fifth, sixth, seventh period estimates rely on a relatively small number of switchers, supporting our choice to emphasize estimates using two leads and three lags. An event-study plot relative to the specification in column 6 of Table 2 leads to similar conclusions.Footnote 51
Robustness
Table 3 assesses the robustness of our main results. These tests build on the full specification reported in column 6 of Table 2—reported here in column 1—which includes controls for wheat prices and decade-by-canton fixed effects.
Periodization
To assess the credibility of the “initial conditions” assumption (de Chaisemartin and D’Haultfœuille Reference de Chaisemartin and D’Haultfœuille2024, 9–12), column 2 excludes the 1710 decade from the sample. The resulting estimate of 0.028 remains close to the baseline and is significant at the 1% level, suggesting that this assumption is reasonable.Footnote 52
Sample Composition
Next, we hold constant the sample of switchers used for identification to assess whether changes in the effective sample drive our results. The estimate in Column 3 of 0.035 suggests that they do not. Column 4 further restricts the sample to parishes that switch into treatment—that is, parishes that receive a new horse-post relay—as opposed to using both switchers in and switchers out—that is, parishes that also lose a relay. The estimate declines slightly to 0.022 but remains significant at the 1% level and consistent with the baseline.
Robustness
Note: This table reports the average total effect of non-normalized event-study effects $ {\delta}_{\ell } $
estimated through Equation 1. All regressions include parish and decade fixed effects, as well as wheat prices and decade-by-canton fixed effects. The estimation is restricted to two leads and three lags. Column 2 removes parish-decades of the 1710s. Column 6 includes an additional set of decade-by-rural status fixed effects. Column 8 restricts horse-post relays to those that are at least 15 kilometers from a retired relay in the same decade, and column 9, to those that are within 15 kilometers, where Reconf. denotes reconfigured relays. The outcome is the number of rebellions in columns 1–9, and an indicator variable for the occurrence of at least one rebellion in column 10. Parish-decades and Parishes denote the number of observations effectively used in the estimation. Switchers (overall) denotes the number of parish-decade observations that switched treatment over the period, while Switchers (at least once) denotes the number of parishes that switched at least once. Outcome residual s.d. denotes the outcome standard deviation once decade, parish, and canton fixed effects, as well as wheat prices are accounted for. Estimates are calculated using de Chaisemartin et al.’s (Reference de Chaisemartin, Ciccia, D’Haultfœuille, Knau, Malézieux and Sow2023) did_multiplegt_dyn Stata command. Standard errors are clustered at the parish level and reported in brackets.
$ {\delta}_{\ell } $
estimated through Equation 1. All regressions include parish and decade fixed effects, as well as wheat prices and decade-by-canton fixed effects. The estimation is restricted to two leads and three lags. Column 2 removes parish-decades of the 1710s. Column 6 includes an additional set of decade-by-rural status fixed effects. Column 8 restricts horse-post relays to those that are at least 15 kilometers from a retired relay in the same decade, and column 9, to those that are within 15 kilometers, where Reconf. denotes reconfigured relays. The outcome is the number of rebellions in columns 1–9, and an indicator variable for the occurrence of at least one rebellion in column 10. Parish-decades and Parishes denote the number of observations effectively used in the estimation. Switchers (overall) denotes the number of parish-decade observations that switched treatment over the period, while Switchers (at least once) denotes the number of parishes that switched at least once. Outcome residual s.d. denotes the outcome standard deviation once decade, parish, and canton fixed effects, as well as wheat prices are accounted for. Estimates are calculated using de Chaisemartin et al.’s (Reference de Chaisemartin, Ciccia, D’Haultfœuille, Knau, Malézieux and Sow2023) did_multiplegt_dyn Stata command. Standard errors are clustered at the parish level and reported in brackets. $ {}^{***}p\le 0.01.\hskip2.21384pt {\hskip2.21384pt }^{**}p\le 0.05.\hskip2.21384pt {\hskip2.21384pt }^{*}p\le 0.10 $
.
$ {}^{***}p\le 0.01.\hskip2.21384pt {\hskip2.21384pt }^{**}p\le 0.05.\hskip2.21384pt {\hskip2.21384pt }^{*}p\le 0.10 $
.
Heterogeneity
In column 5, we estimate Equation 1 with 1793 population weights to gauge the heterogeneity of treatment effects across parish sizes. We find an effect of 0.075, suggesting that larger parishes may respond more strongly to the introduction of a new relay. However, given the higher weighted outcome mean and residual standard deviation, the magnitude remains comparable to the baseline. Similarly, in column 6, we further include decade-by-rural status fixed effects, where rural status is defined as an indicator variable that equals one if the parish had fewer than two thousand inhabitants in 1793—the threshold used to classify rural communes in nineteenth-century censuses (Le Mée Reference Le Mée1972). We find an estimate of 0.019, again comparable to the baseline. We further investigate the nature of heterogeneous treatment effects along various characteristics in Appendix B of the Supplementary Material, showing that baseline differences in population, administrative status, gabelle taxation regime, historical opposition to the central state, and mode of ruling do not account for our results. We also show that the treatment effect is generally homogeneous across regions and that the results are also robust to excluding one region at a time.Footnote 53
Rebellion Intensity
In column 7, we show that the effect we identify is not driven by small rebellions, as results are similar when focusing on moderate to strong rebellions.Footnote 54
Type of Horse-Post Relays
Columns 8 and 9 explore the nonlinear expansion dynamics of the horse-post relay network by contrasting entirely new relays with those arising from local reconfigurations.Footnote 55 We find that new relays are driving the results, while those stemming from local reconfigurations have no discernible impact on rebellion—likely because they did not meaningfully alter the local presence of the state.
Rebellions Indicator
Column 10 confirms that the results are robust when the outcome is instead specified as an indicator variable that equals one if there was at least one rebellion in a parish-decade.
Archival Reporting Biases
In addition to the robustness tests reported in Table 3, we assess whether our results could be driven by archival gaps or recording biases Nicolas’s (Reference Nicolas2002) rebellion data. For instance, information for some départements is mostly drawn from national archives, which are generally less comprehensive than departmental archives. This could introduce biases in the representativeness of rebellious events across départements. Reassuringly, our empirical strategy mitigates this potential source of bias by leveraging variation in rebellious activity within the reach of departmental archives through the use of decade-by-canton fixed effects.
But other forms of selection bias could affect our results. One concern is that the expansion of the horse-post relay network may have enhanced the state’s ability to record rebellions. However, monitoring rebellions was not part of the horse post’s surveillance function, which was primarily to control individuals passing through relays (Marchand Reference Marchand2006, 210–4). Moreover, spatial patterns presented below show no evidence of over-recording in areas surrounding relays beyond host parishes themselves. Furthermore, archives of the horse post are not among the sources of the Jean Nicolas survey, as a major flood in 1910 and destruction during the Second World War damaged much of the archives of Ancien Régime postal institutions (Krakovitch et al. Reference Krakovitch, Lalguë-Guilhemsans, Roquincourt and Vaille2000, 2). Surviving records were deposited in the National Archives in 1998, and were therefore largely inaccessible at the time the survey was conducted.Footnote 56 Instead, the main actors monitoring and punishing rebellious activity were the maréchaussée and the judiciary, much as the police and the courts today. The main sources of information on rebellion thus come from the archives of these institutions, which are well preserved and were extensively surveyed by Jean Nicolas and his collaborators (Gay Reference Gay2025, 27–8).
Alternatively, the introduction of a horse-post relay may have increased the recording of rebellions by other local actors. To assess this possibility, we reproduce our analysis using only rebellions recorded by state-level authorities and preserved in national archives, finding that the results remain robust.Footnote 57 We further sequentially exclude rebellions recorded by the most frequent reporting institutions: the central government, the central financial administration, the maréchaussée, local courts and justices, and provincial administrations. Results are again consistent with the baseline, suggesting little selection bias arising from Nicolas’s (Reference Nicolas2002) archival sources.
Additional Robustness Tests
In addition to the tests discussed above, we conduct further analyses to address the high incidence of zeroes in the outcome variable and to probe robustness to clustering standard errors at higher levels of aggregation. We also examine the potential for post-treatment bias arising from the use of canton fixed effects, given that canton boundaries were established after the Revolution (Homola, Pereira, and Tavits Reference Homola, Pereira and Tavits2024). To that end, we re-estimate our models using fixed effects based on arbitrary square grids of varying sizes. In all cases, the results remain robust. Further details and results are provided in Appendix C of the Supplementary Material.
MECHANISMS
In this section, we provide evidence that suggests that the mechanisms linking the introduction of new horse-post relays to increased rebellion are rooted in the material consequences of the network’s expansion. By facilitating state centralization and penetration into local society, the horse post enabled greater tax enforcement and conscription, stricter administration of laws and regulations, and the disruption of private interests.
Table 4 probes these mechanisms in several ways. Column 1 restricts the dependent variable to rebellions targeting state authorities, including tax, military, and judicial authorities.Footnote 58 These agents represented some of the most consequential manifestations of central state power, charged with transmitting royal communications, maintaining order, and enforcing rules and directives handed down from the monarchy—reaching deep into local society. Our rebellion data capture a wide range of actions against these agents, including resistance against court rulings, conscription efforts, tax collection, and interventions by the military and maréchaussée. Results reveal a robust link between the establishment of new horse-post relays and rebellions against these authorities. These account for over three-fifths of the total effect of horse-post relays on rebellions. In contrast, column 2 indicates no comparable relationship between the expansion of the horse post and rebellions directed against non-state authorities—the nobility, the Church, as well as seigneurial and municipal authorities.
Mechanisms
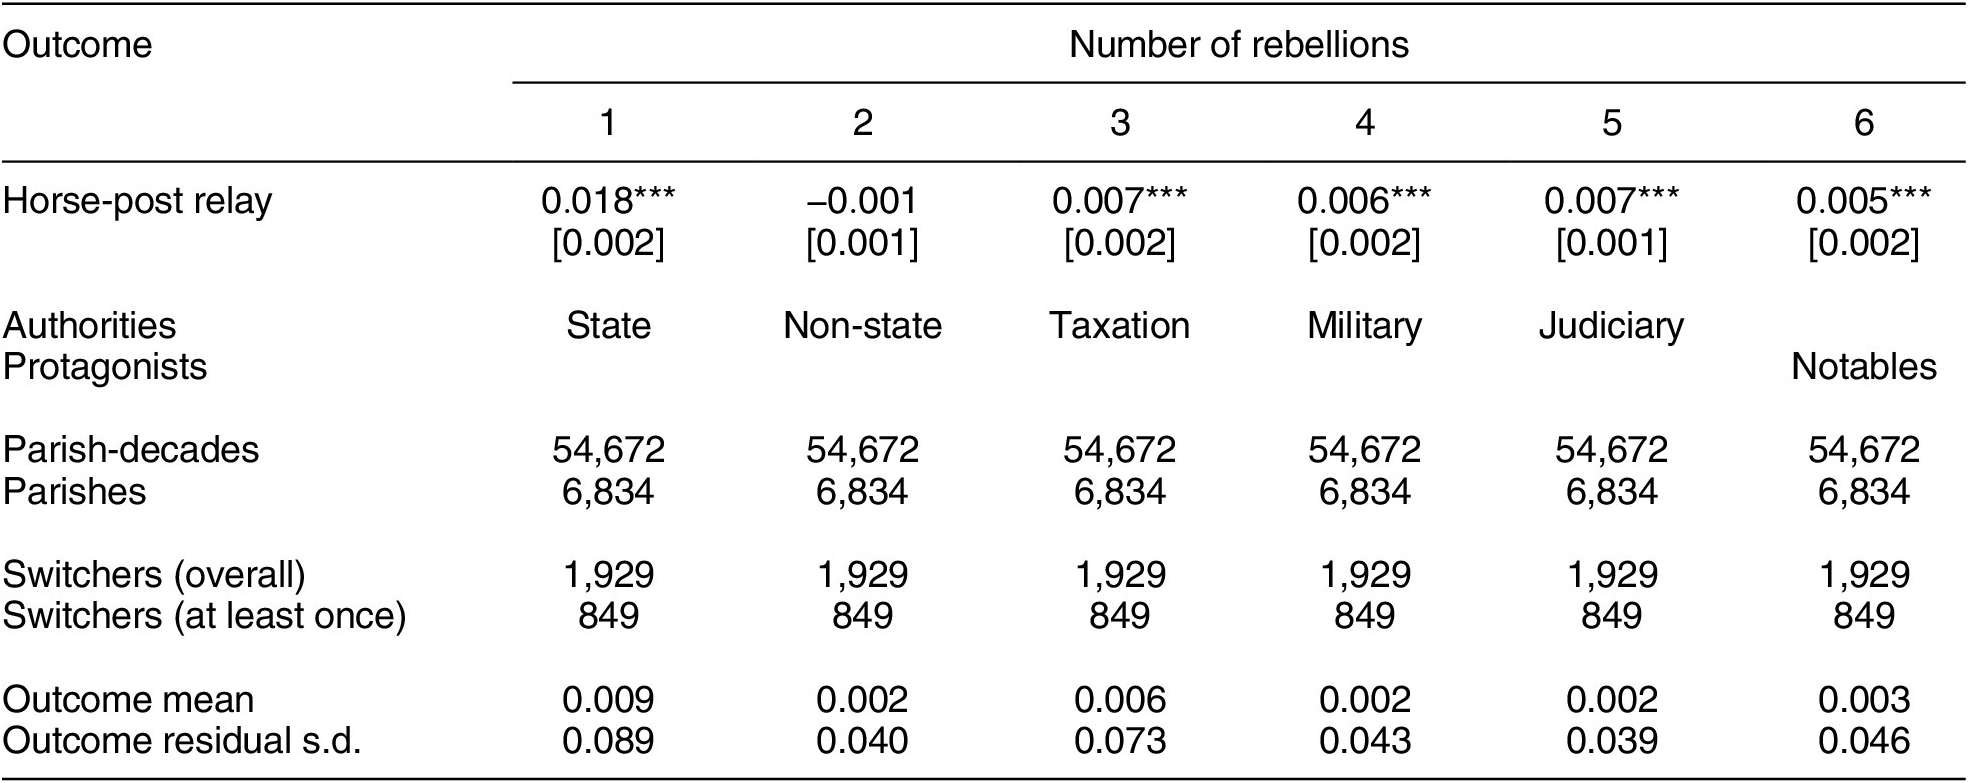
Note: This table reports the average total effect of non-normalized event-study effects $ {\delta}_{\ell } $
estimated through Equation 1. All regressions include parish and decade fixed effects, as well as wheat prices and decade-by-canton fixed effects. The estimation is restricted to two leads and three lags. The outcomes are rebellions against state authorities in Column 1, non-state public authorities (seigneurial, nobility, municipal, and Church) in Column 2, taxation authorities in Column 3, military authorities in Column 4, and judiciary authorities in Column 5. Column 6 includes rebellions involving local notables as protagonists. Parish-decades and Parishes denote the number of observations effectively used in the estimation. Switchers (overall) denotes the number of parish-decade observations that switched treatment over the period, while Switchers (at least once) denotes the number of parishes that switched at least once. Outcome residual s.d. denotes the outcome standard deviation once decade, parish fixed effects, and other controls are accounted for. Estimates are calculated using de Chaisemartin et al.’s (Reference de Chaisemartin, Ciccia, D’Haultfœuille, Knau, Malézieux and Sow2023) did_multiplegt_dyn Stata command. Standard errors are clustered at the parish level and reported in brackets.
$ {\delta}_{\ell } $
estimated through Equation 1. All regressions include parish and decade fixed effects, as well as wheat prices and decade-by-canton fixed effects. The estimation is restricted to two leads and three lags. The outcomes are rebellions against state authorities in Column 1, non-state public authorities (seigneurial, nobility, municipal, and Church) in Column 2, taxation authorities in Column 3, military authorities in Column 4, and judiciary authorities in Column 5. Column 6 includes rebellions involving local notables as protagonists. Parish-decades and Parishes denote the number of observations effectively used in the estimation. Switchers (overall) denotes the number of parish-decade observations that switched treatment over the period, while Switchers (at least once) denotes the number of parishes that switched at least once. Outcome residual s.d. denotes the outcome standard deviation once decade, parish fixed effects, and other controls are accounted for. Estimates are calculated using de Chaisemartin et al.’s (Reference de Chaisemartin, Ciccia, D’Haultfœuille, Knau, Malézieux and Sow2023) did_multiplegt_dyn Stata command. Standard errors are clustered at the parish level and reported in brackets. $ {}^{***}p\le 0.01.\hskip2.21384pt {\hskip2.21384pt }^{**}p\le 0.05.\hskip2.21384pt {\hskip2.21384pt }^{*}p\le 0.10 $
.
$ {}^{***}p\le 0.01.\hskip2.21384pt {\hskip2.21384pt }^{**}p\le 0.05.\hskip2.21384pt {\hskip2.21384pt }^{*}p\le 0.10 $
.
Columns 3–5 unpack the relationship between the expansion of the horse-post relay network and rebellions targeting state authorities. Column 3 focuses on rebellions specifically directed against taxation. As the reach of the central state expanded, obligations to local nobles diminished, but were replaced by new and increasingly burdensome taxes owed to the state, which became a major source of popular anger (Touzery Reference Touzery2024). Indeed, drawing on an analysis of the Revolution-era Cahiers de doléances, Shapiro and Markoff (Reference Shapiro and Markoff1998) find evidence that peasants harbored grievances over taxation that were shaped by concerns over utility and fairness. Although the establishment of new horse-post relays did not directly alter local tax regimes, the improved speed and reliability of communication likely facilitated stricter tax enforcement, thereby crystallizing ire against state tax obligations. Column 3 confirms that this mechanism translated into greater local rebellion, as the estimate suggests that rebellions against taxation account for about one-fourth of the total effect of the introduction of new horse-post relays on rebellions.
Column 4 examines rebellions targeting the military, including its conscription activities. This category further encompasses rank-and-file mutinies as well as uprisings targeting the maréchaussée, the state-sponsored security force policing the countryside. The results show a positive and statistically significant effect. Consistent with this result, we find that rebellions are more responsive to the introduction of horse-post relays in areas that were larger contributors of troops over the eighteenth century.Footnote 59 The coefficient in column 4 accounts for about one-fifth of the total effect of the introduction of new horse-post relays on rebellions.
In column 5, we turn to rebellions targeting the judiciary, including uprisings triggered by judicial actions, such as court-ordered imprisonments and the repossession of property. Indeed, the stricter enforcement of order and rules set by the monarchy—likely facilitated by greater information flow through the horse-post relay network—may have disrupted local social balance and generated grievances. Once again, we find a positive and statistically significant link between new horse-post relays and this subset of rebellions. The coefficient in column 5 comprises another one-fourth of the total effect of the introduction of new horse-post relays on rebellions.
Lastly, column 6 adopts a different approach by focusing on the protagonists of rebellions rather than their targets. Specifically, it examines whether rebellions led by notables increased following the introduction of new horse-post relays. As discussed above, the private interests of notables—such as the provisioning of goods along postal roads—may have been disrupted as the state asserted its presence by monopolizing roads through the new horse-post relays. Consistent with this mechanism, we find a positive link between new relays and rebellions led by notables, with this subset accounting for about one-fifth of the total effect of the introduction of new horse-post relays on rebellion.Footnote 60 This finding is also in line with De Juan (Reference De Juan2016) and Garfias and Sellars (Reference Garfias and Sellars2022), who argue that local elites may resist infrastructure and associated state expansion when such efforts threaten their authority and local dominance.
The Role of Pre-Existing State and Administrative Fragmentation
The causal relationship we have identified between horse-post relays and rebellions thus far was part of a broader process of state-building—one in which persistent state fragmentation and enduring subnational divisions continued to undergird local unrest. For instance, boundaries between different tax regimes, particularly those associated with the gabelles, became hotspots for tax evasion and smuggling that disproportionately resisted the state’s centralization efforts (Davoine, Enguehard, and Kolesnikov Reference Davoine, Enguehard and Kolesnikov2025). More broadly, responses to the establishment of horse-post relays may have varied with the historical relationship to the central state, as territories incorporated earlier into the kingdom (pays d’Élection) were under direct monarchic authority—especially in fiscal matters—whereas peripheral territories incorporated later (pays d’États and pays d’Imposition) retained some degree of autonomous ruling. Indeed, these latter regions had historically offered stronger opposition to the central state and were more likely to oppose efforts at state centralization and its penetration into local society (Degrave Reference Degrave2023).
Heterogeneity Across State and Administrative Fragmentation

Note: This table reports the average total effect of non-normalized event-study effects $ {\delta}_{\ell } $
estimated through Equation 1. All regressions include parish and decade fixed effects, as well as wheat prices and decade-by-canton fixed effects. The estimation is restricted to two leads and three lags. Columns 1 and 2 distinguish between parishes that are in cantons adjacent to gabelles frontiers versus not, and focus on rebellions targeting taxation authorities, and Columns 3 and 4 distinguish between parishes that are in pays d’États or pays d’Imposition versus pays d’Élection, and focus on all rebellions. Parish-decades and Parishes denote the number of observations effectively used in the estimation. Switchers (overall) denotes the number of parish-decade observations that switched treatment over the period, while Switchers (at least once) denotes the number of parishes that switched at least once. Outcome residual s.d. denotes the outcome standard deviation once decade, parish, and canton fixed effects, as well as wheat prices are accounted for. Estimates are calculated using de Chaisemartin et al.’s (Reference de Chaisemartin, Ciccia, D’Haultfœuille, Knau, Malézieux and Sow2023) did_multiplegt_dyn Stata command. Standard errors are clustered at the parish level and reported in brackets.
$ {\delta}_{\ell } $
estimated through Equation 1. All regressions include parish and decade fixed effects, as well as wheat prices and decade-by-canton fixed effects. The estimation is restricted to two leads and three lags. Columns 1 and 2 distinguish between parishes that are in cantons adjacent to gabelles frontiers versus not, and focus on rebellions targeting taxation authorities, and Columns 3 and 4 distinguish between parishes that are in pays d’États or pays d’Imposition versus pays d’Élection, and focus on all rebellions. Parish-decades and Parishes denote the number of observations effectively used in the estimation. Switchers (overall) denotes the number of parish-decade observations that switched treatment over the period, while Switchers (at least once) denotes the number of parishes that switched at least once. Outcome residual s.d. denotes the outcome standard deviation once decade, parish, and canton fixed effects, as well as wheat prices are accounted for. Estimates are calculated using de Chaisemartin et al.’s (Reference de Chaisemartin, Ciccia, D’Haultfœuille, Knau, Malézieux and Sow2023) did_multiplegt_dyn Stata command. Standard errors are clustered at the parish level and reported in brackets. $ {}^{***}p\le 0.01.\hskip2.21384pt {\hskip2.21384pt }^{**}p\le 0.05.\hskip2.21384pt {\hskip2.21384pt }^{*}p\le 0.10 $
.
$ {}^{***}p\le 0.01.\hskip2.21384pt {\hskip2.21384pt }^{**}p\le 0.05.\hskip2.21384pt {\hskip2.21384pt }^{*}p\le 0.10 $
.
We provide evidence for the conditional role of pre-existing state and administrative fragmentation along these dimensions. To test for the role of fiscal fragmentation, we split the sample between parishes located near gabelles frontiers—defined as those in cantons directly adjacent to these fiscal boundaries—and those farther away. We then estimate the treatment effect of the introduction of horse-post relays on rebellions specifically targeting taxation authorities.Footnote 61 The results, reported in Table 5, indicate a markedly stronger response to state expansion in fiscally fragmented areas. Indeed, the estimate in column 1 represents a little more than the average incidence of rebellions against taxation, while the column 2 estimate represents only one fifth. Next, to test for the role of the mode of ruling more broadly, we split the sample between parishes in pays d’États and pays d’Imposition relative to the more historically centralized pays d’Élection. Footnote 62 We then estimate the treatment effect of the introduction of horse-post relays on all rebellions. Consistent with our hypothesis, we find a stronger response to state expansion in areas that were historically more remote from the state’s direct authority, with the estimate in column 3 representing about three times the average incidence of rebellions relative to a little less than this average in column 4.Footnote 63
Gathering Effects
Next we investigate whether the establishment of new horse-post relays impacted rebellious activity in nearby parishes. If new relays brought material changes that extended beyond their host parish—as state agents sought to reach into surrounding areas as well—they could have “gathered” rebellions from nearby, drawing people to express grievances at the locales of this new representation of state authority. The built environment and increased traffic associated with new horse-post relays may have opened new spaces for contention, taking a step in the direction of Tilly’s (Reference Tilly1986) theory of evolving repertoires of contention from dispersed, parochial revolts to more clustered and cosmopolitan forms of collective action. Contributing to this shift, new horse-post relays and postillons clearly identified with the markings of increased state visibility and may have represented a disruptive threat to the existing social order. This dynamic constitutes a complementary potential mechanism that extends beyond the parishes where new relays were established.
To test this hypothesis, we estimate three versions of Equation 1, redefining the treatment as an indicator variable that equals one for the presence of a horse-post relay in neighboring parishes within 5 kilometers, 5–10 kilometers, and 10–15 kilometers.Footnote 64 Results in Figure 8 imply that the number of rebellions decreased by 0.007 in parishes located within 5 kilometers of a new horse-post relay and by 0.005 in those 5–10 kilometers away, with both estimates significant at the 5% level. Rebellions further decreased by 0.002 in parishes located 10–15 kilometers away from a new relay, although this estimate is not statistically significant.
Average Total Effect of New Horse-Post Relays on Rebellions across Distance to Nearest Horse-Post Relay
Note: This figure reports the average total effect of a new horse-post relay on rebellion when various treatment variables are input into Equation 1, along with 95% confidence intervals: a horse-post in a given parish and decade, up to 5 kilometers away from a new horse-post (excluding parishes with a relay), 5–10 kilometers away, and 10–15 kilometers away. All regressions include parish and decade fixed effects as well as wheat prices, decade-by-canton fixed effects, and distance to the nearest horse-post relay. Standard errors are clustered at the parish level. The full set of results is available in Table A15 in the Supplementary Material. $ {}^{***}p\le 0.01.\hskip2.77695pt {\hskip2.77695pt }^{**}p\le 0.05.\hskip2.77695pt {\hskip2.77695pt }^{*}p\le 0.10. $

We interpret these results as suggestive evidence that part of the main effect we identify may reflect a local reconfiguration of rebellious activity from surrounding parishes toward those hosting new horse-post relays. Given the small size of parishes and their close proximity, it would have been relatively easy for people to coordinate resistance locally and direct it toward nearby symbols of state authority. Importantly, however, even after accounting for this “gathering effect” of rebellion, the overall net effect of a new relay on rebellion remains positive and twice as large as the cumulated spillover effects.
ALTERNATIVE EXPLANATIONS
We now explore five main alternative explanations that could account for the observed link between the expansion of the horse-post relay network and rebellion, independent of our primary hypothesized mechanisms: (i) disruption of local social hierarchies; (ii) the role of wartime dynamics and the proximity to war zones; increased capacity of the populace for collective action thanks to the concurrent expansion of alternative information channels, such as (iii) the letter-post system and (iv) the underlying road infrastructure; and (v) shifts in the presence of the maréchaussée, the public security force policing the countryside.
Disruption of Local Social Hierarchies
Research in other contexts suggests that the erosion of traditional social hierarchies and networks that once structured local society can lead to disorder and to reprisals against declining authorities. For instance, Scott (Reference Scott1976) and Lecce, Ogliari, and Orlando (Reference Lecce, Ogliari and Orlando2022) show that when the disruption of traditional social relations weakens the monopolistic grip of local elites and social networks, it can leave populations vulnerable to severe risks and enable everyday grievances to metastasize rather than be absorbed or resolved locally. These grievances may be directed at both declining elites and the state. Hence, if the expansion of the state near horse-post relays undermined traditional authorities—such as the Church, the nobility, and seigneurial authorities—without eliminating the rents and tithes they extracted, resulting discontent against these declining figures could generate the observed link between new horse-post relays and rebellion. Grievances may also have been targeted at the state itself, especially if it failed to replace the functions previously carried out by these traditional institutions with equivalent state-provided services.
Several pieces of evidence cast doubt on this competing explanation. The establishment of new horse-post relays typically involved forging alliances with select local elites rather than their weakening, suggesting little disruption to traditional hierarchies (Jamaux-Gohier Reference Jamaux-Gohier2001; Marchand Reference Marchand2006). Accordingly, we find little evidence that new horse-post relays triggered rebellions against traditional non-state authorities. Unpacking the null coefficient in column 2 of Table 4, we find no significant impact on rebellions against the Church or municipal authorities, and if anything, a slightly negative effect on rebellions against seigneurial authorities and nobles. We also find no effect on the broader set of local civilian elites, such as notables and labor authorities.Footnote 65
War Zones and Wartime
War considerations may also have impinged on the horse-post relay network and rebellion by fueling both the network’s expansion and grievances against the military in border areas prone to or exposed to war. While most changes to the network during the eighteenth century occurred in the interior of the country, substantial extensions took place in the 1740s and 1750s along the northeastern border with the Holy Roman Empire and in the 1760s along the Swiss border. However, the treatment effect is broadly homogeneous across regions and not driven by a single one. Moreover, these border areas were not necessarily those with the highest levels of conscription, nor were rebellions against the military concentrated there.Footnote 66 Furthermore, the supply routes and stations for troops were organized through the routes d’étape system, which was distinct from the horse post and followed a different spatial logic (Kroener Reference Kroener1980).Footnote 67 Nonetheless, to ensure that the military geography does not confound our results, we exclude subdélégations that experienced battles or were along the borders of the kingdom.Footnote 68 The results remain in line with our baseline estimates. We also assess the role of wartime involvement directly by excluding all rebellions that occurred during periods of war, where we define wartime as any year in which France was engaged in a military conflict in Europe.Footnote 69 The results are again similar.
Information and Collective Action Through the Letter-Post System
Another potential alternative explanation is the simultaneous development of the letter-post system, which may have increased the likelihood of rebellion by lowering barriers to collective action through the wider dissemination of information.Footnote 70 Indeed, such dynamics linking improved communication infrastructure to collective mobilization have been observed with the expansion of railways and telegraphs in nineteenth- and twentieth-century United States (García-Jimeno, Iglesias, and Yildirim Reference García-Jimeno, Iglesias and Yildirim2022) and Europe (Melander Reference Melander2020; Pengl et al. Reference Pengl, Müller-Crepon, Valli, Cederman and Girardin2025). In eighteenth-century France, the letter post operated as a private service for collecting, forwarding, and delivering letters via an infrastructure of post offices (Marchand Reference Marchand2006, 95–180). If the establishment of letter-post offices coincided with that of horse-post relays—and if those offices facilitated collective action—this correlation could confound our results.
To address this potential concern, we collected information on the locations of letter-post offices for the same years as our data on the horse-post relay network.Footnote 71 Critically, the spatial configuration of letter-post offices followed a different logic from that of horse-post relays, as their establishment followed economic rather than strategic and logistical considerations (Cauvin, Lepetit, and Reymond Reference Cauvin, Lepetit and Reymond1987; Verdier and Chalonge Reference Verdier and Chalonge2018). Letter-post offices were as numerous as horse-post relays and expanded at a comparable pace throughout the eighteenth century, so that they covered most of the territory by the early eighteenth century.Footnote 72 However, unlike the horse post, the letter post was not designed as a network requiring offices at regular intervals. Instead, letter-post offices were generally located in populous towns, in sharp contrast with horse-post relays.Footnote 73 Their buildings were also much smaller, as they handled only letter distribution and did not serve as rest stops or provide fresh horses. Mail delivery in the letter-post system relied primarily on private couriers (entrepreneurs de dépêches), who rode their own horses, and on mail coaches (malles-poste), which consisted of two-wheeled carts operated by employees of the letter-post administration.Footnote 74
To empirically assess whether the development of letter-post offices confounds our results, we apply de Chaisemartin and D’Haultfœuille’s (Reference de Chaisemartin and D’Haultfœuille2023) estimator, which accommodates staggered designs with binary, non-absorbing multiple treatments that may exhibit heterogeneous and dynamic effects. Specifically, we augment Equation 1 by including a set of event-study coefficients on an indicator variable that equals one if a letter-post office was present in a given parish and decade. The results closely mirror our baseline estimates: the average total effect of the horse post on rebellion, accounting for the concurrent development of the letter post, is 0.027 (standard error: 0.011), suggesting that this alternative mechanism does not drive our findings.Footnote 75
Transit Infrastructure and the Road Network
Another potential confounder is the underlying road network on which the horse-post relay system depended, although this infrastructure was managed separately by the Bridges and Roads administration (Arbellot Reference Arbellot1973). If improvements to the road network coincided with the establishment of new horse-post relays, it is possible that the effects we observe were instead driven by changes in the transit infrastructure itself—whether by fostering economic development, disrupting non-state local authorities, or facilitating popular coordination.
In the early eighteenth century, French roads were in a deplorable state (Arbellot Reference Arbellot1973, 766). These conditions had been a longstanding concern and lamented since the Colbert administration as a major obstacle to the expansion of internal trade (Blond Reference Blond2013, 65). However, it was not until the 1730s—by which point the situation had become critical—that the Controller General of Finance Philibert Orry launched an ambitious program of road repair and construction (Massounie Reference Massounie2013).Footnote 76 Spearheaded by Daniel-Charles Trudaine, the program ultimately resulted in the construction of nearly 26 thousand kilometers of road by the 1780s—although only two-thirds of this network remained in passable condition by that time (Arbellot Reference Arbellot1973, 772–3).
The order of priority for new road construction, however, was not directly linked to the location of horse-post relays, as roads connecting relays were considered only after those linking Paris to ports, provincial capitals, and the kingdom’s borders (Blond Reference Blond2007, 69–70). While the upkeep of existing roads may have occasionally favored those used by the horse post (Arbellot Reference Arbellot1973, 766), it was exceedingly rare for the creation of a horse-post relay to prompt a request for road construction or maintenance from the Bridges and Roads administration, or that such requests would be granted (Demangeon Reference Demangeon1995, 66–71; Verdier Reference Verdier2009, 13). Overall, historical accounts suggest that the horse post was not tied to the road network and followed its own logic, and that the actual routes taken by postillons between relays often varied seasonally depending on weather and road conditions (Jamaux-Gohier Reference Jamaux-Gohier2001, 125–45).
A comprehensive empirical test of this alternative mechanism is however not feasible due to the severe limitations of available quantitative information on road construction and maintenance at the local level in the eighteenth century.Footnote 77 Nevertheless, we show in Tables B1 and B2 in the Supplementary Material that there is little heterogeneity in the treatment effect of horse-post relays across parishes located at different distances from a road. This suggests that our results are unlikely to be driven by connectivity to the road network.
Policing by the Maréchaussée Brigades
A final potential alternative mechanism is the presence of maréchaussée brigades, the state-sponsored security force that policed the countryside. These men-at-arms formed part of the security apparatus of the royal authority and maintained public order along the kingdom’s roads (Fressin Reference Fressin2022). Following their consolidation in 1720, brigades consisting of four to five men were stationed in barracks located in the center of towns and urban areas (Fressin and Georges Reference Fressin and Georges2022). Their spatial distribution closely resembled that of letter-post offices: they covered the entire territory and were generally located in populous towns.Footnote 78 However, the expansion of the maréchaussée was relatively limited: the number of brigades remained stable at five hundred units during the first half of the eighteenth century, increased to about eight hundred in the 1750s and 1760s, and then plateaued until the Revolution.Footnote 79 While these brigades embodied the symbolic presence of the state, they never mustered more than three thousand men and primarily operated in the vicinity of towns and major roads.Footnote 80
Maréchaussée brigades could potentially account for our findings through two distinct channels. First, if brigades systematically accompanied the establishment of new horse-post relays, the effect we identify might reflect the presence of the maréchaussée rather than that of the horse post itself. Second, if the presence of brigades made rebellions more likely to be recorded by these state actors, our results could be driven by selection bias in the archival sources used to document rebellious activity.
We address these concerns in a number of ways. First, we show that although parishes that received a horse-post relay were more likely to eventually host a maréchaussée brigade, pretreatment trends indicate that they were also more likely to have received a brigade prior to the establishment of the relay.Footnote 81 In other words, while the spatial development of the two institutions was correlated, there is no evidence of a causal link between them. Second, we extend Equation 1 to control for the potential incidence of maréchaussée brigades using de Chaisemartin and D’Haultfœuille’s (Reference de Chaisemartin and D’Haultfœuille2023) estimator for multiple treatments. The results closely resemble our baseline estimates, suggesting that the presence of maréchaussée brigades does not account for our findings.Footnote 82 Third, we restrict the analysis to parishes that never hosted either a letter-post office or a maréchaussée brigade. Results in Table A18 in the Supplementary Material suggest that these “uncontaminated” parishes still exhibit a positive causal relationship between the establishment of horse-post relays and rebellion. Finally, we test the robustness of our findings to removing rebellions recorded in the archives of the maréchaussée, finding similar results (see column 6 of Table A13 in the Supplementary Material).
CONCLUSION
Alongside ongoing international rivalries and wars across early modern Europe, major powers—especially France and England—also faced episodic but significant outbreaks of rebellion and revolt. These episodes of domestic unrest unfolded against the backdrop of ambitious state-building efforts. France was among the first states to pursue a systematic program of state consolidation, encompassing a wide range of infrastructural, communication, and extractive initiatives. Yet state-building initiatives can themselves become a site of contestation, even when their ultimate goal is to establish centralized control and social order. We find that improvements in communication infrastructure through the expansion of France’s horse-post relay network sparked episodic rebellions across the territory in the run-up to the French Revolution. We attribute this relationship to pushback against the material consequences of state penetration, such as greater tax and law enforcement, conscription, control over the roads, and the crowding out of private interests. This pushback also varied with prior levels of state fragmentation and underlying territorial heterogeneity.
The dynamics we identify may also have had important implications for the French Revolution itself. Indeed, exploratory analyses suggest that, while the horse-post relay network in itself did not facilitate information diffusion among citizens or reduce their collective action costs, parishes that received relays—and experienced an associated uptick in rebellion—were more likely to later host political societies during the Revolution.Footnote 83 These societies played a central role in coordinating revolutionary action and asserting local control as the Ancien Régime collapsed. Prior grievances fostered by the expansion of the horse-post relay network thus appear to have resurfaced when subsequent shocks created an opportunity for mobilization, amplifying more immediate dynamics such as those linked to the 1788 drought or to the diffusion of democratic ideals by French soldiers returning from the American Revolutionary War (Jha and Wilkinson Reference Jha and Wilkinson2023; Waldinger Reference Waldinger2024). This could have operated through long-standing frustrations over issues such as taxation or conscription, or even corvée labor—grievances that may not have triggered major rebellions in earlier decades but were prominently expressed in the Cahiers de doléances (Shapiro and Markoff Reference Shapiro and Markoff1998). This suggests that efforts to build state capacity can generate long-lasting consequences for social order that may unfold in ways that state planners neither anticipate nor intend.
Our findings underscore the importance of conceptually distinguishing the process of state-building from state strength itself. State-building can affect social order through multiple channels, from material consequences, such as taxation and conscription to information diffusion, ease of communication, and popular coordination. Scholars might fruitfully explore these channels in other canonical cases of early contested state-building in order to deepen our understanding of historical as well as ongoing state-building efforts.
SUPPLEMENTARY MATERIAL
To view supplementary material for this article, please visit https://doi.org/10.1017/S0003055425101342.
DATA AVAILABILITY STATEMENT
Research documentation and data that support the findings of this study are openly available at the American Political Science Review Dataverse: https://doi.org/10.7910/DVN/M1XRXT.
ACKNOWLEDGEMENTS
The authors thank Carles Boix, Charlotte Cavaillé, Anne Degrave, Bogdan G. Popescu, Louis Rouanet, Megan Stewart, Ronan Tallec, and Dean Yang for insightful feedback. They also thank Loris Cuenot, Annie Dago, Mario Fernandez, Magdeline Fikri, Wyatt Leaf, Navid Mazidabadifarahani, Gabriel Perez, Maximilien Pointurier, Carly Taylor, Diego Villamizar, and Louis Vitrand for excellent research assistance.
FUNDING STATEMENT
The authors gratefully acknowledge funding from the Pearson Institute at the University of Chicago for this project. V.G. also acknowledges funding from the ANR under grant ANR-17-EURE-0010 (Investissements d’Avenir program) and ANR-20-CE38-0015 (ObARDI).
CONFLICT OF INTEREST
The authors declare no ethical issues or conflicts of interest in this research.
ETHICAL STANDARDS
The authors affirm this research did not involve human participants.


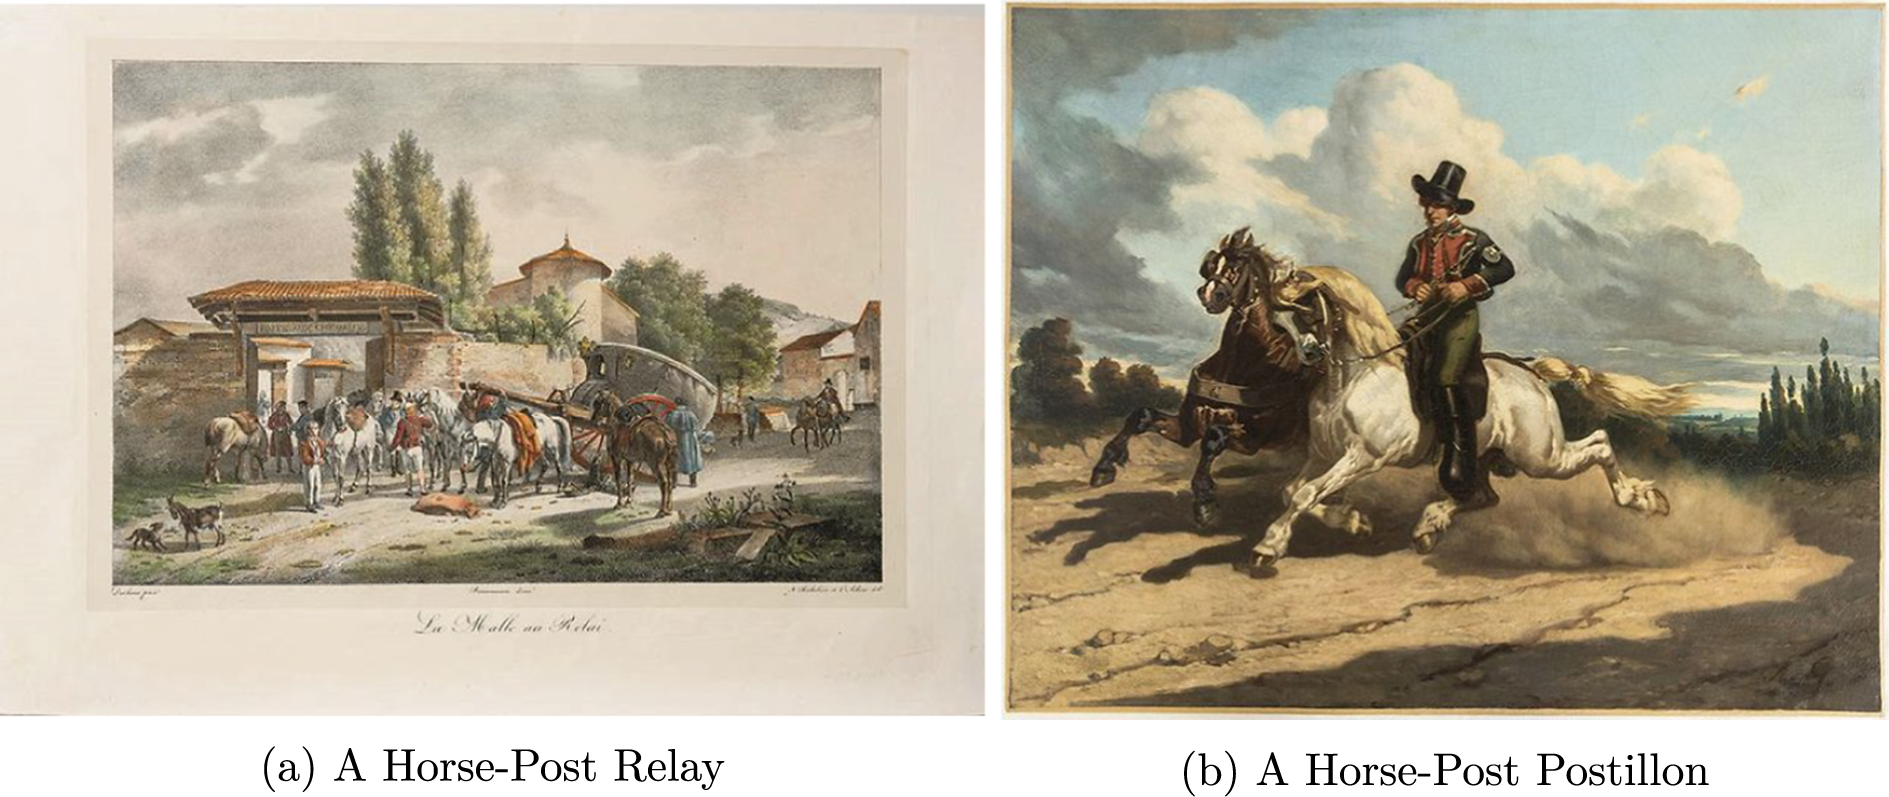
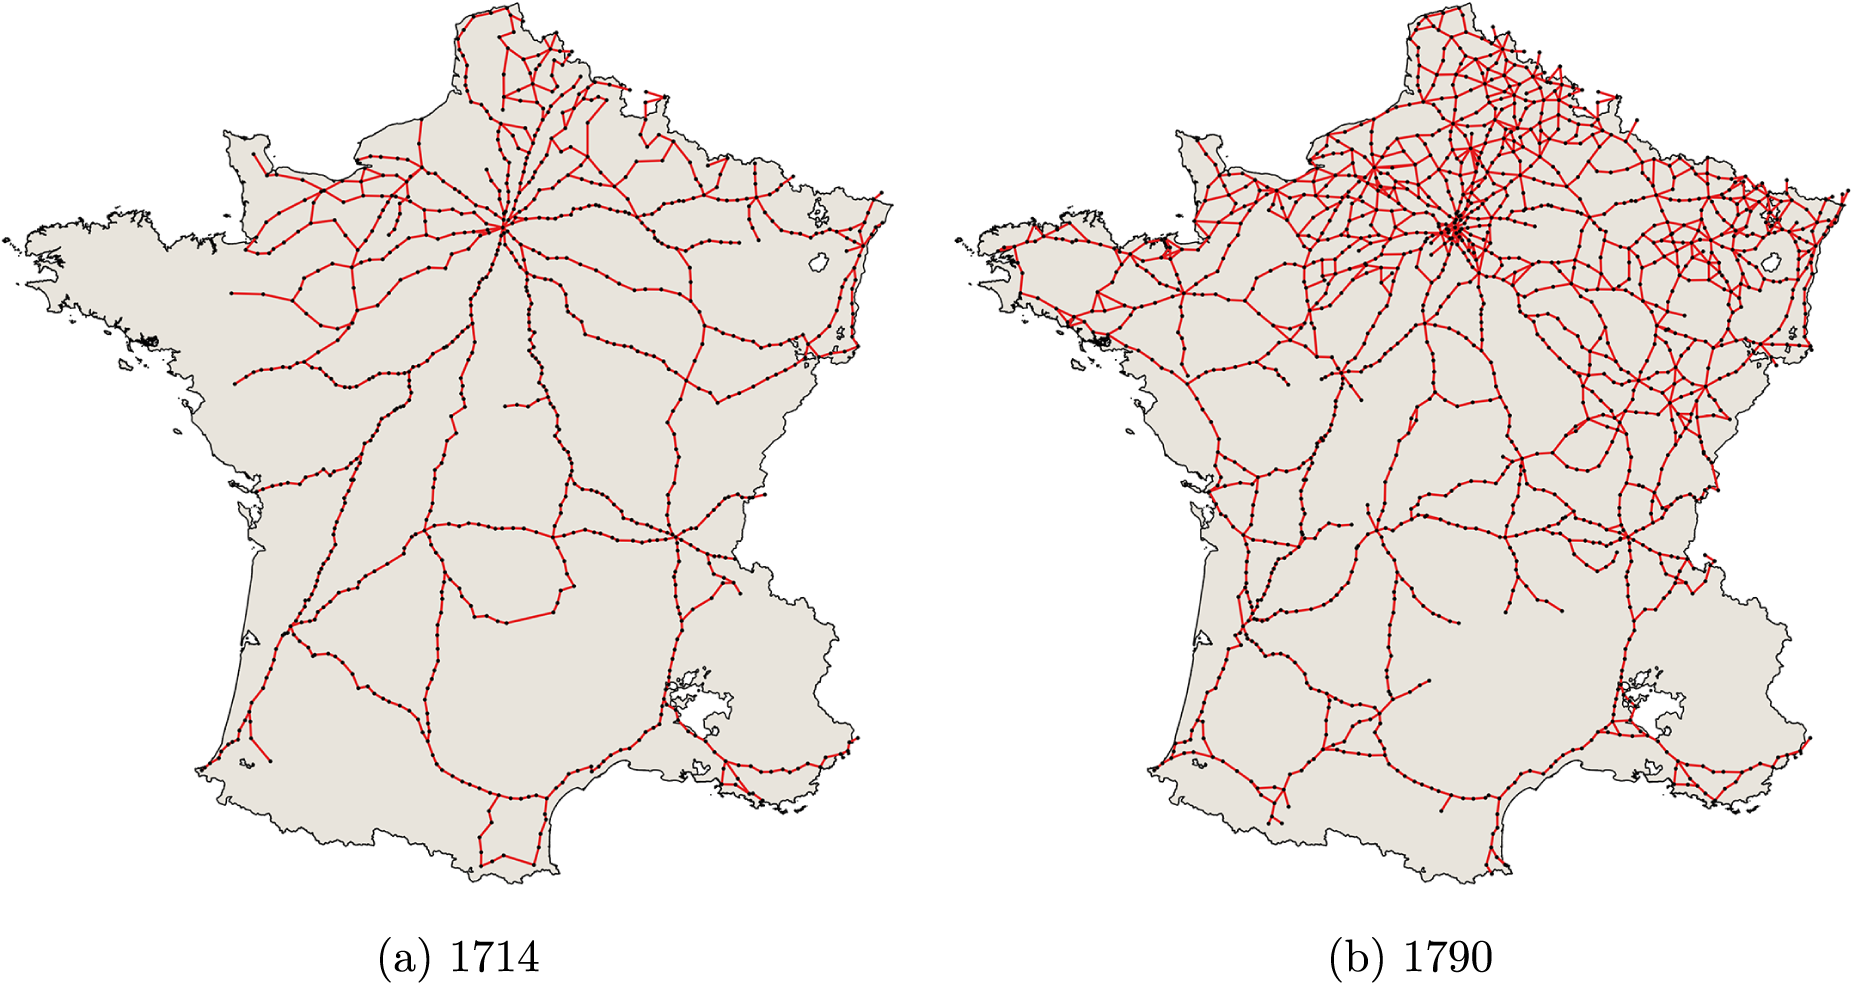
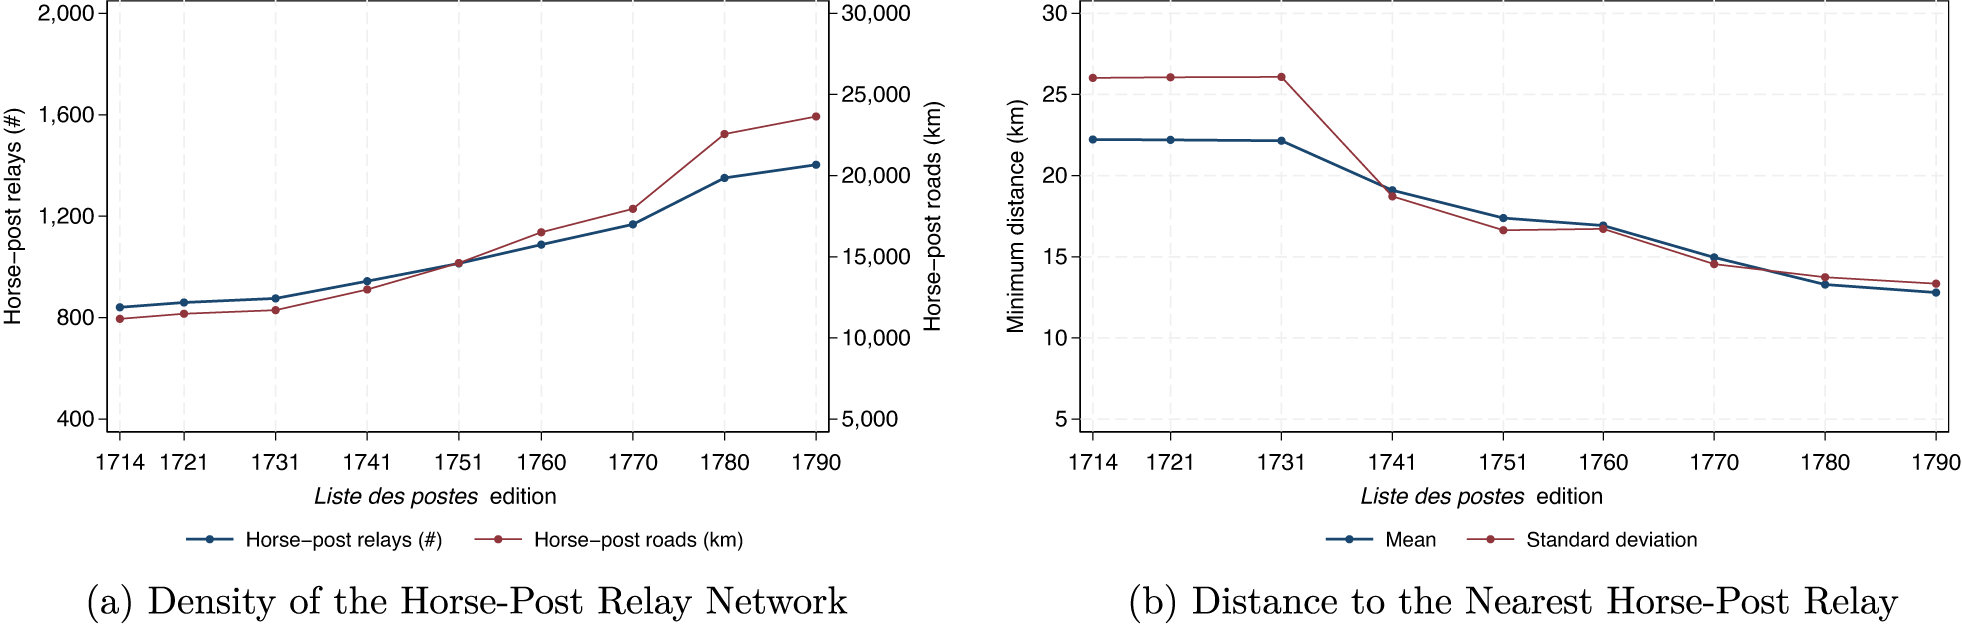
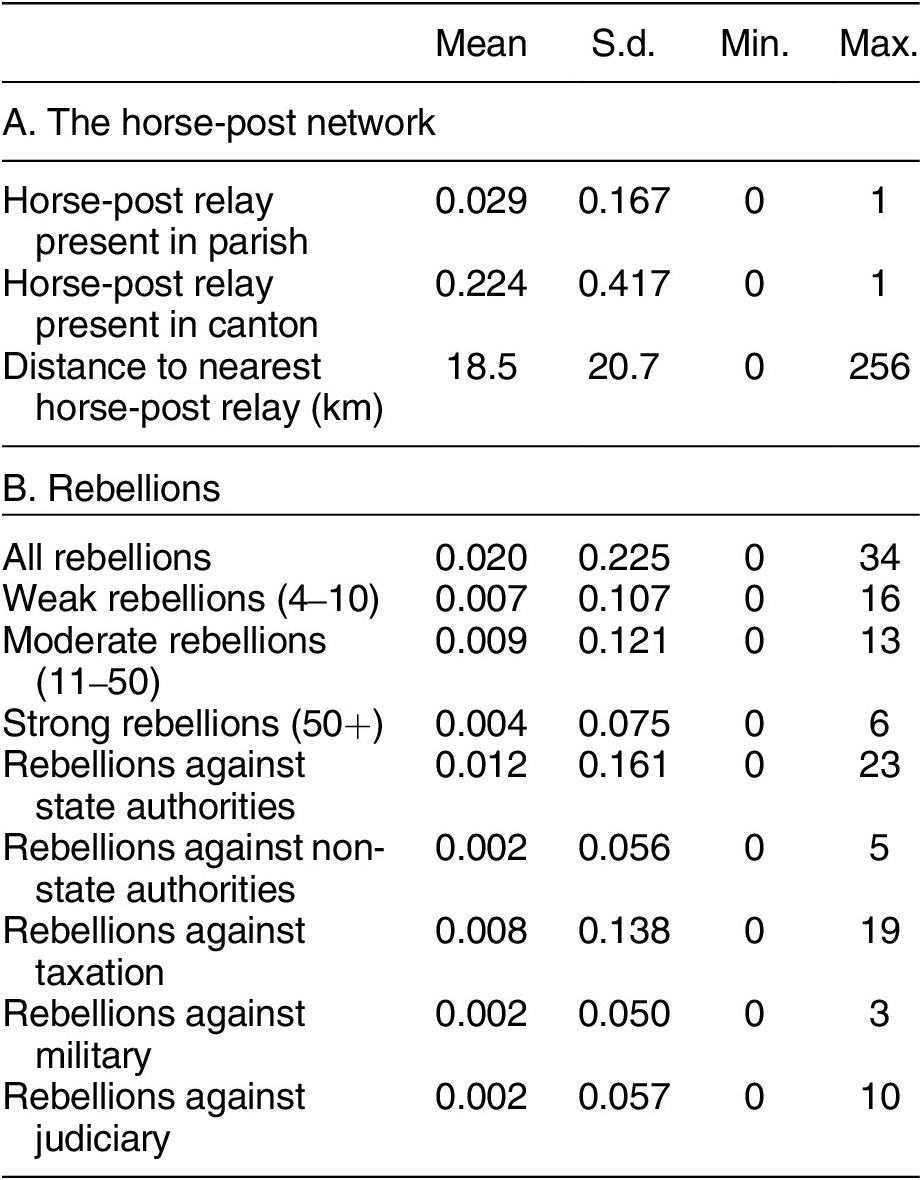
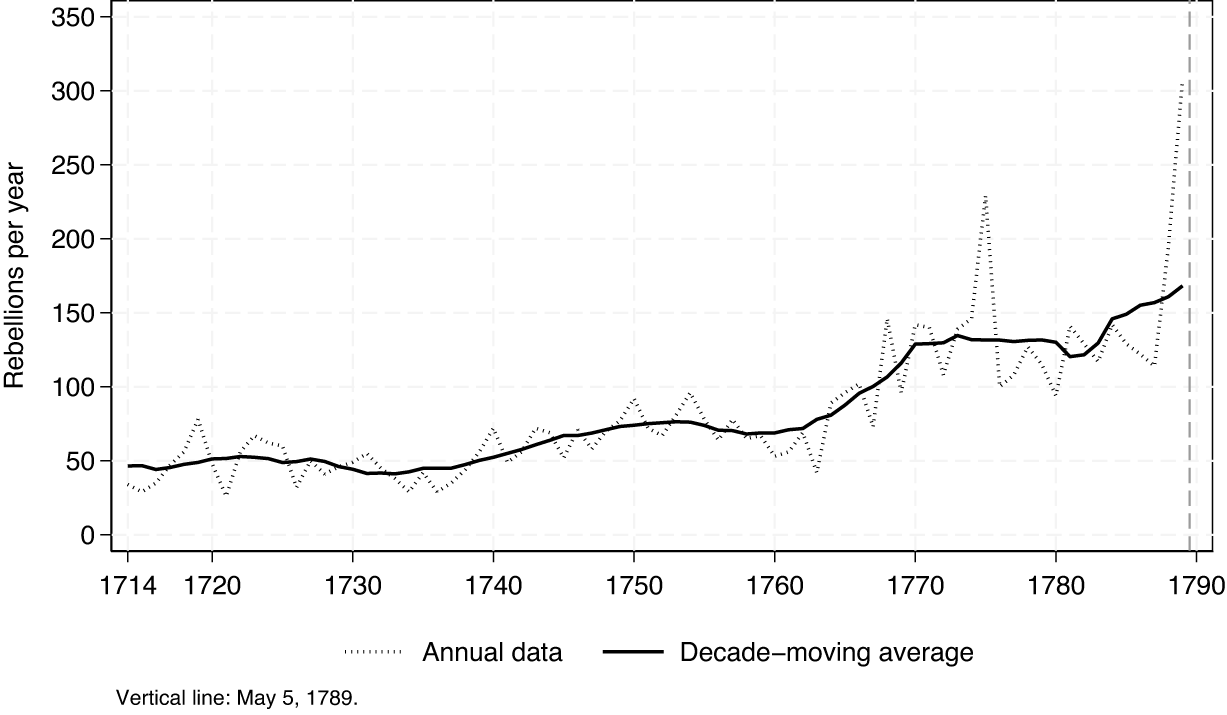
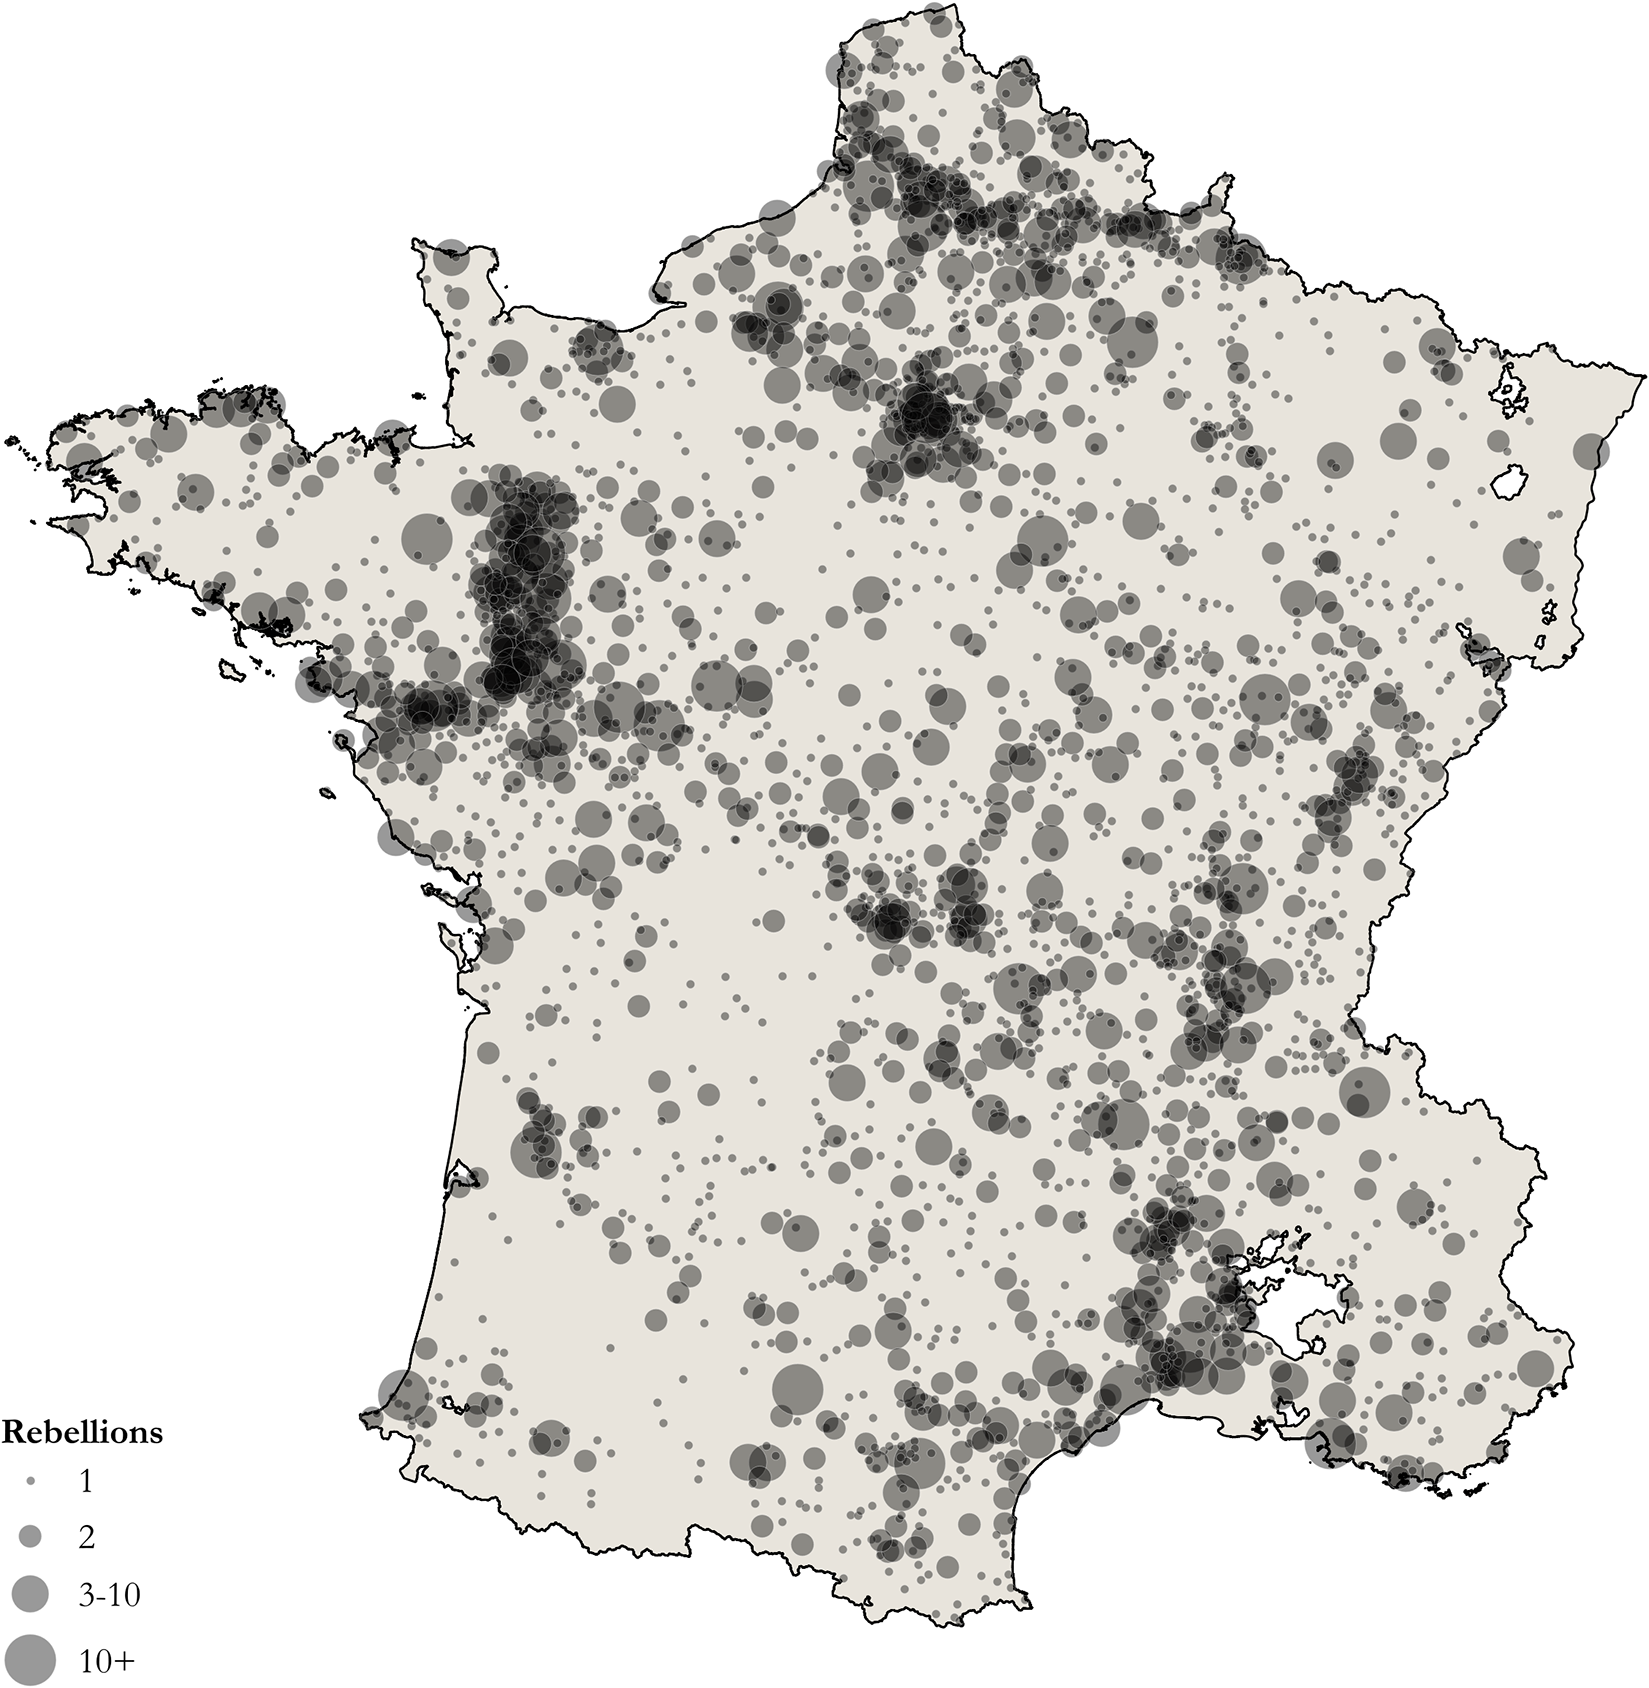
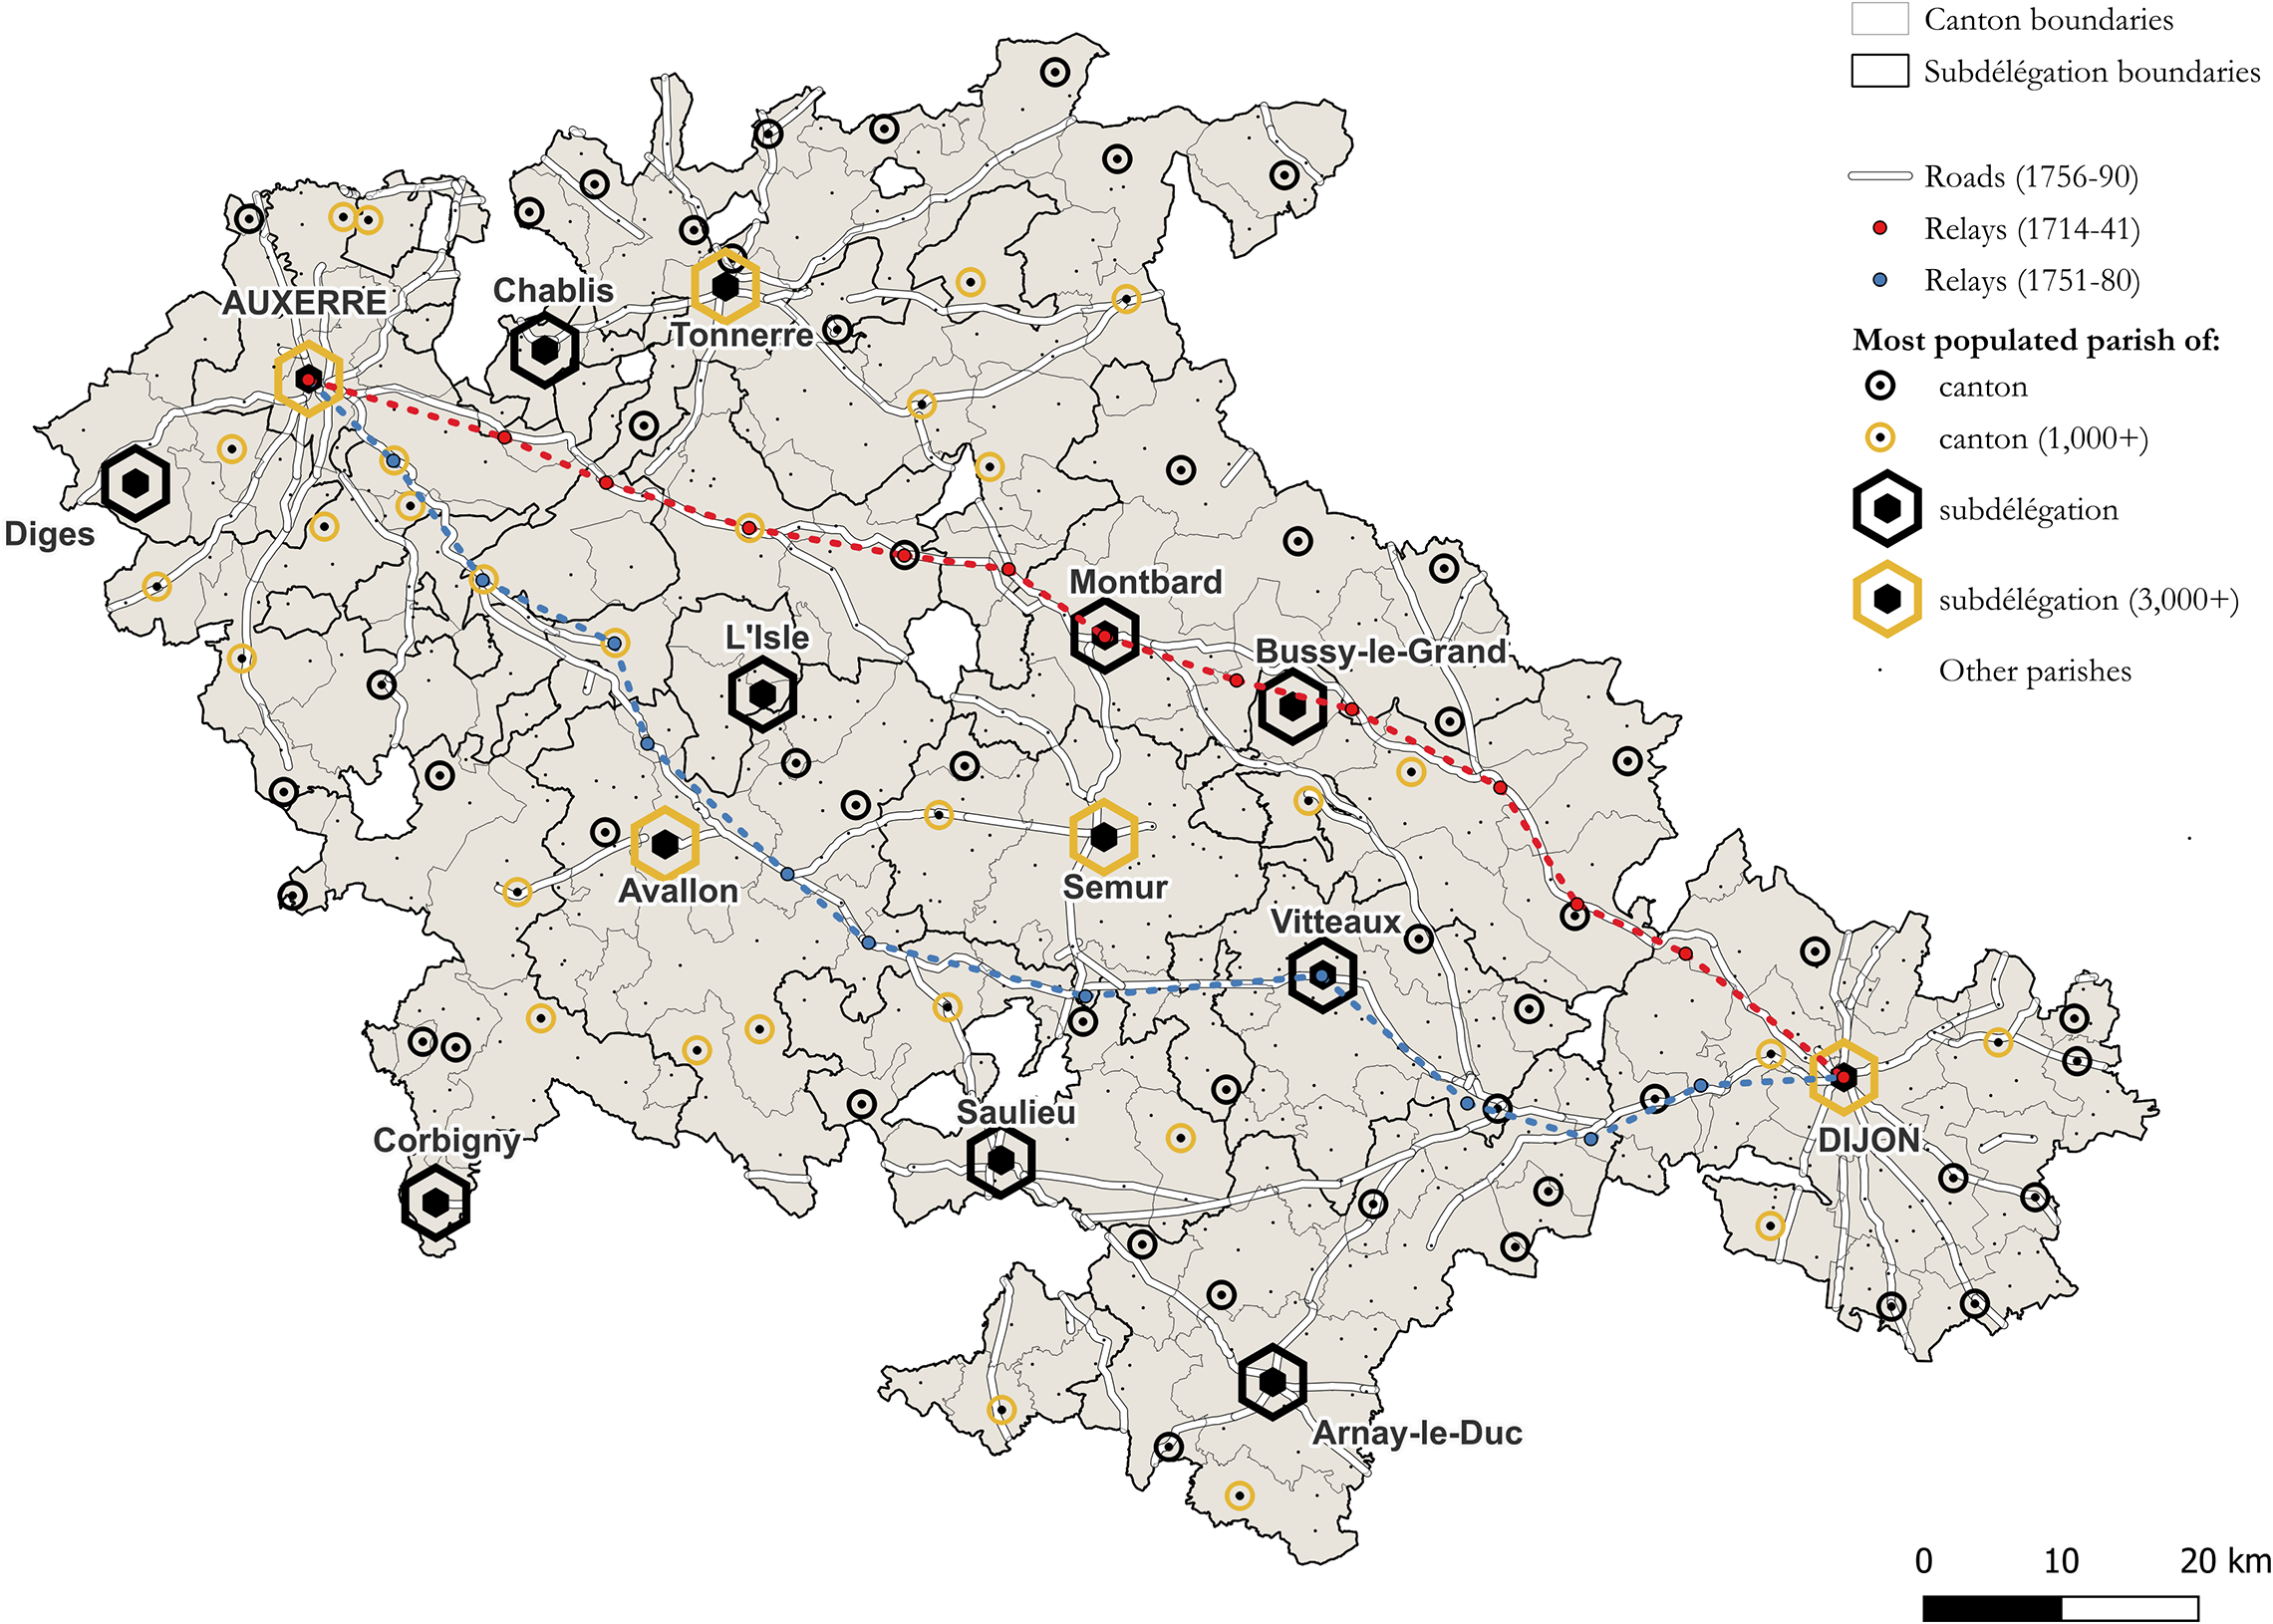
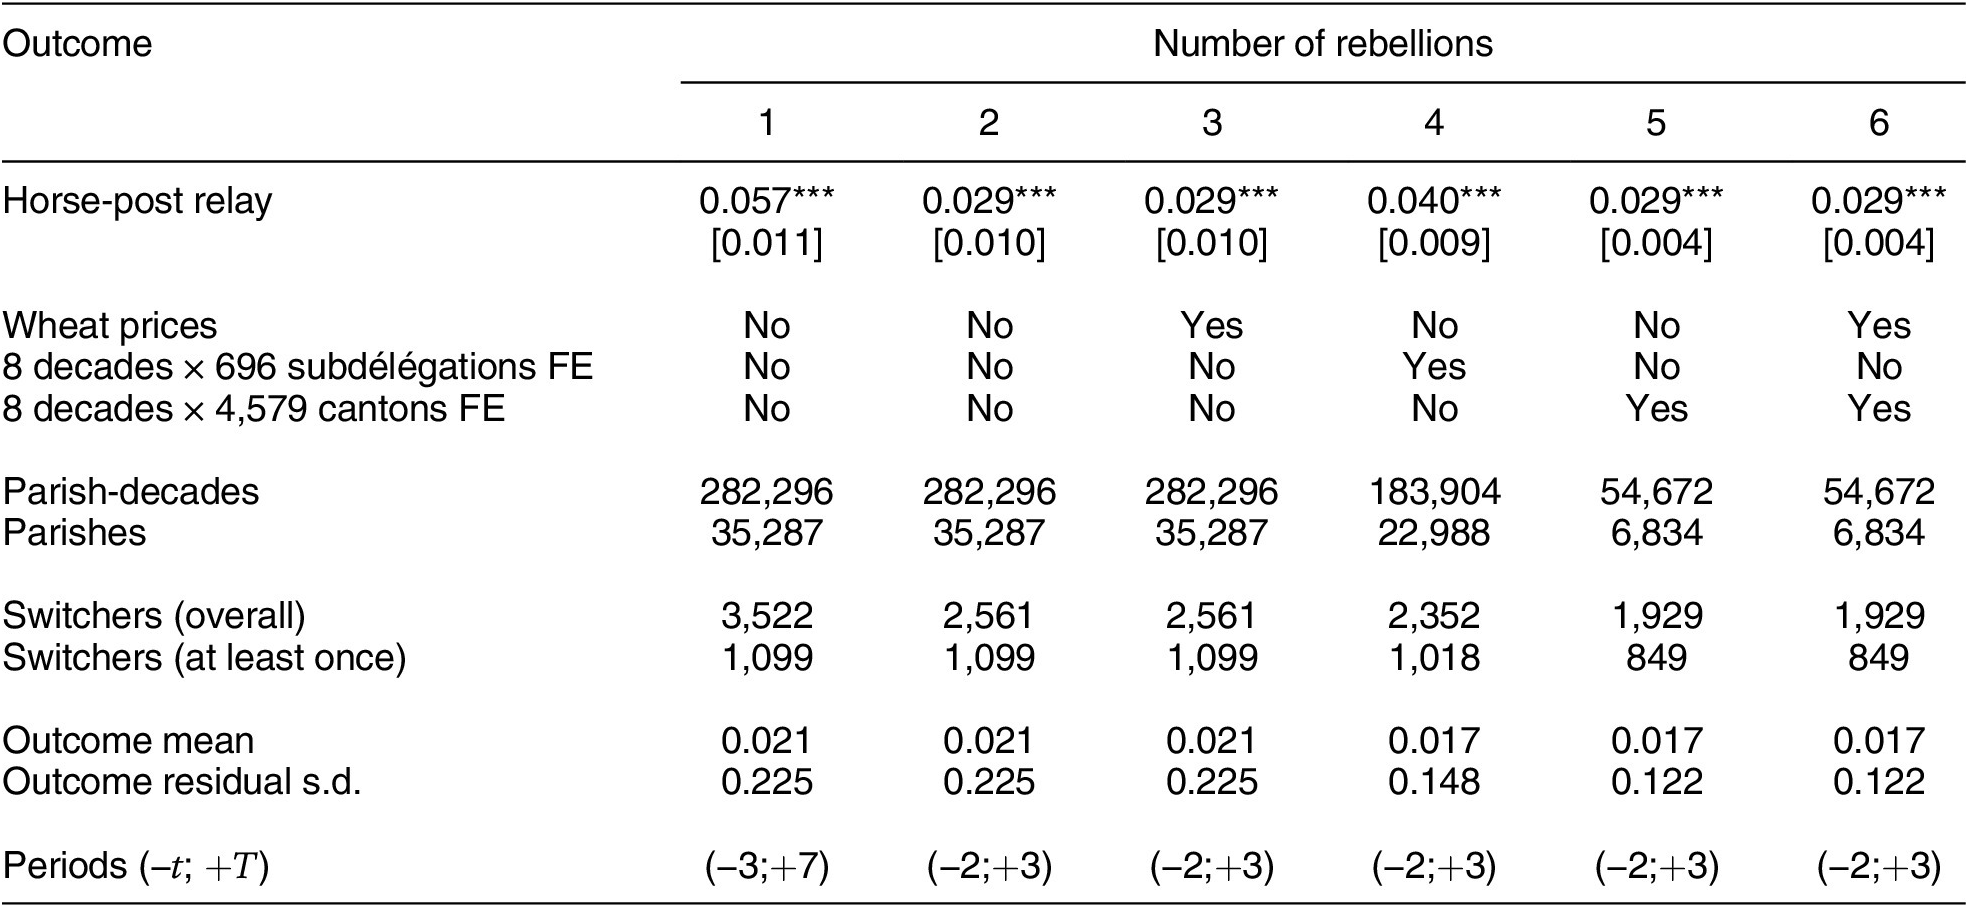
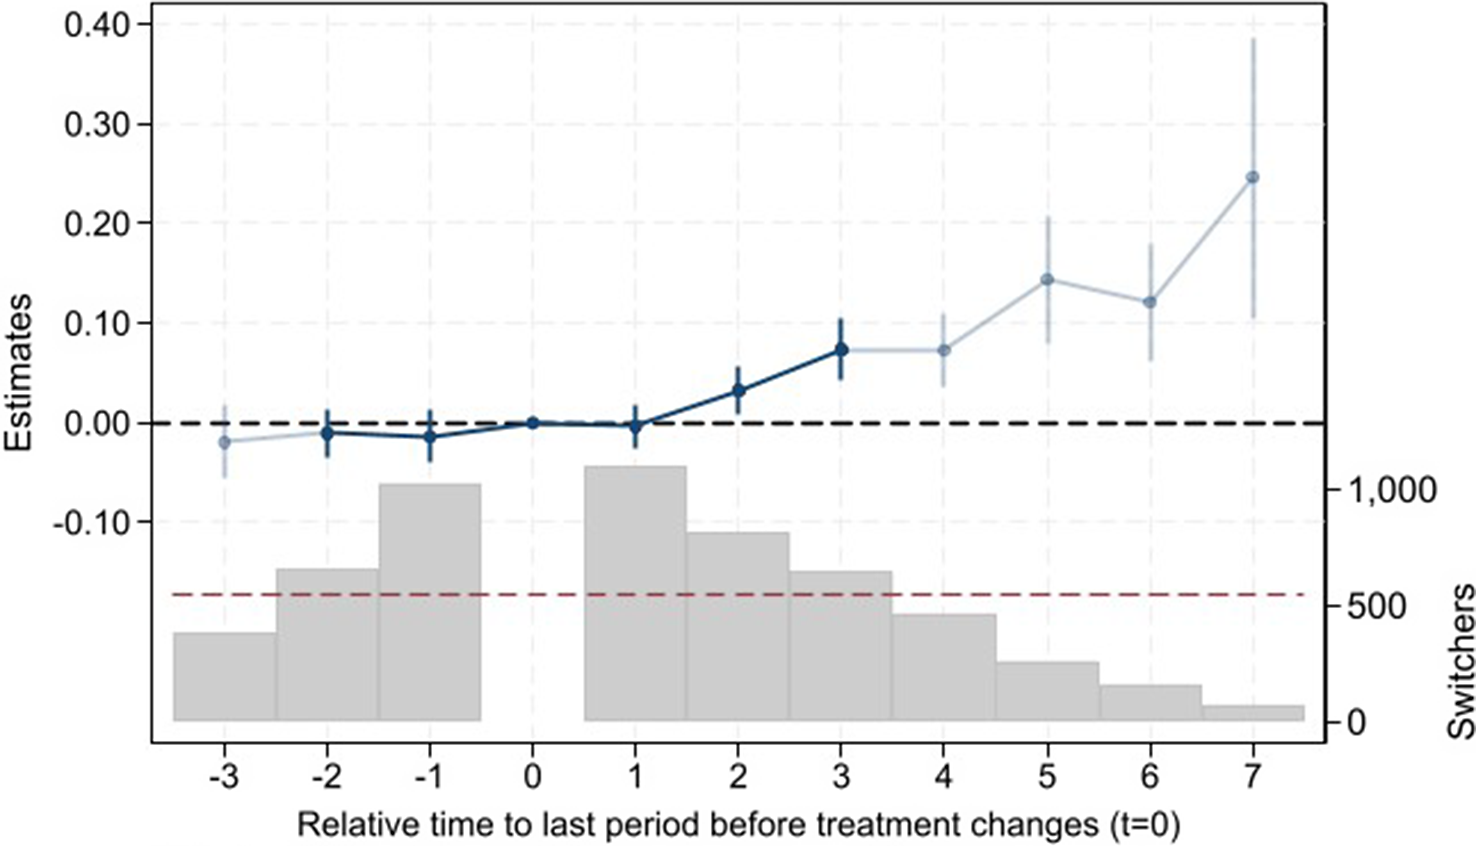


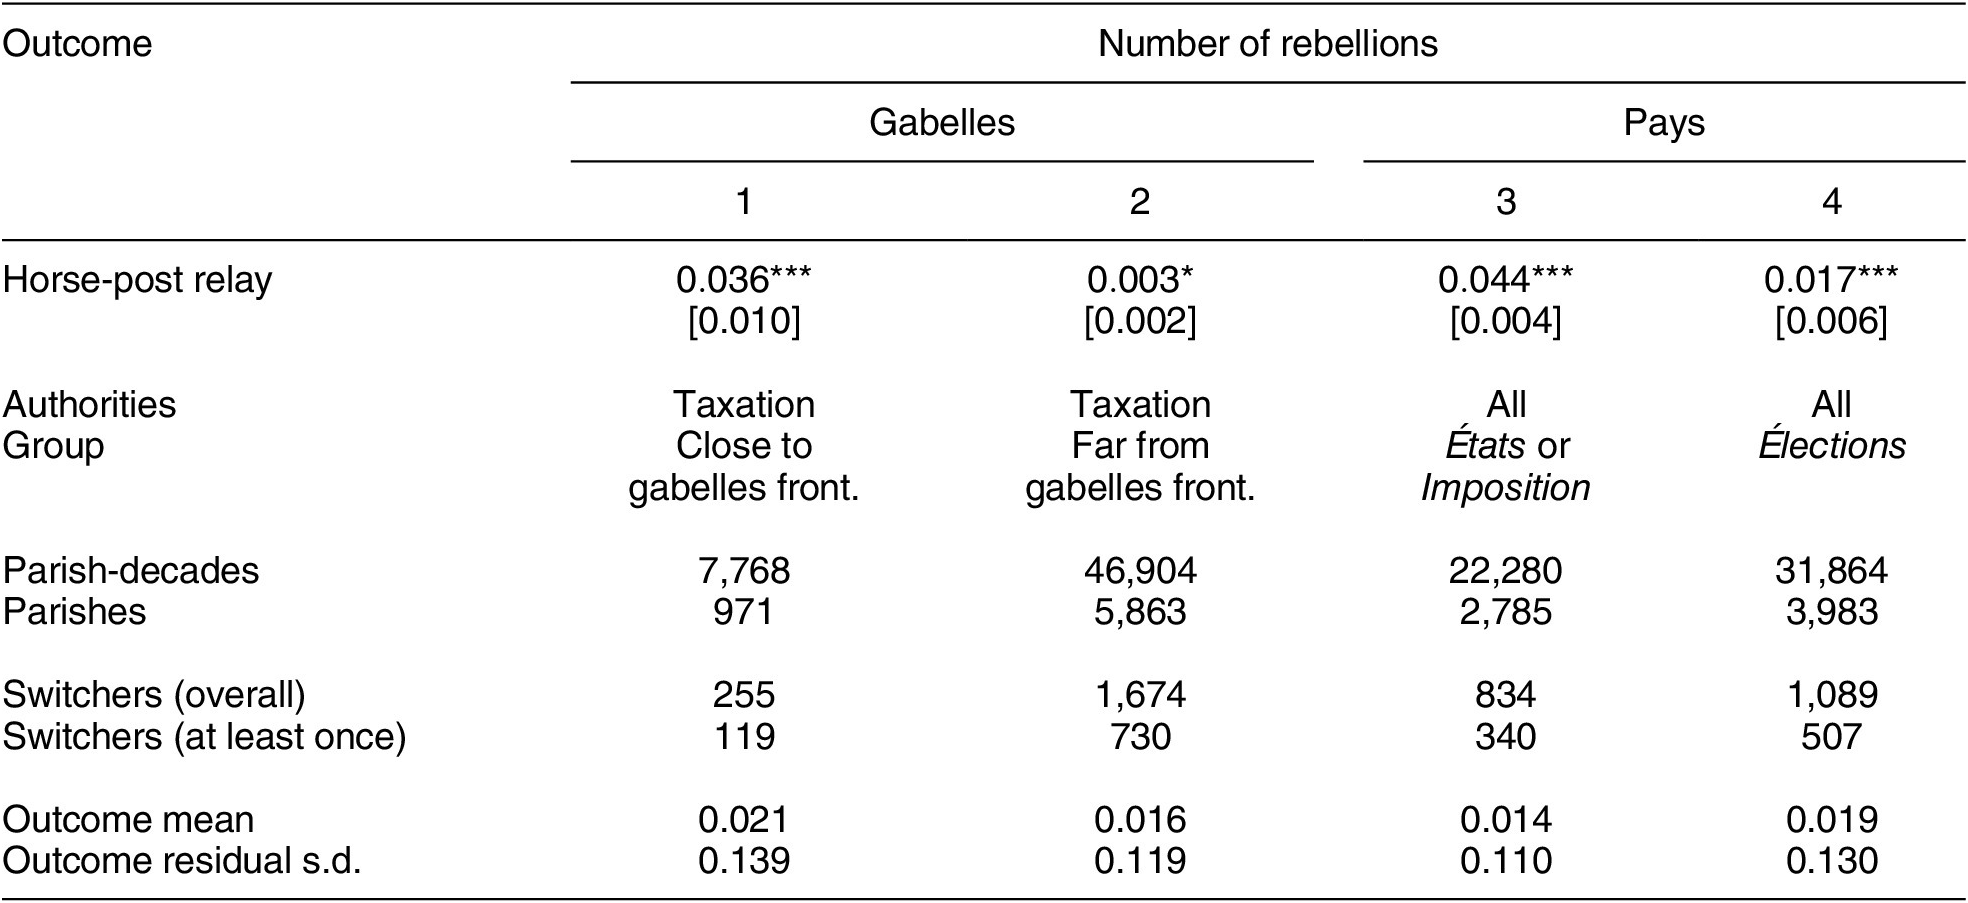
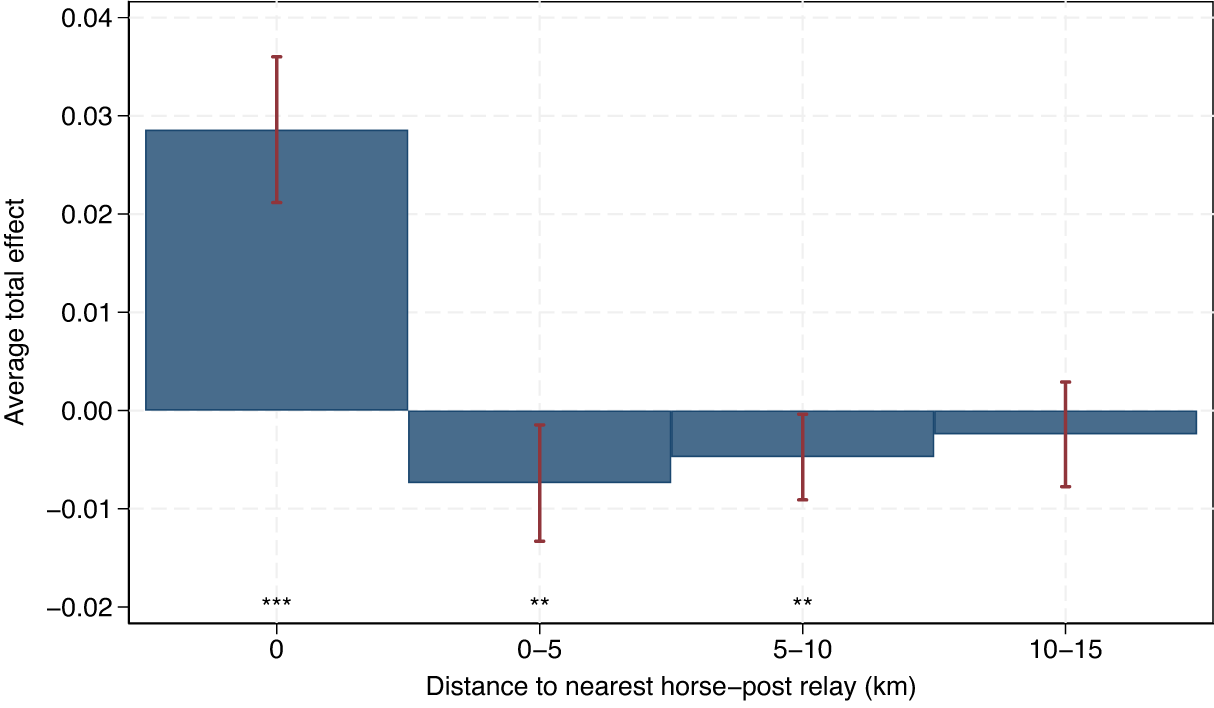


 Open access
Comments
No Comments have been published for this article.