

Introduction
Welfare levels are a central topic in economic historiography.Footnote 1 However, it was not until the early twenty-first century that Robert C. Allen introduced welfare ratios to illustrate the ability of a male breadwinner to support a typical family with a wife and two children.Footnote 2 His methodology has been widely adopted.Footnote 3 Since then, this methodology has faced numerous criticisms,Footnote 4 including the appropriate average family size to use, the presence of accumulated wealth, and other types of income (such as in-kind income), which can represent more than fifty per cent of total income in some societies. Additionally, the contentious equivalence between real wages and living standards has been questioned.Footnote 5 Most notably, the methodology has been criticized for not considering income contributions from other family members.Footnote 6 This is particularly significant in societies where real wages were not as high as in England or the Netherlands,Footnote 7 or even in late eighteenth-century England.Footnote 8 In other words, it is questionable to what extent the male breadwinner model, whereby the male head of household served as the sole or principal income provider, is supported by historical evidence in other kinds of societies. An example of a low real wage society is Spain, well into the twentieth century. However, we still know little about the contributions of each family member (father, mother, children, and others) to the household income owing to the scarcity of studies with generalized salaries for southern Europe.Footnote 9
The family budgets used in Spain to assess living standards up until the 1920s have demonstrated the generally low purchasing power of the working class.Footnote 10 The family budgets of working-class families show that,Footnote 11 at least until the late 1920s, Spain was still a developing country where the salary of most heads of households was insufficient to support an average family on its own.Footnote 12 Spain was not an exceptional case: the male breadwinner model has been shown to be uncommon in Europe until well into the twentieth century. Dutch farmers, for example, contributed only about fifty per cent of the household income at the beginning of the twentieth century.Footnote 13 In Sweden, it was also common for both spouses to work and contribute to the household budget.Footnote 14
In Spain, in 1924, the head of the household in rural and semi-urban Catalonia contributed 32–42 per cent of the household income, and in Galicia 24–52 per cent.Footnote 15 Furthermore, the income could be distributed unequally among family members, often favouring males,Footnote 16 or even squandered by the head of the household in taverns,Footnote 17 putting their family below the threshold of basic needs. However, our knowledge of wages and purchasing power is scarcer for Spanish urban areas. Therefore, this study, utilizing the same source as the articles cited herein (the 1924 Zaragoza population list, which includes wage data), makes an important contribution by allowing for the comparison of an urban population with other rural and semi-urban cases in Spain. Notably, this source from the city of Zaragoza had not been previously used in studies on wage distribution or comparisons between groups and between men and women.
In addition to industrial data, historical analyses of family budgets in Spain up to the early twentieth century have focused on budgets from rural areas,Footnote 18 confirming patterns of low purchasing power. However, historical data has also highlighted the presence of higher wages in urban areas compared to rural ones.Footnote 19 This partially explains the increase in migration from rural to urban areas.Footnote 20
Through the use of this novel source, this article has two main objectives. The first is to describe the household composition and the income contributed by each member to understand the extent to which the male breadwinner model applies to urban Spain in the first third of the twentieth century. Secondly, it analyses the purchasing power of families based on different consumption baskets and considering family composition. Therefore, one of the innovations of this work is that we use several food consumption baskets, which allows us to better assess the purchasing capacity of families from different socio-economic levels. In this way, the article addresses a gap in the historiography of Southern Europe by examining family budgets and their purchasing power in urban areas, with an initial focus on the Spanish city of Zaragoza during its industrialization process.Footnote 21
Area and Data
Area
Zaragoza is a city in north-eastern Spain, located in the centre of the Ebro Valley, approximately midway between Madrid and Barcelona. Its strategic position near major Spanish production centres has facilitated its industrialization process.Footnote 22 The city is situated on a broad plain with gentle undulations and experiences a continental climate, characterized by hot summers and cold winters.
The population of Zaragoza doubled between 1900 (99,118 inhabitants) and 1935 (203,200 inhabitants), primarily owing to an influx of rural immigrants from nearby villages.Footnote 23 In fact, approximately half of the resident population in Zaragoza in 1924 was born in a different locality, while about twenty-five per cent of the population was born outside the province of Zaragoza and around fifteen per cent was born outside the region of Aragón. However, geographical origin is not expected to have a significant impact on household income, as a previous study showed that there were no wage differences between natives and immigrants from nearby regions or provinces in 1924.Footnote 24 Only those from large cities and distant provinces had a wage premium, as they typically relocated to Zaragoza to assume high-ranking positions in public administration or the military.
People who migrated from nearby areas may have faced both benefits and challenges. On the one hand, they might have occasionally received cheaper or even free food from family or friends in their home villages, helping them save on food costs or enjoy a more varied diet. On the other hand, they could have had greater family responsibilities, especially if they left behind relatives – such as elderly parents or young siblings – who depended on their support, requiring them to send part of their income back home. Available data shows that in-migrant households supported elderly parents at a similar rate to native households. However, they were over fifty per cent more likely to have siblings or brothers-in-law living with them. This suggests that migrant households may have served as a temporary base for relatives trying out city life, establishing their own households, or even returning to their villages if urban life did not suit them. Without detailed personal histories, it is difficult to determine whether these advantages outweighed the challenges or vice versa. This remains an open question for future research.
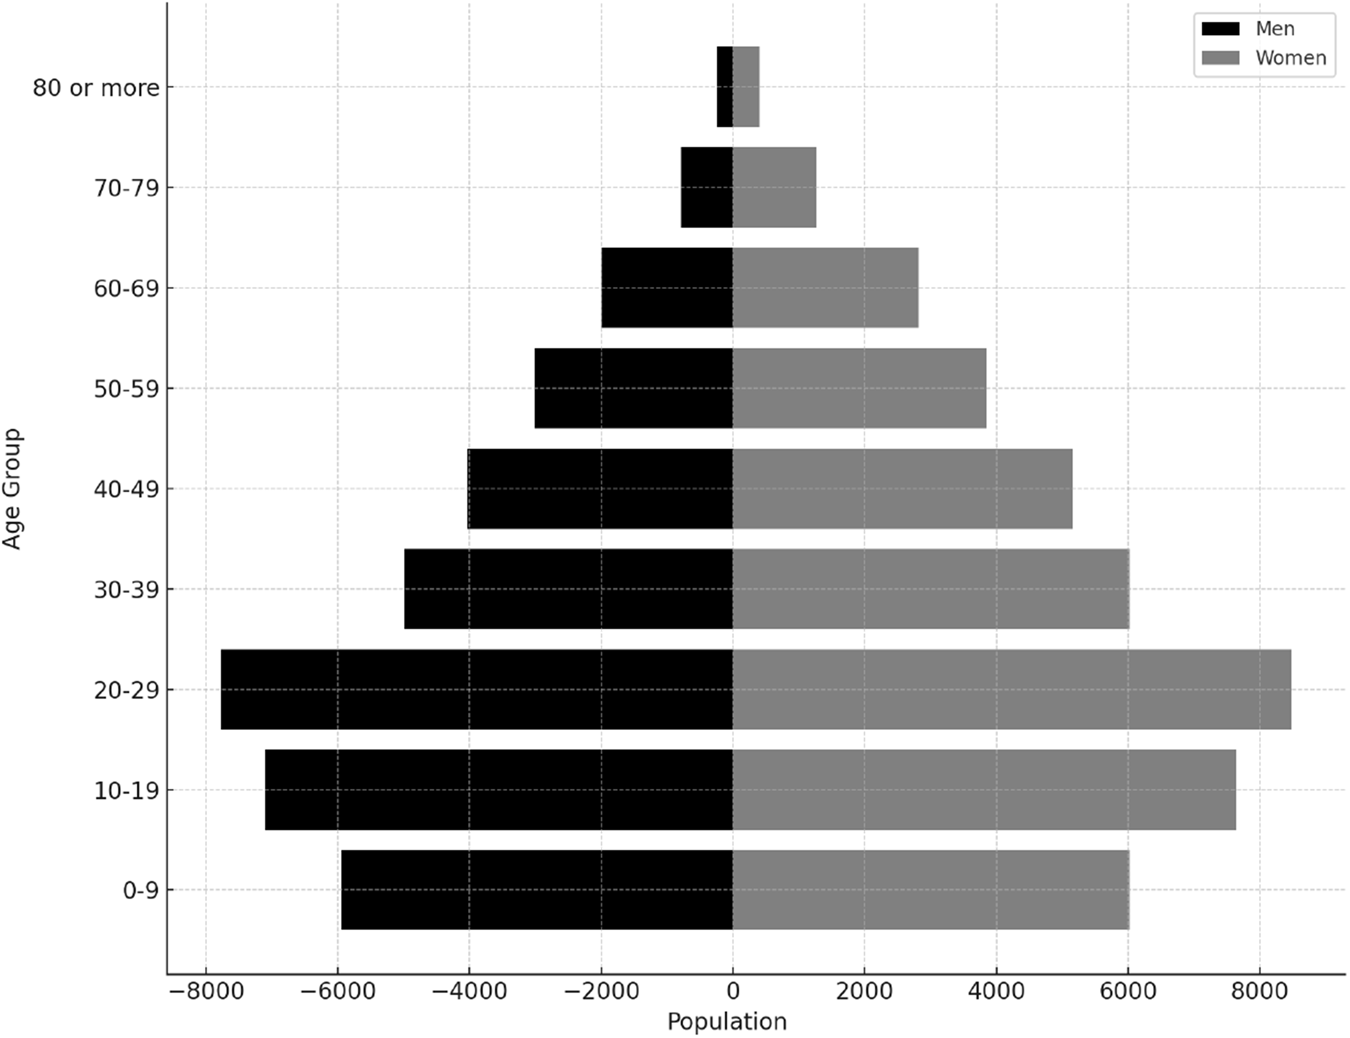
As shown in the population pyramid in Figure 1, the population structure was characterized by a higher percentage of women than men (50.9 per cent females) and a narrowing base. However, the age group with the highest population concentration corresponds to individuals between twenty and twenty-nine years old, a classic scenario of a population undergoing demographic transition. As explained in the previous paragraph, half of this population came from nearby localities and had typically relocated to the town for employment reasons, mostly aged between twenty and thirty.Footnote 25
Population pyramid of the sample, Zaragoza, 1924.
Source: Population list of Zaragoza, 1924.
The economy of Zaragoza underwent a transformation during the industrialization process of the nineteenth century. Initially, the city specialized in agrifood production, focusing on flour, oils, and wine, and later expanding to include significant products such as beets and alfalfa. Additionally, Zaragoza became known for metal processing in relation to agricultural and agro-industrial tools and for the production of beet sugar after Spain lost its last American colonies in 1898.Footnote 26 The industrialization process was further bolstered by the development of the railway in the last third of the nineteenth century and the introduction of gas and electricity as industrial energy sources at the beginning of the twentieth century.Footnote 27
A particularly transformative period for Zaragoza occurred during World War I when Spain remained a neutral country.Footnote 28 Despite the economic development, coordinated urban planning reform was not implemented until 1923. Until then, Zaragoza grew haphazardly in response to the influx of immigrant families. The period from 1923 to 1930 was marked by an upward cycle driven by investments in public works and construction, along with the development of a communications policy and the completion of new railways.Footnote 29
In a broader sense, Zaragoza could to some extent be considered representative of urban Spain owing to its central location, interconnected history, and significant role as an economic and political hub within the country. It has not only witnessed but also mirrored many of the sociocultural changes and developments that have occurred in Spain over the years. Additionally, Zaragoza exemplifies the labour market conditions of northern Spain, particularly noted for its lower unemployment rate compared to the southern half of the country.Footnote 30 In terms of socio-economic distribution and employment opportunities, Zaragoza resembled most medium-sized inland Spanish cities, unlike Barcelona, Bilbao, and Madrid, which were major centres of industrial attraction. Other indicators of economic and biological well-being, such as height, also position Zaragoza as a typical medium-sized inland region.Footnote 31
Data
The study is based on the 1924 population list of the city of Zaragoza, which is the first (and the last) available source in the municipal archive that consistently includes the wages of all residents in the city. As Borderías and Muñoz-Abeledo state: “The 1924 population list offers a unique opportunity to simultaneously analyse household income activity and composition, and thus observe the extent of the breadwinner model among the working classes.”Footnote 32 Moreover, although regulations mandated the recording of wages at the individual level, in large cities these guidelines were often not followed. Instead, the typical population list was compiled without wage data, or, at best, only on a limited scale. Zaragoza stands out as one of the few major Spanish cities that adhered to these requirements with both accuracy and quality, making it the largest city in the north-east to do so. Consequently, the 1924 population list of Zaragoza is doubly exceptional: it is the only source that systematically records all historical wages and represents a rare case of completeness and reliability in an urban setting. This makes it a uniquely valuable source for understanding wage purchasing power in the first third of the twentieth century.
The 1924 population list of Zaragoza was commissioned by the State for statistical purposes. Each municipality was required to annually compile data from the census to ascertain which citizens resided in each locality, how long they had been there, and their distribution. Initially, these data were not recorded for tax purposes, as other more precise sources, such as the Civil Registry or the cadastre, were utilized for that objective. Nevertheless, the development of the Rif War (Morocco, 1920–1927) may have facilitated the concealment of some children or other individuals from the registry. However, we have no evidence to suggest such underreporting occurred. What makes the case for 1924 exceptional is that it is the only year in which the State requested municipalities to collect information on citizens’ wages to account for the entire population rather than relying on small statistical samples.
The preservation of the population list for the city of Zaragoza, along with its public accessibility, is also an exceptional (albeit not unique) case among large Spanish cities. Owing to the enormous volume of information, many municipalities, both large and small, either failed to record wage data accurately or omitted it altogether. In other cases, the data have not been preserved, either owing to issues with conservation or destruction during the Spanish Civil War. Lastly, in some major municipalities, the data have been preserved but remain inaccessible to the public for one of two reasons: either the authorities deem it necessary to protect the information, given that some individuals recorded in the data may still be alive, or the records have not yet been catalogued and remain stored in municipal warehouses along with other accumulated documentation, awaiting integration into the official archive.
The 1924 population list of Zaragoza meticulously documented several key details for each resident: their residential address (including street, number, and floor), the number of individuals residing in the same household, the full name and gender of each resident, their marital status, date of birth (day, month, and year), relationship to the head of the household (spouse, son, daughter, etc.), literacy status, place of origin (locality and province/country), duration of residence in Zaragoza, occupation, and salary. Salaries were recorded in pesetas, the official Spanish currency from 1868 until the introduction of the euro in 2002. Typically, salaries were noted on a daily basis, although monthly or yearly amounts were also included. Therefore, we used daily wages as the basis for our analysis. Annual salaries were primarily recorded for stable professions such as professors, telephone operators, or doctors. Consequently, we opted for a conservative estimate of twenty-two working days per month and 264 working days per year for all monthly and annual salaries.
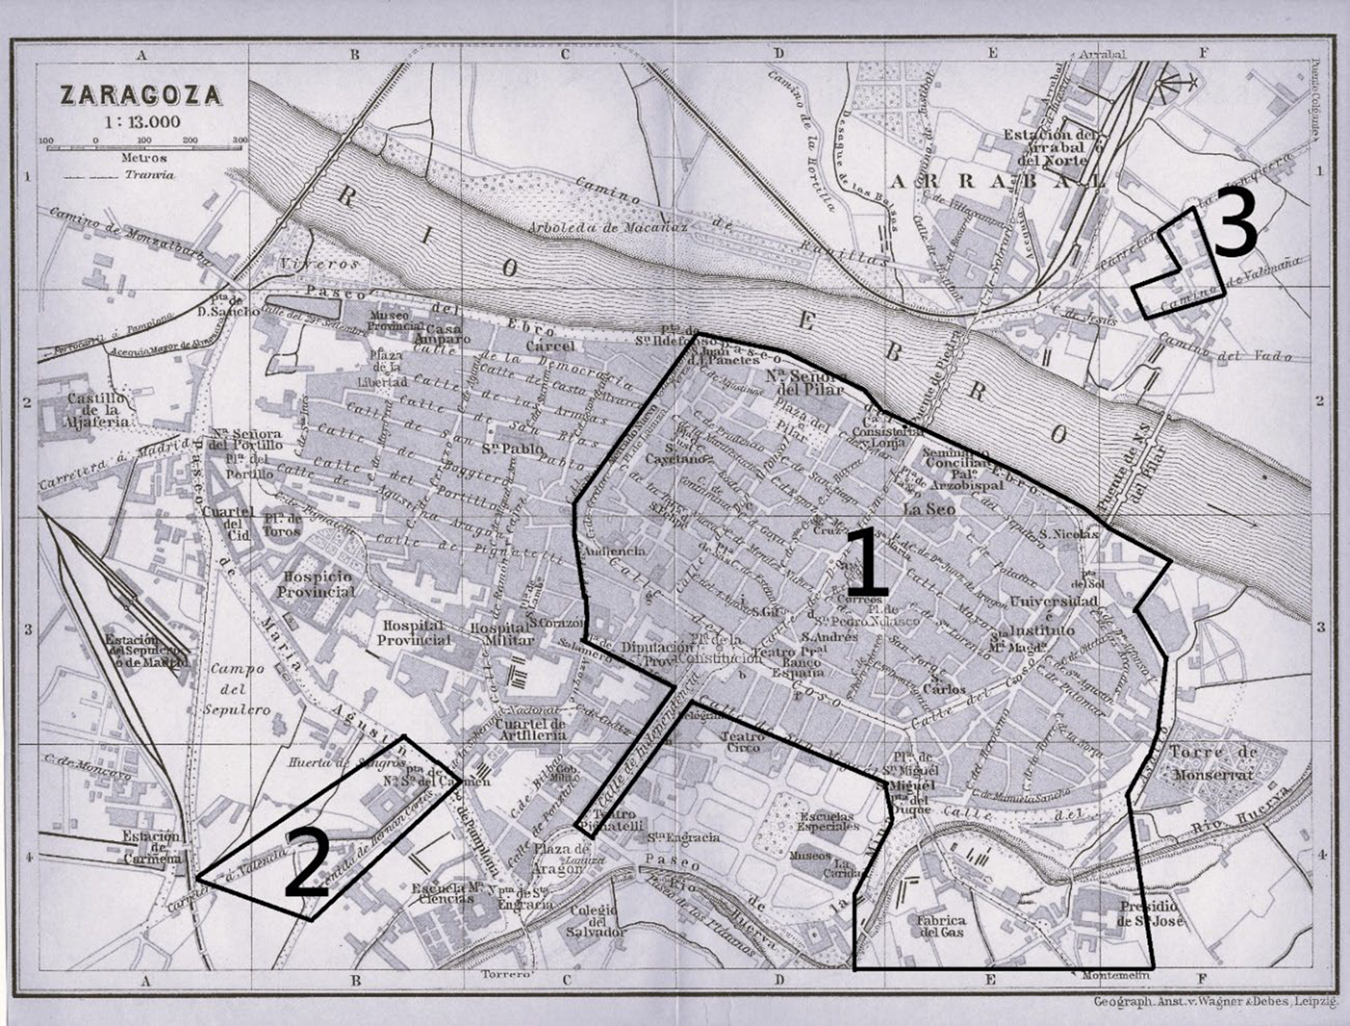
From the ninety-three sections comprising the population list for the city of Zaragoza and surrounding rural villages, we have transcribed over half (forty-seven sections) from the urban area, which we consider representative of the city (see Figure 2). These sections encompass 77,777 individuals (out of nearly 150,000 people in the complete census), grouped into 12,919 households (including barracks or convents in a broad sense). As shown in Figure 2, the studied area encompasses nearly two thirds of Zaragoza's total urban zone, as the remaining portion of the population list corresponds to rural villages surrounding the city. The analysed areas include a diverse range of neighbourhoods, spanning affluent and economically disadvantaged zones, older and newly developed areas, as well as neighbourhoods characterized by immigrant assimilation and others with a strong presence of native residents. This variety reflects a sufficiently representative photograph of the city in 1924, allowing us to reasonably assert that the San Pablo neighbourhood – largely excluded from the sample – does not exhibit significant differences with the rest of the included sample. This is particularly true regarding average household size and family typology, where no substantial differences are observed.
Map of Zaragoza from 1913, featuring three overlaid polygons indicating (approximately) the areas of the city included in the study.
Note: On the map, we have marked three areas of the city whose microdata are included in the study. Polygon 1 corresponds to the historic centre and the expansions towards the Huerva River and Paseo Independencia (Main Avenue). Polygon 2 includes the expansions towards Carretera de Valencia and Avenida de Hernán Cortés. Polygon 3 covers a part of the Arrabal neighbourhood.
Source: Map of Zaragoza from 1913, created and marketed under the legend: “Geograph Anst v Wagner & Debes Leipzig”. Public domain.
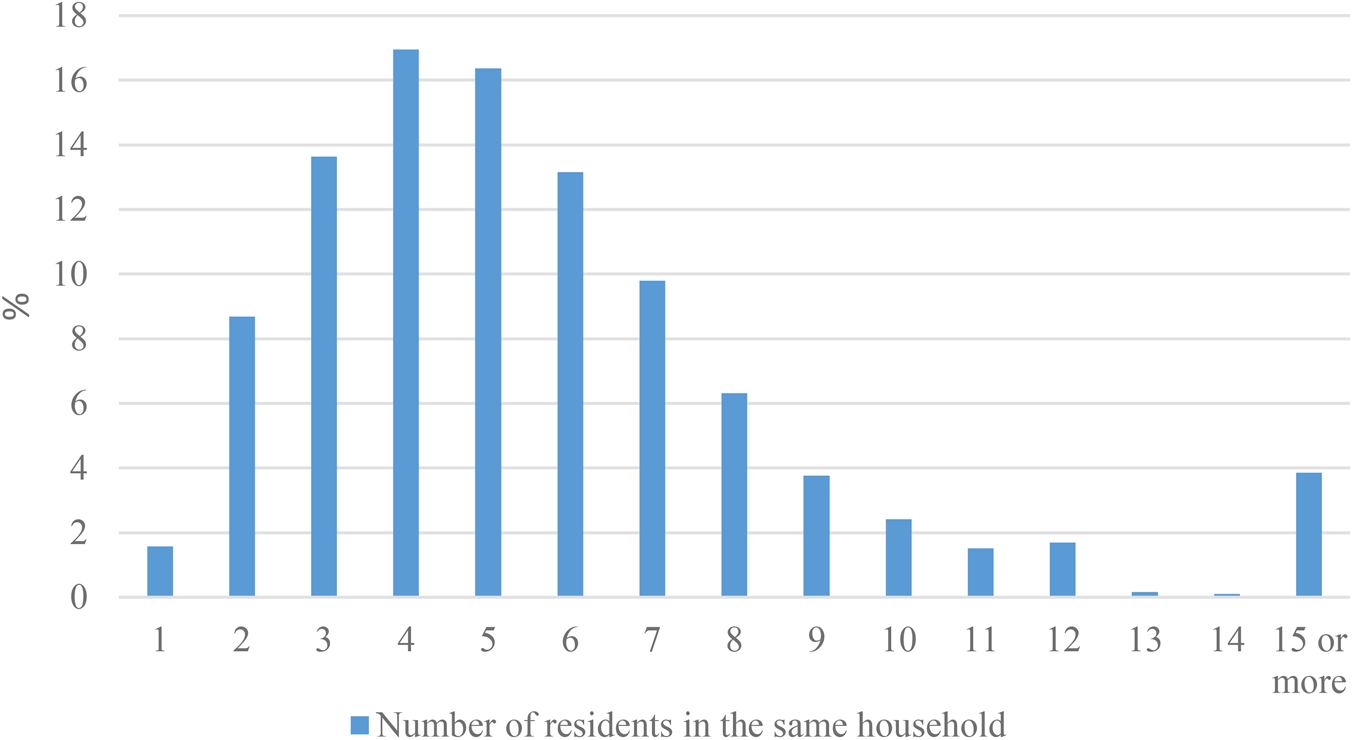
Our main focus of analysis is the household. Each household is identified by its address, with one household per residence. However, we also break down the data further to look at individuals within these households. Therefore, first, we have described the composition of households in the city of Zaragoza. In Figure 3, we can see that, out of the 12,919 households, the most common households consisted of between three and six people (together representing 60 per cent of households) and with an average of 3.7 people per household. Single-person households (typically elderly widows) were rare, accounting for only 1.5 per cent of households. Households with more than eight people were also uncommon.
Number of residents in the household, Zaragoza, 1924.
Source: Population list of Zaragoza, 1924.
In the household records, individuals are listed in order based on their role and importance within the household. The first person listed is always the head of the household (typically a male, if possible), followed by the spouse (if present). Children usually appear in the third position, direct relatives in the fourth, and, finally, other residents such as extended family members and servants. Figure 4 provides an illustrative example of how the population list is organized with respect to individuals’ roles. This positional hierarchy provides clear insights into family roles. For instance, if an elderly man is not listed as the head of the household but appears after his son's or daughter's family, it suggests that he has moved in with his descendant's family to be cared for and no longer holds the role of household head.
Example from the 1924 census showing how households were classified by kinship (section 2, page 25).
Note: The column marked with the red arrow indicates the relationship to the head of the household, providing a basis for establishing a hierarchy.
Source: Population list of Zaragoza, 1924.

It was not typical for two or more large families to live in the same assigned “household”, especially if they were sizeable families (considering that the population list differentiates by the number of the door where families reside, allowing us to identify co-residents). It was more common (though in fewer than twenty-five per cent of households) for a young couple to live with the parents of one of them until they could establish their own household, sometimes including young children. Occasionally, as might be expected in a city experiencing an industrial boom, multiple families shared the same house, floor, and apartment number. However, in most cases, the census takers categorized them as separate households, each assigned an individual family code. It seems likely that family relationships influenced how households were classified. At the same time, some older, larger houses may have had separate living spaces, allowing families to live independently while sharing only certain areas. That said, this approach was not applied consistently, and there is not enough information to fully understand why different methods were used in each case. Figure 5 offers an example of how households were classified for further clarity.
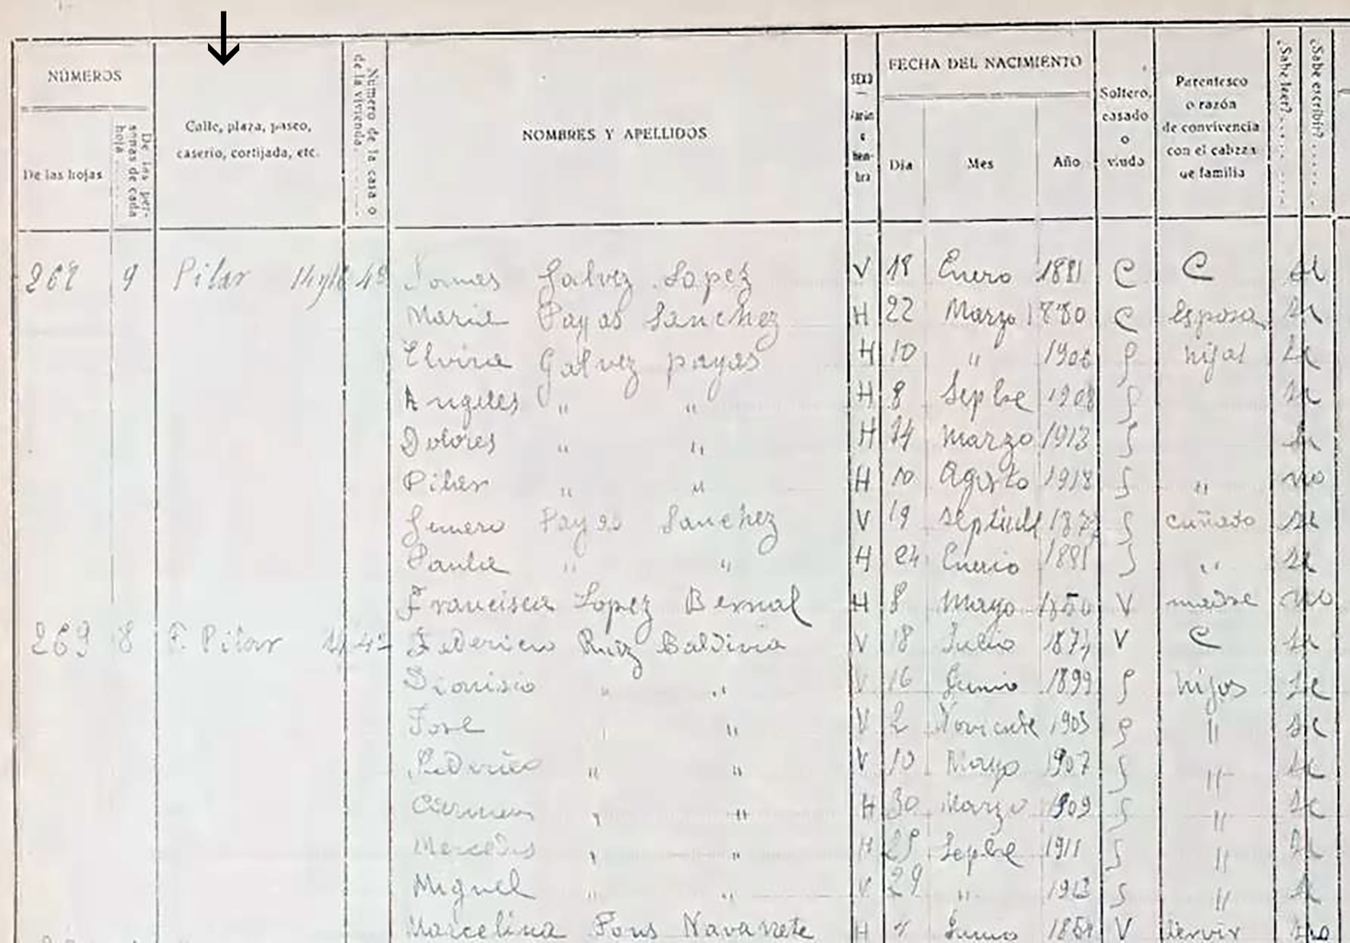
Example from the 1924 census showing two families living in the same household, recorded as separate family units in the registers (section 2, page 43).
Note: The column marked with a red arrow indicates that both Family 268 and Family 269 are living at Plaza del Pilar, number 14, fourth floor. In fact, Family 268 includes not only a family but also the head of household's brother and his wife. In any case, Families 268 and 269 are treated as two separate households. Considering that they occupied an entire floor, it is plausible (though not confirmed) that they resided in distinct living spaces.
Source: Population list of Zaragoza, 1924.
Spain is a country where nuclear households predominate,Footnote 33 and Zaragoza is no exception. In fact, almost seventy-five per cent of households were nuclear (including cases where a parent of one of the spouses was present, provided they occupied a non-active employment position and a final position in the census).Footnote 34 Another 24.4 per cent had other relatives in the household, typically siblings or nieces/nephews, while 0.8 per cent of households could not be classified into any of the aforementioned categories.
It is important to note that households with more than ten people, as depicted in Figure 3 (especially those with over fifteen people), often do not refer to traditional families but rather to groups such as convents, barracks, or student dormitories, which are recorded in the population list as occupying a single residence and thus assigned a household number. Zaragoza has historically been a city abundant with religious congregations and military barracks.Footnote 35
Focusing on families where at least the head of the household and the second member have a familial relationship, we find that 97.4 per cent of all “family” households in Zaragoza had between one and ten residents. Therefore, we will concentrate on households with up to ten residents and exclude the remaining 2.6 per cent from our analysis, as they typically consist of a mix of family, friends, and other difficult-to-categorize individuals.Footnote 36
With salary data, we can calculate a Gini coefficient to measure income inequality in Zaragoza. For the town as a whole, the Gini coefficient for salaries in 1924 was 0.388, a relatively low figure for a developing region during this period. When considering only the salaries of household heads, the Gini coefficient was 0.304, and if we look solely at male household heads, it dropped further to 0.282. In other words, the Gini coefficient for Zaragoza in 1924 falls within the typical range (between 0.25 and 0.55) but lies in the lower half, making Zaragoza a relatively egalitarian town compared with other European places in the first half of the twentieth century.Footnote 37
We identified each individual's occupation according to HISCLASS.Footnote 38 For our purposes, we used a summarized version, HISCLASS 5, as it better suits our visualization objectives and accurately reflects the socio-economic distribution of Zaragoza (see Table 1 for a description of the HISCLASS 5 categories). At that time, the population still had a high proportion of agricultural occupations and a minimal presence of management and administrative roles, though these were growing owing to ongoing industrialization in the city.
Descriptions of the HISCLASS 5 categories.
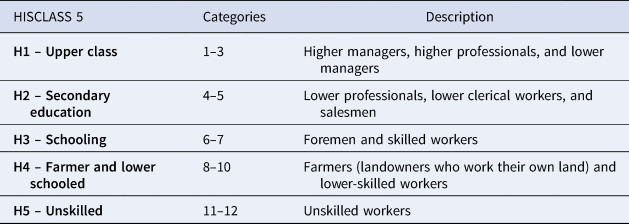
Source: Author's elaboration.
As an alternative approach, we developed our own socio-economic categorization, presented in tables alongside HISCLASS 5. This categorization divides individuals into seven categories: agricultural labourers, factory workers, labourers, traders, military personnel, liberal professionals (such as professors or doctors), and owners of physical capital and land. The purpose of using this additional classification is to distinguish between different types of workers. For instance, within the unskilled group, it is valuable to differentiate between agricultural labourers and industrial workers in a city undergoing industrialization. This also allows us to make comparisons with analyses for Catalonia and Galicia.Footnote 39
Despite the compelling data, several limitations must be considered. First, salaries were self-reported. Each family received a form to complete, either independently or with the assistance of an official, particularly for those who were illiterate. Owing to the lack of alternative sources for comparison, we cannot be certain whether women (or men) exhibited a greater tendency to under-report (or over-report) their wages, similarly to how this may vary by professional category. We also lack a universally accepted method for correcting this issue. Nevertheless, our results are consistent with findings obtained in other regions of Spain.Footnote 40 On the other hand, the census was officially conducted in December 1924, but some evidence suggests it may have also been carried out in the early months of 1925. This raises questions about potential wage variations throughout the year based on demand.
The 1924 population list offers a snapshot of Zaragoza at a particular moment in time. Since we are examining a specific period, individuals may have reported their wages based on health or personal assessments at that point, which may not have fully represented their typical salary. However, the average quality of the data is high given its variability and proven explanatory power. There is significant variability in reported incomes among individuals within the same occupation and household, providing concrete data rather than standardized figures. In contrast, rural sources often reported uniform salaries for most individuals in the same profession.
Household Income
In this section, we will examine how household income is distributed by socio-economic status (using both HISCLASS 5 and the occupational categories explained earlier). In this way, we were able to test hypotheses such as what extent household income depended on a male breadwinner model according to socio-economic category. It is important to note that 2,432 households are excluded from the sample: 18.8 per cent of these households have no reported household income (mostly owing to retired members, 3.9 per cent of the cases, or unemployment, 4.1 per cent of the cases). For retirees, pensions were reserved for a very limited range of professions, such as retired military personnel or high-ranking public officials. As a result, the proportion of individuals reported as retired is quite low. Most continued to engage in occasional work if their physical condition allowed it, or they simply did not report any occupation. In the case of unemployed individuals, it is impossible for us to determine whether their unemployment status was a temporary circumstance at the time the population list was compiled or a more long-term issue caused by health or behavioural problems. Additionally, it is possible that some individuals used this category as a way to withhold information about their occupation or income. Finally, around two per cent of individuals for whom we lack occupational data are categorized as having severe physical or mental disabilities that prevented them from working.
In some cases, households were excluded because certain members – usually the head of the household – had their income recorded as “occasional” rather than a regular salary, which occurred in 8.8 per cent of cases. This occasional income category was more than twice as common among professionals in liberal professions than in the working classes. Unlike workers, who likely had a clearer sense of their average yearly earnings despite fluctuations, it is possible that these professionals used this term to avoid disclosing their exact income. Even so, individuals from all occupational backgrounds did report their earnings, allowing us to identify their income ranges. However, to maintain the integrity of our analysis, we have chosen not to assign estimated incomes, as doing so could introduce additional biases. This careful approach helps ensure that our findings remain as accurate and unbiased as possible.
As expected, we find large wage differences between categories when examining total household income (see Table A1 in the appendix, see Supplementary material). If we compare the average nominal household income of industrial workers (factory), agricultural workers, and construction labourers with those in semi-urban and rural areas of Catalonia (a region with higher income and more industrialization) and Galicia (with lower income and more rural characteristics), we find that incomes are considerably lower than those in the former and somewhat higher than those in the latter.Footnote 41 The same applies to nominal wages for both men and women (results not shown): wages are lower than in Catalonia but higher than in Galicia. Therefore, comparing the results with those of Borderías, there seems to be a positive relationship between wages and urbanization, with Zaragoza positioned between Galicia and Catalonia in terms of wages owing to its intermediate level of urbanization. However, it is important to note that this cannot be confirmed with certainty, as the wages analysed are nominal rather than real. More interesting is the difference depending on their family position (which, obviously, is also related to age, especially between heads and sons). Thus, those who declare themselves as heads of household earn on average seventy-three per cent more daily than sons and sixteen per cent more than others (see Table A2 in the appendix).
Since the aim of this article is to analyse the extent to which the male breadwinner model applies in Zaragoza, we are deeply interested in understanding the role of women in the labour market. A long line of historical studies on the labour of Spanish women has shown that a high percentage of them worked despite being obscured in historical sources.Footnote 42 Therefore, one of the major risks to the accuracy of our study lies in the underreporting of female employment. In Table 2, we have presented the percentage of women who were officially working (and had reported wages). Our results show that approximately fifty per cent of unmarried women had a salary in the population register, whereas this figure dropped to around twenty per cent among married women and 35–40 per cent among widows. These averages are lower compared with summaries presented by Borderías and Muñoz-Abeledo for Spanish regions such as Catalonia and Galicia,Footnote 43 although they are higher than urban data from some localities such as A Coruña (where unmarried women worked in 36.6 per cent of cases, married women in 19.2 per cent, and widows in 27.3 per cent). Therefore, unlike the relationship between the level of urbanization and wages, the connection between urbanization and the female labour force participation rate does not seem as clear. Many areas of Galicia, despite being less urbanized, had higher participation rates than urban Zaragoza. To address the issue of underreporting, Borderías and Muñoz-Abeledo,Footnote 44 among others, assign the same occupation to wives as to husbands, given the historical needs reflected in household budgets in the Spanish context. However, we will work with official data (given its similarity to other urban environments) owing to the significant variability in female wages and possibly in the number of days worked. Additionally, we want to understand to what extent official data show households with a male breadwinner model that are unable to support their family, which could indicate underreporting.
Percentage of women shown as working by marital status and age group between 20 and 69 years in Zaragoza, 1924.
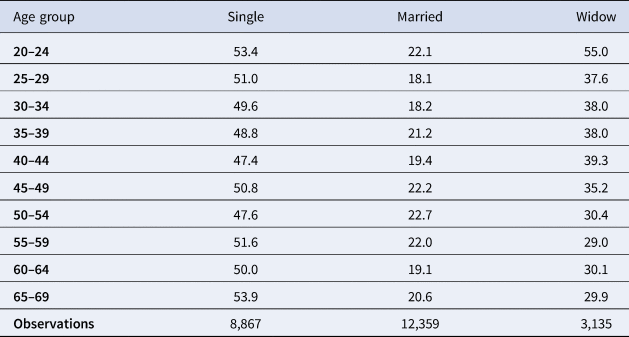
Source: Population list of Zaragoza, 1924.
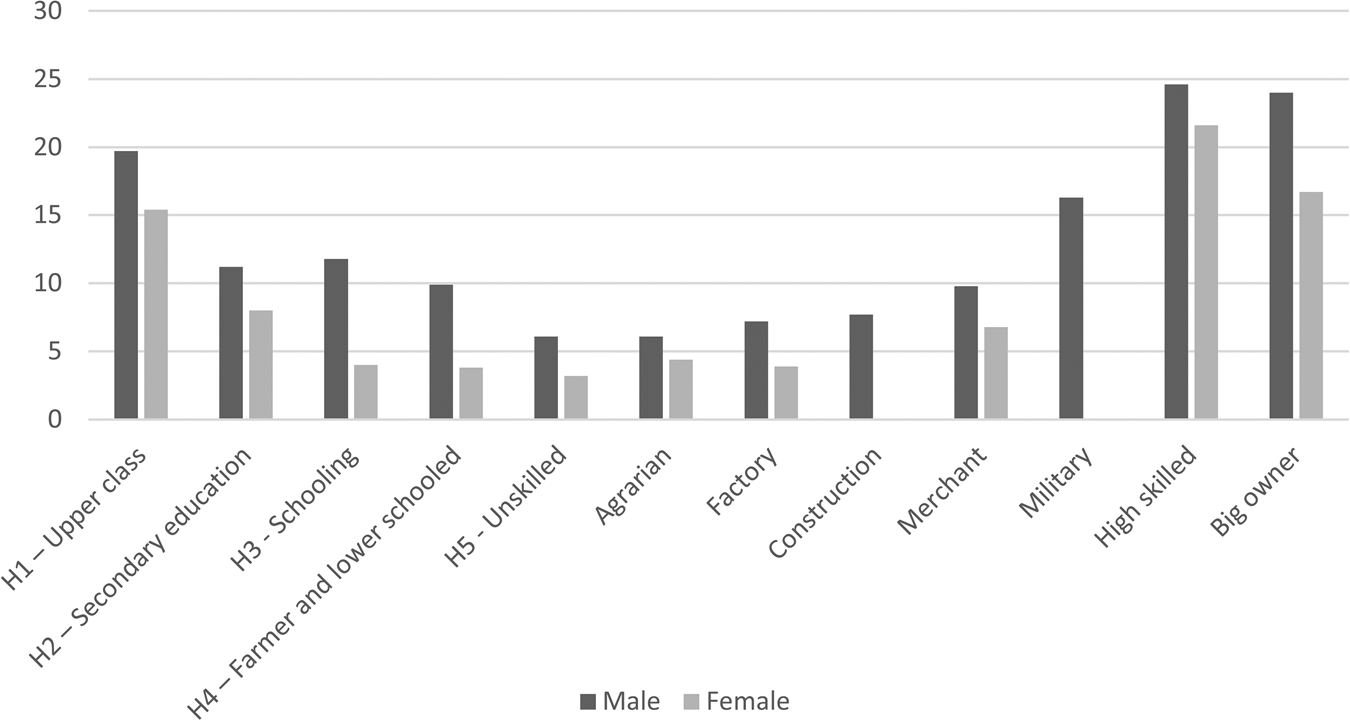
To delve deeper into gender wage differences, Figure 6 shows the salary of heads of households when they are men and when they are women (see Table A3 for the salary of women depending on their role in the family). This allows us to determine that, although with variations by category, the average salary for women acting as heads of households was 58.6 per cent of that for male heads, for spouses it was 42.8 per cent of male heads of households, and in the “other” category, female salaries were 56.5 per cent of male salaries.
Male and female wages of household heads.
Source: Population list of Zaragoza, 1924.
Age may play a fundamental role to understand the salary differences between male heads of households and other family members. Table A4 in the Appendix examines the average salary of men and women across age groups between twenty and sixty-nine years. In both cases, there is an upward trend in salary from younger to older ages (with the exception of the over sixty age group for men). For instance, among men aged twenty to twenty-four, the average salary was 6.1 pesetas, while among those aged fifty-five to fifty-nine, it was 9.5 pesetas, indicating an increase of fifty-six per cent. Similarly, for women in the same age groups (1.8 pesetas vs. 3.5 pesetas), the increase was ninety-four per cent. Thus, average salaries appear to increase with age.
Was the male head of household the one who contributed the majority of wage income to the household? In Table 3, we display the average contribution of each family member to the daily household income. It is important to note that the results have been obtained for all families, regardless of whether the head of the household presents a male breadwinner model, to ensure comparability with cases from Galicia and Catalonia.Footnote 45
Contribution to the average family income of each family member (percentage) according to socio-economic status, Zaragoza, 1924.
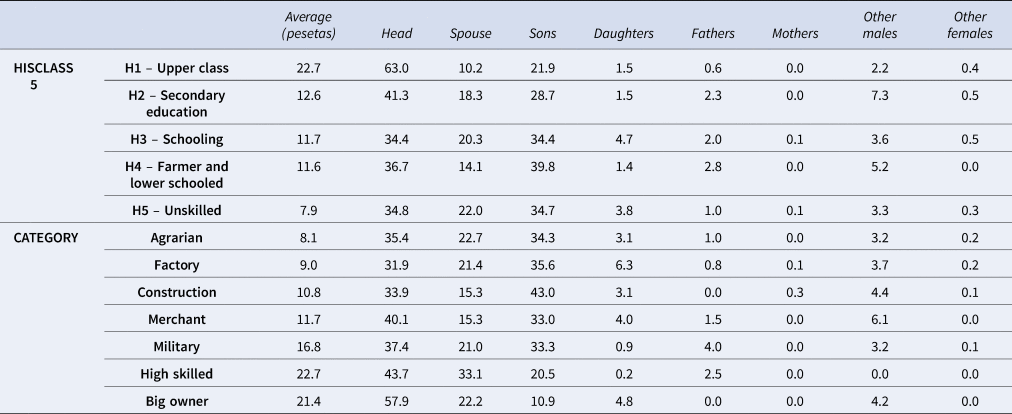
Source: Population list of Zaragoza, 1924.
The results from Table 3 show that, generally, heads of households contribute between thirty and forty-four per cent to the family budget. The only exception to this is the wealthiest individuals (owners of physical capital and others in HISCLASS category 1), whose contribution is around sixty per cent. The contribution of wives proves significant, as they contribute on average between fourteen and thirty-three per cent of the household income (with the negative exception of the wealthiest). Sons also make a strong contribution to the family budget, surpassing wives, contributing between twenty and forty-three per cent of the income. In contrast, daughters have a much less significant participation, contributing at most 6.3 per cent to family income. This demonstrates the traditional preference for sons in Spanish society,Footnote 46 which is reflected in the “official” labour market where sons contribute more to household income. However, as we will discuss later, daughters may be underreporting their income the most (and also enduring lower wages as maids, messengers, or assistants). Finally, it is worth noting that the contribution of other household residents tends to be minimal, only exceeding five per cent in the case of other adult males (brothers, brothers-in-law, nephews, cousins, etc.). This is particularly observed in intermediate categories.
When comparing the results from Zaragoza in 1924 with those from rural Galicia and semi-urban Catalonia,Footnote 47 we find that the contribution of the head of household in Catalonia ranged from 32–42 per cent, and in Galicia from 24–52 per cent. These results are compatible and similar to the 30–44 per cent range observed in our study area. Regarding wives, we found they contributed between 14–33 per cent, without assigning professions and salaries to women lacking such information, which is similar to the 17–21 per cent range in Catalonia and the 19–26 per cent range in Galicia. The rest of our results also show similar patterns to those found in Catalonia and Galicia, demonstrating that our sample is consistent with existing previous studies and that there were no major differences between rural and urban settings in terms of family support. Our results confirm that in Zaragoza, on the one hand, the male breadwinner model does not apply, since the rest of the families contributed a significant part of the wage income. On the other hand, the case also fits perfectly within the case of low wages in Southern Europe, clearly falling below the living standards of other Western European countries during the same period.Footnote 48
Purchasing Capacity
In this section, we examine to what extent families in Zaragoza could afford a basket of basic food consumption. To estimate this purchasing capacity, we will focus on the daily income reported by all household members. However, we are aware that families might have had additional sources of income, such as in-kind payments for agricultural workers, which could have been a significant part of their earnings.Footnote 49 Although the data provided in the population list was not limited to salaries alone but also included other sources of income (for instance, rentiers had a value in pesetas associated with them even if they had no other profession), it is very likely that for some families, a portion of their income was not accounted for in our data. Similarly, the accumulated wealth of some families (especially those of advanced age) could have played a significant role in maintaining family well-being. In any case, determining whether the declared incomes were sufficient to cover basic household expenses in 1924 is of great interest for understanding the reality of urban Spain in the late first quarter of the twentieth century.
The purchasing capacity has been estimated based on three different consumption baskets: two presented by Allen, the bare bones subsistence and respectability baskets,Footnote 50 and another based on the optimal food consumption basket in Spain in 1964.Footnote 51 The first two have been shown in Table 4. Both contain approximately 2100 calories per person per day, but the respectability basket includes a higher protein content and a more varied diet, while the second (bare bones subsistence) has a higher proportion of carbohydrates to reach the 2100 calories. We have adapted Allen's original basket to the foods consumed in Zaragoza (see footnote to Table 4).
Allen's consumption basket adapted to Zaragoza.
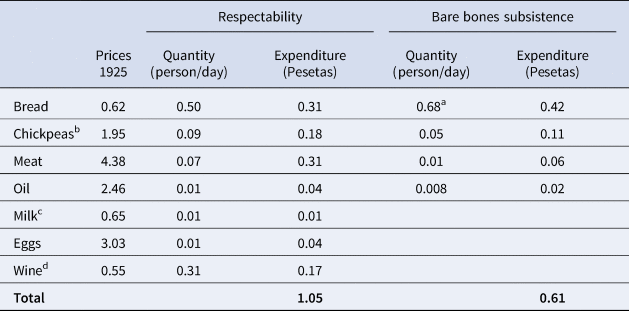
Notes: a) In Allen's original basket, 0.47 kg of oatmeal/grain per person per day is used. In our case, we use 0.68 kg of bread, as it provides approximately the same calories and was the cheapest available carbohydrate in Zaragoza. b) Allen's basket uses beans/peas; we use chickpeas. c) Allen's basket includes cheese; we use a similar amount of milk. d) Allen's basket includes 0.5 litres of beer per person per day. Beer consumption in Zaragoza was very low, and wine was the preferred alcoholic beverage. We use an approximate amount of wine (0.33 litres) equivalent to 0.5 litres of beer. Physical consumption and prices are expressed in kilograms, except for milk, wine, and oil, which are expressed in litres, and eggs, which are expressed in dozens.
Source: Allen, “The High Wage Economy and the Industrial Revolution”.
Following Spanish literature on this issue,Footnote 52 the third basket corresponds to food consumption in Spain in 1964/1965 as the optimal food basket to calculate the needs of an average person/family in Zaragoza in 1924 (see Table 5). The use of this third basket is justified as it goes a step further than the previous two, as it represented an optimal diet for all social classes in 1964, once the country had already industrialized.Footnote 53 These data come from the Household Budget Survey conducted by the National Statistics Institute.Footnote 54 The survey is representative of Spanish society as a whole (around 21,000 households in the sample) and provides a considerable breakdown by product. Although, as Domingo Gallego points out,Footnote 55 based on Xavier Cussó,Footnote 56 this diet involved some deficiencies in micronutrients, such as calcium or iron, for lower-income groups, it is much richer in micronutrients than Allen's two baskets. Additionally, it provided sufficient calories (around 3000) and proteins (considering caloric expenditure) for all income groups.
Optimal consumption basket.
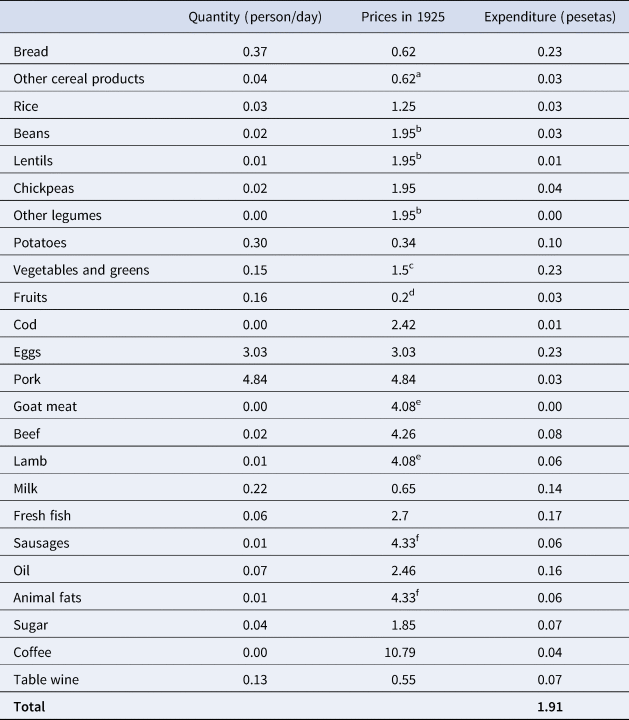
Notes: The 1964 consumption basket provides approximately 2,900 calories. a) There are no price data for this category, so we assume the price is the same as that of bread. b) There are no price data for this category, so we assume the price is the same as that of chickpeas. c) Prices are available only for beans, so we use this as representative for the entire category. d) There are no price data for fruits, so we use the prices provided by Gallego (2016). e) There are no price data for this category, so we assume the price is the same as that of bacon. Physical consumption and prices are expressed in kilograms, except for milk, wine, and oil, which are expressed in litres, and eggs, which are expressed in dozens.
Source: Nicolau-Nos and Pujol-Andreu, “Variaciones regionales de los precios de consumo y de las dietas en España”; INE, Encuesta de presupuestos familiares; Zubero, “Coste de la vida y poder adquisitivo de los trabajadores en Zaragoza”.
Once we have the food consumption in physical quantities, we can use the prices provided by Luis Germán for various foods in 1925,Footnote 57 and this allows us to know the expenditure needed to access each of the baskets. Additionally, since not all household members consume the same amount of food (e.g., a child consumes less than an adult), we have adjusted consumption using weights, which take age and gender into account.Footnote 58
Luis Germán estimates that, on average, working-class families in Zaragoza in the early decades of the twentieth century dedicated 76.3 per cent of their budget to food.Footnote 59 Therefore, if we add housing, clothing, fuel, and so on (applying that 76.3 per cent) to each of the three baskets, the daily basic needs per individual would amount to 0.61 pesetas for the bare bones subsistence, 1.05 for the respectability, and 1.91 for the optimal.
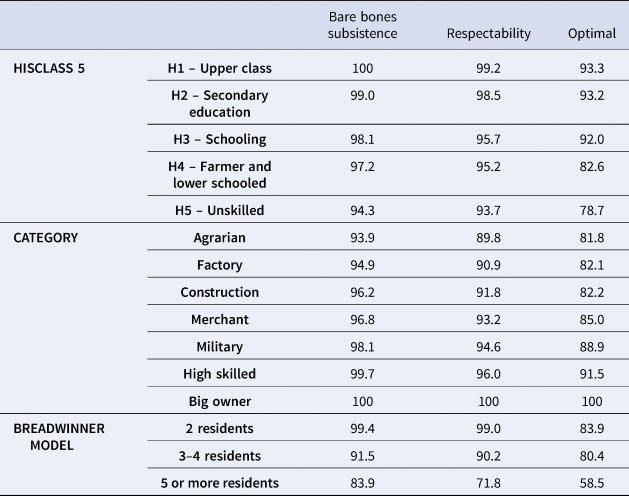
In Table 6, we calculated the per centage of households with declared incomes sufficient to consumer each basket. The results show that the two proposed Allen baskets could be consumed by the majority of the categories shown. Specifically, ninety per cent of households in the less affluent categories (H-5 Unskilled, Agrarian, or Factory) could afford to consume both baskets. However, when it came to the 1964 basket, the percentage of categories that could afford it on the reported wage was lower for these groups (between seventy-eight and eighty-two per cent). Nevertheless, these results may be upwardly biased because the daily wage was not equivalent to the annual wage. Although this varied by region, if we set the number of working days per year at 250, as the literature suggests,Footnote 60 an even smaller percentage of the lower-income classes would be able to consume the 1964 basket (although income beyond wages would need to be considered).
Percentage of households that can afford an optimal basket for all members.
Source: Population list of Zaragoza, 1924.
If we focus solely on families with two adults and two children (see Table A5 in the appendix), only forty per cent of the lowest-wage families could afford the 1964 basket. The last three rows of Table 6 show to what extent the male breadwinner model remains applicable when evaluating purchasing power. We observe that, for households with five or more members (representing sixty per cent of our sample, as shown in Figure 3), the percentage of families able to afford the most basic basket was 83.9 per cent, the respectability basket 71.8 per cent, and the optimal basket only 58.5 per cent. Therefore, the male head of household's wage alone was insufficient for many families to afford even a minimum consumption basket.
Households led by a woman or an individual with a disability faced much greater challenges: only one third of these families could afford the 1964 optimal consumption basket, and their access to Allen's baskets was also limited when considering income alone. This finding underscores the importance of having able-bodied adult males actively participating in the labour market within the household, likely reinforcing the social and familial status of men at that time.
Discussion and Conclusions
This article had two primary objectives. The first was to understand the contribution of each family member to household income within an urban context characterized by low living standards among the working classes. In relation to the first aim, this study has also confirmed that all household members contributed to its upkeep, but some played a more prominent role than others. Again, male wages (given the wage discrimination and possible underreporting of female wages) were key to household sustenance. In an average household, the head of the family represented approximately forty per cent of the household income, a figure similar to that observed in Catalonia (32–42 per cent) and Galicia (24–52 per cent). The woman contributed about twenty-five per cent, sons around thirty per cent, while daughters and other relatives played a residual role. Once again, the results are very similar to those observed in Catalonia and Galicia. The contribution of the head of the household was particularly important (relative to the total) in households headed by a working-age man with a job.
As mentioned earlier, the data may have underreported women's wages, particularly those of wives and daughters, a common issue in historical records.Footnote 61 One way to address this issue is to assign the occupations of husbands to their wives when the latter have no declared occupation, as done by Borderías and other works,Footnote 62 although this method also risks over-estimation. In our case, we have relied on the official data. However, this underreporting could also be evidence of the precarious nature of women's work in the 1920s, with greater volatility and very low wages. For instance, the average declared wage for women in manual occupations was half that of men, even without considering a possible premium for greater seasonality.
Within the working class, significant differences existed depending on the type of work. Higher wages for construction workers compared with agricultural labourers were common in Spain and other European countries.Footnote 63 For example, among male heads of households, labourers earned 6.1 pesetas per day, while factory workers earned 7.2 pesetas.
One of the main advantages of this study is the availability of income data for each family member, which enables a more precise analysis of household purchasing power. Although the data are limited to the year 1924, this approach addresses one of the key challenges in this field of research.Footnote 64
The second objective of this study was to determine the extent to which household income could provide an acceptable standard of living for its members. Our results for Zaragoza seem to confirm that the male breadwinner family model did not hold for the lower-income classes. The welfare ratios proposed by Allen still yielded very unsatisfactory results in 1924,Footnote 65 because Zaragoza (like the rest of the country) was characterized by a significant contribution to household income from wives, children, and even other male relatives.
Although a male breadwinner could not sustain (on average) the entire household, he made the most significant contribution to the family. Indeed, families with a male wage earner as the head of the household were more than three times as likely to afford the basic basket compared with those headed by a woman. Furthermore, these families were seven times more likely to meet this need than families headed by an unemployed person. Obviously, occupational category also mattered in family income and purchasing power. As expected, higher socio-economic status groups had daily incomes that doubled or even tripled those of the working class in Zaragoza.
According to our calculations, a significant portion of working-class families (around twenty per cent) could not afford to consume an optimal basket, represented as the average food consumption in Zaragoza in 1964, once the country was industrialized. Indeed, if we consider a family with a father, mother, and two children, the percentage of families unable to afford it was approximately sixty per cent. Moreover, this may be underestimated, as the wages earned were not necessarily received every day of the year. Therefore, while it is true that the absolute poverty line, understood as the bare bones subsistence or the respectability basket (around 2100 calories), could indeed be afforded by most families in Zaragoza, a consumption basket richer in vitamins and other micronutrients was still not accessible to all families.
Based on the data on caloric and micronutrient requirements provided by Cussó for the Spanish population in 1930,Footnote 66 it is evident that Allen's two baskets are tremendously insufficient in terms of micronutrients such as iron, calcium, zinc, vitamin A, and folic acid. In any case, the fact that a large percentage of the working-class families, despite being employed, could not even cover the minimum needs for themselves and their children reflects the reality of insufficient wages and widespread poverty in the urban environment.
Does this imply that the classic approach of Allen's welfare ratios, where the male head of household's wage can support the entire family, is incorrect? It depends on the objective of the study. Undoubtedly, one of the strengths of this method is the ease of data collection and, in turn, the international comparability it enables. If we aim to consider other family incomes and different social classes, a richer database is required. Therefore, a longer-term study with improved international comparability (though with less depth in variable analysis) on urban living standards in early twentieth-century Spain remains a task for future research.
One final question. Can Zaragoza be considered representative of urban Spain as a whole? It is very difficult to provide a definitive answer to this question. Clearly, it cannot be compared with the major industrial hubs. The employment opportunities in factories were relatively scarce compared with larger centres such as Barcelona, Bilbao, and Madrid. In 1924, Zaragoza still had twice as many workers in agricultural jobs (forty per cent) as in factories (twenty per cent). However, Zaragoza's case aligns with previous studies conducted in Catalonia and Galicia.Footnote 67 Additionally, socio-economic indicators suggest that Zaragoza fits within the broader category of medium-sized inland cities in Spain.Footnote 68 Therefore, while we cannot assert with absolute certainty that Zaragoza is fully representative, we cannot overlook the consistency of the socio-economic variables and the results of this study with what is known about much of Spain undergoing industrialization (without being a primary industrial centre).
In conclusion, this study has shown that in a relatively dynamic Spanish city in 1924, during a period of industrialization, living standards were low, with wages that often did not even allow the purchase of an optimal food basket. Although most households were largely able to afford Allen's basic consumption baskets, this was no longer the case for working-class families when examining a typical nuclear household of two parents and two children. Hence, the over-reliance on wheat and cereals likely persisted. As expected, the quality of life depended on the socio-economic group of the family. However, there were small signs of hope. The new jobs created by factories (Zaragoza was undergoing an industrialization process that would fully take off a few decades later) for unskilled individuals offered wages fifteen per cent higher than those of traditional unskilled agricultural labourers. The city's development was also associated with more employment in coordination and management sectors (intermediate HISCLASS categories) and increased demand for doctors, teachers, lawyers, and other professionals.
Supplementary material
The supplementary material for this article can be found at https://doi.org/10.1017/S0020859025000069


 Open access