


Introduction
Nitrogen (N) is a limiting nutrient in many agricultural systems; therefore, much effort is devoted to ensuring its availability to crops while preventing its loss to other ecosystems (Robertson and Vitousek Reference Robertson and Vitousek2009). While weeds can take up unused soil N, preventing its loss from the soil, they can also compete with crops for N, resulting in crop yield loss (Zimdahl Reference Zimdahl2008). Minimizing crop yield loss due to weed competition for soil N is a primary motivation for controlling weeds; accordingly, a better understanding of how weeds acquire and use N from the soil could lead to improved strategies for managing both weeds and N in agroecosystems (Little et al. Reference Little, DiTommaso, Westbrook, Ketterings and Mohler2021). Additionally, while weeds can acquire limiting resources, our mechanistic understanding of the drivers of weed–crop competition remains unresolved (Horvath et al. Reference Horvath, Clay, Swanton, Anderson and Chao2023; Swanton et al. Reference Swanton, Nkoa and Blackshaw2015; Zimdahl Reference Zimdahl2008). Therefore, an improved understanding of how weeds acquire and partition N could help shed additional light on the ecological basis for weed–crop competition for soil resources (Bennett et al. Reference Bennett, Bending, Chandler, Hilton and Mills2012; Carr et al. Reference Carr, Cavigelli, Darby, Delate, Eberly, Gramig, Heckman, Mallory, Reeve, Silva, Suchoff and Woodley2019; Johnson et al. Reference Johnson, Copeland, Crookston and Pfleger1992; Smith et al. Reference Smith, Mortensen and Ryan2010).
Our understanding of N acquisition by plants has evolved in recent decades (Lipson and Näsholm Reference Lipson and Näsholm2001; Robertson and Vitousek Reference Robertson and Vitousek2009). It has become clear that plants in many ecosystems—including agroecosystems—access a portion of their N in organic forms such as amino acids (Bardgett et al. Reference Bardgett, Streeter and Bol2003; Lipson and Näsholm Reference Lipson and Näsholm2001; McKane et al. Reference McKane, Johnson, Shaver, Nadelhoffer, Rastetter, Fry, Giblin, Kielland, Kwlatkowski, Laundre and Murray2002; Näsholm et al. Reference Näsholm, Huss-Danell and Hogberg2000; Reeve et al. Reference Reeve, Smith, Carpenter-Boggs and Reganold2009; Streeter et al. Reference Streeter, Bol and Bardgett2000). Both mycorrhizal and non-mycorrhizal species can directly take up organic N (Ganeteg et al. Reference Ganeteg, Ahmad, Jämtgård, Aguetoni-Cambui, Inselsbacher, Svennerstam, Schmidt and Näsholm2017), and there is evidence for species-specific preferential uptake of certain organic forms (Weigelt et al. Reference Weigelt, Bol and Bardgett2005). While previous research has confirmed the direct uptake of organic N in many plant species, the relative importance of organic N to overall plant nutrition remains contested (Jones et al. Reference Jones, Healey, Willett, Farrar and Hodge2005; Kuzyakov and Xu Reference Kuzyakov and Xu2013). However, the ability of crops to access and use amino acids suggests organic N may play an important role in crop nutrition under certain fertility conditions (Perez et al. Reference Perez, Zhang, Wang, Ye and Huang2015).
Previous research on crops has demonstrated that crop performance can be affected by the relative availability of different forms of inorganic and organic N, suggesting that different crop species preferentially acquire specific forms of N (Näsholm et al. Reference Näsholm, Huss-Danell and Hogberg2000; Reddy and Reddy Reference Reddy and Reddy1993). Similarly, previous research has demonstrated that weeds respond differently to inorganic and organic fertilizers (Blackshaw Reference Blackshaw2005; Dyck et al. Reference Dyck, Liebman and Erich1995). However, it remains unclear whether these differential responses are due to preferential uptake of certain forms of N, including organic N, or merely differences in the rate and timing of N mineralization (Blackshaw et al. Reference Blackshaw, Brandt, Janzen, Entz, Grant and Derksen2003; Salas et al. Reference Salas, Hickman, Huber and Schreiber1997). Understanding whether and how weed species differ in their N-form preference and uptake could improve integrated weed management via fertility manipulations (e.g., Carr et al. Reference Carr, Cavigelli, Darby, Delate, Eberly, Gramig, Heckman, Mallory, Reeve, Silva, Suchoff and Woodley2019; Liebman and Davis Reference Liebman and Davis2000; Little et al. Reference Little, DiTommaso, Westbrook, Ketterings and Mohler2021). Further, if weeds vary in their relative preference for different forms of N, this insight could help explain apparent variation in weed–crop competitive interactions across different cropping systems (e.g., Ryan et al. Reference Ryan, Mortensen, Bastiaans, Teasdale, Mirsky, Curran, Seidel, Wilson and Hepperly2010). It could also improve management strategies for making cropping systems more resilient to weed interference (Carr et al. Reference Carr, Cavigelli, Darby, Delate, Eberly, Gramig, Heckman, Mallory, Reeve, Silva, Suchoff and Woodley2019; Little et al. Reference Little, DiTommaso, Westbrook, Ketterings and Mohler2021; Ryan et al. Reference Ryan, Smith, Mortensen, Teasdale, Curran, Seidel and Shumway2009; Smith et al. Reference Smith, Mortensen and Ryan2010).
We conducted a controlled environment experiment using stable isotopes to determine the uptake and partitioning of organic and inorganic forms of N (amino acids, ammonium, and nitrate) by seven common weed and non-weed species. We applied 15N-labeled ammonium and nitrate and a complete amino acid mixture labeled with both 15N and 13C to pots containing each species and measured labeled N and C in root and shoot tissues. Based on the growing body of evidence that many plant species acquire intact amino acids (organic N), we hypothesized that both weed and non-weed species would take up intact amino acids; however, their relative ability to acquire organic N would vary. Additionally, we hypothesized that N uptake patterns would be more similar among closely related species.
Materials and Methods
The pulse-chase labeling experiment was conducted at the University of New Hampshire’s Macfarlane Greenhouse Facility in Durham, NH. Eight common agricultural weed species and one crop species, sorghum-sudangrass, were included (Table 1), and the design was a randomized complete block with five replications. Sorghum-sudangrass [Sorghum bicolor (L.) Moench × Sorghum bicolor (L.) ssp. drummondii (Nees ex Steud.) de Wet & Harlan] was chosen because it responds to nitrogen fertilizer and reliably germinates and grows under greenhouse conditions. Because of poor emergence and seedling survival, one species, common ragweed (Ambrosia artemisiifolia L.), was excluded from the analysis. When natural light levels fell below 300 µmol m−2 s− 1 photosynthetically active radiation, supplemental lighting was used to maintain 16-h growing days. The mean greenhouse temperature was 26.1 C, and humidity was 60%. Plants were grown for a 24-d period in July and August 2015.
The eight species included in the nitrogen (N) uptake experiment and their associated functional groupings.

We used a semi-hydroponic growing system with 15-cm-high by 13-cm-diameter pots filled to a depth of 10 cm with sand (washed, grain size 0.3 to 1.2 mm; 1,650 g pot− 1). Following germination tests, we planted three or five seeds of a single species per pot and thinned pots after seedlings emerged to leave one healthy individual. Pots were irrigated daily for 3-min intervals four times a day, first with water until seedlings emerged, followed by a complete nutrient solution (Hawkins and George Reference Hawkins and George1997; Medeiros et al. Reference Medeiros, Clark and Ellis1994) after emergence. The nutrient solution provided 20 mg N day− 1 per pot for 22 d, a rate intended to exceed the demand of the plant, and included the following compounds (mM): Ca(NO3)2·4H2O (2), NaH2PO4·2H2O (0.0094), Na2HPO4·12H2O (0.006), MgSO4·7H2O (0.75), CaCl2·2H2O (1), KH2PO4 (0.185), KCl (2), ethylenediaminetetraacetic acid (EDTA) (0.0223), 2-(4-Morpholino)-ethane sulfonic acid (MES)-NaOH (0.15), and Solid-MES (0.15). Additionally, the solution included the following micronutrients (μM): H3BO3 (69), MnSO4·4H2O (10.4), ZnSO4·7H2O (1.2), CuSO4·5H2O (1.7), NaMoO4·2H2O (0.13), and ethylenediamine-N,N'-bis((2-hydroxyphenyl)acetate) ferric (FeEDDHA) (0.3).
On day 23, one full day before the application of the labeled N treatments, we transitioned the plants to a nutrient solution that contained three unlabeled N forms. We applied the unlabeled N mixture in a 10-ml solution to each pot. Additional irrigation with an N-free nutrient solution was then continued as needed for the remainder of the experiment. The unlabeled N mixture was made by replacing Ca(NO3)2 with an N-equivalent combination of algal-derived amino acids in a mixture (Cambridge Isotope Laboratories, Tewksbury, MA, USA), KNO3, and NH4Cl at a ratio of 10:45:45. The amino acid mixture was not used in the grow-out phase of the experiment because of cost constraints. The ratio of organic to inorganic N selected represents the availability of inorganic forms found in most agricultural soils (Glass Reference Glass2009; Jones et al. Reference Jones, Kielland, Sinclair, Dahlgren, Newsham, Farrar and Murphy2009). The use of an amino acid mixture in this experiment is more likely to approximate the diversity of amino acids within the natural soil organic N pool than a single amino acid would (Vadeboncoeur et al. Reference Vadeboncoeur, Ouimette and Hobbie2015). The mixture included the following 16 amino acids in order of decreasing percentage of the mixture: leucine, glutamic acid, alanine, valine, isoleucine, phenylalanine, aspartic acid, glycine, threonine, proline, tyrosine, arginine, lysine, serine, histidine, and methionine.
Throughout the labeling portion of the experiment, all treatments continued to receive a mixture of N forms in the 10:45:45 ratio. The control treatment received an unlabeled mixture, while the 15N-enriched treatments were constructed by replacing a fraction (2%) of the respective N form with 15N. For example, the labeled nitrate treatment received 10% N from unlabeled amino acids, 45% from unlabeled ammonium (NH4Cl), and 45% from nitrate, which was composed of 2% K15NO3 and 98% KNO3. The labeled ammonium and amino acid treatments were constructed in a similar manner, each receiving N from all sources and partitioning the target N form using 2% labeled material.
We applied the 15N treatments by hand in a 10-ml solution after flushing the pots with water to reduce residual nitrogen. At the same time the label treatments were applied, we added 20 mg unlabeled N as a mixture of all three forms to the control treatments. All plants were harvested 24 h after labeling. The roots were separated from shoots and rinsed with water to remove sand and rinsed again with 0.05 M CaCl2 to remove any residual N on root surfaces. We dried all plant material at 65 C to a constant weight. We then weighed, ground, and analyzed root and shoot material from each pot for %C, %N, δ13C, and δ15N (Elementar Americas Pyrocube elemental analyzer coupled to a GeovisION isotope ratio mass spectrometer, University of New Hampshire Stable Isotope Laboratory, Durham, NH, USA). Concurrently run standards included acetanilide, Atlantic cod (Gadus morhua), black spruce [Picea mariana (Mill.) Britton, Sterns & Poggenb. var. mariana] needles, sorghum flour, corn (Zea mays L.) gluten, NIST 1515 apple (Malus pumila Mill.) leaves, and tuna (Thunnus spp.). We evaluated the fate of 15N in the following ways, approximating the approach outlined in Huangfu et al. (Reference Huangfu, Li and Hui2019). Results from the isotopic analysis of roots and shoots (δ15N) were first converted to atom percent (AP), then subsequently to atom percent excess 15N (APE) (Fry Reference Fry2006; Equation 1):
 $${\rm{APE}}{ = ^{{\rm{15}}}}{\rm{A}}{{\rm{P}}_{{\rm{treatment}}}}{ - ^{{\rm{15}}}}{\rm{A}}{{\rm{P}}_{{\rm{control}}}}$$
The APE is the AP of the labeled plant for a given N treatment minus the mean AP of the control plants (n = 5) for each respective species and tissue type (root or shoot). For the dual-labeled amino acid treatment, we calculated APE 13C the same way.
The relative recovery of 15N by each species was calculated using APE 15N values of root and shoot tissue. For a given species, the relative recovery of each N form was calculated as the percentage of 15N derived from all three N treatments (Equation 2, e.g., labeled amino acid treatment).
 $$\eqalign{{\rm{Relative \ recover}}{{\rm{y}}_{{\rm{amino \,acid}}}} = ({\rm{AP}}{{\rm{E}}^{{\rm{15}}}}{\rm{N}}\,{\rm{roots}} + {\rm{shoot}}{{\rm{s}}_{{\rm{amino \,acid}}}})/ \cr ({\rm{AP}}{{\rm{E}}^{{\rm{15}}}}{\rm{N}}\,{\rm{roots}} + {\rm{shoot}}{{\rm{s}}_{{\rm{amino \,acid}} + {\rm{nitrate}} + {\rm{ammonium}}}}) \times {\rm{1}}00 \cr} $$
To determine the total amount of label recovered by each species for each N treatment, the total amount of label uptake was calculated for roots and shoots by multiplying tissue biomass (g dry weight), APE 15N, and N content of tissue (mg N g− 1 dry weight), and then summing root and shoot values for each plant (McKane et al. Reference McKane, Johnson, Shaver, Nadelhoffer, Rastetter, Fry, Giblin, Kielland, Kwlatkowski, Laundre and Murray2002; Equation 3).
 $${{\rm{Total}}\,\,{\rm{label}}\,\,{\rm{uptake}} = \left( {{\rm{Tissue}}\,{\rm{biomas}}{{\rm{s}}_{{\rm{roots}}}}{ \times ^{{\rm{15}}}}{\rm{N}}\,{\rm{AP}}{{\rm{E}}_{{\rm{roots}}}} \times \% {{\rm{N}}_{{\rm{roots}}}}} \right)}$$
 $$+ \left( {{\rm{tissue}}\,{\rm{biomas}}{{\rm{s}}_{{\rm{shoots}}}}{ \times ^{{\rm{15}}}}{\rm{N AP}}{{\rm{E}}_{{\rm{shoots}}}} \times \% {{\rm{N}}_{{\rm{shoots}}}}} \right)$$
The use of a dual-labeled amino acid allows us to conservatively estimate the recovery and retention of intact amino acids by comparing the ratio of 15N APE to 13C APE in the labeled fertilizer and in the sample plant tissues (Näsholm et al. Reference Näsholm, Ekblad, Nordin, Giesler, Högberg and Högberg1998, Reference Näsholm, Huss-Danell and Hogberg2000). We calculated an estimated percent intact amino acid uptake by dividing the ratio found in tissues by that of the applied fertilizer.
To determine whether species can be classified by their N uptake patterns, we conducted a linear discriminant analysis. The discriminant analysis was run using the direct method on logit-transformed 15N APE values for root and shoot tissues.
We used ANOVA to evaluate differences among species in APE 15N, relative 15N recovery, and total 15N uptake. We examined species differences in APE within N treatments and tissue type (root or shoot). Total N uptake and relative recovery of treatment N forms were calculated for the whole plant rather than separated by tissue; therefore, we evaluated species differences within N treatments. In each case, species was considered a fixed factor and replication a random effect. When the main species effect was significant (P < 0.05), a Tukey honest significant difference (HSD) test was used to compare species means. We checked the data and model residuals and logit-transformed percentage values to ensure the assumptions of the test were met. The relative recovery analysis was subjected to a retrospective power analysis (α = 0.05). All analyses were conducted using JMP (v. 14.2.0, SAS Institute, Cary, NC, USA).
Results and Discussion
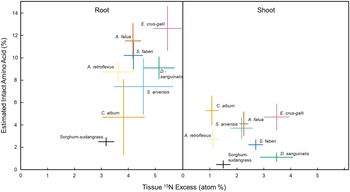
There is growing evidence across a range of ecosystems that some plant species can access organic N pools directly (Näsholm et al. Reference Näsholm, Kielland and Ganeteg2009). We observed weed species using organic N, a proportion of which was acquired as intact amino acids, even when inorganic forms were readily available. Across species, relative uptake of amino acid uptake ranged from 3% to 10% of total N, suggesting differential preference for organic N forms by some species (Table 2). Of the amino acid–derived 15N taken up by the species, an estimated 3% to 17% was taken up as whole amino acids, including 0.5% to 5% whole amino acid translocation to the shoots (Figure 1). Greater overall uptake of 15N from the labeled amino acid treatment was associated with greater estimated intact uptake and retention in root tissues, whereas translocation of whole amino acids to the shoots was species dependent (Figure 1). Interestingly, sorghum-sudangrass had relatively low amino acid–derived 15N in both root and shoot tissues and lower levels of amino acid 15N translocation to shoots compared with the weed species examined in this study. In contrast, common lambsquarters (Chenopodium album L.) and barnyardgrass [Echinochloa crus-galli (L.) P. Beauv.] had comparatively high levels of intact amino acid 15N translocation to shoots, despite E. crus-galli having a higher overall affinity for amino acid N (Figure 1; Table 3).
Relative recovery of each of the three nitrogen (N) forms calculated for each species using the amount of label measured in the whole plant (atom percent excess 15N [15N APE]). a

a Data are means ± SE (n = 5).
Estimated intact amino acid uptake (root) and translocation (shoot) plotted against the excess 15N (atom percent excess 15N [15N APE]) found in each respective tissue type (amino acid 15N treatment only) for each weed species. Whole amino acid uptake and translocation were calculated by dividing the observed 15N:13C in plant tissue with the measured 15N:13C in the dual-labeled fertilizer. Data are means ± SE (n = 5). See Table 1 for list of full species names.

Shoot tissue atom percent excess (APE) of 15N following a 24-h labeling experiment. a

a Data are means of root and shoot values ± SE (n = 5). Within a column, means sharing the same letter are not significantly different (Tukey honest significant difference [HSD] test, α = 0.05).
Several temperate grassland species and crop species have been shown to acquire amino acids (e.g., Bardgett et al. Reference Bardgett, Streeter and Bol2003; Czaban et al. Reference Czaban, Jämtgård, Näsholm, Rasmussen, Nicolaisen and Fomsgaard2016; Harrison et al. Reference Harrison, Bol and Bardgett2007; Näsholm et al. Reference Näsholm, Huss-Danell and Hogberg2000; Okamoto et al. Reference Okamoto, Okada, Watanabe and Ae2003; Owen and Jones Reference Owen and Jones2001; Streeter et al. Reference Streeter, Bol and Bardgett2000; Weigelt et al. Reference Weigelt, Bol and Bardgett2005; Yamagata et al. Reference Yamagata, Matsumoto and Ae2001). However, to our knowledge, this is the first confirmation of whole amino acid uptake by common agricultural weed species, apart from Arabidopsis thaliana (L.) Heynh. (Ganeteg et al. Reference Ganeteg, Ahmad, Jämtgård, Aguetoni-Cambui, Inselsbacher, Svennerstam, Schmidt and Näsholm2017; McNickle et al. Reference McNickle, Deyholos and Cahill2013). Our estimates of whole amino acid uptake for the species included in our study do not rule out the possibility that some of the co-occurrence of labeled C and N was due to independent mineralization and uptake of the constituent C and N (Rasmussen et al. Reference Rasmussen, Sauheitl, Eriksen and Kuzyakov2010 and others); however, it is also possible we are underestimating whole amino acid uptake, as we do not account for possible carbon losses from respiration or other physiological processes, which can occur rapidly following uptake (Ganeteg et al. Reference Ganeteg, Ahmad, Jämtgård, Aguetoni-Cambui, Inselsbacher, Svennerstam, Schmidt and Näsholm2017).
Labeled N (15N APE within plant shoot and root tissue) varied by species for each N treatment and tissue type (P < 0.05), except for amino acid 15N in roots (P = 0.12). Treatment 15N from ammonium and amino acids in shoot tissues was higher in large crabgrass [Digitaria sanguinalis (L.) Scop.] and E. crus-galli than in C. album, redroot pigweed (Amaranthus retroflexus L.), and sorghum-sudangrass (Table 3). In contrast, shoot tissue 15N from nitrate was higher in wild mustard (Sinapis arvensis L.) than in wild oat (Avena fatua L.). Root tissue 15N differed less among species than did 15N in shoots; root tissue ammonium-derived 15N was lower in sorghum-sudangrass than all other species, except A. retroflexus and A. fatua, while root 15N from nitrate was lower in A. retroflexus than in all other species, except C. album and S. arvensis (Table 4).
Root tissue atom percent excess (APE) of 15N following a 24-h labeling experiment a

a Data are means of root and shoot values ± SE (n = 5). Within a column, means sharing the same letter are not significantly different (Tukey honest significant difference [HSD] test, α = 0.05).
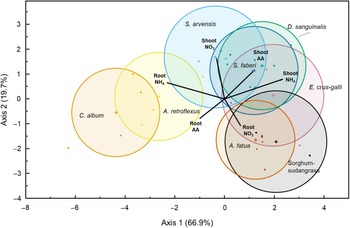
Plant coexistence is mediated in part by the partitioning of soil nutrients (Silvertown Reference Silvertown2004). While we did not measure the separation of species along an environmental niche directly, it is informative to look at the overall patterns of N use by this set of species. Discriminant analysis classified species based on their uptake and partitioning of all three N forms (15N APE of roots and shoots; Wilks’s lambda = 0.016, F(42, 83) = 2.82, P < 0.0001). The first two axes of the canonical plot accounted for 86.7% of the variation in the data set (Canonical 1 = 66.9%, P < 0.0001; Canonical 2 = 19.7%, P = 0.035) (Figure 2). The resulting discriminant analysis ordination suggests three general patterns of uptake, corresponding with the broad functional grouping of species, although not their photosynthetic pathway. The dicot and the monocot species were separated along the first and most explanatory axis, while sorghum-sudangrass and A. fatua were differentiated from the other graminoids along the second axis by their root nitrate 15N. The dicots A. retroflexus, and C. album were differentiated from other species by the amount of ammonium and amino acid 15N found in their roots, while D. sanguinalis, E. crus-galli, and giant foxtail (Setaria faberi Herrm.) differed by the ammonium-derived and amino acid–derived 15N in their shoots.
Canonical plot displaying the results of a linear discriminant analysis evaluating patterns in 15N uptake by species (Wilks’s lambda = 0.0157, F(42, 83) = 2.8227, P < 0.0001). The first two canonical axes were the most explanatory, accounting for 66.9% and 19.7% of the model variation. Species multivariate means (+ symbols) are surrounded by 95% confidence ellipses. Weighted biplots of N form by tissue atom percent excess 15N (15N APE) values are emanating from the grand mean of the data set, and their length and direction indicate the relative strength of their correlation with the first two axes. See Table 1 for list of full species names.

The outcome of competition for soil N between weeds and crops will be driven by the quantity and form of N removed from the environment by each individual (Grace Reference Grace1990). While we did not evaluate competitive ability in this experiment, we did measure the capacity of each species to acquire N within a fixed period by calculating the total recovery of labeled N by each species, using both the tissue label concentration and plant biomass (Supplementary Table 1). Species differed in the percentage of total 15N recovered as each of the three N forms (amino acid: F(7, 20.06) = 7.063, P = 0.0003; ammonium: F(7, 26.65) = 6.14, P = 0.0002; nitrate: F(7, 20.99) = 8.028, P < 0.0001) (Figure 3). Not surprisingly, 15N recovery was roughly correlated with biomass. Sorghum-sudangrass, the species with the greatest biomass at the time of harvest (Supplementary Table 1), had among the highest recoveries of 15N from amino acids, ammonium, and nitrate. In contrast, C. album, the species with the second to least biomass at harvest, had the lowest mean 15N recovery value for each N form, although its recovery was not significantly different from several other species (Figure 3).
Whole-plant recovery of 15N by each species expressed as a percentage of the total 15N applied. Values are means ± 1 SE (n = 5). Within a nitrogen (N) treatment, bars sharing the same letter are not significantly different (Tukey honest significant difference [HSD] test, α = 0.05). See Table 1 for list of full species names.

Blackshaw and colleagues demonstrated that the timing, placement, and application method of fertilizer N all, to some degree, affect the productivity of weeds (Blackshaw Reference Blackshaw2005; Blackshaw et al. Reference Blackshaw, Semach and Janzen2002, Reference Blackshaw, Brandt, Janzen, Entz, Grant and Derksen2003, Reference Blackshaw, Molnar and Janzen2004). Weeds are also responsive to N fertilizer type (Blackshaw Reference Blackshaw2005; Little et al. Reference Little, DiTommaso, Westbrook, Ketterings and Mohler2021). For example, A. retroflexus responds more strongly to NO3 − than to NH4 + (Teyker et al. Reference Teyker, Hoelzer and Liebl1991), as does C. album (Kirkby Reference Kirkby1967), while the growth of S. faberi is similar with NH4 + and NO3 − (Salas et al. Reference Salas, Hickman, Huber and Schreiber1997). Additionally, Blackshaw (Reference Blackshaw2005) demonstrated differential responses based on functional grouping in 2 yr of a 4-yr study, with grass weeds responding positively to compost compared with inorganic N fertilizer, while the opposite was true for dicot weeds. Our research demonstrating differential N-form uptake among species is congruent with these previous studies, although more work will be needed to understand how species-specific patterns in N uptake may ultimately affect the outcomes of weed–crop competition under realistic field conditions.
The relative recovery of each of the three N forms was calculated for each species using the amount of label measured in the whole plant (15N APE; Table 2). In contrast to our other measurements, we did not detect differences among species in the proportion of 15N derived from amino acids (P = 0.12), ammonium (P = 0.72), or nitrate (P = 0.99), although the power for these analyses was low (retrospective power, amino acids = 0.58; ammonium = 0.16; nitrate = 0.084).
Our study investigated the potential for weeds to use nitrate, ammonium, and amino acids and whether they have inherent preferences for those N forms. These common agricultural weed species took up all forms of N offered, including amino acids. We also observed differences in N recovery among the species, suggesting agriculturally important plant species may differ in their strategy for acquiring soil N. These strategies may become even more apparent in a field context, where crop management practices (including fertility management and crop rotation), along with weather and edaphic factors, will interact to determine the dynamics and availabilities of different N pools over the growing season (Mokhele et al. Reference Mokhele, Zhan, Yang and Zhang2019; Smith et al. Reference Smith, Mortensen and Ryan2010). Additionally, relative uptake patterns between species may be altered in the field by other factors not examined in this study, such as mycorrhizal or other microbial associations, plant–plant competition, or resource-independent interference (Horvath et al. Reference Horvath, Clay, Swanton, Anderson and Chao2023; O’Neil et al. Reference O’Neil, Nash, Tiemann and Miesel2021).
The direct acquisition of organic N by weeds may have important implications for weed management, given that differential preference for and acquisition of different forms of N are necessary prerequisites for species being able to partition resource pools, which could mediate the intensity of weed–crop competition for soil N (Smith et al. Reference Smith, Mortensen and Ryan2010). While the documented occurrence of intact amino acids in agricultural soils (e.g., Lipson and Näsholm Reference Lipson and Näsholm2001; Perez et al. Reference Perez, Zhang, Wang, Ye and Huang2015; Senwo and Tabatabai Reference Senwo and Tabatabai1998) suggests that some proportion of the organic N pool remains protected from mineralization (Hobbie and Hobbie Reference Hobbie and Hobbie2012), it is unclear whether free amino acids meaningfully contribute to plant fitness (Näsholm et al. Reference Näsholm, Kielland and Ganeteg2009), particularly in temperate agroecosystems, where inorganic N availability is high (Jones et al. Reference Jones, Kielland, Sinclair, Dahlgren, Newsham, Farrar and Murphy2009). That said, agricultural practices that increase levels of soil organic matter are likely to also increase soil organic N pools (Drinkwater et al. Reference Drinkwater, Wagoner and Sarrantonio1998; Hobbs et al. Reference Hobbs, Sayre and Gupta2008; Six et al. Reference Six, Elliot and Paustian1999; West and Post Reference West and Post2002), necessitating a better understanding of how crops and weeds use and compete for organic soil N resources. Our aim in this study was to investigate the use of major N-pool constituents by common weed species and lay the groundwork for future research attempting to better understand the drivers of weed–crop competition and the differences in soil N acquisition among weeds and crops.
Supplementary material
To view supplementary material for this article, please visit https://doi.org/10.1017/wsc.2023.48
Acknowledgments
The authors would like to thank David Goudreault, Jonathan Ebba, and Luke Hydock of the UNH MacFarlane Greenhouse for assisting with this work. We received substantial help from technicians, including Samantha Werner, Liza Degenring, Shenandoah Crook, members of the Hobbie Lab, and Mikayla Jacobs of the UNH Isotope Lab. Partial funding was provided by the New Hampshire Agricultural Experiment Station. This project was supported by USDA-NIFA Hatch Project 1006827 and USDA-NIFA AFRI grant no. 2013-67014-21318. No conflicts of interest have been declared.


 Open access