


Introduction
Vascular plants and their insect herbivores collectively account for more than 40% of terrestrial biodiversity today (Price Reference Price2002; López-Carretero et al. Reference López-Carretero, Díaz-Castelazo, Boege and Rico-Gray2014) and have dominated terrestrial ecosystems for more than 400 Myr (Wilf Reference Wilf2008; Labandeira et al. Reference Labandeira, Tremblay, Bartowski and VanAller Hernick2014). The associations between plants and herbivores are a cornerstone of modern and ancient terrestrial ecosystems, and even conservative estimates for the number of extant plant–insect interactions worldwide are in the tens to hundreds of millions (Labandeira and Currano Reference Labandeira and Currano2013). Importantly, these interactions likely contributed to the unprecedented diversity of both vascular plants and phytophagous insects through elevated levels of specialization and coevolution (Ehrlich and Raven Reference Ehrlich and Raven1964), spurred in part by the large heterogeneity in the richnesses and associated host-plant specificities among interacting plants and insects (Price Reference Price2002). Past studies have elucidated the dynamics of extant plant–herbivore systems through the use of bipartite network representations and associated statistics (Bascompte Reference Bascompte2010). A bipartite network is a specific class of complex networks that have nodes divided into two sets, X and Y, and whose nodal links occur between the two sets and not within a set (Simmons et al. Reference Simmons, Cirtwill, Baker, Wauchope, Dicks, Stouffer and Sutherland2019). Bipartite network approaches have increased understanding of ecological communities in which they have been studied (Bascompte and Jordano Reference Bascompte and Jordano2007; López-Carretero et al. Reference López-Carretero, Díaz-Castelazo, Boege and Rico-Gray2014), such as maintenance of biodiversity in ecological communities, co-phylogeny (Russo et al. 2017), specialization, and other biological traits (Blüthgen et al. Reference Blüthgen, Fründ, Vázquez and Menzel2008).
The insect herbivore diversity within a community is not just a result of local adaptation of insects to local plant species. Such diversity also is influenced by the usability of potential host plants and their relatives and by lineages of insects whose diets have been shaped and determined by millions of years of co-associations and amplified by large-scale environmental gradients (Futuyma and Agrawal Reference Futuyma and Agrawal2009). Therefore, it is important to understand the evolutionary history of plant–insect systems and interactions, which remains a relatively young field (Futuyma and Agrawal Reference Futuyma and Agrawal2009). Many studies have used phylogenetic approaches to uncover coevolutionary dynamics to disentangle these interactions (Futuyma and Agrawal Reference Futuyma and Agrawal2009), but the fossil record provides an outstanding complementary platform for understanding ancient plant–insect associations at macroevolutionary timescales. In many cases, the fossil record is more informative than phylogenetic analyses, as the record of insect herbivory on fossil plants provides probably the most accessible, abundant, and robust evidence of organisms interacting in the distant past.
Here, we use bipartite network–based representations and methods (Bascompte and Jordano Reference Bascompte and Jordano2007) to explore patterns in the structure of plant–insect associations of four floras from the Late Pennsylvanian to middle Permian of north-central Texas, USA. There are inherent problems regarding the use of fossil data for constructing networks, such as preservation, collection bias, number of specimens for each taxon, non-spatiotemporal overlap, and time averaging (Kidwell and Bosence Reference Kidwell, Bosence, Allison and Briggs1991; Dunne et al. Reference Dunne, Williams, Martinez, Wood and Erwin2008, Reference Dunne, Labandeira and Williams2014; Roopnarine Reference Roopnarine2010; Muscente et al. Reference Muscente, Prabhu, Zhang, Eleish, Meyer, Fox, Hazen and Knoll2018; Shaw et al. Reference Shaw, Coco, Wootton, Daems, Gillreath-Brown, Swain and Dunne2021). Many of these issues, particularly sampling strategies and standardization of plant–insect interactions, have been explicitly addressed for the fossil record (Schachat et al. Reference Schachat, Labandeira and Maccracken2018, Reference Schachat, Maccracken and Labandeira2020). Through our dataset, these problems are addressed by (1) having a large collection of specimens to prevent statistical errors due to small sample size; (2) collecting a fossil flora from a locality that has narrow temporal variance; and (3) constructing networks with and without rare host-plant species in order to explore the importance of community structure (also see Schachat et al. Reference Schachat, Labandeira and Maccracken2018, Reference Schachat, Maccracken and Labandeira2020). Ultimately, we hope to facilitate use of bipartite network representations to explore and understand fossil plant–herbivore interactions in a new, quantitative way. In the process, we also compare the structure of such interactions across four assemblages spanning different habitats and time intervals.
Data and Methods
Network Construction from Data
We constructed weighted bipartite networks using plant–insect associations of four floras from the latest Pennsylvanian to middle Permian of north-central Texas, USA (Schachat et al. Reference Schachat, Labandeira, Gordon, Chaney, Levi, Halthore and Alvarez2014, Reference Schachat, Labandeira and Chaney2015; Xu et al. Reference Xu, Jin and Labandeira2018; Maccracken and Labandeira Reference Maccracken and Labandeira2020), wherein network nodes were either plant taxa (at the most highly or less-resolved ranks) or herbivory damage types (DTs) (Labandeira et al. Reference Labandeira, Wilf, Johnson and Marsh2007). In such a network, edges represent interactions between the two nodes they connect and are present only between nodes of the two different classes and not between those of the same class. Therefore, an edge can only be present between a DT and a plant taxon in our networks, and each edge denotes the presence of a particular DT in the plant taxon to which it is connected. The width (or weight) of an edge represents the number of occurrences of a given DT in a plant taxon. The width of each node denotes its respective number of occurrences. Each network is normalized according to its total number of DT occurrences and leaf specimens for each node class.
Locality Descriptions
The four floras used in these analyses were deposited during the Late Pennsylvanian to middle Permian of north-central Texas, USA. This interval of time saw considerable environmental change, with the equatorial portions of Euramerica experiencing long-term drying and habitat shifts (DiMichele et al. Reference DiMichele, Hook, Beerbower, Boy, Gastaldo, Hotton III, Phillips, Scheckler, Shear, Sues, Behrensmeyer, Damuth, DiMichele, Potts, Sues and Wing1992, Reference DiMichele, Hook, Nelson and Chaney2004, Reference DiMichele, Gastaldo and Pfefferkorn2005; Gastaldo et al. Reference Gastaldo, DiMichele and Pfefferkorn1996). In particular, during the Late Pennsylvanian, wetland habitats became restricted to an equatorial belt in Euramerica (Tabor and Poulsen Reference Tabor and Poulson2008; Xu et al. Reference Xu, Jin and Labandeira2018), a pattern that was further reduced by the end of the Permian, though the wetlands biome survived in Cathaysia to the end of the period (Tian et al. Reference Tian, Wang, Guo, Li, Chen and Zhao1996). The habitats of the four floras reflect these long-term environmental changes.
The youngest of the floras, the South Ash Pasture (SAP) Flora, was deposited during the early part of the Guadalupian Epoch (middle Permian, Roadian), an interval of high aridity in Euramerica (Maccracken and Labandeira Reference Maccracken and Labandeira2020). The SAP locality is in King County, north-central Texas, and consists of six sites whose collections are reposited at the National Museum of Natural History (USNM) as three sites (USNM 40968, USNM 41017, and USNM 41662–41665) collected from different excavations within the same sluggish to abandoned channel deposit, thus corresponding to replicate excavations. Each site was excavated within the same ~1-m-thick stratum of the channel deposit, and although it is not possible to estimate the timeline of deposition, time averaging should not be an issue at SAP or any of the other three fossil assemblages. SAP represents a seasonally xeric habitat, and the depositional environment is interpreted as a seasonally dry channel, possibly a tidal channel or small coastal inlet (DiMichele et al. Reference DiMichele, Hook, Nelson and Chaney2004). There are two dominant taxa at SAP: the broadleaved conifer Johniphyllum multinerve (Looy and Duijnstee Reference Looy and Duijnstee2020) and the broadleaved gigantopterid Euparyphoselis gibsonii (DiMichele at al. Reference DiMichele, Looy and Chaney2011). Johniphyllum and Euparyphoselis represent the broadleaved condition that bears relatively flat and wide leaves, as opposed to co-occurring taxa such as Pseudovoltzia sapflorensis that bear needle-like leaves. Herbivory at SAP was modest, with 22 DTs and an herbivory index (the percentage of surface area removed by insect herbivores) of 0.88% (Maccracken and Labandeira Reference Maccracken and Labandeira2020).
An older floral assemblage is the late Cisuralian Epoch (early Permian, Kungurian) Colwell Creek Pond (CCP) Flora, which was deposited in an abandoned oxbow channel in a coastal environment with marine influence (Schachat et al. Reference Schachat, Labandeira, Gordon, Chaney, Levi, Halthore and Alvarez2014). Similar to the Roadian Age, the Kungurian Age is characterized by increasingly dry climates (DiMichele et al. Reference DiMichele, Gastaldo and Pfefferkorn2005; Schachat et al. Reference Schachat, Labandeira, Gordon, Chaney, Levi, Halthore and Alvarez2014). The CCP locality is in Knox County, north-central Texas, and includes six sites (USNM 41005, 41006, 41007, 42292, 42305, and 42306), which are all replicate excavations from different places within the same claystone stratum that is the lower part of an oxbow lake deposit. CCP has three, codominant, broadleaved taxa—the peltasperm Auritifolia waggoneri, the putative cycadophyte Taeniopteris sp., and the gigantopterid Evolsonia texana (Schachat et al. Reference Schachat, Labandeira, Gordon, Chaney, Levi, Halthore and Alvarez2014)—included in this study. Insect herbivory at CCP entailed 52 DTs and an herbivory index of 2.34%, which is the highest for the four floras in this study (Schachat et al. Reference Schachat, Labandeira, Gordon, Chaney, Levi, Halthore and Alvarez2014).
A still older floral assemblage is the mid-Cisuralian Epoch (early Permian, Artinskian) Mitchell Creek Flats (MCF) Flora (Holterhoff Reference Holterhoff2010), which was deposited in an abandoned channel fill and interpreted as a seasonally dry environment. The MCF locality is in Baylor County, north-central Texas, and consists of three localities that represent three separate collecting events (USNM localities 40049, 40999, and 41661) at the same location. All fossil plant material at MCF was collected from a 55-cm-thick clay layer, most likely deposited in a relatively short period of time. The MCF Flora includes the putative cycadophyte Taeniopteris sp. possibly consisting of multiple similar species, indeterminate broad-leaved pteridosperms, and the gigantopterids Zeilleropteris, Cathaysiopteris, and cf. Cathaysiopteris (Schachat et al. Reference Schachat, Labandeira and Chaney2015). Three broadleaved taxa are included in this study, consisting of two pteridosperm foliage types and one indeterminate broadleaf. Herbivory at MCF was moderate, with 22 DTs and an herbivory index of 1.98% (Schachat et al. Reference Schachat, Labandeira and Chaney2015), comparable to that of CCP and more than double that of SAP and Williamson Drive.
The oldest flora, is the Late Pennsylvanian Epoch (late Gzhelian) Williamson Drive (WD) Flora, deposited in the perennially wet portion of a wetlands ecosystem (Xu et al. Reference Xu, Jin and Labandeira2018). The late Gzhelian of Euramerica was a relatively warm and wet interval of time. WD was collected at a single locality (USNM 40013) and represents a single roadcut in Jack County, north-central Texas. The WD flora originates from a grayish-brown organic shale that has paper-thin layers forming a lens infilling a channel deposit (Xu et al. Reference Xu, Jin and Labandeira2018). There are four major groups of plants at this locality—lycophytes, sphenophytes, ferns, and pteridosperms—and a total of 13 broadleaved taxa that are included among these four plant groups. The most abundant plant taxon at this locality is the pteridosperm Macroneuropteris scheuchzeri (Xu et al. Reference Xu, Jin and Labandeira2018), followed by foliage of the sphenopsid Calamites sp. and then the lycophyte Sigillariophyllum sp. Herbivory at WD was diverse, with a total of 46 DTs and a modest herbivory index of 0.86%, nearly identical with the 0.88% of SAP (Maccracken and Labandeira Reference Maccracken and Labandeira2020).
Specimen Collection, Time Averaging, and Taphonomy
The datasets included in this analysis were analyzed by students of the Labandeira Lab at the National Museum of Natural History, between 2011 and 2020. Although time averaging for the four floral assemblages represented in this study needs to be considered, we are confident that plant materials were collected from strata that did not represent long periods of time and during which environmental conditions did not change within each floral deposit. All four localities were collected by William DiMichele, of the National Museum of Natural History, and crew, and the collection protocols remained the same for each fossil assemblage: all recognizable fossil plant material was collected regardless of completeness or size of the specimen. For the studies of plant–insect associations at the four localities, all broadleaved specimens above 0.5 cm2 (or those that are complete and under 0.5 cm2) in the MCF, CCP, and SAP floral assemblages were analyzed. At WD, all specimens above 0.25 cm2 were analyzed. Although the lower threshold at WD differs from the other three localities, this difference is not problematic, as only a small proportion of specimens at WD fall between 0.25 cm2 and 0.5 cm2.
All broadleaved specimens from each locality were included in this analysis. Rare host-plant taxa of five or fewer specimens were not included in the analysis, as they represent a minuscule portion of each flora but would dominate the network outputs to a misleading degree. Fossil taxonomic identification was facilitated by William DiMichele, who was involved in the collecting of each fossil assemblage, and also was informed by the relevant Paleozoic paleobotanical literature. All specimens of unknown affinity were removed from the analyses, unless they were clearly attributable to a recognized, yet taxonomically unknown, morphotype. The taxonomic identification of fossil material at SAP was based on a previous paleobotanical analysis (DiMichele et al. Reference DiMichele, Hook, Nelson and Chaney2004), further modified by Looy and Duijnstee (Reference Looy and Duijnstee2020). Furthermore, some species and subspecies from WD were lumped together retrospectively after a reanalysis, as they likely represented various morphologies of the same species.
As is the case with the overwhelming majority of paleobotanical studies, the taphonomy of a fossil flora may skew the results and should be briefly discussed. Five taphonomic patterns (MacGinitie Reference MacGinitie1941; Chaney Reference Chaney1959; Hickey Reference Hickey1977; Burnham Reference Burnham1989) address biases in the paleobotanical fossil record. These patterns are (1) species directly adjacent to streamsides are overrepresented; (2) the differential transport of fossil plants often fragments foliar material beyond recognition; (3) the most abundant taxa were those that grew closest to the site of deposition; (4) the most abundant taxa were also dominant at a particular site or abundant at nearby sites; and (5) floristic differences among collections are attributable to changes in climate or time of deposition that indicate evolutionary trajectories of the floras. Various depositional environments also are known to amass different proportions of the local flora (Burnham Reference Burnham1989, Reference Burnham1993, Reference Burnham2008; Burnham et al. Reference Burnham, Wing and Parker1992), and the four studies included in this analysis represent different environments, climates, and time periods. Furthermore, the toughness, shape, and size of the leaf are known to create varying probabilities of preservation. These factors also affect the extent to which a leaf is attacked by insect herbivores, which could structurally compromise the leaf and cause fragmentation in fluvial environments. Although taphonomic biases almost certainly play a role in the floral diversities and richness at SAP, CCP, MCF, and WD, we assume that the taphonomic biases within these standing-water deposits are consistent enough among these floral assemblages to allow direct comparison of their trophic patterns.
Evaluation of Sampling Effort
To visualize differences in relative sampling efforts among the four floras, a sample-based rarefaction was calculated (Fig. 1). The rarefaction curve was calculated for DT richness and number of specimens using code developed by S. Schachat (Schachat et al. Reference Schachat, Labandeira and Maccracken2018, Reference Schachat, Maccracken and Labandeira2020) from R statistical software. The data were bootstrapped 5000 times with 95% confidence intervals, a standard in deep-time plant–insect analyses (Schachat et al. Reference Schachat, Labandeira and Maccracken2018, Reference Schachat, Maccracken and Labandeira2020).
A, Sample-based rarefaction of each flora by damage type (DT) richness, including 95% confidence intervals. B–I, Rarefaction curves for network structure reconstruction at both species and genus levels (B–E) and clade or major plant group levels (F–I), based on normalized Hamming distance, which reveals the proportion of interactions recovered from the networks based on subsampled data. Strong dependence of the network structure on sampling effort is based on the apparent independent and dependent variables in B–I if the mean network rarefaction plot is very close to a line with slope 1. A gray-dotted line with slope 1 has been provided in B–I for reference. The four Paleozoic floras from Texas, USA, used in this study, from youngest to oldest are South Ash Pasture (SAP), of Roadian Age; Colwell Creek Pond (CCP), of Kungurian Age; Mitchell Creek Flats (MCF), of Artinskian Age; and Williamson Drive (WD), of Gzhelian Age.

To explore the effect of sampling efforts on the final structure of the fine-scale species- and genus-level networks, we performed a rarefaction analysis in which we subsampled different proportions of the data (from 0.01 to 1, in increments of 0.01; each repeated 200 times) from each of the four assemblages and measured the Hamming distance (Deza and Deza Reference Deza and Deza2009) between the reconstructed subsampled network and the originally reconstructed network with all the data and normalized for each location for effective comparison. In this context, (normalized) Hamming distance, which takes values from 0 to 1, summarizes the proportion of interactions recovered from the subsampled data in comparison to the whole dataset and can inform about the relative sampling efforts and how strongly the network structure depends on sampling effort (Swain et al. Reference Swain, Devereux and Fagan2021). This exercise was performed for networks constructed at the species and genus level and at the major plant group level for each of the four localities.
Network Analysis and Metrics
After constructing the weighted bipartite networks, we used the packages bipartite (Dormann et al. Reference Dormann, Gruber and Fründ2008, Reference Dormann, Fründ, Blüthgen and Gruber2009), vegan (Oksanen et al. Reference Oksanen, Blanchet, Kindt, Legendre, Minchin, O'Hara, Simpson, Solymos, Stevens, Wagner and Oksanen2013), and igraph (Csardi and Nepusz Reference Csardi and Nepusz2006) to calculate and display various network statistics associated with the network structure at each locality. In this analysis, we propose that network measures developed for bipartite networks (Table 1) can be used to understand past plant–herbivore interactions. As detailed in the following sections, we categorize the measures into five groups, depending upon what they measure: centrality, co-occurrence, nestedness, robustness, and specialization, as well as the level of study. The level of study indicates whether the property being quantified pertains to a single node, a class of nodes (such as all DTs or all plants in our case), or the entire network.
Brief description of the network metrics used in this study. DT, damage type; NODF, nestedness metric based on overlap and decreasing fill.

Centrality Metrics
Centrality measures the relative importance of a given node in a network. Here, we use a form of centrality called “closeness” (Dormann et al. Reference Dormann, Gruber and Fründ2008), which measures the average farness (or inverse distance) of a node of interest to all other nodes. Distance in the context of networks can be understood as the minimum number of edges that need to be traversed to reach one node from another; therefore, nodes with a high closeness score have the shortest distances to all other nodes. Another simple proxy of centrality is the degree of the node, which is just the sum of edge weights.
Co-occurrence Metrics
Co-occurrence patterns help explain the distribution of taxa interactions in relation to those of others. The metrics that measure this property include the C-score, which measures the checkerboard (mutual presence/absence) nature of the interactions (Stone and Roberts Reference Stone and Roberts1992) at a network level; niche overlap, which measures the mutual similarity of nodes within a given class (Mouillot et al. Reference Mouillot, Krasnov, Shenbrot and Poulin2008); togetherness, which measures the average number of shared interactions for a given class of nodes (Stone and Roberts Reference Stone and Roberts1992); and functional complementarity, which assesses complementarity in interactions through the aforementioned niche overlaps within a class of nodes (Devoto et al. Reference Devoto, Bailey, Craze and Memmott2012).
Nestedness Metrics
Nestedness is an important ecological property that summarizes the degree of substructure within an assemblage. A system is nested when elements of that system that have few constituent parts, such as plant taxa with few interactions, form a subset of the larger system. Several metrics can quantify nestedness in networks, but we used the weighted NODF measure (nestedness metric based on overlap and decreasing fill) to calculate nestedness, as it is considered more consistent and robust than other measures (Almeida-Neto et al. Reference Almeida-Neto, Guimaraes, Guimaraes, Loyola, R. D. and Ulrich2008; Almeida-Neto and Ulrich Reference Almeida-Neto and Ulrich2011).
Robustness Metrics
The robustness of natural systems is of great interest because of the potential linkages between robustness and system stability or fragility (Burgos et al. Reference Burgos, Ceva, Perazzo, Devoto, Medan, Zimmermann and Delbue2007; Memmott et al. Reference Memmott and M2004). In the context of bipartite networks, taxon-loss slopes—sometimes termed “extinction slopes” (Memmott et al. Reference Memmott and M2004)—are a measure of system stability and robustness. A taxon-loss slope is calculated by sequential removal of nodes from a given node class (primary node class) and estimation of the number of nodes of the other class (secondary node class) that “survive” by using certain fixed rules for node “survival.” The simplest rule for survival is that a node “dies off” when all its edges are lost. Robustness of the bipartite network can then be estimated from the slope of the curve or the area under it of the fraction of the secondary node class that survived against the fraction of the primary node class removed (Burgos et al. Reference Burgos, Ceva, Perazzo, Devoto, Medan, Zimmermann and Delbue2007).
Specialization Metrics
Finally, the specialization of an ecological system is another metric often associated with system stability. One measure of specialization, H 2′, summarizes specialization at the level of the entire network (Blüthgen et al. Reference Blüthgen, Menzel and Blüthgen2006) and ranges between 0 (no specialization) and 1 (complete specialization). Other aspects of specialization can be quantified for classes of nodes. For example, generality and vulnerability metrics represent the weighted mean (across nodes within a class) of the number of effective partners that a node in that class (e.g., plants) has with nodes from the other class (e.g., DTs) (Bersier et al. Reference Bersier, Banasek-Richter and Cattin2002). Finally, the metric partner diversity calculates the weighted average Shannon diversity of the interactions that members of one node class have with members of the other class (Bersier et al. Reference Bersier, Banasek-Richter and Cattin2002).
At a node level, one can compute a number of different indices that point toward the degree of specialization. Blüthgen's d measures standardized Kullback–Leibler distance in order to estimate the interaction specialization of a particular node (Blüthgen et al. Reference Blüthgen, Menzel and Blüthgen2006), which leads to a low value of d for generalist taxa (i.e., nodes with a high number of partners) and high d for specialist taxa. The number of effective partners is a measure that takes into consideration whether each partner is equally likely to be found (Dormann et al. Reference Dormann, Gruber and Fründ2008). The concept of proportional generality finds the number of effective partners and combines them with the effective availability of nodes of the other classes to calculate a form of normalized degree (Dormann et al. Reference Dormann, Gruber and Fründ2008). Finally, proportional similarity quantifies the dissimilarity between available or possible interactions versus actual interactions with the other node class (Dormann et al. Reference Dormann, Gruber and Fründ2008). In addition to calculating these network metrics, we implemented a principal component analysis (PCA) on the same data using the R package factoextra (Kassambara and Mundt Reference Kassambara and Mundt F2020) to explore possible patterns or clustering of network properties.
Comparison with Modern Plant–Herbivore Interaction Networks
To compare our reconstructed networks (Supplementary Appendices S1, S2) with their modern counterparts, data were collected for 41 host plant–herbivore interaction networks, representing a variety of habitats and environmental gradients (Michalska-Smith and Allesina Reference Michalska-Smith and Allesina2019; Supplementary Appendices S3–S8). Although the host-plant class of nodes is the same for both the fossil and current networks, the herbivory class is represented by DTs in the former and by insect taxa in the latter. The same metrics were calculated that explored the DT networks of the four Paleozoic floras at the whole-network level and at each node-class level that were also implemented for the modern networks. A PCA was performed for the network metrics obtained at different network levels (whole-network and node-class levels) using the R package factoextra (Kassambara and Mundt Reference Kassambara and Mundt F2020) to document similarities among the localities and within different node classes for the set of modern and fossil networks.
Results
First, we describe detailed qualitative aspects of herbivory in these four floras that can be extracted from the constructed bipartite networks. Second, we delve into a quantitative comparison among the four floras using network metrics.
Individual Network Structure Descriptions and Ecological Significance
Network structure varies substantially among the four localities. This likely is attributable to the differences in host-plant taxa and the major differences in functional feeding groups and especially DTs in each of the floras. Our results are listed from the youngest (SAP) to oldest (WD) floras.
South Ash Pasture
SAP reveals that two host-plant species, a broadleaved conifer Johniphyllum multinerve and the gigantopterid Euparyphoselis gibsonii have nearly separate suites of DTs (Maccracken and Labandeira Reference Maccracken and Labandeira2020) (Fig. 2A). Insect herbivores are specialized on their particular host plants in this floral assemblage, except for DT12 (margin feeding), DT34 (galling), and DT46 (piercing and sucking), all of which are common in other Paleozoic floras. The species-level and clade-level analyses for SAP are identical (Figs. 2A and 3A). The diversity of insect damage at SAP is also the lowest of the four floras (Fig. 1A).
Bipartite network representations of plant–damage type (DT) networks at the species and genus levels for four Paleozoic floras from Texas, USA, from younger to older: A, South Ash Pasture (SAP), of Roadian Age; and B, Colwell Creek Pond (CCP), of Kungurian Age.

Bipartite network representations of plant–damage type (DT) networks at the clade or major plant-group level for four Paleozoic floras from Texas, USA, from younger to older: A, South Ash Pasture (SAP), of Roadian Age; and B, Colwell Creek Pond (CCP), of Kungurian Age.

Colwell Creek Pond
CCP contains three host plants that collectively had the greatest ranges and overlap of DTs of any plant from the four fossil assemblages analyzed in this study (Figs. 2B and 3B) and is on par with the diversity of insect damage at WD (Fig. 1A). The gigantopterid Evolsonia texana had the lowest incidence of specialized damage, with only two specialized DTs of DT27 and DT175, whereas six, nonoverlapping, specialized DTs each occurred on the peltasperm Auritifolia waggoneri (DT5, DT130, DT108, DT259, DT260, DT258) and Taeniopteris sp. (DT13, DT25, DT97, DT263, DT138, DT122) (Fig. 2B). Auritifolia waggoneri and Taeniopteris sp. had a high number of shared DTs consisting of DT7, DT14, DT46, DT47, DT157, DT183, DT54, DT100, and DT262 compared with those shared between E. texana and A. waggoneri (DT4, DT247), and E. texana and Taeniopteris sp. (DT1, DT103, DT33). In particular, A. waggoneri and Taeniopteris sp. shared many endophytic DTs belonging to the oviposition, piercing and sucking, and galling functional feeding groups. Interestingly, the Taeniopteris sp. complex provided the single most diverse suite of DTs, harboring 34 of the 44 total DTs at CCP.
Overall, the plant clades at CCP showed a great deal of overlap among DTs and a relatively small number of DTs associated with a single host-plant clade (Fig. 3B). Although the food web structure at CCP was diverse, the level of specialization between the plants and insect herbivores was lower than at WD.
Mitchell Creek Flats
MCF displays herbivory patterns that provide evidence for both specialist and generalist herbivores (Figs. 4A and 5A) but is substantially less diverse than that of WD (Fig. 1A). The form genus Taeniopteris sp., which was the most common element at MCF, had eight specialized DTs, which were not shared among other host plants, consisting of DT13, DT32, DT48, DT67, DT246, DT247, DT265, and DT266 (Fig. 4A) The specialist DTs only found on Taeniopteris sp. were most commonly caused by endophytically (internally) feeding insects, whereas the DTs shared with the other host plants were split more equally between endophytically and ectophytically (externally) feeding DTs. The overlap of Taeniopteris sp. DTs with those of Zeilleropteris sp. was moderate, consisting of DT2, DT12, DT143, DT46, and DT80, whereas overlap with Cathaysiopteris sp. was minimal, with only DT31 and DT101. A greater proportion of endophytic DTs occurred at MCF than at the other localities, although margin-feeding DT12 had relatively more occurrences than all other DTs. Hole-feeding DT2 also was very common. The galling DTs DT80 and DT266 were abundant at MCF.
Bipartite network representations of plant–damage type (DT) networks at the species and genus levels for four Paleozoic floras from Texas, USA, from younger to older: A, Mitchell Creek Flats (MCF), of Artinskian Age; and B, Williamson Drive (WD), of Gzhelian Age.

Bipartite network representations of plant–damage type (DT) networks at the clade or major plant-group level for four Paleozoic floras from Texas, USA, from younger to older: (A) Mitchell Creek Flats (MCF), of Artinskian Age; and B, Williamson Drive (WD), of Gzhelian Age. The plant morphotype, W-unid, refers to an unidentifiable, woody, vascular-plant axis found in the WD flora.

When analyzed by host-plant clade, a slightly different picture emerges (Fig. 5A). In general, galling DTs were mostly specific to a particular host-plant clade, with the exception of DT80, which is shared with Taeniopteris sp. and gigantopterid host plants. Gigantopterid DTs overlapped fully with Taeniopteris sp., except for surface-feeding DT29 and the gall DT267.
Williamson Drive
WD is the most complex network of host plants and their insect herbivores. The Late Pennsylvanian WD assemblage (Figs. 4B and 5B) is also the best sampled of the four floras (Fig. 1A). Substantial overlap in DTs exists among host-plant clades at WD (Fig. 5B). Macroneuropteris scheuchzeri, the most abundant host plant at WD, has 26 DTs, of which nine are exclusive to this host plant. Other host plants share at least one DT with M. scheuchzeri, and display substantial overlap with the sphenophyte, Annularia carinata. Interestingly, the lycophyte Sigillariophyllum sp. has an equivalent richness of DTs compared with A. carinata, but relatively fewer overlapping DTs with M. scheuchzeri.
When analyzing the proportions of DTs across the whole flora, the piercing and sucking DTs of DT46, DT48, and DT138 have notable overlap in host plants, and DT46 is an abundant DT at WD. Oviposition also is common at WD, although the vast majority of instances are DT101 on M. scheuchzeri. Various surface-feeding DTs, such as DT30, DT31, and DT233, are also frequent, yet few host plants exhibited hole feeding.
When the network is analyzed by host-plant clade, the general patterns of host specificity of DTs become more obvious (Fig. 5B). Pteridosperms make up the majority of specimens and have the greatest proportion of DTs. Although all three clades—the pteridosperms, lycopsids, and sphenophytes—overlap greatly in their DTs, lycopsids appear to have more generalized DTs. There is only one instance, oviposition DT175, of a specialized DT, or a DT only occurring within a single clade, on lycopsid tissues. Alternatively, sphenophytes have the 7 specialized DTs of DT13, DT34, DT82, DT96, DT137, DT281, and DT287, and pteridosperms have the 11 specialized DTs of DT1, DT2, DT8, DT10, DT15, DT30, DT56, DT75, DT97, DT100, and DT233. The overall level of specialization between host-plant clade and insect herbivores at WD is greater than at other, less diverse fossil assemblages analyzed in this study, especially CCP.
Rarefaction Analysis
A sample-based rarefaction analysis for the plant–insect associations of the four Paleozoic floras illustrates the differences in sampling effort among the deposits (Fig. 1A). Confidence intervals for WD and CCP overlap, indicating that they have similar DT richnesses, while both MCF and SAP have lower DT richnesses. Strong dependence of sampling effort on the network structure is observed if mean network rarefaction plots asymptotes to a line with a slope of 1. Results from the network rarefaction analysis (Fig. 1B–I) in this study indicate no such dependence in any of the eight constructed networks. It is evident that at less than 25% sampling, more than 50% of the interactions are recovered, and that 90% recovery of interactions encompass about 75% of the data in all cases. In other words, 50% of the network structure is recoverable from a quarter of the data, and most (>90%) of the network structure is recoverable from approximately three-quarters of the data, thus displaying robustness of the network structure to sampling errors and biases. Among the four floras, MCF seems to have the largest variability with respect to network reconstruction from the available data, due to the small number of specimens from the locality (Fig. 1A,D,H) and might hint at slight undersampling.
Comparative Analyses Using Network Metrics
At the level of the individual network, qualitative descriptions also can be condensed in some form using network-level or node class–level metrics (Table 1). The metrics that measure specialization, such as mean number of shared partners, generality, vulnerability, and partner diversity, illustrate that the interactions at CCP are less specialized for both the plant and herbivory levels. CCP additionally is characterized by a high degree of nestedness, wherein herbivory interactions of a host plant with a smaller number of DTs is a subset of the host plants with a higher number of interactions. In contrast, SAP has a distinct checkerboard-like pattern of interactions among its plants, as seen through its C-score at the host-plant level, in which the majority of DTs are specialized for a particular host plant. The taxon-loss slopes for both plants and DTs also suggest specialization at the node-class levels, with large absolute values indicating an abrupt loss of nodes during the slope calculation process. This loss is indicative of a high initial redundancy in the network, as is the case with CCP, and the reverse for SAP. The two other localities have intermediate values in the measures of specialization, co-occurrence patterns, and robustness.
PCA of node-level network characteristics for the networks revealed two interesting patterns. The first is the clustering of network properties for DTs that are to some extent categorized by locality and not by functional feeding group or DT classification. This categorization occurred even though the first two PCA axes jointly explained 78.5% of the variance among the DT network indices (Fig. 6A–C). Similarly, the first two PCA axes explained 84.2% of the variance among the indices at the plant species level (Fig. 6D–F). Here again, locality identity performed better than plant clade affinity when estimating clusters using the first two PCA axis values. The two axes of node properties that differentiated the array of indices among the DTs and plant species exhibited substantial overlap; in both the cases, specialization and co-occurrence indices dominated the first PCA axis and Blüthgen's d metric dominated the second axis (Fig. 6C,F). The centrality and proportional similarity indices played an additional role in the second PCA, and to a greater degree for host plants (Fig. 6C). Blüthgen's d measures the asymmetry in the specialization of a given class (either DTs or host plants) with respect to its interacting partners as well as their rarity (abundance) and therefore provides a different perspective on “specialization” when compared with other specialization and co-occurrence metrics that form PCA axis 1 in both DT and host-plant cases (Fig. 6C,F). This differentiation becomes important when we look at finer patterns at the level of the clade or major plant group for host plants and at DT classification.
Principal components analysis (PCA) of network metrics of damage types (DTs) (A–C) and by host plants in (D–F), colored by localities in A and D, by type/class of DT in B, and by the clade or major plant group of host plants in E. C and F, The contribution of various network metrics in the PCA for DTs (left) and host plants (right) as a percentage of the explanation of the variance. Numbers in subplots A, B, D, and E are used as identifiers instead of DT names or host-plant names for ease of identification across localities, to avoid confusion in the case of shared names, and for brevity. See “Data and Code Availability” for details about the numerical identifiers. The PCA axes PC 1 and PC 2 are equivalent to Dim1 and Dim2, respectively.

Plant clade or major group affinity, although not the best predictor of clusters, did result in some broad, interesting patterns. The Cycadophytes (Fig. 6E), although from two different locations (CCP and MCF), cluster based on their network properties and tend to have a high number of effective partners, along with other related metrics detailed on PCA axis 1 (hereafter termed generalization indices). Cycadophytes also have a consensus low value of Blüthgen's d metric, which informs generalist host-plant behavior with generalist DTs. By contrast, pteridosperms were specialists with low values of generalization indices, with the sole exception of M. scheuchzeri, but had a wide range for Blüthgen's d metric (Fig. 6E). Blüthgen's d metric symbolizes that, even though these taxa had few effective partners, the degree to which their partners were specialized or generalized differed, leading to varied d values. Sphenophytes had low values of specialization metrics, making them specialist host plants, and all except A. carinata have low values of Blüthgen's d metric, indicating a high specificity of DTs (Fig. 6E). A similar trend is seen in the lycophytes, which have low specialization indices but vary in Blüthgen's d metric (Fig. 6E). Gigantopterids have a trade-off link relationship among Blüthgen's d metric and generalization metrics, notable for taxa having higher values of generalization that tend to have low d values (Fig. 6E). This suggests that either taxa had high number of specialist (and/or rare) interactions or a low number of generalist (and/or common) interactions, at least in this limited dataset of the four localities.
The patterns in DT classifications primarily depend on locality identity (Fig. 6A), but also show certain dependence on whether they are specialized or generalized (Fig. 6B). The example of two DT classes, piercing and sucking and surface feeding, illustrate these trends. Piercing and sucking DTs are spread across the PCA plane—giving way to three major groups among themselves (Fig. 6B). Many DTs such as DT46 (in Fig. 5B), DT48, and DT138 have higher values of generalization indices as well as high values of the d metric, showing a high level of generalized behavior, but on a large proportion of rarer host plants (Fig. 6B). Other piercing and sucking DTs such as DT281 and DT285–DT287, are specialized and affect rarer plant hosts, leading to lower generalization indices and a very high d value (Fig. 6B). The rest of the piercing and sucking DTs are moderately specialized and have lower values of d, signifying presence on common plants (Fig. 6B). Surface feeding similarly can be categorized into three groups: extremely specialized DTs with high d values and low generalization indices, such as DT27 (no. 50) and DT83 (no. 106); specialized DTs found on more abundant host plants with low generalization indices and low values of the d metric, such as DT30 (no. 52), DT31 (no. 53), DT97 (no. 108), and DT103 (no. 111); and moderately generalized DTs with low values of d metric and a moderate value of generalization indices, such as DT25 (no. 49) and DT75 (no. 103) (Fig. 6B). But care must be taken in extrapolating these values, which are based on locality-specific factors such as presence, diversity, and abundance of host-plant taxa. To put this in perspective, consider the example of surface-feeding DTs DT29 and DT30. DT29 is present in CCP, MCF, and WD and, in the latter two cases, is an extremely specialized DT with high d value and low generalization indices; by contrast, in CCP, surface feeding is less specialized, with low d value and moderate values of generalization indices. DT30 is found at CCP, SAP, and WD; in the latter two localities, it is specialized but found on a very common host plant, but in CCP, it is less specialized. One valuable feature of this analysis is its use at single localities to obtain deeper insights into the interactions at a specific locality or, alternatively, at a very large cluster of localities to generalize and extrapolate broader results.
Comparison of Fossil with Modern Plant–Herbivore Interaction Networks
On comparing modern with fossil plant–herbivore networks using PCA, we found that similar clusters of metrics governed the description of variance in node-class characteristics for both modern and fossil networks (Figs. 6, 7). Generalization metrics, such as partner diversity, effective partners, and species strength tend to cluster together and are almost orthogonal to Blüthgen's d metric. This orthogonality is true for both host plants and insect herbivores/DTs (Fig. 7, Supplementary Fig. S1). In case of the latter pattern, the fossil DTs reside within the area occupied by modern insects in PCA space (Fig. 7 E,F and Supplementary Fig. S1). However, fossil DTs and modern insect herbivores do not represent the same ecological meaning. In the case of host plants, except for those belonging to WD, all fossil taxa exhibited higher proportional generality and closeness when compared with those from modern networks (Fig. 7 C,D and Supplementary Fig. S1). This result is expected, given the low richness of host-plant taxa at the three fossil localities compared with that of WD and the relative number of DTs present for each locality with respect to the total DTs present among all localities.
Principal components analysis (PCA) for comparison of network metrics among modern and fossil networks, at the whole-network level (A, B), among host plants (C, D), and among insect herbivores or damage types (DTs) (E,F) colored by locality in A, C, E. B, D, F, The contribution (“contrib”) of various network metrics as a percentage of the explanation of the variance for the PCA at network level, among host plants, and among insects/DTs, respectively. For a list of the modern host plant–herbivore networks included in this study, see “Data and Methods.” The four Paleozoic floras from Texas, USA, used in this study, from youngest to oldest are South Ash Pasture (SAP), of Roadian Age; Colwell Creek Pond (CCP), of Kungurian Age; Mitchell Creek Flats (MCF), of Artinskian Age; and Williamson Drive (WD), of Gzhelian Age. The PCA axes PC 1 and PC 2 are equivalent to Dim1 and Dim2, respectively.
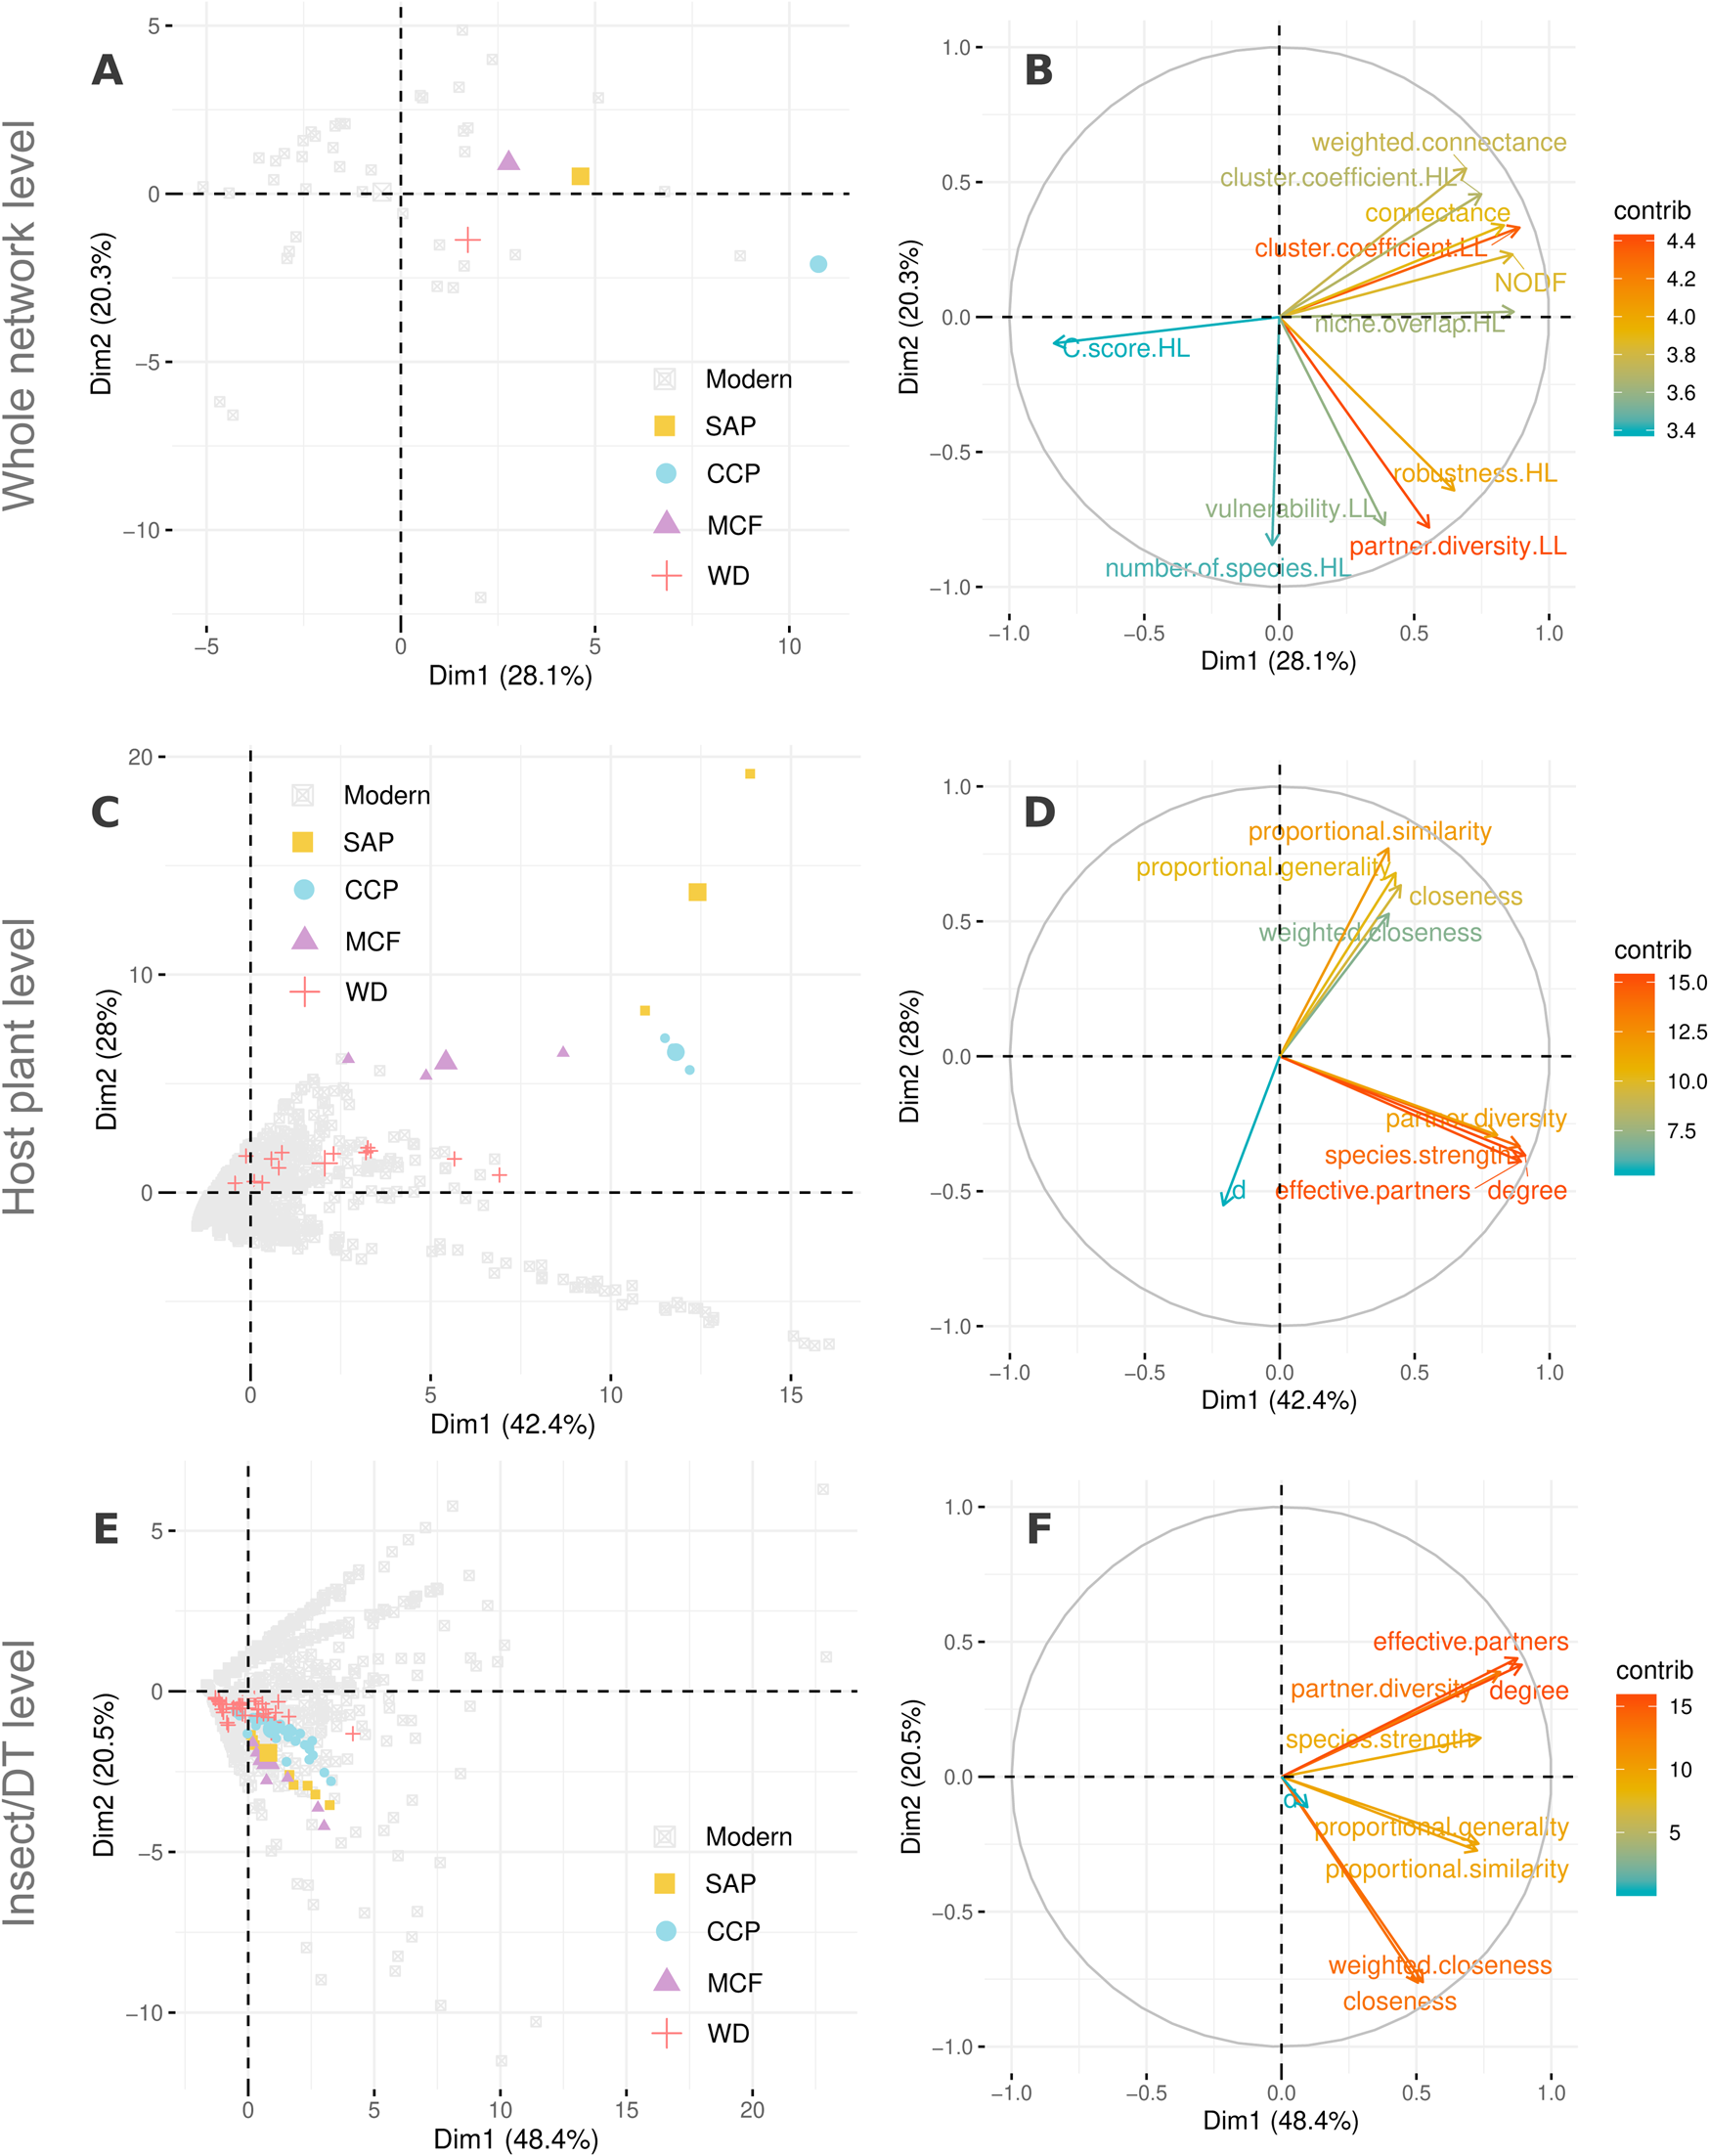
While comparing the overall network structures across the modern and fossil systems, we see that the fossil localities differ slightly regarding niche overlap, nestedness (NODF), connectance (proportion of interactions observed divided by all possible ones), and possibly robustness. Interestingly, none of the fossil localities stand out explicitly and have at least one modern analogue adjacent to their fossil equivalents in PCA space (Fig. 7A,B). These slight differences might be attributable to close comparisons of DTs with insect taxa in the networks. Previous literature has shown that DT richness in certain cases, such as margin feeding, track insect richness in modern ecosystems (Carvalho et al. Reference Carvalho, Wilf, Barrios, Windsor, Currano, Labandeira and Jaramillo2014), but DTs are more limited in number and lack functional representation, such that every DT is not uniquely paired with a member of the other set, resulting in absence of one-to-one pairings between measured herbivore damage and the herbivore(s) creating that damage. For example, some insect taxa can inflict damage through multiple DTs, whereas other, multiple insect taxa can collectively herbivorize plants through the same DT (Carvalho et al. Reference Carvalho, Wilf, Barrios, Windsor, Currano, Labandeira and Jaramillo2014). These characteristics can make DT-based herbivory networks a more trait-based representation of an insect DT network. Consequently, DT-based herbivory networks may introduce redundancies due to the absence of one-to-one mapping of interactions and increase niche overlap, nestedness, and connectance, as well as robustness.
Discussion
Network analyses of ancient plant–insect associations have the potential to change our understanding of the evolution of deep-time terrestrial ecology. Although networks of host plants and insect herbivores are commonly used in neontological analyses, these networks also are valuable for understanding how plant–insect associations have changed through time, across space, in different habitats, and among various floras of special interest. Here, we analyzed four late Paleozoic floras from Texas that differ in host-plant community structure, DT diversity, geologic age, and environmental setting. Our results reveal differences among the four floras and demonstrate the potential utility of network analysis. We also compared the structures of fossil plant–DT networks to modern plant–herbivore networks to get a perspective on the similarities and differences between the two. However, it must be noted that, unlike the neontological networks, analyses of ancient floras may only use the damage inflicted on fossil plants to build the said networks and might not be directly comparable to their modern counterparts.
Fossil Network Comparisons
The four late Paleozoic floras—SAP, CCP, MCF, and WD—were very different from one another in terms of the diversity of host plants, suites of DTs, and levels of complexity and specialization. WD, the oldest and most diverse flora, also had the most complex herbivory network. A wide range of specialist and generalist DTs were present, most notably on the most abundant host plant, the pteridosperm Macroneuropteris scheuchzeri. When plants were categorized by clade, lycopsids had more generalized damage than either sphenopsids or pteridosperms, in that there were no lycopsid-only DTs. In comparison to WD, the CCP flora also had a complex network of plant–insect associations, with a high richness of DTs, but relatively less specialized herbivory. DTs overlapped considerably among the three, major host plants at CCP, although specialized DTs occurred on each of the host plants. Despite the vast difference in host-plant richness between WD and CCP, the complexities of these networks are comparable. MCF and SAP both had low host-plant diversities, similar to CCP, but expressed greatly diminished suites of DTs. Insect herbivory at MCF exhibited a mix of generalized and specialized damage for each of the three host plants, whereas the herbivory at SAP was overwhelmingly specialized.
The major observations we point out using PCA of network metrics for both DTs and floras is that network properties cluster by locality rather than by DT category. For both DTs and host-plant clades of each of the four floras, we suggest that each locality fostered its own generalized and specialized suites of herbivore communities on particular host plants. These source plants and their herbivores harbored interactions that probably evolved and were stabilized based on the local environment and ecological structure of the biota.
Although examining comparable, additional floras centered on the lower Permian of north-central Texas would be necessary to make more concrete assessments, we have established interesting, preliminary patterns for these four floras and their insect herbivores. First, floras from the water-rich habitats surrounding the depositional environments of WD and CCP had more complex networks of plant–insect associations, although they differed in levels of herbivore specialization. The comparatively xeric habitats from which the floras of MCF and SAP were drawn had lower richness of DTs and simpler networks of plant–insect associations. The sampling effort for each flora, possibly also confounded with their differing depositional environments for the more hydric floras, may have contributed to these two contrasting networks of herbivores (Fig. 1). The more complex networks of WD and CCP derived from the greatest sampling efforts. (Sample sizes were WD with 2127, CCP with 883, SAP with 570, and MCF with 142 specimens.) Consequently, issues such as sampling effort may have contributed to disparities in network complexity (Schachat et al. Reference Schachat, Maccracken and Labandeira2020).
Intrinsic Patterns in the Evolution of Herbivory
As hinted earlier in this report, the bipartite network analyses for these four late Paleozoic localities provide several avenues for understanding the evolution of insect herbivory in time and space. Discussed here are four aspects of insect herbivory that can be teased apart by reference to the analytical methods used herein. They are (1) herbivory levels in general; (2) the role of herbivore specialization; (3) the structure of component communities; and (4) network metric clustering based on the relative importance of locality, plant, and DT variables.
Although the herbivory index is a single number for a given flora, a more meaningful assessment of such a single number would be to understand the inputs to this number. For example, what are the relative contributions of functional feeding groups to the herbivory index? For the latest Pennsylvanian to earliest middle Permian examples mentioned here, this would include, in the broadest sense, the proportional representation of externally feeding (hole feeding, margin feeding, and surface feeding) versus internally feeding (oviposition, piercing and sucking, and galling) functional feeding groups. In a narrower sense, do the presence of a few DTs represent overwhelmingly the bulk of herbivory? Floras with similar herbivory indices may have very different sources for their herbivory.
The degree of herbivore specialization can reveal how plants are partitioned in a fossil flora. Are certain plant hosts solely herbivorized by a group of host-specialist insects, as revealed by their limited and unique DT spectrum when compared with other plants in the flora? Is the same host also consumed by generalist insects as well, or do generalist insects only consume other plants? Alternatively, when viewed in light of insect damage patterns, are certain tissues, such as mesophyll, phloem, or meristems, preferentially consumed by certain insects, as reflected by their distinctive, associated DTs? The evolution of elevated host specificity in plant–insect interactions may represent a sudden occurrence when a host becomes available or a prolonged process of adaptation.
An important consequence of bipartite networks is that they reveal the component herbivore communities of the major plants in a fossil flora (Figs. 2–5). (A component community consists of a source plant species and all of the species that are directly dependent trophically, including herbivores, but also saprobes, and ideally the predators and parasitoids of those herbivores.) The distribution of links between a source plant and its herbivores provides data on the structure of the of the component community, such as the balance between externally and internally feeding herbivores, the absence of certain feeding guilds, and the presence of physical and chemical plant defenses.
As alluded to earlier (Fig. 6), the multivariate clustering of node-level network properties expressing centrality, co-occurrence, nestedness, robustness, and specialization can be categorized according to locality, plant host, or DT classification. This categorization reveals the broader node-based structure of each locality. More importantly, the categorization provides a comparative method for evaluating different node-based network structures of multiple localities that can extend beyond the level of the component herbivore communities.
Comparison with Modern Plant–Herbivore Networks
We attempted to understand similarities and differences between the structure of fossil and modern networks through network metrics at the different levels of the host plant, the insect herbivore taxon or DT, or the whole network (Fig. 7, Supplementary Fig. S1). A probable reason for the similarity is the difference between the nature of DTs and of insect taxa. DTs can be thought of as functional, trait-based representation of insect taxa, as measured by herbivory damage. The observation that in some cases the same insect species can inflict multiple DTs on plants, whereas in some other cases multiple insect species can inflict the same DT, makes DT a divided trait when the insect and plant diversity is low, resulting in increased nestedness, robustness, and connectance in plant–DT networks, as compared to plant–insect networks. The same trait can be an aggregate trait when the diversity is very high, making DTs very similar to plant–insect networks. A research initiative for future studies would be to compare fossil versus modern plant–DT networks, as well as modern plant–DT networks versus modern plant–insect networks, to uncover underlying patterns of similarity or difference.
Although exact comparisons of modern and fossil plant–herbivore networks are not possible due to differences in data collection, attributed, for example, to the absence of insect taxonomic data preserved in fossil plant–insect associations, we likely are able to recognize similarities in large-scale patterns present in modern networks. Patterns observed in plant–herbivore networks of both modern and ancient ecosystems could assist paleobiologists in understanding the abiotic and biotic drivers responsible for these patterns. By contrast, differences between modern and fossil plant–herbivore networks may illuminate how terrestrial ecosystems have changed over time. For instance, Oliveira et al. (Reference Oliveira, Faria, Borges, Fagundes and de Araújo2020) tested plant–herbivore network topology in modern Neotropical savannas for specific feeding guilds, which are akin to the functional feeding groups used by paleobiologists. They found differences in the specialization of interactions between endophytic (internally feeding) and exophytic (externally feeding) guilds that were associated with the defensive properties of plant hosts as well as the sizes of the constituent networks (Oliveira et al. Reference Oliveira, Faria, Borges, Fagundes and de Araújo2020).
López-Carretero et al. (Reference López-Carretero, Díaz-Castelazo, Boege and Rico-Gray2014) found that stressful environments supported more generalist insect herbivores and the diversification of resource use in a seasonal tropical ecosystem. Such a pattern may be explicitly tested in future paleobiological studies that use more spatiotemporally constrained networks. Additionally, López-Carretero et al. (Reference López-Carretero, Díaz-Castelazo, Boege and Rico-Gray2014) examined temporal variation in plant–herbivore networks from a seasonal tropical ecosystem and found that temperature and precipitation influenced plant diversity and defensive properties, which in turn influenced the networks of plants and insect herbivores. These results are similar to those found in this study, wherein the wetter floras (WD and CCP) had more complex networks than the more xeric and seasonally influenced localities (SAP and MCF).
Role of the External Environment
The analyses presented here also represent an initial step toward a general framework for understanding the effect of the external environment in ancient plant–insect associations. The data come from only four floras, although there are numerous studies of scores of fossil localities that could be analyzed in these ways. Additional network analyses of additional floras that integrate abiotic and biotic sources of environmental transformation would certainly refine and improve our understanding of how ancient plant–insect associations changed through time, yielding insights into both evolutionary and ecological questions beyond that of habitat differences among the four Paleozoic floras. Additional refinements of comparisons of insect herbivory on floras across extinction events, such as the Permian–Triassic (Labandeira et al. Reference Labandeira, Kustatscher and Wappler2016) or Cretaceous–Paleogene (Labandeira et al. Reference Labandeira, Johnson and Wilf2002; Wilf et al. Reference Wilf, Labandeira, Johnson and Ellis2006) boundaries, or periods of rapid climate change, notably the Paleocene–Eocene thermal maximum (Wilf and Labandeira Reference Wilf and Labandeira1999; Currano et al. Reference Currano, Labandeira and Wilf2010), would be useful. Likewise, network analyses of ancient plant–herbivore networks also could inform understanding of the biotic changes associated with tectonic activity, such as the breakup of Gondwana (Labandeira et al. Reference Labandeira, Anderson and Anderson H2018) or the convergent merging of the Indian Plate with the Eurasian Plate. Although the Paleozoic floras analyzed herein should be precluded from comparisons to extant floras, younger Cenozoic and probably Cretaceous floras could be used to contrast modern versus fossil plant–herbivore networks. Such analyses would mark an important fusion between ecological research in the modern world with deep-time paleobiological research in service of understanding how vascular plants and their arthropods have come to dominate the terrestrial realm.
Acknowledgments
We thank two anonymous reviewers and C. Looy and K. Boyce, whose suggestions greatly improved the article. We thank S. Schachat, Q.-Q. Xu, B. DiMichele, D. Chaney, A. Rulis, J.-H. Jin, J. Gordon, M. Halthore, S. Levi, and J. Alvarez for obtaining data from the four analyzed localities. W. DiMichele provided a presubmission review of the article. We are grateful to the Smithsonian Volunteer Program at the National Museum of Natural History for allowing A.S. to work and forge this collaboration. A.S. also would like to thank the COMBINE program at the University of Maryland (NSF award DGE-1632976) for technical and academic support. W.F.F. and A.S. also thank the University of Maryland for support. This report is contribution 389 of the Evolution of Terrestrial Ecosystems consortium of the Smithsonian's National Museum of Natural History in Washington, D.C.
Data and Code Availability
All data used in this work are available as Supplementary Material (Supplementary Appendices S1–S8). All of these datasets under the title “Bipartite Network Datasets for Permian Host-Plant–Insect Herbivory” are accessible through the Dryad Digital Repository at https://doi.org/10.5061/dryad.9ghx3ffh9. The raw fossil data can be found in the file Appendix S1.Fossil_Data.csv. Node-level network metrics for DTs and host plants in fossil sites, as well as their numerical identifiers for the PCA analysis, can be found in Appendix S2. Fossil_DT_Level_Values.csv and Appendix S3. Fossil_Plant_Level_Values.csv files respectively. Calculated network metrics at the network level for the fossil sites can be found in Appendix S4. Fossil_Network_Level_Values.csv file. List of references for modern plant–herbivore networks can be found in Appendix S8 References Modern.docx, and their calculated metrics at herbivore, plant, and whole-network levels can be found in Appendix S5. Modern_Herbivore_Level_Values.csv, Appendix S6. Modern_Plant_Level_Values.csv, Appendix S7. Modern_Network_Level_Values.csv files. The associated code that was used to analyze the data and produce the results presented in this article is available at https://github.com/anshuman21111/fossil-herbivory-nets. All collated modern plant–herbivore network data in edge-list format can be found in on the GitHub repository.


 Open access