


INTRODUCTION
Liberal democracy is widely believed to be in a crisis (e.g., Diamond Reference Diamond2015). The crisis is not yet one of widespread democratic failure (Mechkova, Lührmann, and Lindberg Reference Mechkova, Lührmann and Lindberg2017); it is instead a crisis of confidence or legitimacy. As Plattner (Reference Plattner2017) puts it, democracy has a “fading allure.” Indeed, several scholars have claimed to find evidence of this fading allure: diminishing support for democracy in long-established democracies, particularly among younger generations (Denemark, Donovan, and Niemi Reference Denemark, Donovan, Niemi, Denemark, Mattes and Niemi2016; Foa and Mounk Reference Foa and Mounk2016, Reference Foa and Mounk2017; Norris Reference Norris2017; cf. Voeten Reference Voeten2017).
Such declines in democratic legitimacy are puzzling when viewed through the lens of existing research on public support for democracy. According to this research, citizens of democratic societies learn to support democracy—initially through socialization in their adolescent years (Dalton Reference Dalton1994; Mishler and Rose Reference Mishler and Rose2007; Montero, Gunther, and Torcal Reference Montero, Gunther and Torcal1997; Pop-Eleches and Tucker Reference Pop-Eleches and Tucker2017; Rose, Mishler, and Haerpfer Reference Rose, Mishler and Haerpfer1998), and later in life, as they experience such fruits of democratic citizenship as political freedoms and responsive government (Bratton and Mattes Reference Bratton and Mattes2001; Evans and Whitefield Reference Evans and Whitefield1995; Magalhães Reference Magalhães2014; Mattes and Bratton Reference Mattes and Bratton2007; Mattes, Denemark, and Niemi Reference Mattes, Denemark, Niemi, Denemark, Mattes and Niemi2016a; Mishler and Rose Reference Mishler and Rose2002; Rose, Mishler, and Haerpfer Reference Rose, Mishler and Haerpfer1998). In sum, democracy is believed to create its own demand (e.g., Mattes, Denemark, and Niemi Reference Mattes, Denemark, Niemi, Denemark, Mattes and Niemi2016b): democratic government coupled with the passage of time produces high levels of support for democracy.
The notion that support for democracy might ebb and flow, even in long-established liberal democracies, is not consistent with these theories of democratic socialization and lifetime learning. It is consistent, however, with a theory from another area of public opinion research—the thermostatic model (Erikson, Mackuen, and Stimson Reference Erikson, Mackuen and Stimson2002; Soroka and Wlezien Reference Soroka and Wlezien2010; Wlezien Reference Wlezien1995). This model proposes that public opinion reacts to policy by moving in the opposite direction: when government spending increases, citizens prefer that it decrease; where policy shifts to the right, citizens’ preferences move to the left. Applied to the opinion-democracy link, the thermostatic model predicts that publics would clamor for democracy when it is scarce, but their preference for democracy would weaken as democratic rights and institutions are supplied. If support for democracy—or democratic “mood” to adopt Stimson’s (Reference Stimson1991) coinage—obeys a thermostatic logic, then we would expect to see it fluctuating over time, even in established democracies, and particularly in response to recent changes in the level of democracy itself.
The purpose of this article is to test whether the supply of democracy creates its own demand or whether citizens instead turn against democracy once it is supplied. In other words, this article tests theories of democratic learning against the thermostatic model. To carry out these tests, I make use of new country-by-year measures of democratic mood estimated using the Bayesian latent variable model of Claassen (Reference Claassen2019b) and new finely grained measures of democracy provided by the Varieties of Democracy project (V-Dem Institute 2018b). These new measures are used to assemble a large panel dataset varying over 135 countries and up to 30 years. This dataset, in turn, permits the use of dynamic models, which control for the effects of previous levels of mood, and first difference models, which eliminate the confounding effects of time-invariant, country-specific factors.
I find little evidence that democracy creates its own demand. Higher levels of democracy do not have a robust, positive effect on subsequent public support. Instead, I find a marked thermostatic effect, where changes in democracy are associated with immediate and opposite public reactions: increases in democracy dampen public mood, while decreases cheer it. I moreover demonstrate that it is the minoritarian rather than majoritarian aspects of democracy that citizens find troubling. While increases in electoral democracy do not affect changes in support, enhanced checks on the executive and increased protection of individual rights do undermine mass support. Overall, the image of the democratic citizen that emerges from this article is a more mercurial and intolerant one that the existing literature on support for democracy has suggested.
These novel results challenge existing research on support for democracy. But they also reconcile this research with studies of macro-opinion (Erikson, Mackuen, and Stimson Reference Erikson, Mackuen and Stimson2002; Soroka and Wlezien Reference Soroka and Wlezien2010; Wlezien Reference Wlezien1995) and political intolerance (Gibson Reference Gibson1998), as well as normative debates regarding the role of counter-majoritarian institutions in democracy (Bickel Reference Bickel1986).
LITERATURE REVIEW
Conceptualizing Democratic Mood
If the institutions and procedures that structure the political lives of democracies are the “hardware” of these systems—as Rose, Mishler, and Haerpfer (Reference Rose, Mishler and Haerpfer1998, 8) elegantly put it—then public opinion toward democracy is the “software” that buttresses these institutions and procedures. When a democratic system enjoys widespread public support, the software and hardware are congruent (Eckstein Reference Eckstein1966), rendering democracy legitimate (Lipset Reference Lipset1959), stable (Claassen Reference Claassen2019a), and perhaps even consolidated (Linz and Stepan Reference Linz and Stepan1996).
Two major conceptualizations of this democratic “software” have emerged.Footnote 1 One approach, which we might refer to “implicit” support for democracy, focuses on broader sociopolitical values, such as postmaterialism and egalitarianism (Inglehart and Welzel Reference Inglehart and Welzel2005; Welzel Reference Welzel2013). Here, democracy is legitimate when it is consistent with citizen’s deeper values and strivings.
A second approach focuses more specifically on democratic and nondemocratic systems of governance, and is thus concerned with “explicit” support for democracy. Such support requires not only a positive principled appraisal of democracy, but also a rejection of autocratic alternatives (e.g., Inglehart and Welzel Reference Inglehart and Welzel2005; Linz and Stepan Reference Linz and Stepan1996; Mattes and Bratton Reference Mattes and Bratton2007; Rose, Mishler, and Haerpfer Reference Rose, Mishler and Haerpfer1998). In this view, democracy is legitimate when it is viewed as the most appropriate regime for the country and, in particular, when it is preferred to some nondemocratic alternative.
Explicit support for democracy versus autocracy is by far the most widely used conceptualization of democratic legitimacy used in the literature. Studies of explicit support have been conducted for several decades, in every region of the world: Western Europe (Baker, Dalton, and Hildebrandt Reference Baker, Dalton and Hildebrandt1981), Southern Europe (e.g., Montero, Gunther, and Torcal Reference Montero, Gunther and Torcal1997), the post-Soviet region (e.g., Evans and Whitefield Reference Evans and Whitefield1995; Pop-Eleches and Tucker Reference Pop-Eleches and Tucker2017; Rose, Mishler, and Haerpfer Reference Rose, Mishler and Haerpfer1998), sub-Saharan Africa (e.g., Bratton and Mattes Reference Bratton and Mattes2001; Bratton, Mattes, and Gyimah-Boadi Reference Bratton, Mattes and Gyimah-Boadi2005; Mattes and Bratton Reference Mattes and Bratton2007), Latin America (e.g., Booth and Seligson Reference Booth and Seligson2009), East Asia (e.g., Dalton and Shin Reference Dalton and Shin2006), and globally (Denemark, Donovan, and Niemi Reference Denemark, Donovan, Niemi, Denemark, Mattes and Niemi2016; Klingemann Reference Klingemann and Norris1999; Linz and Stepan Reference Linz and Stepan1996; Norris Reference Norris2011). I therefore focus in this article on citizens’ explicit support for democratic versus nondemocratic regimes. Moreover, since the focus here is the national level of analysis, I adopt the notion of “mood” from previous studies of macro-opinion (e.g., Erikson, Mackuen, and Stimson Reference Erikson, Mackuen and Stimson2002). The dependent variable used in this article is therefore national levels of support for democracy or “democratic mood.”
The Drivers of Democratic Mood
Armed with the conviction that public support for democracy is vital for democratic stability and consolidation, scholars have devoted considerable effort to understanding its determinants. Two main theories have emerged to explain how citizens and societies come to support democracy: generational socialization and regime performance.
The first of these theories holds that support for democracy is transmitted through socialization, particularly in the “impressionable” years of late adolescence and early adulthood (Jennings and Niemi Reference Jennings and Niemi1974; Mannheim Reference Mannheim and Kecskemeti1952). The assumption is that individuals are taught (or perhaps indoctrinated) to support the regime in which they emerge into adulthood: if this is a democracy, support for democracy is learned; if an autocracy, support for some nondemocratic regime is instead instilled (e.g., Dalton Reference Dalton1994; Rose, Mishler, and Haerpfer Reference Rose, Mishler and Haerpfer1998).
Viewed through the lens of socialization theory, the political system comes to exert a strong influence on public opinion. Following democratization, support increases with the passage of time as one generation after another becomes acculturated. Indeed, scholars sometimes speak of democracy creating its own demand (Mattes, Denemark, and Niemi Reference Mattes, Denemark, Niemi, Denemark, Mattes and Niemi2016b). Finally, after several generations under a democratic system, support for democracy becomes ubiquitous. The system is then described as consolidated (Linz and Stepan Reference Linz and Stepan1996).
Evidence for the theory of generational socialization has been demonstrated in studies from such disparate contexts as 1970s Germany (Baker, Dalton, and Hildebrandt Reference Baker, Dalton and Hildebrandt1981), 1980s Spain (Montero, Gunther, and Torcal Reference Montero, Gunther and Torcal1997), and 1990s Russia (Mishler and Rose Reference Mishler and Rose2007). Generational effects have also been detected in pooled cross-national analyses of support for democracy (Mishler and Rose Reference Mishler and Rose2007; Pop-Eleches and Tucker Reference Pop-Eleches and Tucker2017).
Nevertheless, other studies find contradictory evidence. Mishler and Rose (Reference Mishler and Rose2002) find no effect of generations in an analysis of Central and Eastern European data. Foa and Mounk (Reference Foa and Mounk2016, Reference Foa and Mounk2017) have argued that support for democracy has in fact declined among younger generations in established democracies. Although their conclusions have been disputed (e.g., Voeten Reference Voeten2017), at least one of their critics agrees that generational decline in support for democracy is evident in a dozen or so democracies (Norris Reference Norris2017). The most serious challenge to the socialization hypothesis, however, comes from several studies of Global Barometer survey data. In region after region—most featuring new democracies with stark generational differences in exposure to democracy—little to no evidence of generational socialization emerges (Mattes, Denemark, and Niemi Reference Mattes, Denemark, Niemi, Denemark, Mattes and Niemi2016a).
The second theoretical account of how citizens come to support or oppose democracy is the performance of the regime. Like socialization theory, performance theory also assumes that citizens learn about democracy through experience (Mattes and Bratton Reference Mattes and Bratton2007; Mishler and Rose Reference Mishler and Rose2002). Specifically, citizens’ support for democracy depends both on how well their system functions, and whether it is democratic (Magalhães Reference Magalhães2014). Where a democracy performs poorly (or an autocracy performs well), support for democracy is therefore expected to be low.
Within this regime performance approach, a crucial distinction exists between intrinsic and instrumental performance evaluations (Bratton and Mattes Reference Bratton and Mattes2001; Evans and Whitefield Reference Evans and Whitefield1995). Intrinsic performance evaluations refer to citizens supporting democracy because they enjoy some of the essential features of a democratic system, such as personal and political freedoms and responsive government (Bratton and Mattes Reference Bratton and Mattes2001; Rose, Mishler, and Haerpfer Reference Rose, Mishler and Haerpfer1998). Instrumental performance evaluations, in contrast, refer to citizens supporting democracy because they benefit from such desirable outputs of governance as economic growth and clean public administration (Dalton Reference Dalton1994; Magalhães Reference Magalhães2014).
If support is primarily intrinsic in origin, then legitimacy can only be achieved by delivering political freedoms and responsive government. For autocracies, this effectively means transitioning to democracy. For democracies, this implies that further democratization or democratic deepening is required for increased support. Both socialization theory and (intrinsic) regime performance theory therefore predict that democracy creates its own demand. Guided by these similarities, Rose, Mishler, and Haerpfer (Reference Rose, Mishler and Haerpfer1998) combine socialization and intrinsic performance theories into a single model of “lifelong learning” (see also Bratton, Mattes, and Gyimah-Boadi Reference Bratton, Mattes and Gyimah-Boadi2005; Mattes and Bratton Reference Mattes and Bratton2007).
With its central prediction being that a democratic system produces a supportive public, lifelong learning theory appears unable to account for the crisis of legitimacy said to be afflicting many democracies. An alternative account that appears more suitable is the theory of instrumental performance evaluations. If regime support can be generated through the delivery of instrumental benefits, such as economic growth, then both democracies and autocracies can achieve popular support. Both, however, can also suffer from poor economic performance and therefore falling public support.
Indeed, researchers have argued that democratic satisfaction (if not quite democratic support) was eroded by the global economic recession of 2008–10 (Armingeon and Guthmann Reference Armingeon and Guthmann2014). Other studies have demonstrated a link between support for democracy and economic performance (Dalton Reference Dalton1994; Krieckhaus et al. Reference Krieckhaus, Son, Mukherjee Bellinger and Wells2014; Magalhães Reference Magalhães2014; Rose and Mishler Reference Rose and Mishler1996). Yet, in studies that include measures of both instrumental and intrinsic performance, it is the latter that is more important (Evans and Whitefield Reference Evans and Whitefield1995; Rose, Mishler, and Haerpfer Reference Rose, Mishler and Haerpfer1998; Mattes and Bratton Reference Mattes and Bratton2007; Mattes, Denemark, and Niemi Reference Mattes, Denemark, Niemi, Denemark, Mattes and Niemi2016a). Moreover, Graham and Sukhtankar (Reference Graham and Sukhtankar2004) find that support for democracy in Latin America increased, rather than decreased, during the economic crisis of the early 2000s.
As such, economic downturns (or some other instrumental failing) do not appear to be a particularly compelling explanation for the falling support for democracy that analysts have observed. Instead, I propose adopting a theory from another area of public opinion research—the thermostatic model (Erikson, Mackuen, and Stimson Reference Erikson, Mackuen and Stimson2002; Soroka and Wlezien Reference Soroka and Wlezien2010; Wlezien Reference Wlezien1995)—as an alternative explanation.
A Thermostatic Model of Democratic Mood
The thermostatic model was first developed by Wlezien (Reference Wlezien1995) to describe and explain the relationship between macro-opinion and policy outputs (see also Erikson, Mackuen, and Stimson Reference Erikson, Mackuen and Stimson2002; Soroka and Wlezien Reference Soroka and Wlezien2010). It proposes that opinion shifts to the left as policy moves to the right and vice versa. The result is a marked negative feedback loop between policy output and opinion.Footnote 2
Applied to the democracy-opinion link, the thermostatic model would predict that public support for democracy begins to soften and then turn as the supply of democracy is increased; on the other hand, it would also predict that support for democracy increases as the supply of democracy decreases.
There is, of course, a substantial difference between the opinion-policy link and the opinion-democracy link: the former assumes democracy in general and elections in particular as the mechanism by which opinion shapes policy (Erikson, Mackuen, and Stimson Reference Erikson, Mackuen and Stimson2002). Electoral dynamics are moreover also responsible for the ebbing and flowing of opinion that is characteristic of the thermostatic model. Winning coalitions implement policies favoring their supporters, not the median voter, leading to policy outputs that are out of sync with average public opinion. Policy outputs therefore “overshoot” opinion (Soroka and Wlezien Reference Soroka and Wlezien2010). In response, opinion moves in the opposite direction, resulting in another party or coalition being favored in the next election. Should they win, policy would again shift—and again overshoot.
Both of these dynamics—the overshooting of outputs and the resulting thermostatic shift in opinion—occur also in the democracy-opinion link. First, the supply of democratic rights and institutions likely overshoots mass opinion. Autocratic elites who are under pressure to democratize usually hope to manage the transition but often lose control (Huntington Reference Huntington1991; Wood Reference Wood2000). The increase in democratic rights has a compulsive quality that drives further democratization. For example, the liberalization of restrictions on civil society affords the opposition greater latitude for mobilization, while the installation of freer and fairer elections allows the opposition to challenge directly for power (Gandhi and Lust-Okar Reference Gandhi and Lust-Okar2009; Levitsky and Way Reference Levitsky and Way2002).Footnote 3
The second component of the thermostatic dynamic is opinion change after policy change. The mass public are often depicted as favoring democracy, with the elites more hesitant, if not outright opposed (e.g., Acemoglu and Robinson Reference Acemoglu and Robinson2006; Rueschemeyer, Stephens, and Stephens Reference Rueschemeyer, Stephens and Stephens1992; Wood Reference Wood2000). Yet if democratic support acts in a similar fashion to other forms of macro-opinion, it should also diminish once the policy (here, democracy) is supplied. This presents something of a puzzle: why would citizens not desire further democratic rights and stronger democratic institutions? Indeed, why would they desire diminished rights and weakened institutions?
There are two possible explanations. The first comes from the literature on authoritarianism, especially its early, psychodynamic interpretation. As Erich Fromm (Reference Fromm1941) argued, the transition from autocracy to democracy may leave individuals unmoored and anxious. They therefore desire an “escape from freedom” and a return to the certainties of authoritarian rule (see also Arendt Reference Arendt1951). In a more empirical vein, some studies of political support in newly democratic countries have found a resurgence of “authoritarian nostalgia” after democratic transitions (see, e.g., Mishler and Rose Reference Mishler and Rose2007; Morlino Reference Morlino2010). According to this view, it is the core majoritarian elements of democracy—the devolution of power from autocrats to citizens—that prove to be unsettling. Increases in electoral democracy therefore provoke authoritarian nostalgia and reduced support for democracy.
The second possible explanation comes from research on counter-majoritarian or “minoritarian” institutions and values. While majoritarian values are widely endorsed, even in states without much of a democratic tradition, minoritarian values—such as support for judicial review of popular executive decisions—are viewed in a far less favorable light (e.g., Gibson Reference Gibson1998; Gibson and Caldeira Reference Gibson and Caldeira2003). It is not only among the mass public that such disapproval of counter-majoritarianism can be found: a large legal literature exists on the “counter-majoritarian difficulty” posed by judicial review (e.g., Bickel Reference Bickel1986). Moreover, not only may counter-majoritarian institutions override majorities, they also protect minorities, some of whom are viewed unfavorably by the public at large. Research on political tolerance finds that large proportions of citizens—even in established democracies—are unwilling to extend civil and political rights toward political and ethnic minorities (Duch and Gibson Reference Duch and Gibson1992; Gibson Reference Gibson2008). According to this second explanation, it is therefore the liberal minoritarian aspects of democracy—those designed to protect individual rights and offer checks and balances on executives—that trouble citizens. When such counter-majoritarian institutions are strengthened, citizens may respond with diminished support for democracy in general.
Hypotheses
Having outlined the thermostatic theory of change in public support for democracy, I can now state the first testable hypothesis, H1: increases in democracy have a negative effect on democratic mood. This hypothesis stands in contrast with democratic learning theories, which predict that the level of democracy has a positive and, possibly long-run, effect on support.
The second and third hypotheses map on to the possible mechanisms by which the thermostatic effect operates. H2a posits that increases in electoral democracy—i.e., majoritarian rights and electoral processes—have a negative effect on democratic mood. H2b instead proposes that increases in minoritarian democracy—i.e., counter-majoritarian protections of individual and minority rights—have a negative effect on democratic mood.
DATA AND METHODS
Measuring Democratic Mood
The dependent variable used in this article is national levels of democratic mood. Mood is the extent to which a public offers explicit support for a democratic system and rejects any autocratic alternatives (Linz and Stepan Reference Linz and Stepan1996; Mattes and Bratton Reference Mattes and Bratton2007; Rose, Mishler, and Haerpfer Reference Rose, Mishler and Haerpfer1998). It is principled or diffuse support for democracy itself, rather than instrumental support for the outputs of government or the incumbent officeholders. Consequently, mood is measured using existing survey questions, which ask respondents to evaluate the appropriateness or desirability of democracy, compare democracy to some undemocratic alternative, or evaluate one of these undemocratic forms of government.Footnote 4 Such items are widely used to measure democratic support (e.g., Dalton Reference Dalton2004; Klingemann Reference Klingemann and Norris1999; Magalhães Reference Magalhães2014; Mattes and Bratton Reference Mattes and Bratton2007; Norris Reference Norris2011). Questions focusing on related concepts such as satisfaction with the performance of democracy and trust in national political institutions were not included because neither is a valid measure of principled support for democracy (e.g., Bratton, Mattes, and Gyimah-Boadi Reference Bratton, Mattes and Gyimah-Boadi2005; Canache, Mondak, and Seligson Reference Canache, Mondak and Seligson2001; Linde and Ekman Reference Linde and Ekman2003).
To the best of my knowledge, the database of 3,768 nationally aggregated opinions, gathered by 14 survey projects using 1,391 nationally representative surveys, includes all existing measures of support for democracy that have been collected by cross-national survey projects. These data are, however, fractured, with numerous gaps in the national time series. They are further fragmented by the multitude of different survey measures of democratic support that are fielded in the different survey projects.Footnote 5 Moreover, even when they adopt broadly similar survey questions, these projects tend to adjust the wording of the questions somewhat. As a result, as many as 52 different survey questions are present in the dataset.
To obtain a “smooth panel” of mood from such unruly data, I use the Bayesian dynamic latent variable model developed by Claassen (Reference Claassen2019b).Footnote 6 The model treats the observed number of respondents y supporting democracy for each country i, year t, and survey item k as a binomially distributed count,
 $${y_{ikt}} \sim {\rm{Binomial}}\left( {{s_{ikt}},{\pi _{ikt}}} \right).$$
A beta prior is then used to model the probability parameter π,
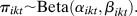 $${\pi _{ikt}} \sim {\rm{Beta}}\left( {{\alpha _{ikt}},{\beta _{ikt}}} \right).$$
This produces a beta-binomial distribution, which allows for some additional dispersion in the observed survey responses beyond that induced by sampling alone. The two shape parameters of the beta distribution can then be reparameterized to an expectation parameter η and a dispersion parameter ϕ,
 $${\alpha _{ikt}} = \phi {\eta _{ikt}},$$
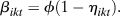 $${\beta _{ikt}} = \phi \left( {1 - {\eta _{ikt}}} \right).$$
The expectation parameter η is then modeled as a function of the latent country-year estimates θ, item parameters λ, and item-country parameters δ,
 $${\eta _{ikt}} = \log\;{\rm{it}^{ - 1}}\left( {{\lambda _k} + {\delta _{ik}} + {\theta _{it}}} \right),$$
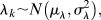 $${\lambda _k} \sim N\left( {{\mu _\lambda },\sigma _\lambda ^2} \right),$$
 $${\delta _{ik}} \sim N\left( {0,\sigma _\delta ^2} \right).$$
The definition of “item” here is a conservative one: two items fielded by different projects are classed as distinct even if their wording appeared to be identical. This allows the model’s item bias parameters to capture variation induced both by question wording and by idiosyncrasies in the methodology of the various survey projects. The item parameters λ therefore adjust for the idiosyncratic effects of question wording and also the methodological effects of particular survey projects.
The item-country parameters δ then allow the item parameters to vary by country. This adjusts for cross-national “non-equivalence,” whereby the meaning of seemingly identical items varies across national contexts (Ariely and Davidov Reference Ariely and Davidov2011; Stegmueller Reference Stegmueller2011). For example, the word “democracy” is likely to have different interpretations and associations in different countries (Bratton Reference Bratton2010).
Finally, the latent opinion estimates are allowed to evolve smoothly over time by modeling the current level of latent opinion θ it in country i as a function of the previous year’s level plus some random noise,
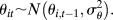 $${\theta _{it}} \sim N\left( {{\theta _{i,t - 1}},\sigma _\theta ^2} \right).$$
The model is estimated using Bayesian Markov chain Monte Carlo (MCMC) simulation.Footnote 7 The result is a smooth country-by-year panel of estimates of democratic mood. Although data are available for 151 countries and 30 years, the coverage of this panel is limited as follows. First, support is estimated only for the 137 countries in which at least two separate years of survey data were available. Second, estimates were dropped for years prior to the year in which the first public opinion survey measuring support for democracy was fielded in each country. Each national time-series therefore commences the year in which the first cross-national survey measuring support for democracy is fielded in the respective country.
The use of a time-varying, national-level measure of democratic mood provides several advantages over existing work on the determinants of democratic support. First, the presence of temporal variation in support and democracy (see below for discussion of the latter) allows this article to separately estimate the effects of previous levels of democracy—which captures a long-run, socialization process—from the immediate change in democracy—which is used to test the thermostatic hypothesis. Temporal variation in the data furthermore means that fully dynamic models, which include lagged dependent variables, can be used. These allow me to rule out the confounding effects of previous levels of mood on current levels of democracy.Footnote 8 Finally, the combination of temporal and cross-sectional variation permits the use of first difference models, which examine only within-country changes in mood and democracy, thereby controlling for all unobserved, country-specific, time-invariant confounds. In sum, this time series, cross-sectional research design permits rigorous tests of the three hypotheses.
Other Variables
Measures of democracy are drawn from version 8 of the Varieties of Democracy (V-Dem) project.Footnote 9 These are preferable to alternatives because of the care and rigor that V-Dem employs in conceptualizing and measuring democracy.Footnote 10 In particular, I employ three of V-Dem’s democracy indices. First, to measure the level of electoral democracy in each state and year, I use V-Dem’s “electoral democracy index.” This closely follows Dahl’s (Reference Dahl1971) concept of “polyarchy” and correspondingly measures the extent to which a country’s leaders are appointed through clean elections, where all adult citizens enjoy the freedom to vote, associate with other citizens, and express their political views (Teorell et al. Reference Teorell, Coppedge, Lindberg and Skaaning2018). The electoral democracy index includes five subcomponents, each measured with multiple indicators: (1) the extent to which the chief executive and legislature are appointed through popular elections; (2) the integrity of those elections; (3) the share of adult citizens with the right to vote in those elections; (4) freedom of association; and (5) freedom of expression (V-Dem Institute 2018a). This index is used to test hypothesis 2a.
Second, to measure minoritarian democracy, I use V-Dem’s “liberal component index.” This “emphasizes the importance of protecting individual and minority rights against the tyranny of the state and the tyranny of the majority” (V-Dem Institute 2018a, 43) and therefore measures the strength of liberal, counter-majoritarian institutions in a given country and year. There are three subcomponents: (1) judicial and (2) legislative constraints on the executive, as well as (3) the legal equality of citizens and respect for individual rights. This measure of minoritarian democracy is used to test hypothesis 2b.
Finally, the overall measure of liberal democracy used in this article is V-Dem’s “liberal democracy” index, which is simply a combination of the “electoral” and “liberal component” indices. This will be used to test the general thermostatic hypothesis, H1.
Two time-varying control variables are included. First is logged GDP per capita: in levels, this is a measure of socioeconomic development (see Krieckhaus et al. Reference Krieckhaus, Son, Mukherjee Bellinger and Wells2014; Magalhães Reference Magalhães2014); in differences, it is a measure of instrumental performance—specifically, economic growth (see Dalton Reference Dalton1994).Footnote 11 Second, the “corruption perceptions index” from Transparency International is used to measure corruption—a form of regime (under)performance that has been associated with diminished regime support (Anderson and Tverdova Reference Anderson and Tverdova2003; Mishler and Rose Reference Mishler and Rose2007; Rose, Mishler, and Haerpfer Reference Rose, Mishler and Haerpfer1998). Potential time-invariant confounds, such as demography or electoral institutions, are handled through the use of first-difference models.
GLOBAL DYNAMICS OF DEMOCRACY AND MOOD
Before formally testing the hypotheses, I begin with a descriptive examination of trends in democracy and mood. In particular, I present and discuss time series plots for the 135 countries for which mood and democracy estimates exist. The goal of this exercise to provide a first indication of whether support for democracy is falling, as some analysts have claimed, or whether it is largely stable and rising as socialization and learning theories would suggest.
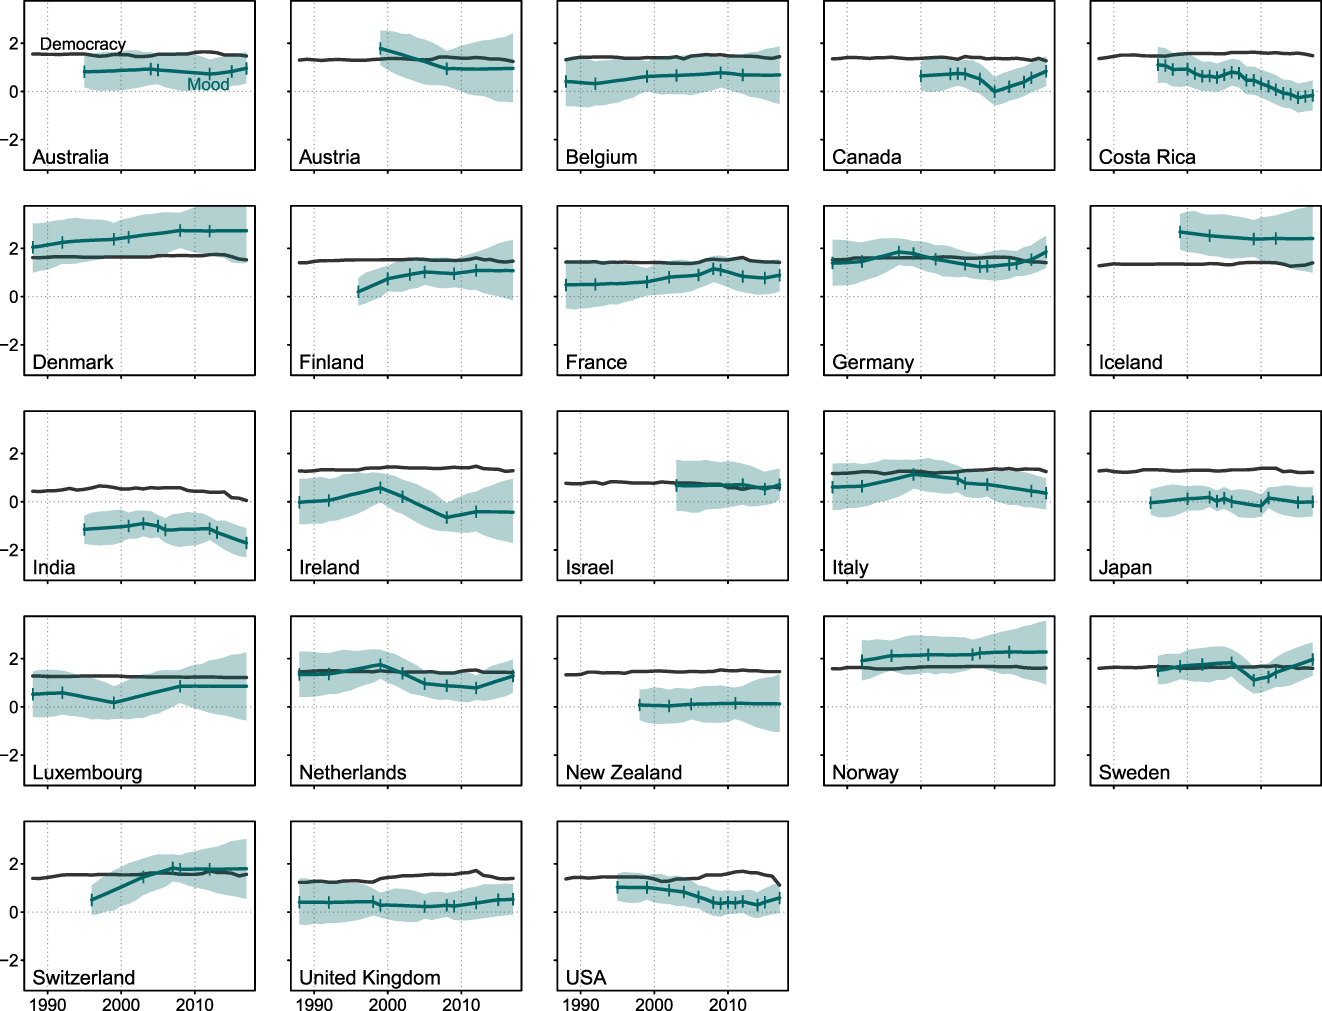
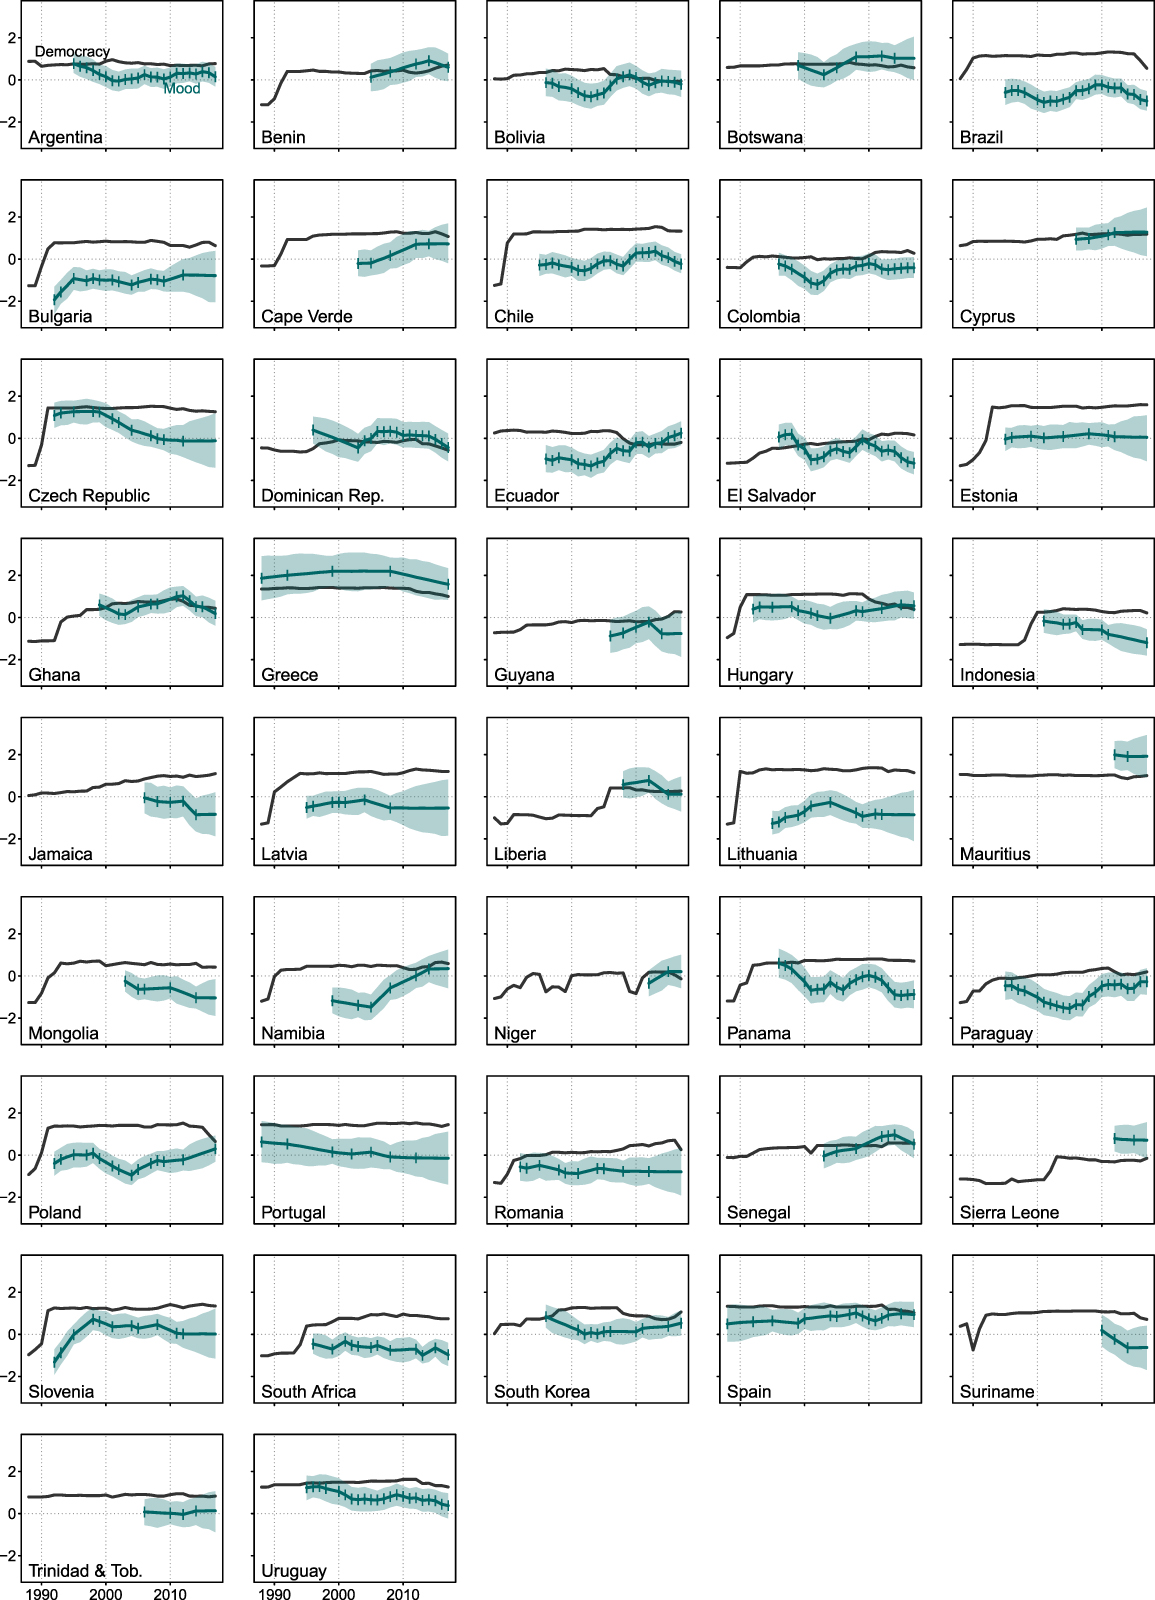
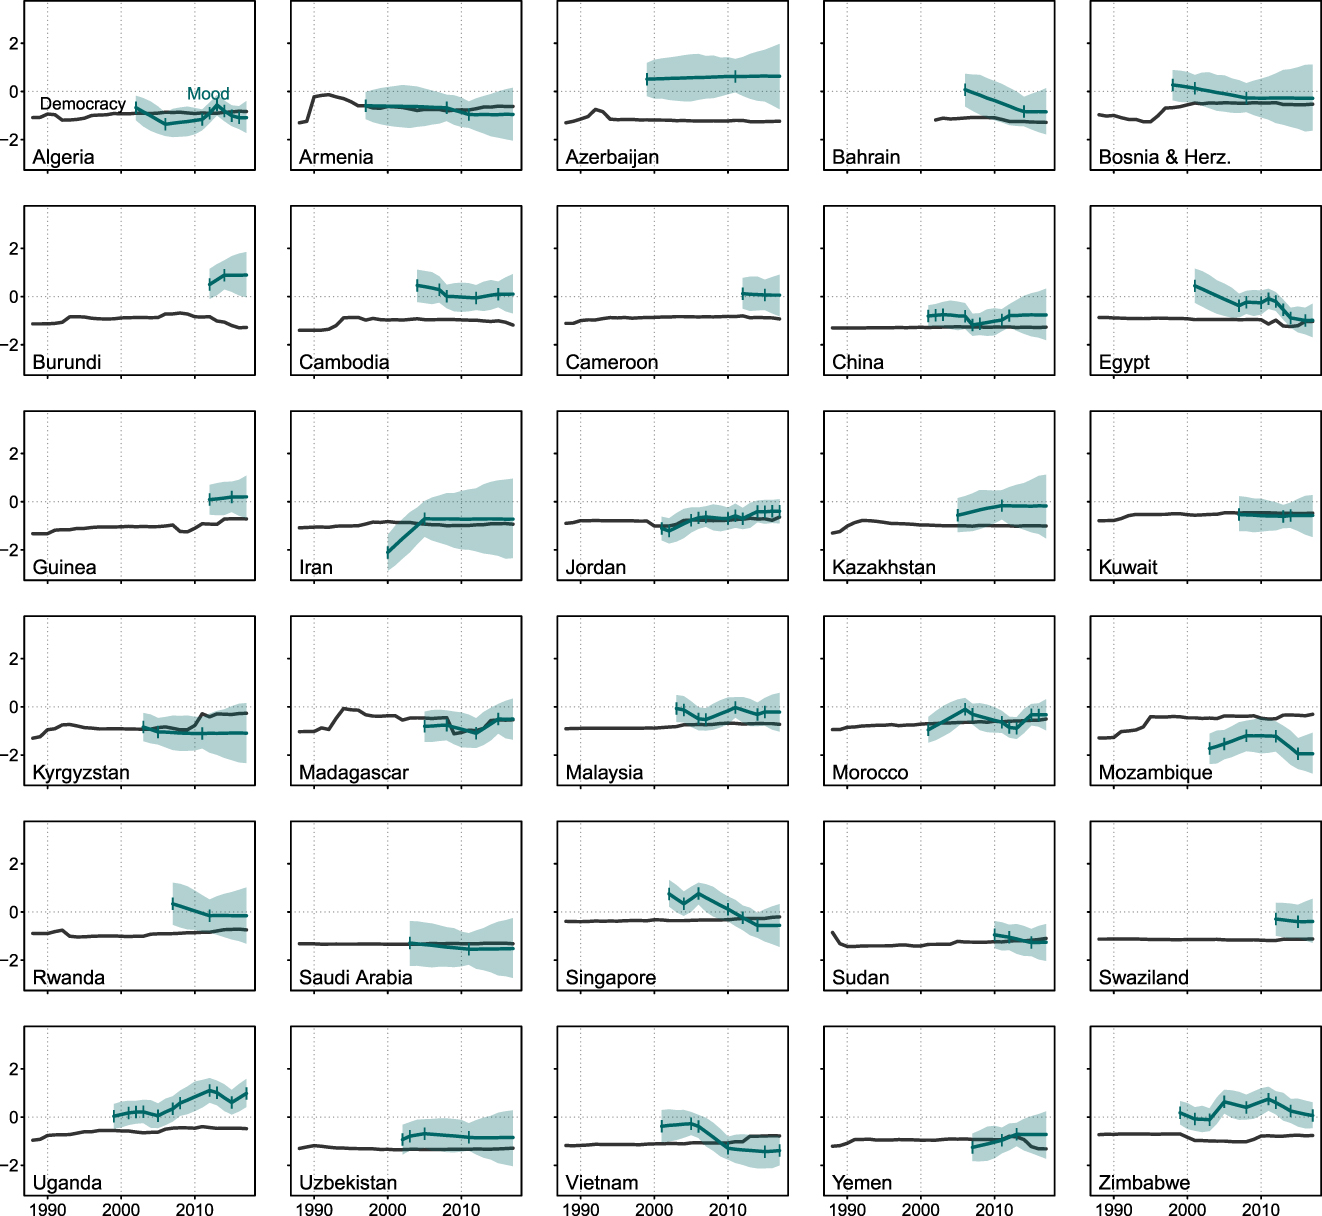
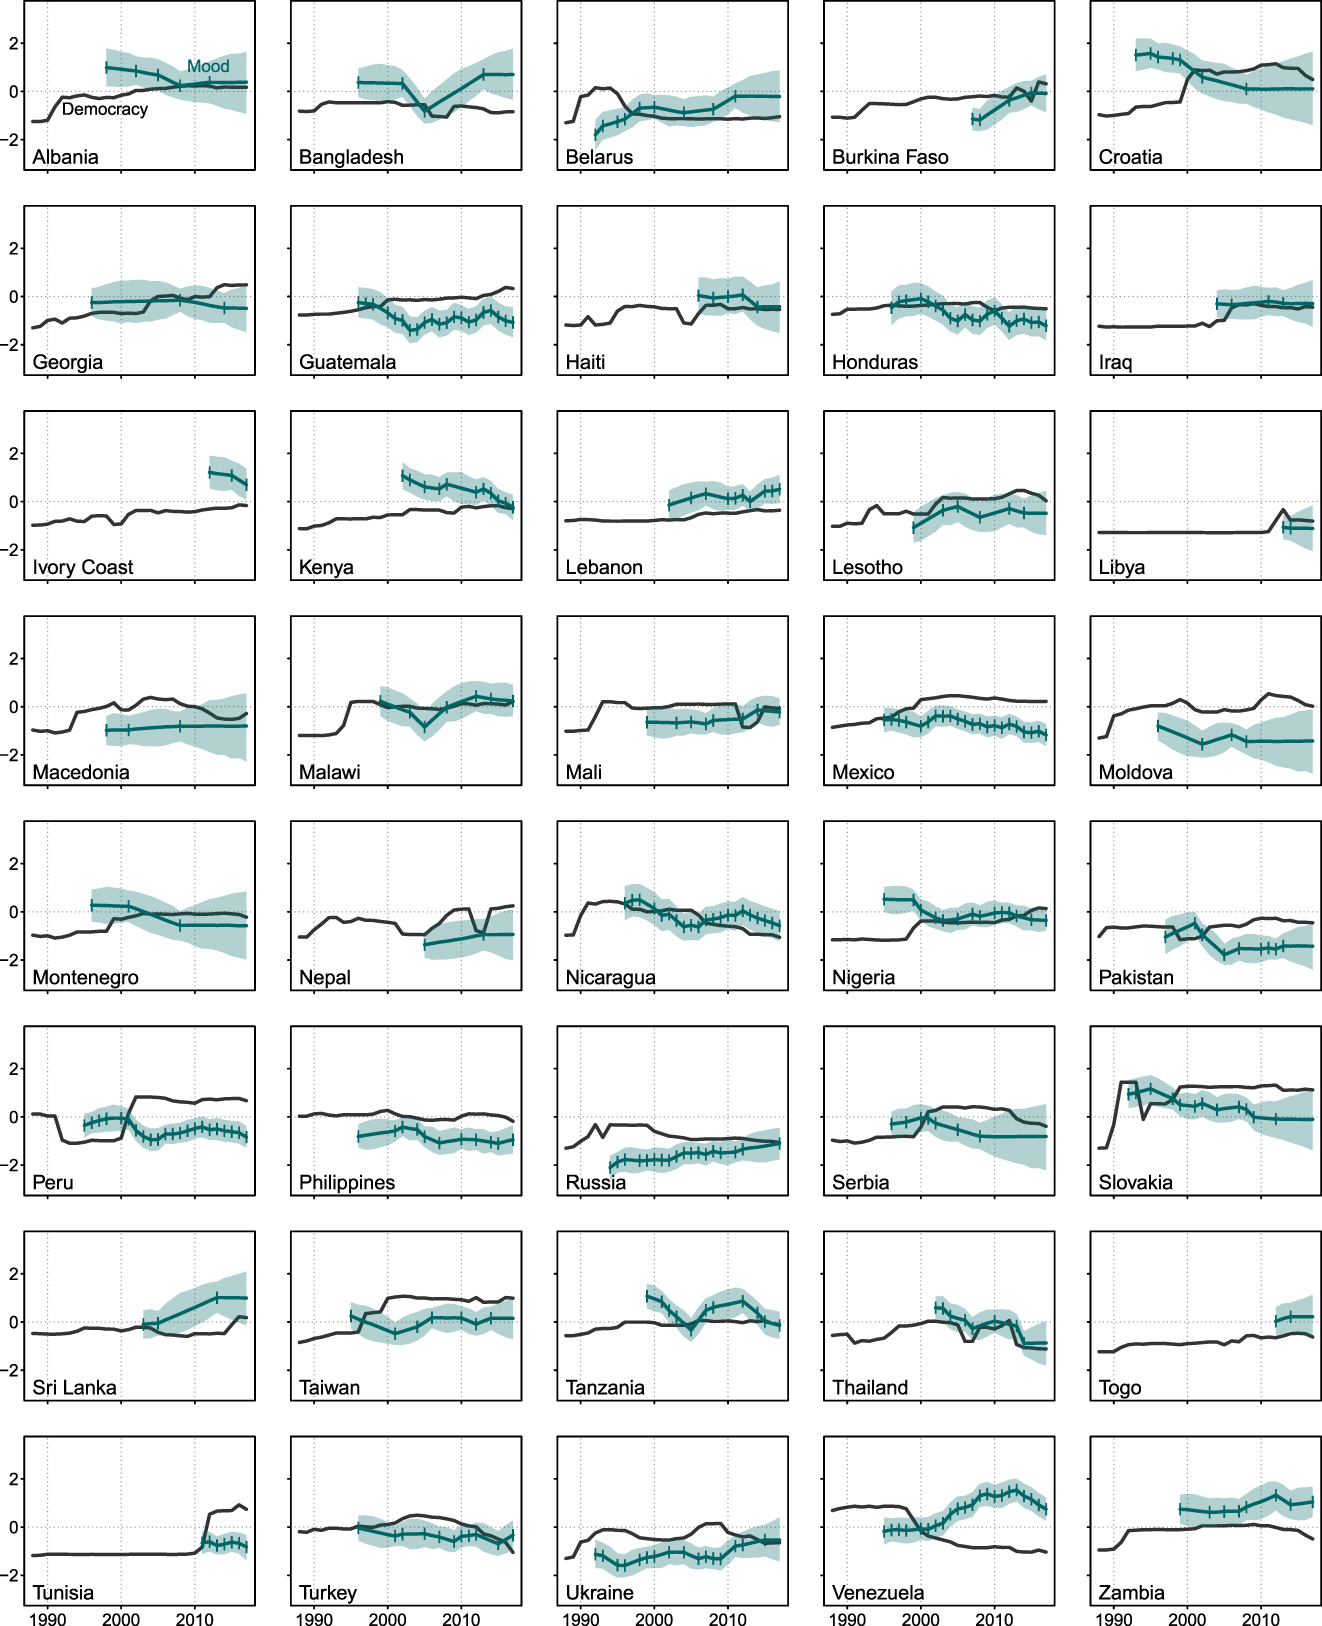
The time series plots are displayed in Figures 1 through 4. Countries are arranged into four groups. First are the established democracies, which had experienced at least 20 years of democracyFootnote 12 when their mood time series commences. They are displayed in Figure 1. Next, in Figure 2, are new democracies, which are democratic throughout the years under consideration, but where democracy commenced less than 20 years prior to the start of the mood series. Third are stable autocracies, in Figure 3, which were autocratic in all the years for which data were available. Finally are regimes in transition, in Figure 4, which moved between democracy and autocracy at some point in the years under consideration.
The Dynamics of Democracy and Mood: Established Democracies
Each plot shows V-Dem Liberal democracy (plotted using a black line) from 1988 to 2017 and estimates of democratic mood (plotted using a blue line). The shaded regions around the mood estimates indicate 90% uncertainty intervals. Vertical bars on the mood estimates indicate years in which survey data were available. Liberal democracy and mood are unit-normal standardized.
The Dynamics of Democracy and Mood: New Democracies
The Dynamics of Democracy and Mood: Autocracies
The Dynamics of Democracy and Mood: Transitioning Regimes
I begin with the established democracies. Socialization and learning theories suggest that such regimes should exhibit high and stable support. Having long experience with democracy, even older generations would hold positive evaluations of democracy. There is therefore little generational change. In such regimes, the supply of democratic rights and institutions is also fairly stable over time, leading to little increase in support over the course of citizens’ lifetimes.
Indeed, many of the cases shown in Figure 1 are consistent with these expectations. Scandinavian countries show the high and stable levels of support that the extant literature would predict (also Switzerland and Germany). Yet other long-established democracies exhibit different patterns. In Anglophone democracies, support is stable but generally quite modest. The long-standing non-Western democracies of India and Japan show fairly low levels of support. Finally, although the mood in Western democracies, such as Canada, the Netherlands, Germany, and the United States, began to turn against democracy in the early 2000s—as Foa and Mounk (Reference Foa and Mounk2016, Reference Foa and Mounk2017) have argued—it has rebounded somewhat in recent years.
In newer democracies, lifelong learning theory would predict a more mutable pattern of support, featuring a rising trend from varying initial levels. The impact of formative years socialization would be expected to lead to a substantial generational gap, where younger generations are more supportive of democracy. With the passage of time, and ensuing generational replacement, we should therefore observe increasing levels of support.
As Figure 2 shows, democratic mood in this large group of cases is indeed more varied than that seen in the long-established democracies. The earlier established of these new democracies (e.g., Greece and Spain) show the high and stable levels of support that were observed earlier in many established democracies. Elsewhere, change is the norm, with many cases exhibiting fairly marked increases and decreases in democratic mood. In certain African countries (e.g., Botswana, Ghana, and Senegal), democratic support reaches the level of established democracies. In other countries (e.g., Brazil, Panama, Poland), support ebbs and flows at a fairly low level. There are also cases with fairly stable but low support (e.g., Bulgaria, Mexico, South Africa), and others (e.g., the Czech Republic, Slovakia) where support has fallen markedly. The evidence from these new democracies therefore provides mixed support for the socialization and intrinsic performance theories. On the one hand, support is rising in some newer democracies and already fairly high in the more long-standing of these. On the other hand, support is stubbornly low in other new democracies and even falling in yet others.
Socialization theory predicts that the third group of countries, stable autocracies (Figure 3), should exhibit low support for democracy as their citizens have not been exposed to a democratic political culture. Indeed, this appears to be the case for several of the autocracies for which we have data (e.g., China, Algeria, Vietnam, and Saudi Arabia). However, others (e.g., Azerbaijan, Uganda, and Zimbabwe) display a different pattern: despite being autocratic, they have high and perhaps even increasing support for democracy. In conclusion, although the evidence from some of the autocratic cases are consistent with existing accounts of support for democracy, evidence from others is inconsistent, with citizens showing support for democracy despite having little to no experience with it.
Finally, I consider regimes that experienced a transition between autocracy and democracy during the period of the study (Figure 4). These provides greater insights into the immediate effects on mood when the supply of democracy changes, which, of course, is where we would expect to see a thermostatic effect, if one exists. In some of these regimes in transition, patterns consistent with learning theories can be observed. Support increases after Ukraine’s experiments with democracy, for example, and perhaps after Malawi’s too. Yet in many other cases, a very different pattern is evident: increases in democracy that are accompanied by decreases in support (e.g., Croatia, Kenya, and Peru) and decreases that are accompanied by increases in support (e.g., Venezuela, Belarus, and Thailand). Such negative feedback between opinion and output is the hallmark of a thermostatic process. Indeed, in Venezuela, the dynamics of democracy and support display a classically thermostatic relationship. Soon after Chavez was elected in 1998, the mood turned toward democracy. In the ensuing years, as he began dismantling democratic institutions and procedures, support increased further. It is hard to avoid interpreting these dynamics as anything other than the Venezuelan public demanding stronger democratic rights and institutions, and doing so in response to the attack on these rights and institutions that they were observing.
In sum, this descriptive analysis of mood and democracy reveals patterns, in certain countries, which are consistent with existing socialization and intrinsic performance theories of democratic support. In other countries, however, the relationships between mood and democracy are clearly inconsistent with these theories. These include democracies (new and established) with falling support for democracy and autocracies with high (or rising) support. Particularly telling are the regimes in transition. In many of these cases, there appears to be a thermostatic effect where changes in supply produce an immediate and opposite reaction in citizens’ opinions.
With some descriptive evidence in favor of existing theories of support, and other evidence against, I now turn to our dynamic models, which offer more definitive tests of the hypotheses.
TESTING THE THERMOSTATIC MODEL OF DEMOCRATIC MOOD
Empirical Strategy
The primary modeling specification employed in this article is the general error correction model (ECM). This model allows one to examine both the effects of the lagged level of an independent variable, as well as the effects of its immediate change, on changes in the dependent variable. This provides an ideal modeling framework for the three hypotheses. Including immediate changes in democracy permits a test of the thermostatic theory that increases (decreases) in democracy prompt a temporary decrease (increase) in mood. And the inclusion of a lagged level of democracy permits a test of the alternative theory of “lifelong learning” through socialization and intrinsic performance evaluations.
Error correction models require, however, that all time series be either stationary or co-integrated (De Boef and Keele Reference De Boef and Keele2008). I therefore run two tests of stationarity for panel data (the Im–Pesaran–Shin and Levin–Lin–Chu tests) on all included variables. The results of all tests indicate stationarity (see the supplementary materials), permitting the use of error correction models. Next, I include two lags of democratic mood to model the enduring effects of democracy on mood. In particular, public support has long been thought to affect subsequent levels of democracy (e.g., Claassen Reference Claassen2019a; Linz and Stepan Reference Linz and Stepan1996; Qi and Shin Reference Qi and Shin2011), including lagged dependent variable controls for this possibility.Footnote 13 These lagged dependent variables also remove most of the serial correlation in the mood series.Footnote 14 Arellano–White robust standard errors, which allow for serial correlation and heteroskedasticity, are additionally used in all models.
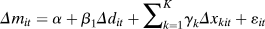
More formally, for i countries and t years, I model the change in mood (Δm it = m it − m it−1) as a function of two lags of mood, immediate change in democracy (Δd it), the lagged level of democracy (d it−1), and k additional covariates, both their changes and lagged levels,Footnote 15
 $$\Delta {m_{it}} = \alpha + {\phi _1}{m_{it - 1}} + {\phi _2}{m_{it - 2}} + {\beta _1}\Delta {d_{it}} + {\beta _2}{d_{it - 1}} + \mathop \sum \limits_{k = 1}^K {\gamma _{1k}}\Delta {x_{kit}} + \mathop \sum \limits_{k = 1}^K {\gamma _{2k}}{x_{kit - 1}} + {\varepsilon _{it}}.$$
The immediate effect of changes in democracy on changes in mood is given by β 1 while the effect of previous levels of democracy is given by β 2. If there is a thermostatic effect of democracy on mood, it will be reflected in a negative estimate of β 1; if there is a lifelong learning effect, it will be indicated with a positive estimate of β 2. However, these effects are short-run estimates. Since the model includes lagged dependent variables, and is therefore dynamic, both changes and levels of support might have very different impacts in the long run (De Boef and Keele Reference De Boef and Keele2008). In particular, the effects of changes in mood will dissipate over time while the effects of lagged levels of mood will accumulate. These long-run effects can be calculated using formula such as (β 2 − β 1)/(1 − ϕ 1 + ϕ 2), but also, as I demonstrate below, using simulation methods.
Results of the General Thermostatic Test
Table 1 presents the results of four models testing hypothesis 1, that is, changes in liberal democracy have a negative effect on public support. The first two models (1.1 and 1.2) show that the immediate effect of a change in democracy is negative and significant. Increases in democracy, in other words, are associated with decreases in support and vice versa. These two error correction models therefore provide evidence that democratic mood behaves thermostatically in response to changes in the supply of democracy.
Testing the Effects of Democracy on Change in Mood
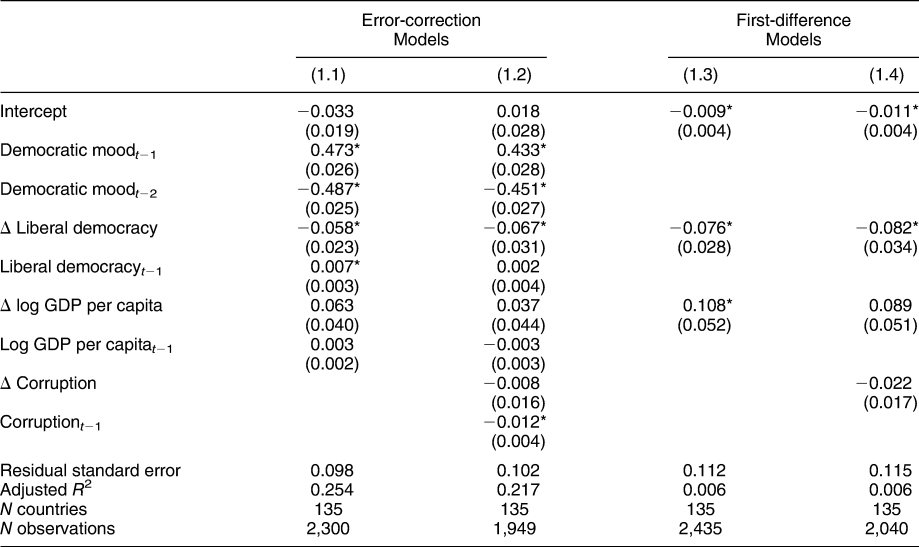
*p < 0.05. Arellano–White robust standard errors, clustered by country, in parentheses. Liberal democracy and mood are unit-normal standardized.
In Model 1.1, the lagged level of democracy also has a significant and positive effect on subsequent change in democratic mood. Such positive feedback is consistent with the processes of socialization and intrinsic performance incorporated in lifelong learning theory. Yet this effect is not particularly robust. In Model 1.2, which also includes corruption, the positive effect of lagged democracy vanishes.Footnote 16 There is therefore little evidence, in this national-level data, that democracy creates its own demand.
How robust is the finding that changes in democracy produce a significant and opposite effect on mood? In Table 1, I employ a simpler and more conservative specification: first difference models. These include only the differences in all variables. Like the closely related fixed-effects specification, such first difference models therefore restrict their attention to variance across time and within country. This removes the possible confounding effects of country-specific time-invariant factors that may be thought to influence both dependent and independent variables.Footnote 17 Democracy and political culture, for example, might be jointly determined by such country-specific key moments, or “critical junctures,” as a nation’s experience under colonial rule (Rueschemeyer, Stephens, and Stephens Reference Rueschemeyer, Stephens and Stephens1992).Footnote 18
Results from the first difference models are consistent with the error correction findings. The thermostatic effect of change in democracy on subsequent change in mood remains negative and significant. In the online supplementary materials, I report additional robustness tests: one- and two-way fixed effects models, Mundlak within-between multilevel models, as well as first-difference and error correction models including additional time-varying controls (education and income inequality). Evidence for a negative, thermostatic effect of change in democracy is present in all these models, save one.Footnote 19 However, no evidence for a positive, lifelong learning effect of lagged democracy emerges.
Next, to demonstrate how the various effects of democracy on mood play out over the long run, I plot the simulated effects of a one standard deviation increase in democracy in Figure 5. Such a plot is not straightforward when using dynamic models, because the predicted effects at time t become lagged independent variables at time t + 1. I use a method of simulation based on that of Williams and Whitten (Reference Williams and Whitten2012) (see the online supplementary materials for a full explication).
Simulated Effects of Change in Democracy on Mood
Simulated effects are estimated using coefficients from Models 1.1 (without corruption; left) and 1.2 (with corruption; right). The solid lines indicate the mean simulated effect; the shaded regions indicate the 95% confidence intervals of these effects.
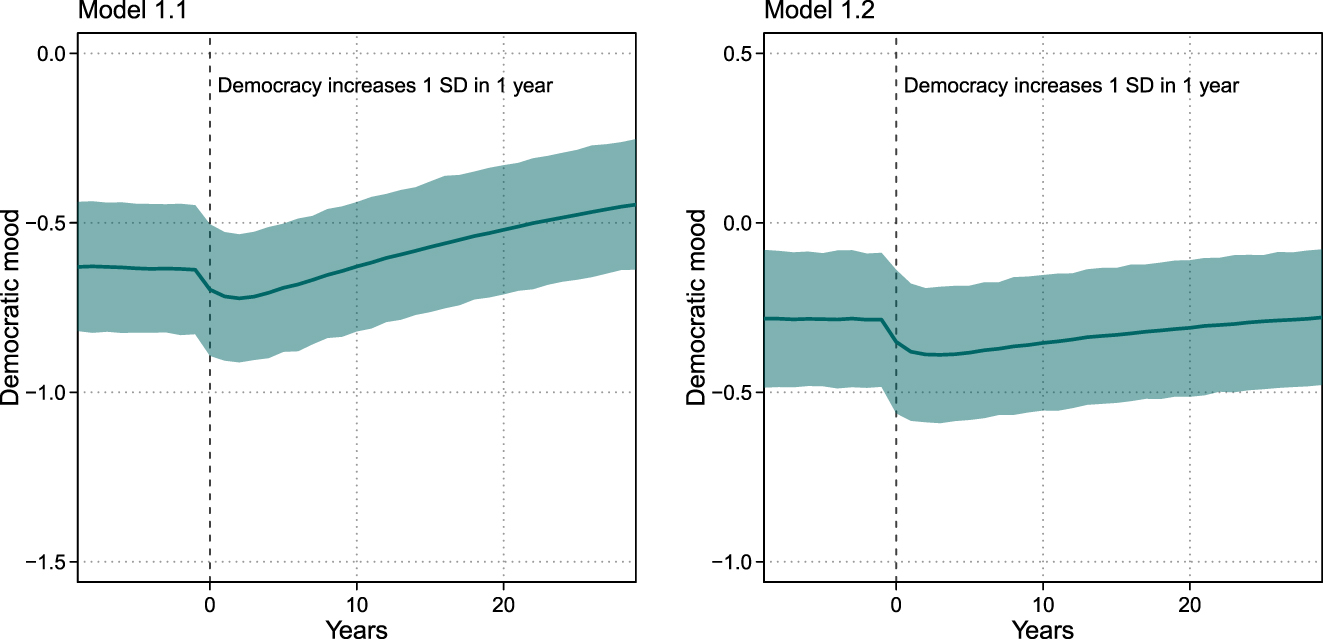
The two plots in Figure 5 show the simulated effects on democratic mood (in levels, not differences) when the level of democracy increases by one standard deviation—a moderate increase in democracy. The left plot shows the simulated results from Model 1.1, which excludes corruption; the right plot shows the results with corruption included (Model 1.2).
According to both models, mood drops immediately as democracy increases, falling by 0.058 (left) and 0.067 (right) in that first year (which of course are the coefficients of change in democracy in Table 1). Democratic mood continues to weaken over the following years. It falls for another two years in the left plot, dropping by a total of 0.084 from its initial level, and falls for another four years in the right plot, for a total decrease of 0.104.
In both plots, democratic mood then starts turning positive again. This is a product not only of the diminishing negative effects of that initial increase in democracy, but also the positive effect of lifelong learning. Although the latter is small in magnitude, it accumulates relentlessly over time. In the left plot, the larger effect of lagged democracy produces a more rapid cheering of democratic mood. Indeed, ten years after the increase in democracy, mood has regained its initial level. Mood then continues to increase, at a diminishing pace, over the next 20 years. In the left plot, the positive long-run effects of democracy are much weaker once corruption is accounted for (indeed, the effect in Model 1.2 is not significant). Yet mood still recovers, although it now takes 27 years to do so.
In sum, the results presented in this section have shown that changes in democracy generate sharp and opposite reactions from the public: increases depress support, and decreases revitalize it. This is the well-known thermostatic effect of public opinion, here demonstrated on democratic mood for the first time. There is, additionally, little evidence that democracy generates its own demand. Whether by socialization or intrinsic performance evaluations, the effect of the level of a country’s democracy on subsequent changes in national democratic mood is small and fragile.
The long-run simulations then reveal two further points. First, the negative thermostatic effects of increases in democracy, although particularly marked in the initial years, do not last forever (even if they do last a generation). Second, while the positive effects of democratic socialization and learning are tiny (and typically insignificant) in the short run, they accumulate over the years and do help to return democratic mood to its former level. Yet we return to the paradox discussed earlier. Although it may seem a natural reaction for citizens to increasingly support democracy where it is under assault by authoritarian leaders, why would the reverse be true? Why, in other words, would the public favor reduced democratic rights? I turn to an analysis of these questions—and therefore tests of hypotheses 2a and 2b—in the next subsection.
Why Do Citizens Desire Less Democracy?
Table 2 includes four models that offer tests of hypotheses 2a and 2b. These models parallel those in Table 1 in all ways but one. Instead of the general measure of liberal democracy, I now include its two disaggregated components: electoral democracy, which measures the strength of majoritarian institutions and processes, and minoritarian democracy, which measures the strength of liberal, counter-majoritarian institutions and processes.
Testing the Effects of Electoral and Minoritarian Democracy on Change in Mood
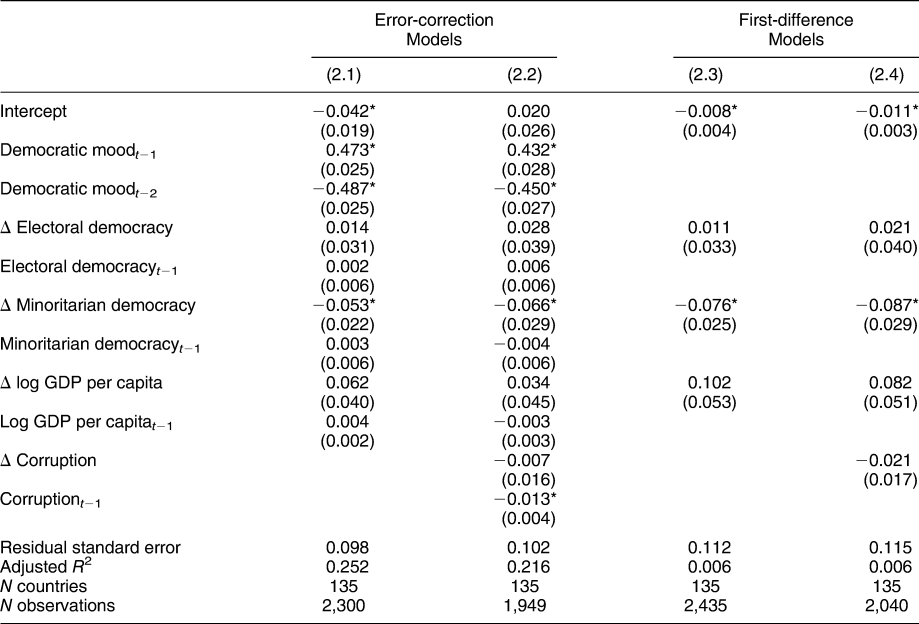
*p < 0.05. Arellano–White robust standard errors, clustered by country, in parentheses. Mood and democracy and support (electoral and minoritarian) are unit-normal standardized.
All four models show that changes in electoral democracy have positive but insignificant effects on democratic support. Increases in majoritarian rights and institutions therefore neither depress nor cheer mood to any significant degree. The results are starkly different for changes in minoritarian democracy, which produce a marked negative effect on changes in mood. These thermostatic effects are significant in all of the four models presented here.Footnote 20 Increased counter-majoritarian protections of individual rights therefore dampen democratic mood, while diminished protections of these rights revitalizes it, producing increased public demand for democracy.
The coefficients reported in Table 2 represent the short-run effects of change in, and levels of, minoritarian and electoral democracy. As in the previous section, I therefore include simulation plots showing how the long-run effects of these dynamics unfold over decades (Figure 6).
Simulated Effects of Changes in Electoral and Minoritarian Democracy on Mood
Predicted effects, estimated using coefficients from Model 2.1 (without corruption; left) and Model 2.2 (with corruption; right). Effects of a change in electoral democracy are shown in top row; effects of change in minoritarian democracy in the bottom row. The solid lines indicate the mean predicted effect; the shaded regions indicate the 95% confidence intervals of these predicted effects.
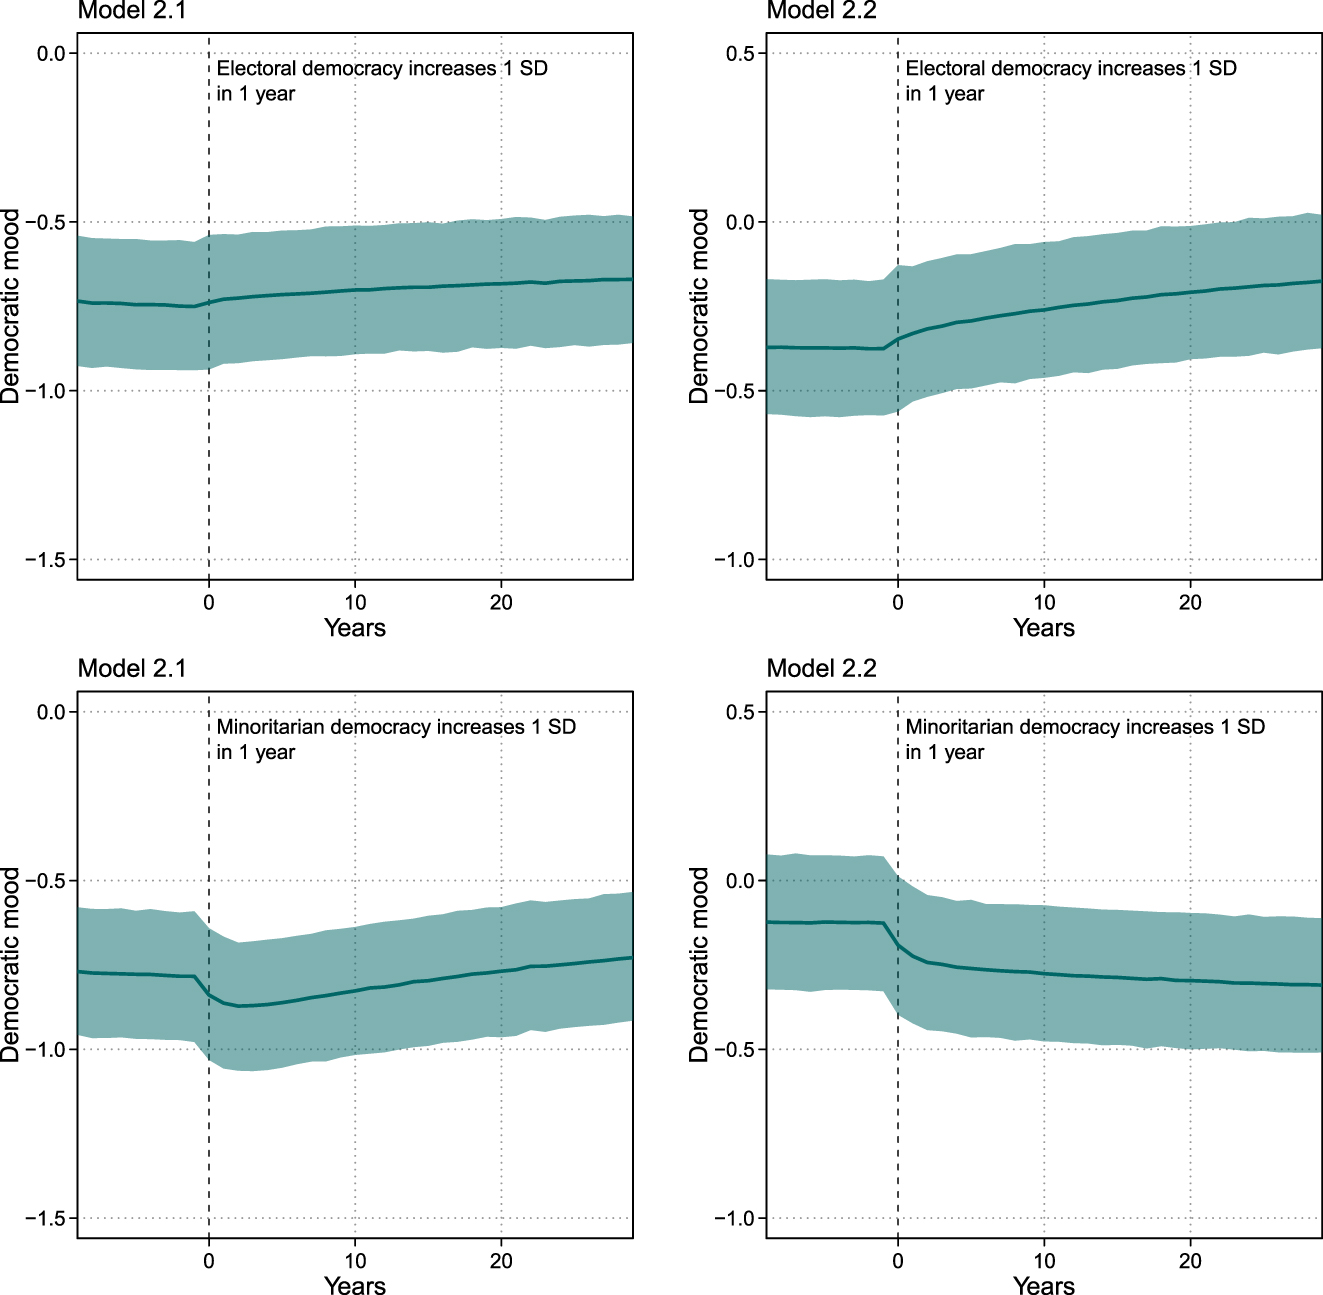
The plots in the first row show the effects of a standard deviation increase in electoral democracy, holding minoritarian democracy constant. When corruption is omitted from the model (plots on the left; Model 2.1), electoral democracy exerts little effect on democratic mood, even over the long run. When corruption is included, however (plots on the right; Model 2.2), the two—separately insignificant—effects of increased electoral democracy combine together and accumulate over time, resulting in a marked increase in democratic mood (a total increase of 0.110 after ten years).
The plots in the second row then show the effects of a standard deviation increase in minoritarian democracy, holding electoral democracy constant. Regardless of whether or not corruption is included, an immediate decrease in mood is evident (corresponding to the coefficients of change in minoritarian democracy in Models 2.1 and 2.2). The trajectory of mood then depends on whether corruption is included. When it is—in Model 2.2, arguably the more robust specification—mood never recovers. The deleterious impact of an increase in minoritarian democracy is permanent.
In sum, this analysis has demonstrated that the thermostatic effect of changes in democracy can be traced back to the counter-majoritarian, liberal, or minoritarian components of democracy. It is not improvements in majoritarian institutions and processes that damage democratic mood, but, instead, increased legislative and judicial oversight and enhanced protections of minority and individual rights which provoke the backlash.
CONCLUSION
Using new national-level measures of democracy and democratic mood for 135 countries and up to 30 years, this article revisits the question of why the public supports or opposes a democratic system. Leading theories argue that the presence of democracy plus the passage of time produces higher levels of support as generation after generation learns about democracy and comes to value the freedoms and responsive government it provides. Yet such positive feedback between democracy and mood stands in contrast with emerging narratives of democracy’s fading allure (Plattner Reference Plattner2017) and declining support (Foa and Mounk Reference Foa and Mounk2016, Reference Foa and Mounk2017). Indeed, as the article shows in its descriptive analysis of the trends of democracy and democratic mood, support can ebb and flow, even in long-established democracies.
In contrast to theories of democratic socialization and lifelong learning, this article has proposed a thermostatic model of democratic mood. The evidence supports this thermostatic model: increases in democracy dampen public mood, while decreases cheer it. The article then attempts to unpick the puzzle of why citizens would favor diminished democracy, finding that it is not improvements in majoritarian rights and institutions that damage democratic mood, but, instead, it is improvements in counter-majoritarian rights and institutions that provoke the backlash. Moreover, there is little evidence in favor of the theory that democratic support is learned, whether through socialization or later-life experience with democratic freedoms. The short-run effects of lagged democracy are tiny and usually insignificant. Over the long run, these effects take decades to add up to any marked increase in mood. Democracy therefore does not appear to create its own demand.
With doubt cast on the theory that the public becomes more supportive the longer their experience with democracy (see also Denemark, Donovan, and Niemi Reference Denemark, Donovan, Niemi, Denemark, Mattes and Niemi2016), it would be a fruitful avenue for future research to examine the processes of democratic socialization and learning more closely. Studies of existing data would, however, have to consider the separate impacts of age, generation, and period effects, as well as navigate the shoals of potentially nonequivalent cross-national measures of democratic support. Alternatively, another lens on the thermostatic effect identified in this article could be obtained by fielding a panel survey in a new democracy, which would allow researchers to identify micro-level reactions to democratic change.
The findings of this article resonate with long-standing arguments in the literatures on judicial review and political tolerance. The former has long been concerned with the “counter-majoritarian difficulty” thrown up by judicial review of majority decisions (e.g., Bickel Reference Bickel1986)—and it seems that publics in many societies share these concerns. The latter has shown that extending democratic rights and legal protections to minorities is the most difficult and unappetizing aspect of democracy for many citizens (e.g., Gibson Reference Gibson2008). This stands in contrast to majoritarian principles such as “rule by the people,” which are readily and widely endorsed by majorities in autocratic and democratic societies alike (Gibson Reference Gibson1998).
This article also have implications for the crisis said to be currently facing democracy (Diamond Reference Diamond2015; Mechkova, Lührmann, and Lindberg Reference Mechkova, Lührmann and Lindberg2017; Plattner Reference Plattner2017). In particular, the decreases in support that follow increases in democracy pose a challenge to democratic consolidation. After a significant transition to democracy, public support for democracy declines exactly when the fledgling democracy is most vulnerable (especially if the new regime features extensive counter-majoritarian institutions). On a brighter note, the reverse of this dynamic is also evident: should elected leaders start dismantling democratic institutions and rights, public mood is likely to swing rapidly toward democracy again, providing something of an obstacle to democratic backsliding.
Yet, the findings of this article also undermine the concept of democratic consolidation, echoing Foa and Mounk (Reference Foa and Mounk2016, Reference Foa and Mounk2017). One of the key pillars of a consolidated democracy is that “the overwhelming majority of the people” are committed to a democratic form of government (Linz and Stepan Reference Linz and Stepan1996, 5). Yet if democratic mood can weaken even in long-established democracies, then we cannot be certain that any democracy will retain majority support in future. As such, we cannot be certain that any democracy—no matter how long-standing—is consolidated. Indeed, because democracy does not appear to create its own demand, an equilibrium of “consolidated democracy,” where high levels of democracy both promote, and are sustained by, high levels of public support, may not exist.
SUPPLEMENTARY MATERIAL
To view supplementary material for this article, please visit https://doi.org/10.1017/S0003055419000558.
Replication materials can be found on Dataverse at: https://doi.org/10.7910/DVN/FECIO3.


Comments
No Comments have been published for this article.