


INTRODUCTION
Since its inception in 2008, the Cape south coast ichnology project has yielded a growing data set of Pleistocene vertebrate tracksites from the South African coast between the town of Arniston in the west and the Robberg peninsula in the east (Helm et al., Reference Helm, Cawthra, Cowling, De Vynck, Lockley, Marean, Thesen and Venter2020a) (Fig. 1). More than 250 such sites have been identified in aeolianite and cemented foreshore deposits, indicating a diverse trace fossil record with the potential to complement and greatly enhance the rich traditional body fossil archive in the region (e.g., Klein, Reference Klein1976, Reference Klein1983; Klein et al., Reference Klein, Avery, Cruz-Uribe and Steele2007; Rector and Reed, Reference Rector and Reed2010; Marean et al., Reference Marean, Cawthra, Cowling, Esler, Fisher, Milewski, Potts, Singels, De Vynck, Allsopp, Colville and Verboom2014; Matthews et al., Reference Matthews, Marean and Cleghorn2019), which is derived largely from archaeological sites and scavenger dens. Examples of these ichnological findings include reports of hatchling turtle tracks (Lockley et al., Reference Lockley, Cawthra, De Vynck, Helm, McCrea and Nel2019), crocodile and water monitor tracks (Helm et al., Reference Helm, Cawthra, Combrink, Helm, Rust, Stear and Van Den Heever2020b), giraffe tracks (Helm et al., Reference Helm, Cawthra, Cowling, De Vynck, Marean, McCrea and Rust2018a), and hominin tracks (Helm Reference Helm, McCrea, Cawthra, Cowling, Lockley, Marean, Thesen, Pigeon and Hattingh2018b, Reference Helm, Lockley, Cole, Noakes and McCrea2019a). These discoveries have significant palaeo-environmental implications, for example, giraffes require a savanna ecosystem, and crocodiles and turtles require warm temperatures and sufficient water in which to breed successfully. More recently, the search for vertebrate trace fossil sites was extended to the Cape southeast coast to Algoa Bay, east of Port Elizabeth, with the identification of further ichnofossil sites (Fig. 1)
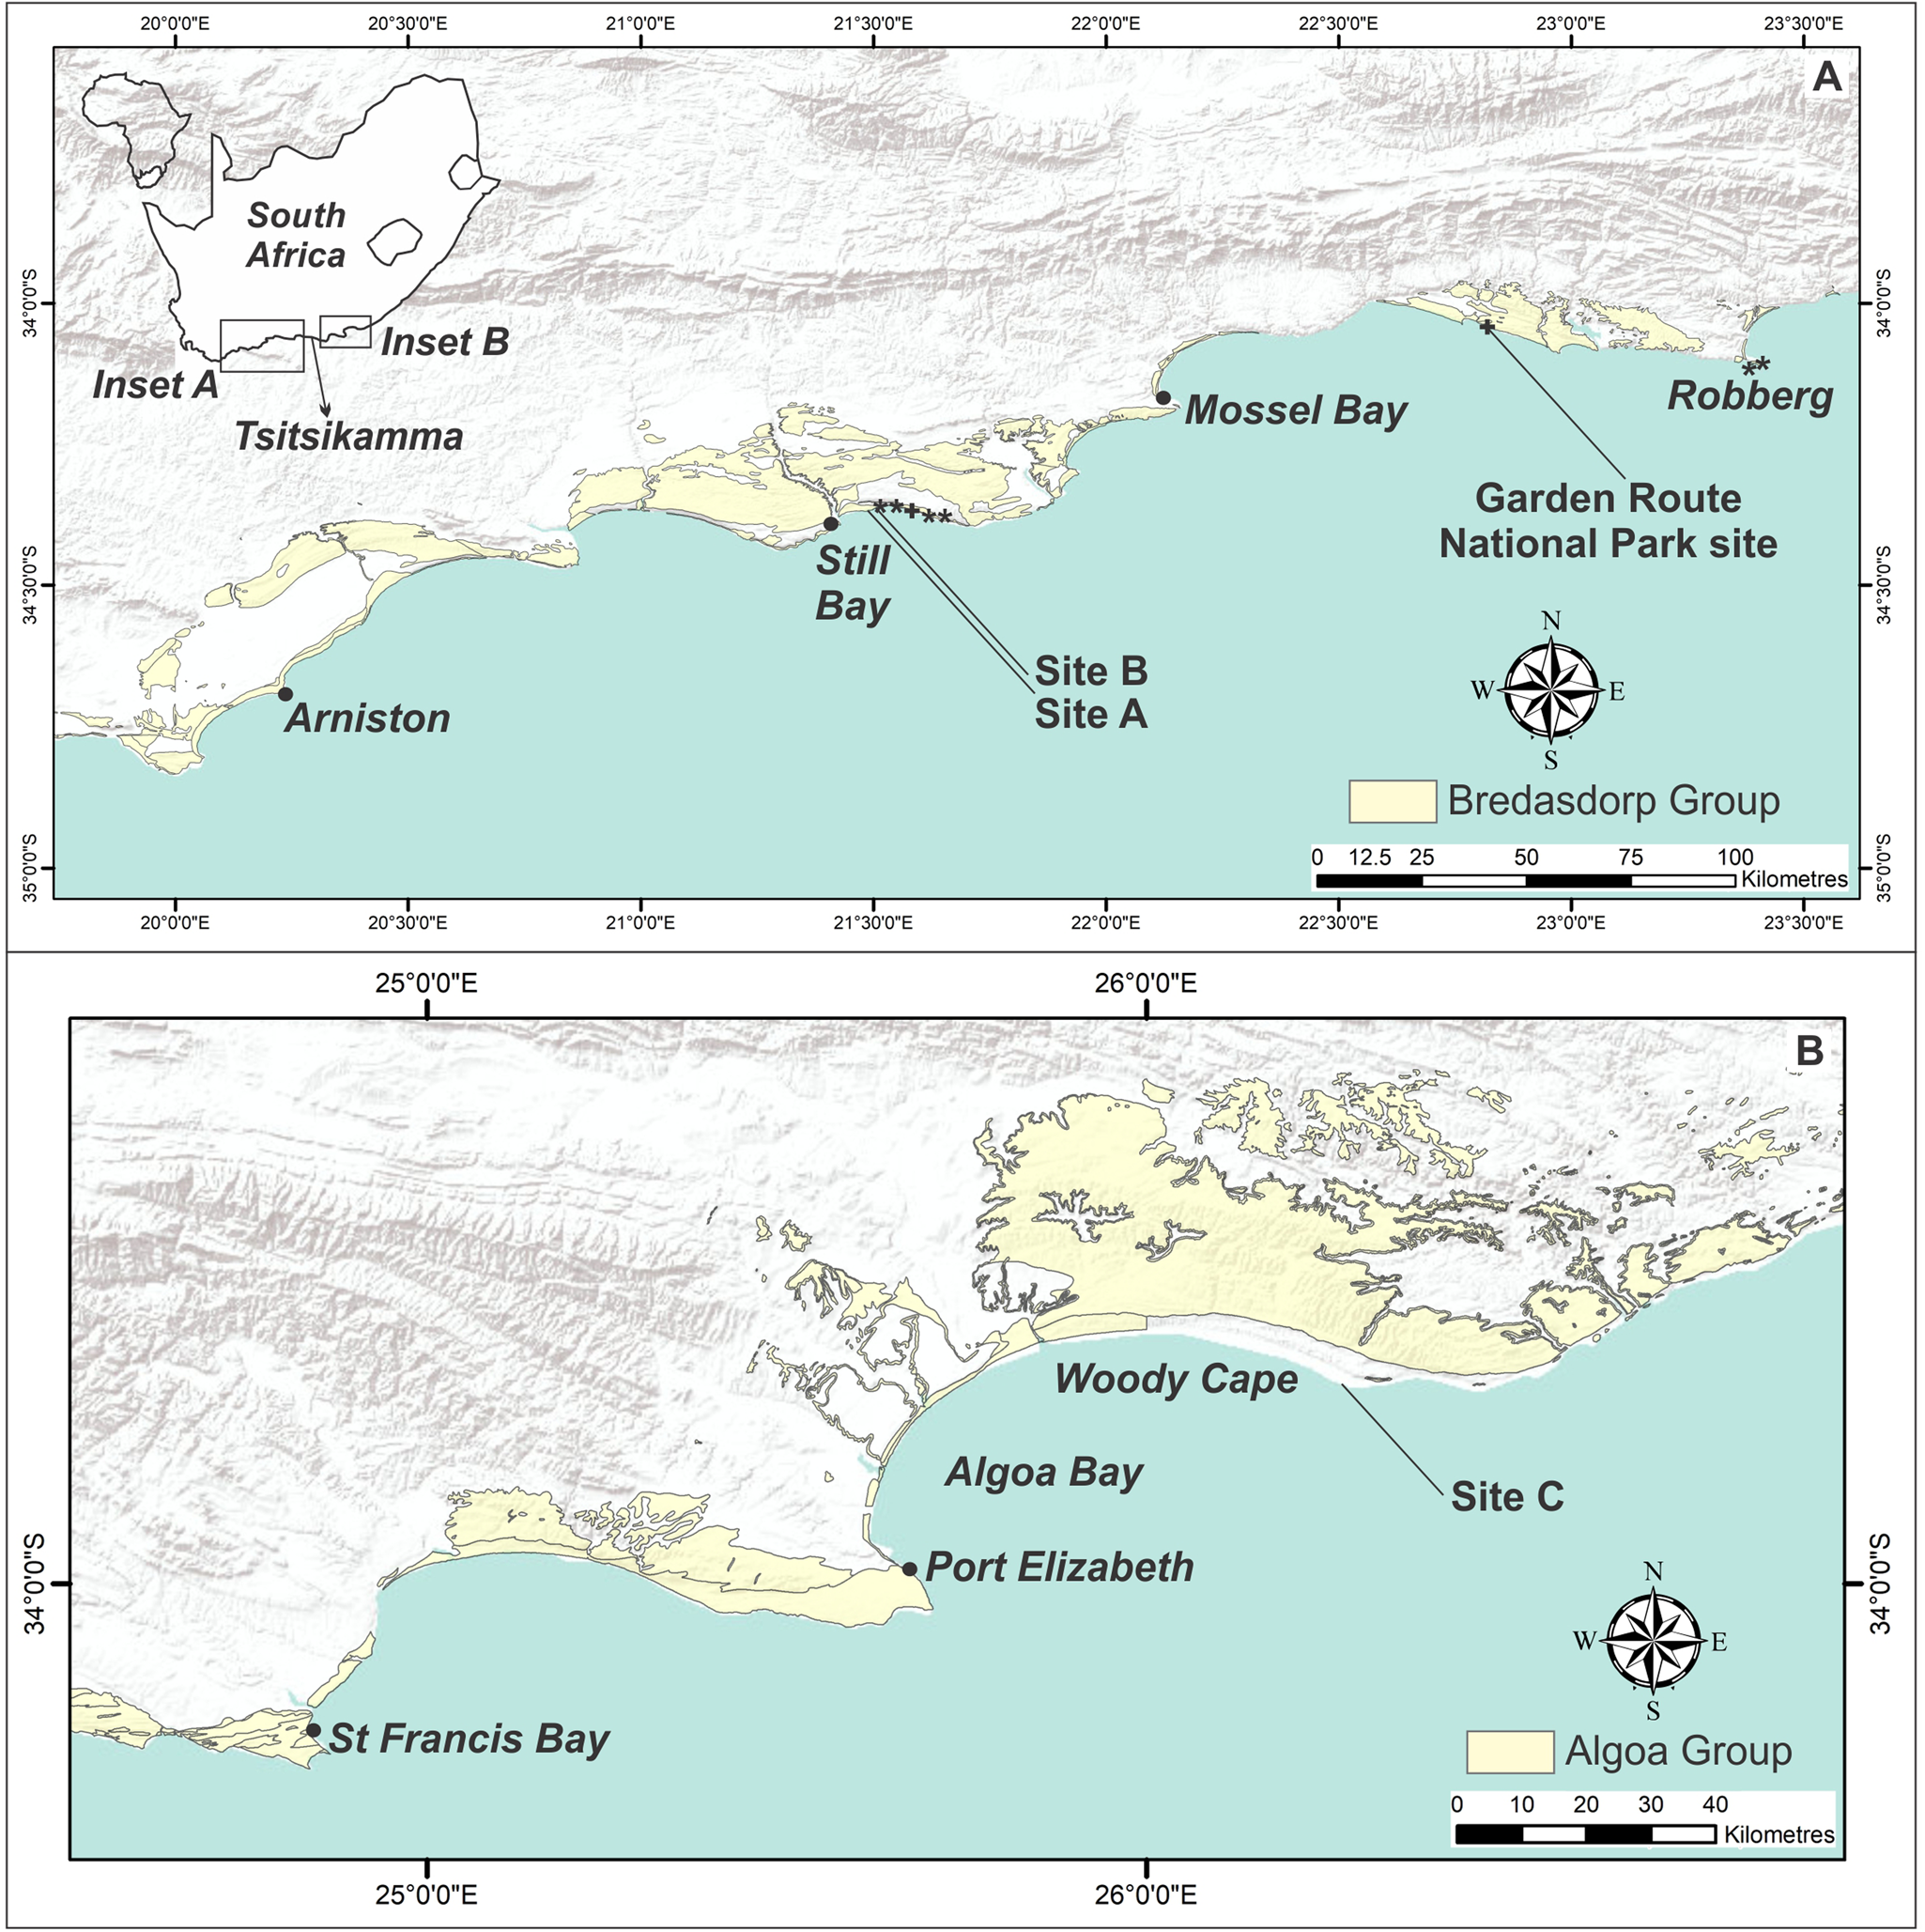
(color online) Map of the Cape south coast and Cape southeast coast, showing the extent of deposits of the Bredasdorp Group (A) and Algoa Group (B). Golden mole burrow sites are indicated by *. Sites A, B, and C indicate sand swimming sites. Equivocal sites are indicated by +.
The Cape south coast is of great palaeo-anthropological significance, providing evidence of the emergence and survival of modern humans prior to their dispersal through Africa and the rest of the world (e.g., Henshilwood et al., Reference Henshilwood, D'errico, Yates, Jacobs, Tribolo, Duller and Mercier2002; Marean et al., Reference Marean, Bar-Matthews, Bernatchez, Fisher, Goldberg, Herries and Jacobs2007, Reference Marean, Cawthra, Cowling, Esler, Fisher, Milewski, Potts, Singels, De Vynck, Allsopp, Colville and Verboom2014). In this field, trace fossils have also provided new lines of evidence, firstly through hominin tracksites with substantial numbers of tracks (Helm et al., Reference Helm, McCrea, Cawthra, Cowling, Lockley, Marean, Thesen, Pigeon and Hattingh2018b, Reference Helm, Lockley, Cole, Noakes and McCrea2019a), but also where other traces of hominin activity (e.g., foraging, messaging, creation of images and patterns) are reported on surfaces of unconsolidated sand. These activities are amenable to recognition and interpretation today in the form of ammoglyphs (Helm et al., Reference Helm, Cawthra, De Vynck, Helm, Rust and Stear2019b).
The track record has also corroborated the body fossil record with respect to extinct members of the regional Pleistocene megafauna. Examples include documentation of tracks and trackways of the long-horned buffalo or giant buffalo (Syncerus antiquus), and the giant Cape zebra (Equus capensis) (Helm et al., Reference Helm, McCrea, Cawthra, Thesen and Mwankunda2018c, Reference Helm, Cawthra, Cowling, De Vynck, Lockley, Marean, Thesen and Venter2020a).
Furthermore, we know the information gleaned from traditional body fossil sites is often biased, as the primary accumulators of these assemblages (people, carnivores, etc.) introduced predation and transport biases that affect whether we view such data as representative of once-living communities. In contrast, the track record provides evidence of the presence of living animals moving on ancient dune and beach surfaces. However, some bias is present in the case of tracks, as larger, heavier animals registered larger, often deeper tracks, which may be easier to recognize and interpret today. Larger tracks may also be less susceptible to rapid erosion once exhumed and exposed.
These surfaces of unconsolidated, but locally firm, sand may have been attractive to vertebrate trackmakers as easily accessible, unrestricted travel corridors. For other Pleistocene animals, the presence of sand or soil may have been a requirement for their existence, including fossorial groups like the golden moles (order Afrotheria, family Chrysochloridae). Examples would include burrow traces or trails: within this family some species only require soft sandy or loamy substrates in which to burrow, whereas, for example, Grant's golden mole (Eremitalpa granti) has requirements that are dune-specific.
We report here on such traces, both those that appear similar to traces made by members of the extant regional fauna (and are thus not unexpected), and those which appear to have been made by sand-swimmers, which resemble the tracks made by representatives of the genus Eremitalpa, which, today, is known from the west coast region but not the south coast region. Recognition of Eremitalpa traces typifies many of the aforementioned occurrences: they were not anticipated as a result of the body fossil record, they probably represent one or more extinct species, and they allow for palaeo-environmental inferences. Furthermore, they are unique in the global ichnological record. The purpose of this article is to document the evidence from these golden mole trace fossil sites, to consider their implications, and—where appropriate—to describe, erect, and interpret new ichnotaxa.
GEOLOGICAL CONTEXT
Structurally, the ~800-km-long Cape south coast region comprises three key elements: the mountains of the Cape Fold Belt; a seaward-dipping relatively low-relief coastal platform bordered by the Indian Ocean; and a broad, planar continental shelf forming the Agulhas Bank, which extends from Cape Agulhas to the northeastern boundary of Algoa Bay. Pleistocene sea-level oscillations, related to rapid climate changes, led to the repeated exposure and inundation of the vast Palaeo-Agulhas Plain. This region is characterised by its wide continental shelf (~270 km wide south of Cape Agulhas) with a shelf break shoaling from 200 m off Cape Agulhas to ~140 m south of Port Elizabeth (Martin and Flemming, Reference Martin and Flemming1986). The coastline of the Cape south coast is dominated by deposits of the Palaeozoic Cape Supergroup, with structural embayments infilled by Mesozoic and Cenozoic deposits of the Uitenhage Group, Bredasdorp Group and Algoa Group. Northeast of Algoa Bay, the geological substrate of the coast, as well as the character of the continental shelf, changes markedly (e.g., Dingle et al., Reference Dingle, Siesser and Newton1983).
Pleistocene calcarenite rocks on the present-day coastal plain are the fringing remnants of a dominance of comparable deposits on the adjacent shelf (Cawthra et al., Reference Cawthra, Compton, Fisher, MacHutchon, Marean, Harff, Bailey and Lüth2015). Aeolianites of the Bredasdorp Group that are currently evident above sea level along the modern coast represent phases of dune construction that appear mostly to be associated with regressive phases of sea level, following the sea-level high stands of Marine Isotope Stage (MIS) 11 and MIS 5e (Carr et al., Reference Carr, Bateman, Roberts, Murray-Wallace, Jacobs and Holmes2010; Bateman et al., Reference Bateman, Carr, Dunajko, Holmes, Roberts, McLaren, Bryant, Marker and Murray-Wallace2011; Roberts et al., Reference Roberts, Karkanas, Jacobs, Marean and Roberts2012; Cawthra et al., Reference Cawthra, Jacobs, Compton, Fisher, Karkanas and Marean2018). Such circumstances provided a source of sand suitable for the formation of coastal dune cordons. However, on Robberg, Carr et al. (Reference Carr, Bateman, Cawthra and Sealy2019) documented the first currently non-submerged examples of onshore accumulation (MIS 3), that are not associated with a sea-level high-stand. Deposits preserved on the continental shelf were associated with both transgressive and regressive sea-level events (Cawthra et al., Reference Cawthra, Jacobs, Compton, Fisher, Karkanas and Marean2018).
The aeolianites mostly comprise fine-to medium-grained sand with a high carbonate content derived from marine shell fragments. Dune deposits become cemented as a result of the downward percolation of rainwater in the meteoric diagenetic zone, which mobilizes the carbonate shell component; carbonates are re-deposited as interstitial cement within the sandstone matrix (Flügel, Reference Flügel2004). An explanation of the plentiful occurrence of vertebrate tracks and traces in coastal southern African aeolianites has been proposed by Roberts and Cole (Reference Roberts and Cole2003), through a combination of: cohesive moist sand, which provides an effective moulding agent; high sedimentation rates, which promote swift track burial; rapid lithification via partial solution and re-precipitation of bioclasts; and shoreline erosion, which re-exposes the track-bearing surfaces.
Pleistocene sedimentary facies are dominated by large-scale, steeply dipping, planar cross-stratification formed by foreset progradation of dunes (Roberts et al., Reference Roberts, Bateman, Murray-Wallace, Carr and Holmes2008). Alternating with such facies are low-angled laminated facies that represent interdune areas (Hunter, Reference Hunter1977; Fryberger et al., Reference Fryberger, Ahlbrandt and Andrews1979). A few intermittent palaeosols also occur and may contain evidence of burrow traces. Shallow marine environments are represented by cemented shoreface and foreshore horizons, along with fine-grained surfaces representing lagoonal environments. Vertebrate tracks and traces are found in aeolianites and deposits representing interdune, foreshore, and lagoonal environments.
Cenozoic deposits occur extensively along the coastline of southern Africa (Roberts et al., Reference Roberts, Botha, Maud, Pether, Johnson, Annhaeuser and Thomas2006). On the Cape south coast, they are classified as the Bredasdorp Group. Within this group, the Pleistocene aeolianites comprise the Waenhuiskrans Formation (Malan, Reference Malan1989), and the Pleistocene marine deposits comprise the Klein Brak Formation (Malan, Reference Malan1991). On the Cape southeast coast, Cenozoic deposits are classified as the Algoa Group. Within this group, the Pleistocene aeolianites form the Nahoon Formation (Le Roux, Reference Le Roux1989), and the marine deposits comprise the Salnova Formation (Le Roux, Reference Le Roux1991). The boundary between the Bredasdorp Group and Algoa Group is Tsitsikamma. In the east, sea level is also the main driver of deposition in the Algoa Group, and recent dating studies carried out on the strata (e.g., Jacobs and Roberts, Reference Jacobs and Roberts2009) indicate that the depositional patterns and trends mirror those of the Bredasdorp Group. The Waenhuiskrans Formation and Nahoon Formation have been correlated, as have the Klein Brak Formation and Salnova Formation (Le Roux, Reference Le Roux1990; Roberts et al., Reference Roberts, Botha, Maud, Pether, Johnson, Annhaeuser and Thomas2006). Distinguishing between aeolian and marine sediments of these respective formations is not always straightforward: this is a reflection of transition zones that often exist between the upper ends of beach deposits and the lower reaches of dune deposits, where sea-level fluctuations and sediment reworking may further complicate interpretation.
Trace fossil sites may occur in situ, either in epirelief on exposed surfaces, in hyporelief under overhangs, or in cross section in cliffs. Cliff collapse events are common, and numerous loose blocks and slabs, some with track-bearing surfaces, come to rest at the base of cliffs and above present sea level. In such cases it is important to understand the stratigraphic orientation of the blocks in order to interpret the trace fossils. Ichnologists distinguish between epifaunal surface traces (tracks and trackways), deeper infaunal traces (e.g., burrows), and shallow sub-surface trails.
The ichnological terminology used for tetrapod burrows is somewhat different from the terminology used for trackways, and beyond the scope of this paper to review in detail. Generally, small- and medium-sized tetrapods can create both burrows and trackways, whereas larger tetrapods generally leave only tracks. The term ‘trackway’, indicating a discontinuous sequence of footprints, is generally not appropriate for the extended horizontal burrows described here. Rather, ‘trail’ with its connotation of a surface pathway (as in a ‘game trail’) can be used, as in a ‘surface trail’ made by a single trail maker. However, the general term ‘burrow’ is also widely used as a descriptor. In either case the distinction between a horizonal infaunal burrow or an epifaunal trail is important from both a morphological and behavioral viewpoint, notwithstanding a given species’ ability to make both. Features within the trail, made by the trail-maker's various limbs, may legitimately be referred to as tracks, or by the more generic term ‘trace’. Some of the sand-swimming features we describe are ichnologically intermediate between epifaunal trackways and the deeper infaunal burrows made by other members of the golden mole family. In this article, we do not use the term ‘trackway’ in describing such features, but favor the use of the term ‘trail’, as the least-ambiguous terminology.
METHODS
Global Positioning System readings were obtained for trace fossil sites, using a handheld device. For safely accessible sites, measurements were taken of length, width, and depth (in centimetres) of the trace fossils. Strike and dip measurements were recorded for in situ sites. Full-size tracings were made where appropriate, using clear acetate film: these have been reposited in the University of Colorado Museum (UCM) archive in the series T1890–T1898 (for October 2019). Samples were taken for optically stimulated luminescence (OSL) dating at sites A and B, and stratigraphic correlation to known dated sites was applied, indicating a MIS 5 age. Locality data was reposited with the African Centre for Coastal Palaeoscience, to be made available to researchers upon request.
We determined the orientation of surfaces, both where obvious for in situ sites, and where cross-sectional stratigraphy determined the orientation of loose blocks. This approach helped identify other tracks and traces in cross section.
Photographs were taken, including images for photogrammetry (Falkingham, Reference Falkingham2012; Matthews, Reference Matthews, Noble, Breithaupt, Falkingham, Marty and Richter2016; Falkingham et al., Reference Falkingham, Bates, Avanzini, Bennett, Bordy, Breithaupt and Castanera2018). Photogrammetry 3D models were generated with Agisoft Metashape Professional (v. 1.0.4) using an Olympus TG-5 camera (focal length 4.5 mm; resolution 4000 × 3000; pixel size 1.56 × 1.56 um). The final images were rendered using CloudCompare (v.2.10-beta).
RESULTS
Six sites from the Cape south coast that suggest golden mole burrows are described and listed from west to east as i) to vi). Three of these, iii), v) and vi), have previously been reported. Description then follows of three other sites (Sites A, B and C), from west to east, that suggest sand-swimming golden moles as tracemakers. This is followed by description of two equivocal sites, one of which could not be closely approached, and another which presented identification challenges.
Burrow traces
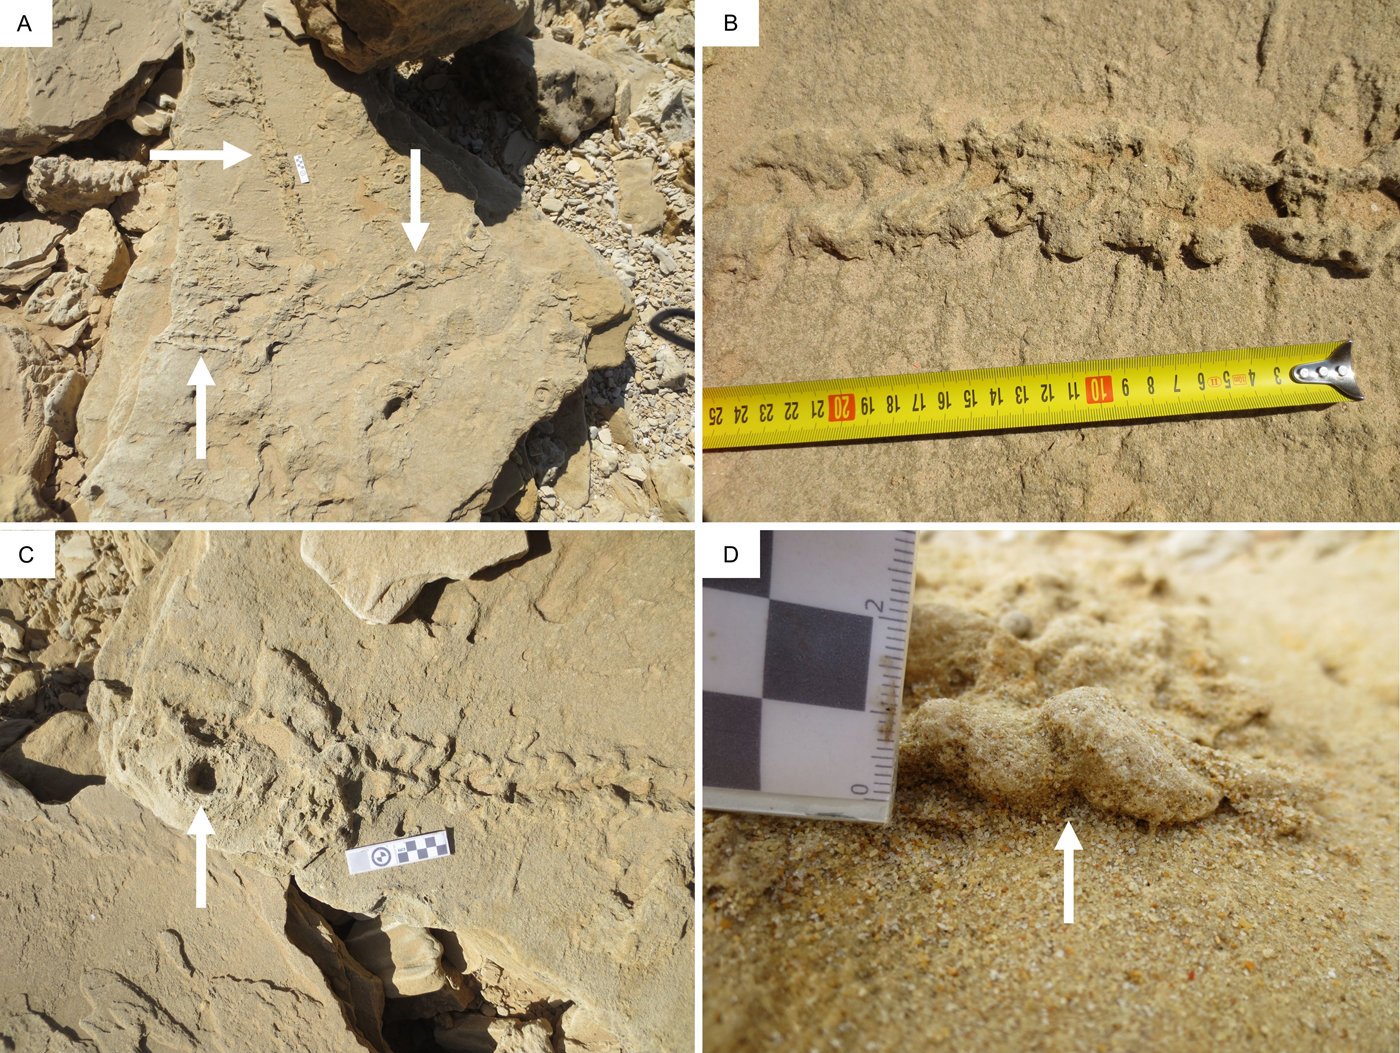
i) A site identified on a loose block east of Still Bay exhibited filled burrow traces up to 80 cm in length and up to 7 cm in diameter (Fig. 2A).
ii) Two km east of i), burrow traces up to 75 cm in length and up to 6 cm in diameter, without infill, were identified on a loose block (Fig. 2B).
iii) One possible golden mole burrow site was previously described from further east of Still Bay (Helm et al., Reference Helm, Cawthra, de Vynck, Lockley, McCrea and Venter2019c), where a massive fallen block contained multiple bedding planes, on which elephant, artiodactyl, and avian trackways were noted, in addition to small invertebrate traces and probable golden mole burrow traces without infill. Direct measurement of length and diameter was not feasible, but a diameter of up to 10 cm was estimated. An image from this site is reproduced here as Figure 2C.
iv) A site 3 km further east from iii) exhibited a long, sinuous burrow trace (length not measurable, diameter 7 cm), without infill, on the underside of a large fallen block (Fig. 2D).
v) Two golden mole burrow sites were described from Robberg (Helm et al., Reference Helm, Cawthra, Hattingh, Hattingh, McCrea and Thesen2019d). The first site contained filled burrow traces up to 300 cm in length, and up to 7 cm in diameter, within sediments that have been demonstrated to be in the range of 35–42 ka (Carr et al., Reference Carr, Bateman, Cawthra and Sealy2019). An image from this site is reproduced here as Figure 2E.
vi) The second Robberg site contained filled burrow traces up to 140 cm in length, and up to 7 cm in diameter. These burrows occur as epifaunal (surface) features and infaunal (cross sectional) features, and included a chamber, in sediments dated in the range of 56–67 ka (Carr et al., Reference Carr, Bateman, Cawthra and Sealy2019). An image from this site is reproduced here as Figure 2F.
(color online) (A) Filled burrow traces east of Still Bay; scale bar = 10 cm between outer black circles. (B) Burrow traces without infill east of Still Bay; scale bar = 10 cm between outer black circles. (C) Inaccessible burrow traces without infill east of Still Bay. (D) Long, sinuous burrow trace on the underside of a large fallen block east of Still Bay. Arrow indicates infaunal portion. (E) Filled burrow traces at Robberg; scale bar = 25 cm between outer black circles. (F) Filled burrow traces at Robberg; scale bars = 10 cm between outer black circles.

Sand-swimming trails
Site A
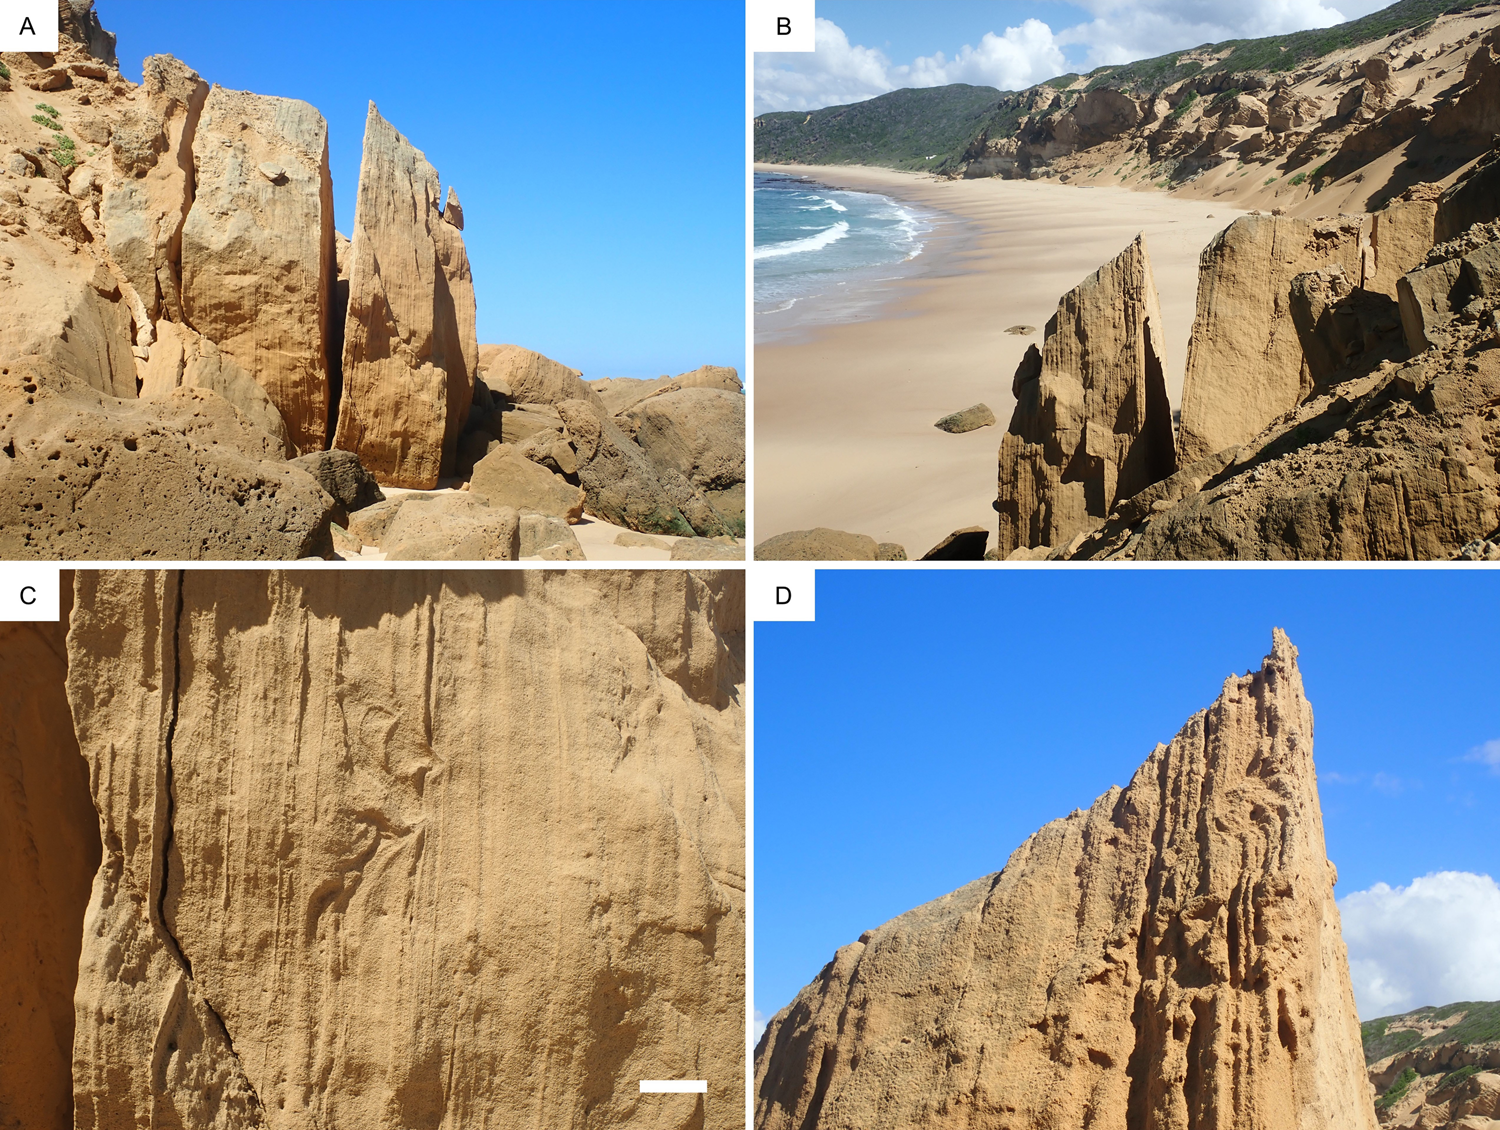
East of Still Bay, a large (4 × 4 × 4 m) split block, dislodged from the cliffs above, is at rest on the beach, with its bedding planes vertically orientated in a shore-parallel, east-west direction (Figs. 3A and 3B). The distance between the exposed part and counterpart epifaunal impressions and corresponding natural casts varied from 2 cm at the bottom to ~50 cm at the top. The confined space prevented the tracks from being seen to good advantage, and we could only describe them as large (~20 × ~16 cm), with substantial displacement rims. Elephant, hippopotamus or rhinoceros represent the most likely trackmakers. Tetrapod tracks seen at various stratigraphic levels in cross section on the western and eastern sides (Figs. 3C and 3D) clearly indicate the southern as the epirelief surface on which the tracks were originally registered, and the northern the hyporelief infill surface.
(color online) (A) Site A, viewed from the west. (B) Site A, viewed from the east. (C) Bedding planes at Site A, viewed from the west, showing deformation from tetrapod tracks, which allowed the ‘way up’ to be determined; white scale bar = 10 cm. (D) Bedding planes at Site A, viewed from the east, showing deformation from tetrapod tracks, which allowed the ‘way up’ to be determined.
At the western ends of these two surfaces, we examined a trail that resembled that of a sand-swimming golden mole. It extended for at least 130 cm in a curved fashion (Fig. 4). Trackway width was 8–10 cm. At the lower end a wider portion (maximum 18 cm in diameter) extended over a distance of 17 cm (Fig. 4B). Preserved detail of this trackway on the northern surface was far superior to that on the southern surface. However, as discussed below, due to it being the ‘molding’ of a convex-up feature it appears in concave hyporelief, unlike the natural casts (in convex hyporelief) of tracks on the same surface. Tracings (T 1894) were made (Fig. 4C) and photogrammetry was applied (Fig. 4D) forming the basis for the holotype for Natatorichnus subarenosa ichnogen. et ichnosp. nov., as detailed below (Ichnotaxonomy). A sample was taken for OSL dating.
(color online) (A) and (B) Hyporelief surface at Site A, showing holotype of Natatorichnus subarenosa ichnogen. et ichnosp. nov. Bulges of trail architecture are lightly outlined in chalk in B, which shows the area of widening; scale bars = 10 cm. (C) Tracing T 1894 of Site A; epirelief on the left, hyporelief on the right. (D) Photogrammetry color mesh of hyporelief surface at Site A, using 59 images. Photos were taken an average of 28.4 cm from the surface. The reprojection error is 0.41 pix. Vertical and horizontal scales are in metres.

Site B
Two km east of Site A, preserved on the underside of a low ceiling (Fig. 5A), we identified a 37-cm-long hyporelief trail varying in width between 8 and 12 cm, with localized infilling of a prominent median sulcus (furrow) (Fig. 5B). Photogrammetry was applied to this trackway (Fig. 5C). A sample was taken for OSL dating. Two nearby loose slabs were inferred to have originated from the same horizon; both exhibited tracks of the extinct giant Cape zebra (Equus capensis) representing a galloping gait pattern. As detailed below (Ichnotaxonomy), Site B yields a paratype for Natatorichnus sulcatus ichnogen. et ichnosp. nov.
(color online) (A) Hyporelief surface at Site B showing paratype for Natatorichnus sulcatus ichnogen. et ichnosp. nov.; scale bar = 10 cm; the apparent semicircular ending of the trail may represent emergence at a higher stratigraphic level. (B) Angled view at Site B, showing the median sulcus in hyporelief, indicated with an arrow; scale bar in cm. (C) Photogrammetry color mesh of hyporelief surface at Site B, using 37 images. Photos were taken an average of 36.9 cm from the surface. The reprojection error is 0.47 pix. Vertical and horizontal scales are in metres.

Site C
Site C lies in the Woody Cape region of the Addo Elephant National Park, more than 450 km east of sites A and B. A cluster of epirelief trails with distinctive morphology was observed on three adjacent aeolianite slabs in the Nahoon Formation, respectively 2.0 m and 3.6 m apart (Fig. 6A–D). The largest slab measured more than 150 × 120 cm, but the orientation of these slabs could not be determined, as they appeared to have separated from more-elevated in situ surfaces with identical stratigraphy, less than 5 m above mean sea level. The trails are preserved predominantly in convex epirelief, except for the median sulcus, which is in concave epirelief. These trails exhibit localized widenings or terminations beside rounded cavities. The longest trail is more than 100 cm in length with width between 5 and 7 cm. As detailed below, Site C yields the holotype for Natatorichnus sulcatus ichnogen. et ichnosp. nov. (Fig. 6B). Photogrammetry was applied to the Site C surfaces (Figs. 7A–C). The host rocks consist of well-sorted fine-to-medium sand, lithified by post-deposition cementation of calcium carbonate.
(color online) (A) Trails in epirelief at Site C, arrow indicates the holotype of Natatorichnus sulcatus ichnogen. et ichnosp. nov.; scale bar = 10 cm. (B) Part of holotype of Natatorichnus sulcatus ichnogen. et ichnosp. nov., preserved in epirelief with characteristic median furrow or sulcus; compare with Figure 7B. (C) Epifaunal trail beside a cavity (indicated with an arrow) at Site C; scale bar = 10 cm. (D) Magnified view of epifaunal traces at Site C, indicated by arrow, showing en échelon bulges; scale bar in cm and mm.
(A) Photogrammetry color mesh of short trail on western epirelief surface at Site C, using 7 images. Photos were taken an average of 26.2 cm from the surface. The reprojection error is 0.6 pix. Vertical and horizontal scales are in metres. (B) Photogrammetry color mesh of holotype of Natatorichnus sulcatus ichnogen. et ichnosp. nov, (compare with Figure 6B) on western epirelief surface at Site C, using 33 images. Photos were taken an average of 16.5 cm from the surface. The reprojection error is 0.54 pix. Vertical and horizontal scales are in metres. Note that in the topographically lowest area of the present surface (blue end of spectrum) the burrow is more completely collapsed: see text for details. (C) Photogrammetry color mesh of long trail on western epirelief surface at Site C, using 34 images. Photos were taken an average of 25.1 cm from the surface. The reprojection error is 0.47 pix. Vertical and horizontal scales are in metres. (For interpretation of the references to color in this figure legend, the reader is referred to the web version of this article.)

Equivocal sites
Two km east of Site B, hyporelief trails/burrows were observed, on the underside of a protruding rock ledge ~10 m above the cliff base (Figs. 8A and 8B). This was a fragile, unstable area, with a significant risk of cliff collapse, preventing attempts to get close to the trails or to measure them. However, we observed evidence of a median feature, probably the infill of a deep median sulcus in the original trackway. We regard the site as relevant to the topic of golden mole traces, access problems notwithstanding. Roberts et al. (Reference Roberts, Bateman, Murray-Wallace, Carr and Holmes2008) reported dates in the range of (140 ka ± 8.3 ka – 91 ka ± 4.6 ka) for sediments dated from a site located ~100 m to the east.
(color online) (A) View up cliffs east of Site B. Arrow indicates trails under an overhanging ledge. (B) Magnified view, showing trails in hyporelief.

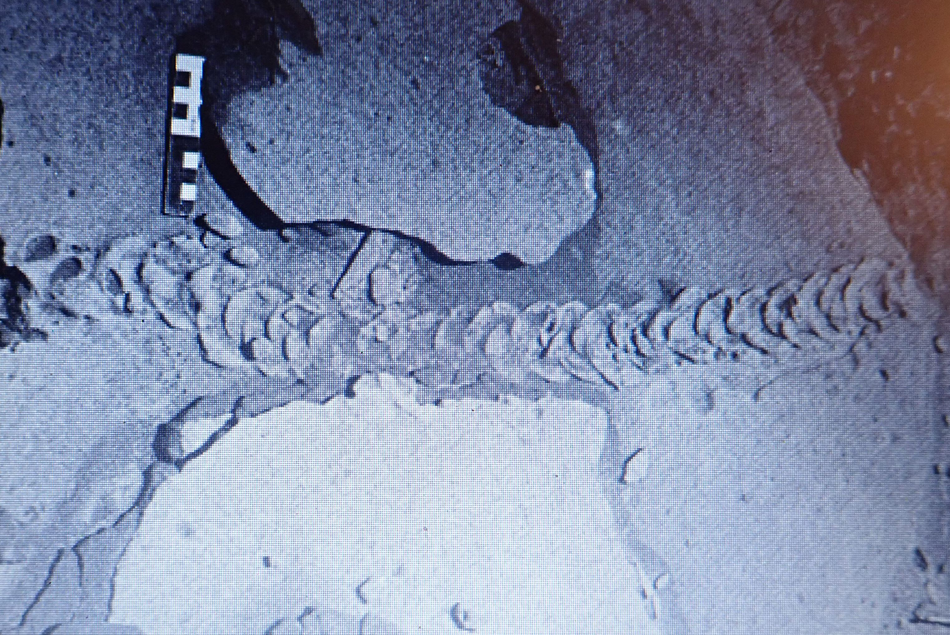
More than 100 km east of Sites A and B, in a coastal portion of the Garden Route National Park, a loose slab lay exposed on a dune surface above the high-tide mark. The slab measured 60 × 60 cm, and was ~20 cm thick. While the ichnological evidence was described as “difficult to interpret”, tracks on this surface were interpreted in Lockley et al. (Reference Lockley, Cawthra, De Vynck, Helm, McCrea and Nel2019) as possibly having been made by a hatchling turtle. An alternating paddle trace gait was noted, suggestive of a loggerhead turtle (Caretta caretta) trackmaker. The longest segment of trackway measured 25 cm in length, with a diameter of 9 cm.
We re-examined and re-analyzed this loose specimen (Fig. 9), and could not determine the stratigraphic orientation with confidence. We therefore cannot definitively say whether the trackmaker/trailmaker was a hatchling loggerhead turtle or a sand-swimming golden mole. The plausibility of a turtle trackmaker in this general locality is borne out by our identifying, since the publication of Lockley et al. (Reference Lockley, Cawthra, De Vynck, Helm, McCrea and Nel2019), a further hatchling turtle tracksite on a loose slab 1 km west of this site. In this case, reliable indicators were present that indicated which was the ‘right way up’, and the turtle origin of the trackway could be confidently asserted.
(color online) The surface of the Garden Route National Park site; scale bars = 10 cm.

ICHNOTAXONOMY
Preamble
Modern golden mole traces, although not described in detail, and known mainly from documentary and other videos and photographs, are variable and include surface footprints and traces and burrows of various depths. From a functional-behavioral, morphological, and ichnotaxonomic viewpoint, the surface trackways, trails and burrows of golden moles, like those of other burrowing tetrapods, are quite different, though they may be followed one into another. Although there are no ancient examples of surface or epifaunal trackways attributed to golden moles, their present-day infaunal burrows and trails are known, as described here, and there is a previously-illustrated example from an Early- to Middle Tertiary site in Namibia (Ward, Reference Ward1988; Fig. 10). Modern burrows can be quite variable, depending on two important factors: i) the depth of the burrow, and ii) the sediment composition. Here we focus on burrows and trails in sandy facies in which our examples of sand-swimming behaviour are registered. We further demonstrate that burrow and trail morphologies vary in recognizable ways depending on the depth of the burrowing or sand swimming. However, it is outside the scope of this paper to analyze golden mole burrows made in other substrates, such as vegetated soils.
(color online) Trace fossil from Namibia, attributed to Eremitalpa sp. by Ward (Reference Ward1988). Reproduced with permission from John Ward.
For the reasons outlined above and below, we erect the new ichnogenus Natatorichnus ichnogen. nov., meaning ‘swimmer trace’, with the connotation that swimming traces can only be made and preserved in a non-liquid medium where there is organism-substrate contact. Under Natatorichnus, we erect the new ichnospecies N. subarenosa ichnosp. nov. for near-surface trail morphologies that exhibit a raised roof, and N. sulcatus ichnosp. nov. for near-surface trails that characteristically show collapse of the roof as they are being made. A diagnosis is given for the ichnogenus, and descriptions and a differential diagnosis for both ichnospecies, which are represented by holotypes and a paratype.
Formal ichnotaxonomy
Natatorichnus ichnogen. nov.
Holotype: Specimen shown from Site A in Figure 4.
Type locality: Site A, east of Still Bay.
Type horizon: The Pleistocene Waenhuiskrans Formation.
Derivation of name: natator, from the Latin meaning ‘swimmer’ and ichnos meaning ‘trace’.
Diagnosis: Flattened, sand filled, sub-horizontal, linear to meandering, transmitted trail or shallow burrow trace, up to ~10 cm wide, with local width irregularities. Traces are generally upwardly and anteriorly convex into a low roof or ridge, or with ridge or roof mid-line collapsed into a central furrow or sulcus. They are transversely divided into short spreite expressed as low amplitude, en échelon, anteriorly convex bulges, which tend to be arranged sequentially in alternating left-right patterns.
Natatorichnus subarenosa ichnosp. nov. (Fig. 4)
Type locality and horizon: The same as for ichnogenus, the Pleistocene Waenhuiskrans Formation.
Derivation of ichnospecies name: sub from the Latin meaning ‘under’ and arenosa meaning ‘sand.’
Description: Sand filled, sub-horizontal, sub-linear flattened, convex-up transmitted trail trace, ~10 cm wide. Trace upwardly and anteriorly divided into short en échelon anteriorly-convex transverse spreite, numbering ~50 per meter. Anteriorly-convex spreite show consistently alternating left and right traces.
Natatorichnus sulcatus ichnosp. nov. (Figs. 5, 6 and 7)
Holotype: Site C (Figs. 6B and 7B).
Paratype: Site B (Fig. 5).
Type locality: Site C, Woody Cape, Addo Elephant National Park.
Type horizon: The Pleistocene Nahoon Formation.
Derivation of ichnospecies name: sulcatus from the Latin meaning ‘furrow’.`
Differential diagnosis: N. sulcatus differs from N. subarenosa in showing a prominent central furrow or sulcus that represents collapse of the trail roof as the trailmaker progressed just below the surface of the sand. The N. sulcatus holotype is narrower than that of N. subarenosa, whereas the Site B N. sulcatus paratype is of similar width as the N. subarenosa holotype.
Description: Sand filled, sub-horizontal, sub-linear flattened, convex up transmitted trail trace, ~5.0–7.0 cm wide. Trace upwardly and anteriorly divided into short en échelon anteriorly convex transverse spreite, numbering ~70 per meter. Central furrow feature is present, as noted above. The degree of collapse of the trail roof, and hence the width of the collapsed section, may vary, as seen in Figure 7B.
General ichnotaxonomic remarks
As noted above, Natatorichnus can be distinguished as a mole sub-surface trail, distinct from the surface walking trail. Given that it appears to be a feeding or foraging trail it might be labeled as an infaunal, Fodichnia trace, in contrast to its epifaunal, surface walking or Repichnia trace. As these traces may pass one into another and other forms may be present, such as resting traces (Cubichnia) or dwelling traces (Domichnia), such traces are complex. While all potential variants may be useful indicators of the animal's behavioural repertoire, some are outside the scope of this paper.
Differences between N. subarenosa and N. sulcatus (both considered Fodichnia) can be attributed to the stability of the roof under which the trailmaker passed just below the surface. In short, the roof of the former did not collapse whereas in the latter case it did. Videos of extant sand-swimming golden moles making such traces show that these are primary ichnological features: i.e., the roof of N. subarenosa does not collapse as it is made, but in the case of N. sulcatus the roof collapse occurs continuously as soon as the posterior portion of the tracemaker's body no longer holds up the thin sand roof it created by passing just below the surface of the sand (andBeyond, 2017, https://www.youtube.com/watch?v=8dP2LIUGekg). Thus, in the latter, the collapse is not a secondary, post-registration feature. Differences in the cohesion of the surface layers of the sand, and minor variations in the depth of the sub-surface activity, may play a role in determining whether or not the roof collapses. Given that depth of sub-surface activity and cohesion of the surface sand can vary over short distances, both factors may come into play. In either case (depth or sediment cohesion), the tracemaker pushes a bow wave of sand forward, upward and outward, and with each intermittent forward movement, registers a similar but separate trace. Thus, the separate segments reflect incremental stop and go movements, as seen in some videos (BBC, 2016, https://www.youtube.com/watch?v=jlL1yFEaK4U). In short, the sand wave flows and freezes alternately with each forward thrust of the tracemaker, and we can therefore estimate how many motions the animal made to progress for a given distance. However, rate of progression cannot be estimated due to the unknown duration of pauses. In the case of N. subarenosa one can observe that the anterior bulges generally register in an alternating left-right sequence. This again indicates that the tracemaker did not ‘plow’ forward without a component of side to side motion of its head, which again is characteristic of the motion seen on video. Also in the case of the N. subarenosa holotype (Site A in Fig. 4), a widened area is seen which indicates deviation from a more linear motion.
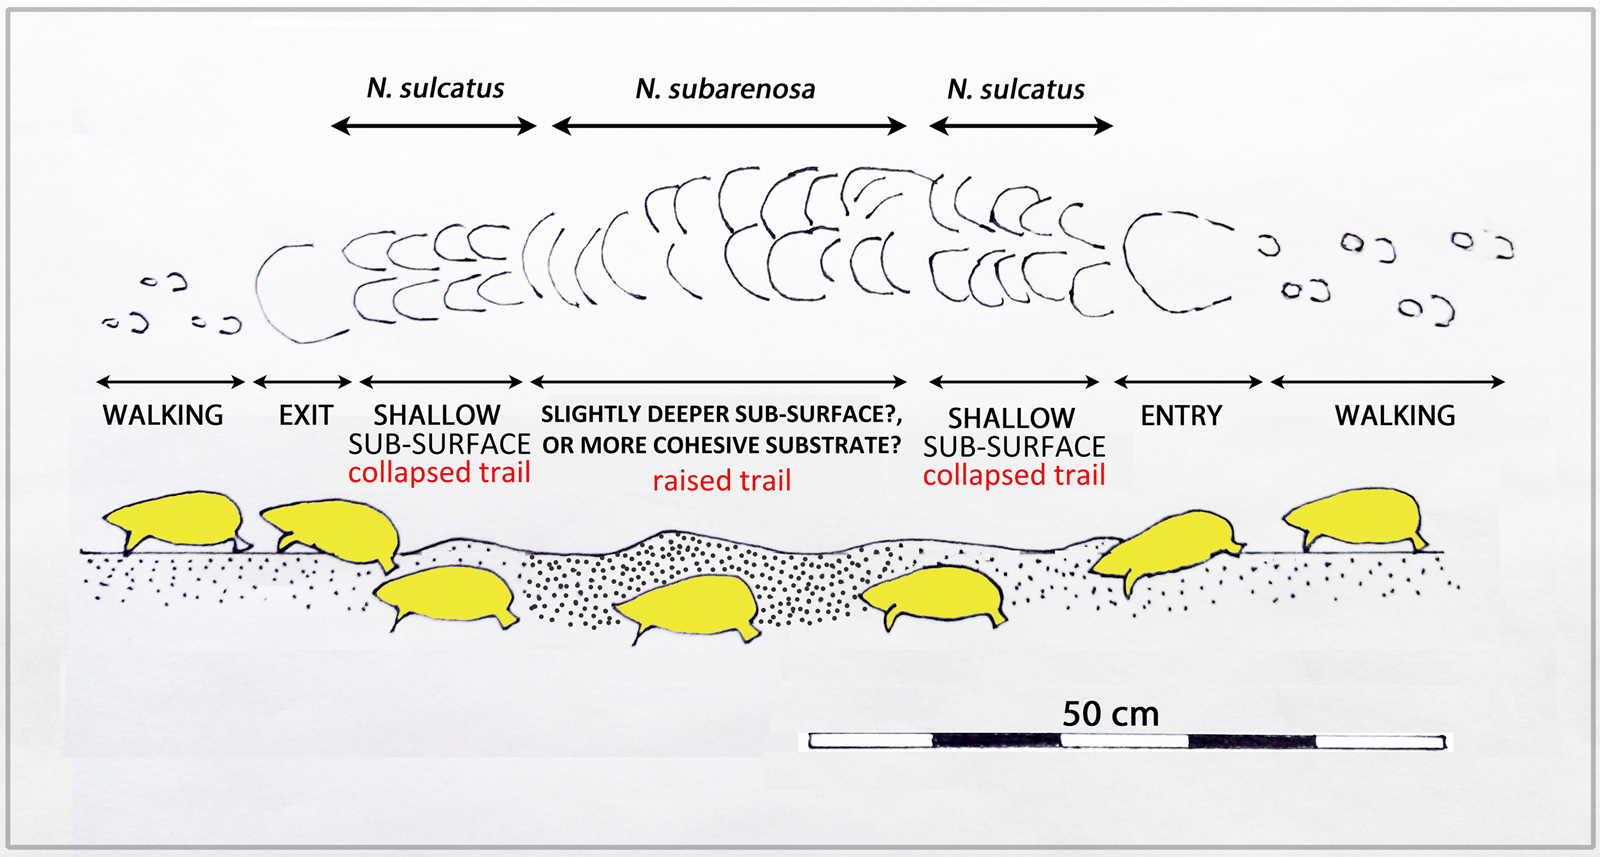
Martin (Reference Martin2013, pp. 416–417) states that “in terms of behavior mole burrows can be interpreted on the basis of depth. Shallower tunnels, easily seen as prominent 10–15 cm wide linear to meandering ridges on the surface, are the results of hunting for food. . . . In contrast, deeper more permanent burrow systems 15–50 cm below the surface . . . are used for dwelling.” Martin (Reference Martin2013, p. 418) continues: “Near the surface moles do not actively back fill their burrows, but instead push excavated sediment upward to the surface.” These observations, although not made in reference to sand-swimmers, or golden moles, are pertinent to distinguishing between the architecture (morphology) of shallower trails and deeper burrows described here. As shown in Figure 11 and Figure 12, when a sand-swimming golden mole is travelling just below the surface it pushes up the sand surface as it moves forward. This motion is expressed in a series of anteriorly and upwardly convex sand waves where each new bow wave emerges from just below the formerly created wave, to leave an elongated ridge with transverse en échelon spreite.
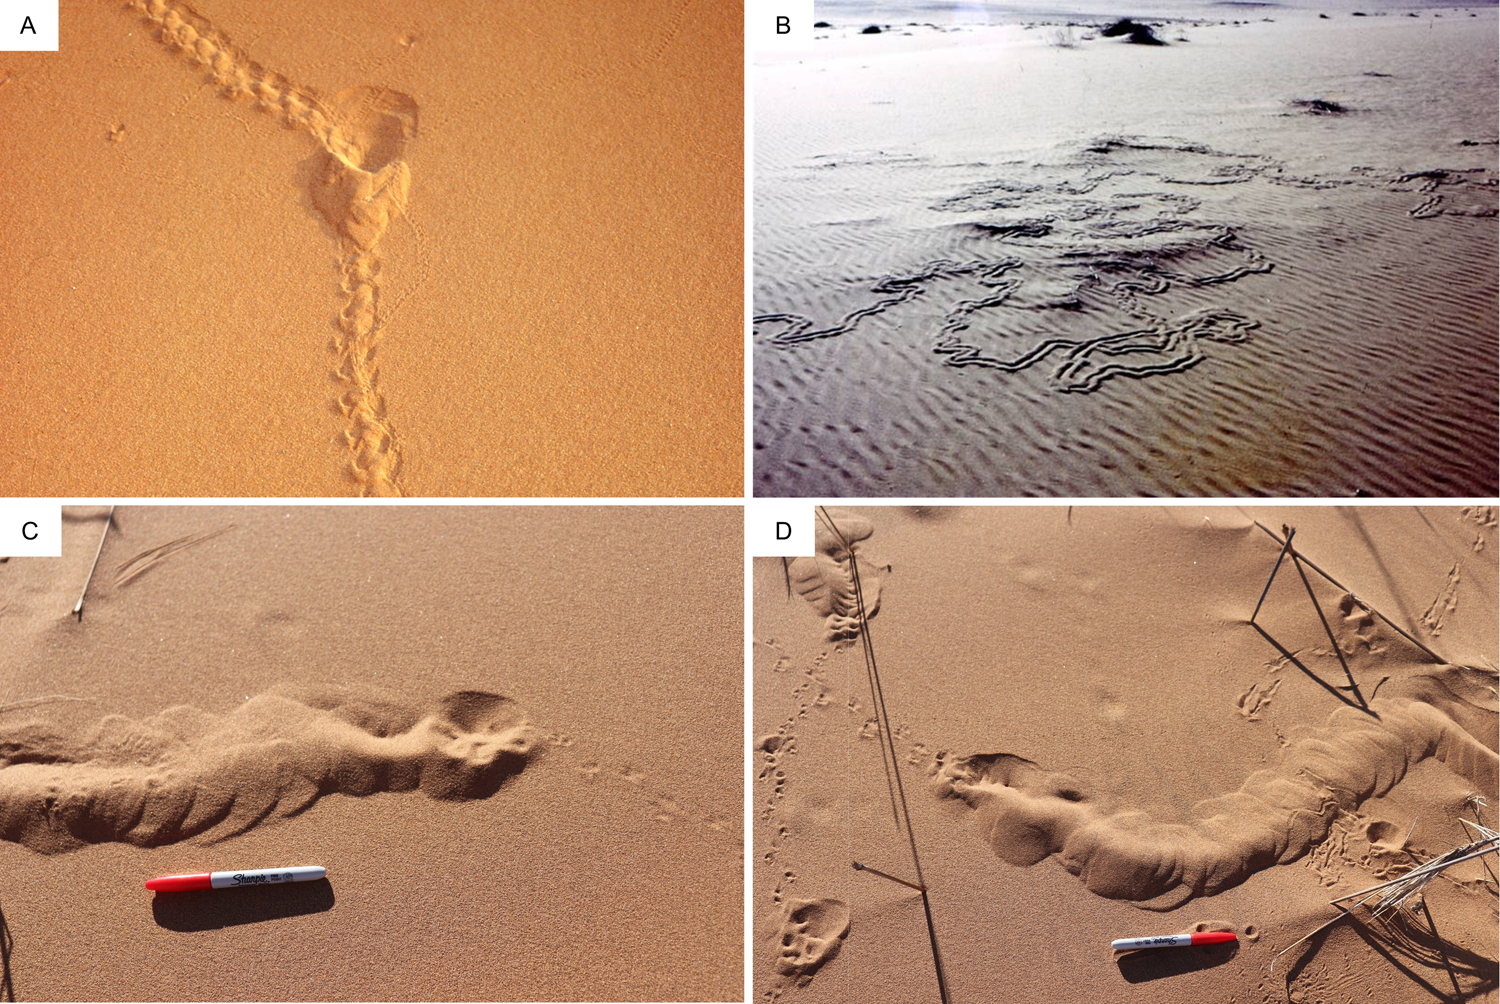
(color online) (A) Surface trackway of E. granti, interrupted by a ‘dip’ causing a widened area, with a change in direction and a short sand-swimming section (reproduced with permission from Chris & Mathilde Stuart, www.StuartOnNature.com). (B) E. granti sand-swimming traces with central sulcus, showing area-concentrated searching (reproduced with permission from Laura Fielden). (C) and (D) show E. granti sand-swimming trails with transition to and from surface trackways; scale bars = ~14 cm (reproduced with permission from the Gobabeb Research & Training Centre).
(color online) Schematic representation of locomotion above and below the substrate of sand-swimming golden mole. Note the difference between epifaunal tracks when walking and infaunal, shallow collapsed trails (N. sulcatus morphotype) and raised-roofed trails (N. subarenosa morphotype).
While the upper surface of the burrow is being pushed up ‘dorsally’, the mole is arching its body upwards, and may use its digging limbs to scoop out the sand on the ventral, underside of its body. This also might produce a series of spreite-like traces in the sediment associated with the burrow floor. However, in loose sand the burrow does not remain open as the animal passes, and the sand fills in behind it: i.e., as Martin (Reference Martin2013) says, near the surface moles do not actively fill their burrows. We might also surmise that the ventral floor of the burrow would be smoothed out by the forward movement of the animal, leaving little or no trace of the lateral scoops of the digging forelimbs or the webbed hind limbs, even before the sand passing over the burrower's dorsal side falls in to bury the already smoothed-out burrow floor. Thus, it is only when the characteristic surface expression of the mole burrows or trails are preserved that one will be able to identify their diagnostic characteristics. For example, the trace illustrated by Ward (Reference Ward1988; Fig. 10) shows that the successive upwardly slanted and anteriorly-convex sand waves, bulges or crescents arose en échelon from underneath each previously created trace, with a spacing of about 6 waves per 10 cm (~60/m). This is manifestly the expression of the disturbed surface–atmosphere interface. In this sense, what we have been calling a trail is actually not the organism sediment interface but an upward transmission of the forces generated by the activity. In strict ichnological terms this is a transmitted trace, but a transmitted over-trace, not a transmitted under-trace, and not what has been called an over track or over-trace, where a true trace has subsequently been covered or filled (Marty et al., Reference Marty, Strasser and Meyer2009).
In order for this surface to be preserved it must have been buried without destroying its characteristic morphology. The mechanisms that facilitated such preservation are not easily determined without direct evidence of the characteristics of sediment above and below the interface on which the dorsal surface of the burrow was expressed. As noted above, this could be more easily facilitated if the surface developed some measure of cohesion or crust as might result from wetting of the sand surface by dew, sea mist, or spray. The surface would also have to resist deflation or erosion scouring by the energy associated with the next depositional event, perhaps deposition of fine wind-blown sand as suggested by Lockley et al. (Reference Lockley, Cawthra, De Vynck, Helm, McCrea and Nel2019) as a mechanism to bury the trackways of hatchling turtles. Whatever the mechanisms, the examples described here, as well as the one illustrated by Ward (Reference Ward1988; Fig. 10) are proof that some attribute of sediment cohesion within the trail rendered it more resistant to weathering, or susceptible to differential weathering, than the surrounding sediment.
DISCUSSION
Golden mole fossils
Avery (Reference Avery2019) provided a comprehensive list of land mammal fossils from southern Africa, from the Eocene to the Holocene. Representatives of the Chrysochloridae are documented from all the epochs of this time interval. Matthews et al. (Reference Matthews, Marean and Cleghorn2019), in reporting on micromammal remains from archaeological and palaeontological sites on the Cape south coast, spanning a time interval from MIS 9 to MIS 1, noted only indeterminate Chrysochloridae specimens, which had not been identified to the genus or species level.
No body fossils of Eremitalpa are known from the south coast, and the first record of this monospecific genus is of the type specimen of the extant species E. granti from Garies in South Africa's Northern Cape Province (Broom, Reference Broom1907). However, Asher and Avery (Reference Asher and Avery2010), in describing early Pliocene golden mole fossils from Langebaanweg, near the west coast of South Africa, reported two new species. One, which they named Chrysochloris arenosa, exhibited morphology in the distal humerus which resembled that seen in Eremitalpa. Asher and Avery (Reference Asher and Avery2010) suggested that this might represent adaptation to a habitat similar to that of the sand-swimming E. granti.
Prior to the inception of the Cape south coast ichnology project, the only report that we are aware of that described probable golden mole trace fossils is from Ward (Reference Ward1988, pp. 153–155), who, in reporting on Early- to Middle Tertiary sediments from Namibia, noted that “back-filled, burrow-like traces cutting cross eolian stratification in the Tsondab Sandstone Formation resemble trackways left by the golden mole, Eremitalpa sp., that today is endemic to the Namib Desert”. In Figure 10 we reproduce the photograph from Ward (Reference Ward1988) and note that this trace fossil has similar features to those of the N. subarenosa holotype, although it is of lesser width. However, the N. sulcatus trails from Site C are of similar width (~5–6 cm) to the specimen described by Ward (Reference Ward1988).
The six burrow trace sites
The six non-sand-swimming burrow trace sites (i-vi) are suggestive of golden mole burrows, but are there plausible alternatives to such features? Stuart and Stuart (Reference Stuart and Stuart2019) review extant southern African burrow makers, which in addition to golden moles include mole rats (Bathyergus suillus), mongoose species (Herpestidae), suricates (Suricata suricatta), ground squirrels (Xerus inauris), warthogs (Phacochoerus africanus), aardvark (Orycteropus afer) and porcupines (Hystrix africaeaustralis). Of these, only the golden moles produce sub-surface tunnels that resemble the trails at the six sites we describe.
Rhizoliths and root casts also need to be considered. While these structures are typically encountered in palaeosols or heavily bioturbated areas, and are typically vertically oriented and cut across bedding planes, they may also occur on aeolianite surfaces and follow such bedding planes. Roots, like some burrows, may exhibit branching. However, they usually taper over their length, and often visibly alter the appearance of the surrounding rock (Klappa, Reference Klappa1980). We did not observe such changes at any of the sites we describe, and so confidently infer these to be golden mole burrow traces.
Ponomarenko (Reference Ponomarenko, Buchwitz, Falk, Klein, Mertmann, Perl and Wings2019) reported various Pleistocene burrows from Russia (the Borissiak Paleontological Institute reference collection), which he attributed to small mammals including moles (family Talpidae) and various rodents, including blind mole rats (Spalacidae), squirrels (Sciuridae) and rodents in the vole and lemming family (Cricetidae). These burrows, which occur in cross sections in palaeosols and alluvium, and not in dune deposits, vary considerably in morphology, with as many as five morphotypes identified based on size, shape, and orientation (vertical, inclined and surficial). Despite the differences in facies, the Russian traces all represent small Pleistocene mammals that created burrows in size (diameter) ranges of 4.5–12.0 cm, but mostly in the 6.0–8.0 cm range. Ponomarenko (Reference Ponomarenko, Buchwitz, Falk, Klein, Mertmann, Perl and Wings2019, p. 80) concluded that “the most important tools for burrow diagnostics are architecture followed by diameter and sculpture.”
As shown below, it is comparatively easy to demonstrate the difference between horizontal to sub-horizontal (bedding-parallel) trails made by sand-swimming golden moles, and those made by small mammals digging at various angles in soils and alluvium with different sedimentological characteristics (texture and consolidation). Small mammals create distinctive infaunal ichnological signatures, such as burrow wall scratch marks, that can be distinguished from one another and from other infaunal traces and sedimentary features.
Extant golden moles and genus Eremitalpa
Golden moles (order Afrotheria, family Chrysochloridae) are endemic to sub-Saharan Africa (Stuart and Stuart, Reference Stuart and Stuart2014). Bronner and Jenkins (Reference Bronner, Jenkins, Wilson and Reeder2005) identified and listed 21 species, of which 18 occur in southern Africa. Many species have such extremely restricted distribution ranges that they are known from only a single locality or single specimen (Stuart and Stuart, Reference Stuart and Stuart2014), and 10 of the 21 species are classified as threatened. Thus, as a family, golden moles display high rates of endemism. The relatively widespread ‘species’ Amblysomus hottentotus may in fact represent a species complex, containing distinct cryptic species that may be vulnerable (Mynhardt et al., Reference Mynhardt, Maree, Pelser, Bennett, Bronner, Wilson and Bloomer2015).
Eremitalpa, known as the desert-dwelling mole or Namib mole (Perrin and Fielden, Reference Perrin and Fielden1999), is a monospecific genus, with two subspecies (Meester et al., Reference Meester, Rautenbach, Dippenaar and Baker1986). E. granti granti inhabits the west coast of South Africa, from near St. Helena Bay in the south to north of Port Nolloth in the north, while E. granti namibensis is restricted to the Namib Desert in Namibia, south of the Kuiseb River (Perrin and Fielden, Reference Perrin and Fielden1999). The Orange River was a geographical barrier that led to the isolation of the two sub-species (Maree and Bronner, Reference Maree, Bronner, Child, Roxburgh, Do Linh San, Raimondo and Davies-Mostert2016). Both sub-species are restricted to sandy dune habitats. They may represent cryptic species (Maree and Bronner, Reference Maree, Bronner, Child, Roxburgh, Do Linh San, Raimondo and Davies-Mostert2016).
Multiple adaptations to an existence in sand and locomotion through sand have been described (Perrin and Fielden, Reference Perrin and Fielden1999). Although totally blind, E. granti has developed a search pattern that is effective in encountering patches of high prey availability. It is the smallest of the golden moles, and has short, medially-located limbs with long, broad, ventrally-hollowed foreclaws for burrowing in loose sand (Smithers, Reference Smithers1983). Termites form the favoured prey (Fielden et al., Reference Fielden, Perrin and Hickman1990), and the enormous epitympanic recess and large malleus are particularly sensitive to vibrations (Nolte, Reference Nolte1968) and are used in locating its prey (Fielden, Reference Fielden1989).
Sand-swimming species and trail morphology
The Namib mole (E. granti) is a surface forager, and hunts prey at night. Unlike other golden moles, Eremitalpa does not inhabit or create a system of burrows (Fielden et al., Reference Fielden, Hickman and Perrin1992). Fielden (Reference Fielden1989) and Perrin and Fielden (Reference Perrin and Fielden1999) described the distinctive form of locomotion employed by E. granti known as sand-swimming as shallow sub-surface movement (i.e., at a shallower level than any of the sub-surface tunnels and burrows of other golden mole species). Locomotion involves “lateral rather than dorso-ventricular articulation with the forelimbs providing most propulsion” (Perrin and Fielden, Reference Perrin and Fielden1999, p. 3). This form of locomotion alternates with surface locomotion (Fig. 11A) (Fielden et al., Reference Fielden, Hickman and Perrin1992). E. granti sand-swimming traces are typically found in three situations: a) for 1–2 m at the beginning or end of the surface tracks where the mole had either entered or emerged from its daytime refuge, b) around the bases of plants, and c) in areas of open sand where a termite concentration had been encountered (Fielden, Reference Fielden1989).
E. granti sand-swimming traces may extend for 20 to 50 m (Fielden, Reference Fielden1989). Surface trackways may be interrupted by dips which create areas of widening, sometimes associated with directional changes (Fig. 11A). Dips typically represent the act of stopping to listen for prey, especially termites (Fielden, Reference Fielden1989). The area of widening observed at Site A (Fig. 4), cannot reliably be attributed to this kind of dip, as it is not associated with a surface trackway.
During sand-swimming activity, the animal's locomotion creates raised areas (convex epirelief) with well-preserved, anteriorly-convex margins. Depending on substrate consistency, the midline portion of the trail may collapse behind the trackmaker, leaving a linear sulcus (concave epirelief, Fig. 11B), hence our use of the term sulcatus to describe the similar ichnospecies morphotype. Alternatively, where not collapsed, and preserved in convex epirelief (Figs. 11C and 11D), the N. subarenosa morphotype is preserved. If the sand substrate is not cohesive, the entire trail may collapse and be preserved in concave epirelief (Fig. 11B). Figure 12 offers a schematic representation of the variation recognized between epifaunal walking trails, entry points into the substrate, collapsed trails (N. sulcatus morhotype), trails with a raised roof (N. subarenosa morphotype), and exit points.
We have noted Cape south coast non-Eremitalpa golden mole trail transitions from surface travel to typical sub-surface burrowing, where a short segment (less than 20 cm) resembles sand-swimming traces. In such cases, caution should be exercised before attributing such transitional traces to sand-swimming by Eremitalpa.
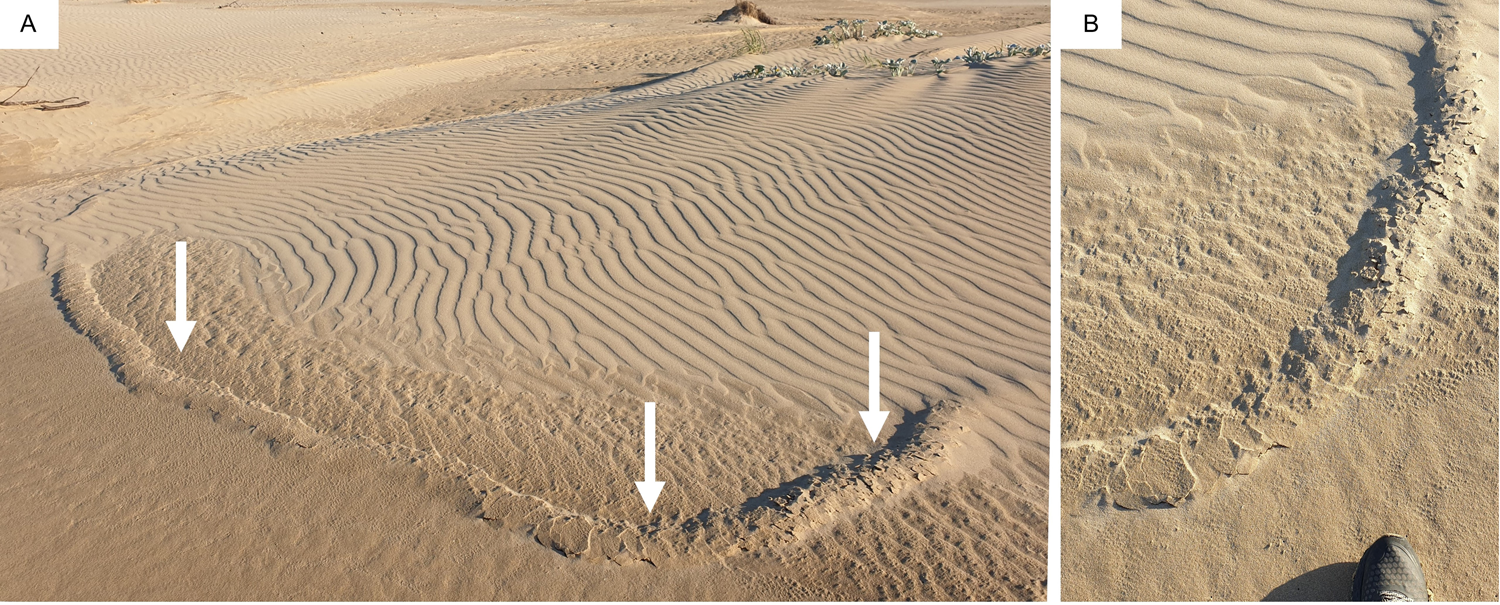
Golden mole species that usually create deeper burrows may briefly burrow slightly closer to the surface and create predominantly transverse cracks (Fig. 13). These are distinct from the randomly orientated crack features found on the domed surface of such burrow traces, and likely represent variation in burrowing behaviour or sediment consistency.
(color online) (A) Golden mole burrow trace in sand on Cape southeast coast at St. Francis Bay. Cracks are either absent (left arrow) or transversely orientated (middle arrow) or randomly orientated (right arrow). (B) Detail view of transversely orientated cracks.
The trails at Sites A and B exhibit a diameter range from 8–12 cm, wider than expected from a sand-swimming trackmaker like E. granti. A large Eremitalpa species, now extinct, may have inhabited the Pleistocene dune fields of what is now the Cape south coast. However, the trails at Site C have a diameter of 5–7 cm, similar to the E. granti trails and the fossil trail from Namibia described by Ward (Reference Ward1988).
Convergent adaptation to similar dune conditions is possible, and sand-swimming locomotion by other fossorial mammal species (or even reptiles) cannot be fully excluded. However, with the exception of the brief transition phases described above, there is no current evidence for this form of locomotion in any genus other than Eremitalpa.
It is necessary to differentiate sand-swimming trail morphology from other trails found in the same deposits. For example, Lockley et al. (Reference Lockley, Cawthra, De Vynck, Helm, McCrea and Nel2019) reported the first-known fossil hatchling turtle tracks close to the present study areas.
Potentially, sand-swimming traces could be confused with hatchling turtle tracks. For example, the paddle impressions made in concave epirelief by hatchling turtles resemble the sequence of crescentic bulge traces of sand-swimmers if they are preserved in convex hyporelief on a natural cast surface. However, once a turtle has left the sub-surface nest its trackway is purely epifaunal, whereas sand-swimmer trails are characteristically infaunal or semi-infaunal. From a preservational viewpoint, hatchling turtle trackways may represent progression over sediment of different moisture content from that traversed by sand swimmers. Additionally, ichnologists must consider how the epifaunal trails are subsequently buried, possibly by wind-blown sand with different textural properties from the trackway-bearing surface (Lockley Reference Lockley, Cawthra, De Vynck, Helm, McCrea and Nel2019). As noted above, the convex epirelief of N. subarenosa trails could also be buried by wind-blown sediment-carrying winds insufficiently powerful to deflate the traces.
Furthermore, in hatchling turtle trackways, the plastron may be elevated off the sand surface, leaving no median trace, or it may make contact with the surface. In the former case, the median area is more raised relative to the tracks formed by the paddle impressions. The sand-swimming trail N. sulcatus is differently divided into a median low epirelief sulcus, and two lateral, higher epirelief portions. N. sulcatus morphotypes must be viewed the ‘right way up’ so as not to be confused with a hatchling turtle trackways, and vice versa. The equivocal site in Garden Route National Park (Fig. 9) represents a case where such confusion could arise. The habitat for such turtle tracks, on relatively level areas above the high tide mark, is used also by golden moles. Martin (Reference Martin2013) described long American mole (Scalopus aquaticus) burrows extending shoreward as far as the high-water mark, and we frequently encounter golden mole burrows just above the high-water mark in our neoichnological studies on the Cape south coast.
When tracks are preserved in situ, rather than on loose blocks and slabs, determining the ‘way up’ of burrows and trails is easy. Larger track-bearing surfaces may allow distinguishing patterns to emerge–for example, parallel trackways heading in a seaward direction suggest hatchling turtles as trackmakers (Lockley et al., Reference Lockley, Cawthra, De Vynck, Helm, McCrea and Nel2019). A symmetrical (rather than alternating) gait pattern suggests a leatherback turtle (Dermatochelys) trackmaker (Lockley et al., Reference Lockley, Cawthra, De Vynck, Helm, McCrea and Nel2019). Additionally, the regularity of the pattern is greater than in mole traces, as might be expected for a trackmaker that could move its limbs freely, not hampered by plowing through the medium of a viscous substrate. The sand-swimming trails described here also show occasional widened areas (Fig. 4), which are not characteristic of hatchling sea turtle trails.
Palaeo-environmental implications
Golden mole burrow traces, made by a genus such as Amblysomus, simply indicate that golden moles burrowed in dune surfaces in the region during the Pleistocene. In contrast, the presence of sand-swimming traces suggests a species that was obliged to use dune surfaces. The only extant trackmakers that can be used to inform such a discussion are E. g. granti and E. g. namibensis. Both subspecies inhabit areas characterised by extensive dune fields, which, apparently, are a requirement for this species. This does not necessarily imply the presence of massive contiguous dune fields. In the Sperrgebiet of Namibia, dune fields that are home to E. g. namibensis may be only a few km in east-west extent and 10–20 km in a coast-parallel direction (Ward, J.D., personal communication, 2020). While it is tempting to infer widespread arid paleo-environmental conditions, based on the current distribution of E. granti, extensive dune fields can also be the result of persistent strong winds (Tinley, Reference Tinley1985; Chase and Thomas, Reference Chase and Thomas2007). The presence of tracks of the extinct giant Cape zebra on one of the surfaces containing sand-swimming tracks is of potential significance, as this species is generally characteristic of more arid environments (Klein Reference Klein1980, Churcher Reference Churcher2006): see Orlando et al. (Reference Orlando, Metcalf, Alberdi, Telles-Antunes, Bonjean, Otte and Martin2009) and Faith (Reference Faith2014) for further discussion of the distribution and habitat preferences of extinct and extant zebra species. Site C lies close to the Alexandria dune field, which has a surface area of more than 15,000 ha, and is described as the largest coastal dune field in South Africa.
Why, then, are sand-swimming trails not currently found in, for example, the Alexandria dune field? A possible explanation involves considering a temperature-related analogy with other species that are known from their Pleistocene tracks, but which no longer occur in the region. For example, the southward cooling of habitat currently forms the most significant range-limit determinant for the Nile crocodile (Crocodylus niloticus), due to its ectothermic biology (Helm et al., Reference Helm, Cawthra, Combrink, Helm, Rust, Stear and Van Den Heever2020b). Likewise, for sea turtles (Chelonioidea), the presence of successful breeding (which has been documented through discovery of hatchling trackways) implies a range of sand temperatures of 25–35oC (Lockley et al., Reference Lockley, Cawthra, De Vynck, Helm, McCrea and Nel2019). In both cases, cool temperatures during the glacial phases of the Pleistocene would have made the Cape coast uninhabitable by these species. If the trails we describe were indeed made by Eremitalpa sand-swimmers or close relatives, and not by an unrelated convergently-evolved group, then the thermo-regulatory abilities of Eremitalpa are germane to such considerations.
Eremitalpa is a poor thermo-regulator, controlling body temperature through behaviour rather than physiologically, by being largely nocturnal and by finding an optimal temperature in the thermal gradient in sand (Fielden, Reference Fielden1989). Body temperature can drop to 20oC at night through torpor, which conserves metabolic energy in the energy-poor desert environment (Fielden, Reference Fielden1989). (Sand-swimming is a highly energy-demanding form of locomotion.) Temperatures above 39oC are incompatible with life, and there is a linear correlation between the body temperature of Eremitalpa and sand in the range of 20–30oC (Fielden, Reference Fielden1989). While the Cape south coast is thought to have been a refugium during the harsh glacial phases of the Pleistocene (Marean et al., Reference Marean, Bar-Matthews, Bernatchez, Fisher, Goldberg, Herries and Jacobs2007, Reference Marean, Cawthra, Cowling, Esler, Fisher, Milewski, Potts, Singels, De Vynck, Allsopp, Colville and Verboom2014), the state of torpor implies a period of short duration (e.g., overnight), and the long period of cooling associated with a glacial phase may have had profoundly adverse consequences for a poor thermo-regulator such as Eremitalpa.
In addition to a stable thermal environment, a stable food source is a prerequisite for survival. While an absence of prey species cannot be excluded as a cause for the disappearance of sand-swimming species from the Cape south coast and southeast coast, this appears less likely: termites, the dominant food source for Eremitalpa (Fielden, Reference Fielden1989), are globally successful in many arid zones.
To date, the large numbers of tracksites reported from the Pleistocene of the Cape south coast have revealed an impressive diversity of tetrapods, most of which represent mammals that are easy to identify from trackways at the family level and sometimes the genus level (Helm et al., Reference Helm, Cawthra, Cowling, De Vynck, Lockley, Marean, Thesen and Venter2020a). A few reptile trackways have been documented (Helm et al., Reference Helm, Cawthra, Combrink, Helm, Rust, Stear and Van Den Heever2020b), among which the sea turtle trackways appear to be attributable to known genera (Dermochelys, Caretta), even species (Lockley et al., Reference Lockley, Cawthra, De Vynck, Helm, McCrea and Nel2019). Avian tracks show a diversity of size and morphology, but are not easily attributed to trackmakers at the genus level. However, these all share an ichnological characteristic: they represent epifaunal trackways. The burrows and trails described here represent infaunal activity of golden moles, some of which we can attribute to known genera with some confidence. Given that the examples described here come from multiple sites, and that we have observed other examples in the region, such infaunal traces represent a significant portion of the total ichnofauna. Thus, they represent an important category of traces, which adds to our palaeoecological understanding of the tetrapod fauna of the region.
CONCLUSIONS
The six sites containing golden mole burrow traces represent an important part of the Cape south coast Pleistocene ichnofaunal assemblage. However, their presence is not unexpected, and they do not contribute significantly to a novel palaeo-environmental understanding of the region. In contrast, the presence of sand-swimming traces with two distinct diameters, one of which is larger than that of the extant sand-swimming species on the west coast of South Africa and Namibia, together with the fact that these traces are found at three sites spanning a distance of more than 450 km, is unexpected. They suggest the activities of at least one extinct species, and permit the erection of a new ichnogenus containing two ichnospecies, based strictly on diagnostic trail morphologies. The presence of substantial dune fields on the Cape south coast during the Pleistocene is inferred.
ACKNOWLEDGMENTS
We acknowledge the assistance of Greg Botha, Gary Bronner, Jack Carrigan, Mark Dixon, Laura Fielden, Linda Helm, Gillian Maggs, Eugene Marais and staff of the Gobabeb Training and Research Centre, Adrienne Miller, Roy Miller, Chris Stuart, Mathilde Stuart, and John Ward. We also thank two anonymous reviewers and the editors for their helpful suggestions, which improved the manuscript.


 Open access