





1. Introduction and background
Interlocutors constantly package their own messages, highlighting or backgrounding units in a sentence or direct others to respond by asking questions. The aim of this common ground management (Krifka, Reference Krifka, Féry and Krifka2008) is to fulfill the communicative needs. Different modules of the grammar – syntax, morphology and prosody – are used in isolation or in tandem to optimize this process. Efficient communication occurs when a message is transferred to an interlocutor with an optimum cost-benefit ratio. Levshina (Reference Levshina2022, p. 22) suggests three principles for efficient communication: (i) the principle of positive correlation: more effort and time for high benefits and less for low benefits, (ii) the principle of negative correlation: less effort and time for highly accessible information and more for less accessible information, and (iii) the principle of maximization of accessibility: produce accessible information first, group semantically and syntactically related items together and link referents to minimize processing costs.
The reflections of these principles are observed in all modules of the grammar across different modalities such as spoken and sign languages. For example, given information is non-prominent (Féry & Samek-Lodovici, Reference Féry and Samek-Lodovici2006), and given items are either deleted in syntax or compressed in frequency, duration or intensity in prosody in spoken and sign languages (Breen et al., Reference Breen, Fedorenko, Wagner and Gibson2010; Gürer et al., Reference Gürer, Karabüklü and Çavuşoğlu2025; Stamp et al., Reference Stamp, Dachkovsky, Hel-Or, Cohn and Sandler2024) in line with the principle of positive correlation. On the other hand, subjects are default topic phrases, which is why when they are marked as focused – a less accessible option for subjects – more prosodic cues are employed to signal their focushood (Skopeteas & Fanselow, Reference Skopeteas, Fanselow, Breul and Göbbel2010). This exemplifies the principle of negative correlation. Finally, speakers are expected to produce the highly accessible information first which is followed by new information, in line with the principle of maximization of accessibility. Hence, cross-linguistically, the subject, which generally denotes accessible information, is more likely to precede the object, which generally denotes new information. As the examples above illustrate, spoken and sign languages show the same tendencies, although they are representatives of different modalities.
This study takes a step further by including the whistled modality in the testing ground to investigate how it conveys information through prosody, focusing on Whistled Turkish (WT)Footnote 1 as practiced in Giresun’s Çanakçı district in the Black Sea Region.Footnote 2 Whistled languages, common in mountainous or forested areas, are acoustically reduced modalities that allow long-distance communication. In contrast to speech modes, such as whispering and shouting, due to the considerable reduction in acoustic detail, whistling is not intelligible to untrained native speakers, but it remains intelligible to trained whistlers. This is because WT retains key features of Spoken Turkish (ST), enabling effective communication over long distances without limiting the message to a fixed set of phrases, as any sentence can be whistled in WT.
We investigate the trade-offs that emerge in the prosodic module when an efficient communicative system of a spoken language is constrained by the limited sources of the whistled modality, with the goal of conveying the message effectively over long distances without a breakdown in communication. In spoken and sign languages, prosody is functionally loaded, conveying information by encoding lexical or morphological meaning, syntactic groupings and boundaries, and information packaging. How these functions are performed in the reduced acoustic system of the whistled modality remains largely unexplored. The aim is to reveal whether and how the prosody used in polar questions and focus constructions in full-fledged ST is transposed into WT. If focus prominence and clause typing, that is, polar questions, are indispensable to the grammar, the reduced acoustic system of the whistled modality is expected to develop alternative strategies to encode these functions. The experimental results show that, similar to ST, polar questions feature higher frequency on the constituent immediately preceding the question particle in WT. However, a modality-specific constraint exists, and frequency modulations resulting from vowel-consonant transitions may obscure this prosodic effect. In focus constructions, unlike in ST, frequency modulation in WT marked only the immediate preverbal position, which functions as the default focus position. Although the immediate preverbal position functions as a syntactic cue to focus, frequency modulation is nevertheless suggested to be employed for its high communicative benefit.
The paper is organized in the following way: Section 2 discusses the classification and the grammar system of whistled languages. Section 3 illustrates the details of the current study. Section 4 shows the study’s results, which are discussed in detail in Section 5. Section 6 concludes the paper.
1.1. The acoustic system of whistled languages
Whistled modalities depend on the grammar system of spoken languages, which may come in two varieties: tonal and non-tonal languages. In tonal spoken languages, pitch patterns convey lexical or grammatical meaning.Footnote 3 For instance, Ladefoged and Johnson (Reference Ladefoged and Johnson2011) show that in Shona, a Bantu language of Zimbabwe, a sequence of high tones after a low tone (1a) differs in meaning from a sequence of low tones (1b).Footnote 4 Whistled languages based on tonal languages preserve these pitch patterns by transposing the fundamental frequency (F0) of the spoken language (Busnel & Classe, Reference Busnel and Classe1976; Meyer, Reference Meyer, Trouvain and Barry2007, Reference Meyer2015; Rialland, Reference Rialland2005).
(1)
a.
[kùtʃérá]
‘to draw water’
b.
[kùtʃèrà]
‘to dig’
(Ladefoged & Johnson, Reference Ladefoged and Johnson2011, p. 255)
As for a spoken non-tonal language, pitch variation does not express lexical or grammatical functions but has other significant roles, such as signaling the phrasal structure and information packaging of the utterances (Gussenhoven, Reference Gussenhoven2004; Ladefoged & Johnson, Reference Ladefoged and Johnson2011).Footnote 5 For example, ST contrasts the prosodic contour of declarative sentences with that of polar questions, where polar questions are marked with a distinctive H*L contour accompanying the unit that precedes the question particle (Göksel, Kelepir & Üntak-Tarhan Reference Göksel, Kelepir, Üntak-Tarhan, Grijzenhout and Kabak2009). ST focus constructions have distinct prosodic contours, marked by pitch increase and/or post-focal pitch compression (Gürer, Reference Gürer2020; İpek, Reference İpek, Lee and Zee2011; İvoşeviç & Bekâr, Reference İvoşeviç, Bekâr, Zeyrek, Sağın Şimşek, Ataş and Rehbein2015). Lexical differences, on the other hand, are encoded through the segmental features of vowels and consonants. That is why, although pitch patterns have significant functions in non-tonal languages too, a whistled modality of a non-tonal language transposes primarily segmental features of vowels and consonants (Busnel & Classe, Reference Busnel and Classe1976; Meyer, Reference Meyer, Trouvain and Barry2007, Reference Meyer2015).
As WT is based on ST, a non-tonal language, we first introduce the basics of the acoustic structure of spoken non-tonal languages and how this structure is transposed in the whistled modality. In spoken modality, the acoustic structure of vowels comprises two components: fundamental frequency (F0) and resonating frequencies (F1, F2, F3 …). In addition to vocal fold vibration, the vocal tract functions as a filter, shaping the available resonating spaces to produce different frequencies in the airflow. These resonating frequencies in the vocal tract are the formants, providing vowels with distinctive qualities, for example, distinguishing vowels such as [i] vs. [u]. The first formant (F1) is based on the resonating cavity in the back of the vocal tract, and the second (F2) and the higher formants result from resonating frequencies in the front part of the vocal tract, contributing distinctive qualities to vowels.
Fundamental and resonant frequencies also characterize sonorant consonants, including glides and liquids. As for obstruent consonants, the components providing characteristic segmental information include the following: (i) phonation: whether there is vocal fold vibration or not; (ii) nasality: whether the velum is lowered to allow airflow through the nasal cavity; (iii) place of articulation: where the articulators obstruct the airflow and (iv) manner of articulation: the degree and type of airflow obstruction. The noise burst and fricativization of plosives and fricatives, respectively, do shape not only the frequency spectrum of the aperiodic noise but also the formant frequencies, especially the second formant, of neighboring vowels. These factors also contribute to the distinguishing features of obstruents. For example, in contrast to labial and velar obstruents, coronals have a smaller front cavity for noise burst and fricativization. This difference results in a higher locus frequency for coronals, which, in turn, shapes the adjacent vowel’s formants at the transition point to form a rising frequency trend.
The wide spectrum of segmental features of spoken languages – fundamental frequency, formant frequencies, phonation, nasality, place and manner of articulation – is all reduced to a narrow band of frequency in the whistled modality, and key segmental information is conveyed via modulations in frequency and amplitude. As a result of this reduction, certain key features in the spoken modality are no longer distinctive in the whistled modality, and overlaps occur among categories. For vowels, the whistled modality undergoes the following articulatory constraints. First, unlike the spoken modality, the vocal folds do not vibrate in whistled speech (Meyer, Reference Meyer2015, p. 73). This reduction benefits the whistlers because the whistling practice does not tire out their vocal folds. Meyer (Reference Meyer2015, p. 108) further notes that the fundamental frequency of the whistled speech is the same as the resonating frequency. Hence, the dual channels of the acoustic structure in the spoken modality are reduced in the whistled modality, and the perceived pitch is suggested to map primarily to the second formant in spoken modality.Footnote 6 In this study, we use the term frequency to refer to the acoustically measured narrow frequency band carrying segmental information in the whistled modality, acknowledging that its source is not vocal fold vibration.Footnote 7
Whistled speech is still intelligible to whistlers because each vowel is whistled at a distinct frequency interval. Although there may be some overlap among certain vowels, these frequency intervals provide each vowel with its characteristic acoustic properties. As for consonants, whistlers approximate the articulatory properties of the spoken modality through the movements of the tongue, jaw and fingers that modify the oral cavity, thereby conveying segmental information about the consonants (Busnel & Classe, Reference Busnel and Classe1976; Meyer, Reference Meyer2015; Rialland, Reference Rialland2005). However, articulatory constraints are observed, which in turn neutralize certain distinctive features of the spoken modality. For example, phonation cannot be encoded through vocal fold vibration; the velum does not lower completely to allow airflow through the nasal cavity for [n], which is in turn realized with slight lowering of the velum (Meyer, Reference Meyer, Trouvain and Barry2007). Despite these limitations, consonants are emulated through modulations of frequency and amplitude. Plosives are characterized by silent gaps corresponding to the closure, whereas the turbulence of fricatives in the spoken modality is not conveyed in the whistled modality. Instead fricatives are also realized with silent gaps or intensity dips. As in the spoken modality, frequency modulations from consonant-vowel transitions provide important cues for sound identification, particularly for obstruents, which are discontinuous in frequency. For example, the whistled plosive consonants [p] and [t] are produced by restricting the airflow, which results in a brief silent interval. Being a coronal sound [t] is associated with a high-frequency locus, whereas labial and velar sounds are associated with a low-frequency locus. Each consonant modulates the frequency of the neighboring vowels accordingly and can be differentiated from one another based on these modulations.
Despite all the limitations in the acoustic structure, the whistled modality compensates for these deficits by transposing the component (i.e., pitch or segmental cues) whose transposition would contribute the most to intelligibility. As mentioned earlier, which component will undergo this transposition depends on the classification of the spoken language: tonal or non-tonal.Footnote 8 This distinction arises because tonal languages rely on pitch variation for lexical information, while non-tonal languages use segmental cues for the same purpose. This ensures intelligibility of the reduced signal by focusing on the most expressive element of the grammar. According to this classification, WT is a non-tonal whistled language, emulating segmental cues through whistles. However, this classification leaves the role of pitch variation at the phrase level uncertain, as the lexical information load is on segmental cues. While pitch variation provides limited benefit in conveying lexical information, it still plays a major role in the prosodic system and is expected to be marked in WT.Footnote 9 The next section presents how prosody is transposed in non-tonal whistled languages based on the existing literature.
1.1.1. Transposition of prosody in non-tonal whistled languages
There are a few observations and a single systematic study on how prosody is emulated in non-tonal whistled languages. Busnel and Classe (Reference Busnel and Classe1976, p. 76) suggest that ‘All in all, prosodic features tend to have limited significance in the articulated whistled languages we have examined’. However, they also indicate that emulation of intonation is observed when statements are compared to interrogatives in Spanish-based whistled speech Silbo. Questions with or without a wh-phrase in Spanish differ from statements in that they end with a rising intonation. Rising intonation is emulated with prolongation and slow rise with final vowels in Silbo (Busnel and Classe Reference Busnel and Classe1976, p. 76).
For WT, Meyer (Reference Meyer2005, p. 119) notes a similar observation for polar questions based on six sentences, as in (2). In ST polar questions, the particle -mI can follow any constituent. In (2), the question particle follows the nominal predicate and the vowel in the predicate bears the highest pitch in ST. In WT, Meyer (Reference Meyer2005, p. 119) observed that, with one exception, the [a] vowel in the word var has a frequency value among the highest for this vowel.
(2)
Kalem-in
Var
mı?
pen-2SG.POSS
exist
QP
‘Do you have a pen?’
In a recent experimental study, Ridouane and Meyer (Reference Ridouane and Meyer2024) found that prosody is transposed in Whistled Tashlhiyt, too. In spoken Tashlhiyt, the highest pitch is on the final syllable of the verbal root if there is a full vowel in polar questions. If the final syllable is composed of consonants, a reduced vowel is inserted, and a high pitch appears on that vowel, or the high pitch maps onto the first syllable with a full vowel. In Whistled Tashlhiyt, question intonation is emulated via higher frequency, but a strict strategy is adopted with respect to the vowel in the final syllable of the verbal root. The high-frequency values map onto the final syllable in the presence of a vowel, and a vocal-like element is always used in the absence of a full vowel. Additionally, this vowel’s duration is reported to be longer than that of its counterpart in a statement.
It is a well-established fact that whistled languages based on non-tonal languages transpose segmental cues. The studies discussed above further indicate that suprasegmental features, such as frequency or duration, are also emulated in these languages to reflect the prosody of the base language. The next section discusses the details of the current study.
2. The present study
This paper aims to explore how ST intonation in polar questions and focus constructions is transposed into the whistled modality through a systematic experimental study. The focus is on the prosody of polar questions and focus constructions in the whistled modality for the following reasons: (i) polar questions differ from declaratives in that they feature pitch compression before the question particle, a high accent on the constituent preceding the particle and a final low tone (Göksel et al., Reference Göksel, Kelepir, Üntak-Tarhan, Grijzenhout and Kabak2009), meaning pitch variation, which lacks lexical or grammatical function in ST, plays a role in clause typing at the phrase level; (ii) focus constructions exhibit pitch increase and/or post-focal pitch compression (Atasoy, Reference Atasoy2022; Gürer, Reference Gürer2020; İpek, Reference İpek, Lee and Zee2011; İvoşeviç & Bekâr, Reference İvoşeviç, Bekâr, Zeyrek, Sağın Şimşek, Ataş and Rehbein2015); (iii) in polar questions, a focused unit can be compared to its non-focused variants in another polar question, and this is also the case for declarative focus clauses. As a focused unit in a question is not compared to a non-focused variant in a declarative clause, the clause type as a variable can be kept constant.
As discussed in Section 2, except for the study of Ridouane and Meyer (Reference Ridouane and Meyer2024) on Whistled Tashlhiyt, the transposition of pitch variation in non-tonal whistled languages is based on observations. As the current study is built on an experiment to investigate WT’s acoustic structure, it will significantly contribute to the prosodic investigation of non-tonal whistled languages. Additionally, the results of the investigation will have implications for trade-offs for efficiency in a reduced system of communication. We raise the following questions:
Q1: Is the constituent (subject, object, verb) that precedes the question particle -mI in STFootnote 10 marked by any prosodic cues, that is, frequency, duration or intensity?
Q2: Is the constituent (subject, object, verb) that precedes the question particle -mI in WT marked by any prosodic cues, that is, frequency, duration or intensity?
Q3: Is the focused constituent (subject, object, verb) in ST marked by any prosodic cues, that is, frequency, duration or intensity? Is there a compression effect in the pre-focal and post-focal domains?
Q4: Is the focused constituent (subject, object, verb) in WT marked by any prosodic cues, that is, frequency, duration or intensity? Is there a compression effect in the pre-focal and post-focal domains?
3. Methods
3.1. Design and stimuli
3.1.1. Focus constructions
Focus encodes the presence of a set of alternatives (Rooth, Reference Rooth1992). Narrow focus, which includes presentational focus (PF) and contrastive focus (CF), is elicited through wh-questions and alternative questions, as shown in (3) and (4), respectively. A single alternative is selected to replace the wh-phrase or the alternatives in the question in contrast to the other members given in curly braces. That is why the focused unit is suggested to be the most prominent and highlighted building block of information structure, and it is chosen as the correct answer in contrast to the other members. The units preceding or following the focused phrase are non-focused and given in that they are salient and highly accessible from the context.
(3)
Speaker A
Kim
odun-lar-ı
kır-ıyor?
who
wood-PL-ACC
break-IMPF
Literal translation: ‘Who is breaking the wood?’
Speaker B
[Serdar]PF
odun-lar-ı
kır-ıyor.
Serdar
wood-PL-ACC
break-IMPF
Literal translation: ‘Serdar is breaking the wood’.
{Serdar is breaking the wood; Ahmet is breaking the wood…}
(4)
Speaker A
Serdar
odun-lar-ı
mı
yoksa
fındık-lar-ı
mı
Serdar
wood-PL-ACC
QP
or
hazelnut-PL-ACC
QP
kır-ıyor?
break-IMPF
Literal translation: ‘Is Serdar breaking the wood or the hazelnuts?’
Speaker B
Serdar
[odun-lar-ı]CF
kır-ıyor.
Serdar
wood-PL-ACC
break-IMPF
Literal translation: ‘Serdar is breaking the wood’.
{Serdar is breaking the wood; Serdar is breaking the hazelnuts…}
In (5), the entire sentence is focused, known as broad focus (BF). The alternatives given in curly braces replace the whole sentence in that focus is not restricted to a single constituent.
(5)
Speaker A
Ne ol-uyor?
what happen-IMPF
‘What is happening?’
Speaker B
[Serdar
odun-lar-ı
kır-ıyor]BF
Serdar
wood-PL-ACC
break-IMPF
Literal translation: ‘Serdar is breaking the wood’.
{Serdar is breaking the wood; Nurten is wiping the car…}
The literature on focus position in ST presents three main views: (i) both PF and CF can appear in situ even if given elements occupy the immediate preverbal position (Göksel & Özsoy, Reference Göksel, Özsoy, Göksel and Kerslake2000); (ii) only CF appears in situ, while PF must occupy the immediate preverbal position (İşsever, Reference İşsever2003); and (iii) both PF and CF occur in the immediate preverbal position (Erguvanlı, Reference Erguvanlı1984). Across all views, the post-verbal position is consistently considered illicit for focus.
Pitch modulation is also prominent in focus marking. Immediate preverbal focused objects show no prosodic difference from their counterparts in BF constructions (Gürer, Reference Gürer2020; İpek, Reference İpek, Lee and Zee2011; İvoşeviç & Bekâr, Reference İvoşeviç, Bekâr, Zeyrek, Sağın Şimşek, Ataş and Rehbein2015), supporting their status as the unmarked focus position with nuclear prominence. In contrast, focused subjects and verbs differ from their BF counterparts in pitch, intensity or duration (İpek, Reference İpek, Lee and Zee2011). That is why focus constructions are the first target constructions in this study to investigate the transposition of prosody in the whistled modality.
Table 1 illustrates how focus in the whistled modality was investigated under seven conditions, including the BF condition. In narrow-focus constructions, focus is on the subject, object or verb. The frequency value, duration and intensity of the vowel in the stressed syllable of the subject, when it bears focus as in (a) and (d) conditions in Table 1, was compared to the same vowel in the non-focused variants. The conditions (b–c) and (e–f) include the non-focused variants of the subject in the same position. In addition, the vowels in the focused variants, (a) and (d) for subject, were also compared with each other and those in the BF condition (g), in the same terms. The exact comparisons were also made for the object and the verb.Footnote 11
Focus conditions

Table 1. Long description
Row g: Broad focus encompasses the entire structure, denoted as [S O V]_BF.
Row f: Subject is S; Object is O; Verb is focused [V_CF].
Row e: Subject is S; Object is focused [O_CF]; Verb is V.
Row d: Subject is focused [S_CF]; Object is O; Verb is V.
Row c: Subject is S; Object is O; Verb is focused [V_PF].
Row b: Subject is S; Object is focused [O_PF]; Verb is V.
Row a: Subject is focused [S_PF]; Object is O; Verb is V.
The conditions are structured as follows:
The table, titled ‘Table 1: Focus conditions’, displays seven rows (a-g) and three columns representing Subject (S), Object (O) and Verb (V) positions. It utilizes square brackets and subscripts to indicate the type of focus applied: Presentational (PF), Contrastive (CF) and Broad Focus (BF).
There were three target sentences, and except for the verbs and one of the objects, all the words were finally stressed.Footnote 12 The non-finally stressed words exhibited penultimate stress. For every target sentence, the subject had two syllables, and the object and the verb had three.
3.1.2. Polar questions
Polar questions, as defined by Göksel et al. (Reference Göksel, Kelepir, Üntak-Tarhan, Grijzenhout and Kabak2009), are response-seeking utterances marked by the question particle -mI , which can follow any constituent. However, a binary yes/no interpretation arises only when -mI follows the verb as in (6c). When it follows a non-verbal element as in (6a) and (6b), it signals a set of alternatives. For this reason, Göksel et al. (Reference Göksel, Kelepir, Üntak-Tarhan, Grijzenhout and Kabak2009) describe -mI as a focus particle rather than a true question word, while Atlamaz (Reference Atlamaz2023) interprets such cases as narrow-focus constructions. In this study, since the constituent preceding the particle evokes alternatives, we refer to these as focused variants.
The six target sentences included subject, object and verb conditions, as shown in (6). For every target sentence, the subject had two syllables, and the object and the verb had three and all had stress on the final syllable. Two target sentences followed a subject-direct object-indirect object-verb order, while the others followed a subject-object-verb order. Frequency, duration and intensity were measured on the final-syllable vowel of the focused subject when followed by a question particle (6a) and compared to its non-focused versions in (6b) and (6c). The non-focused variants are further referred to as pre-focal and post-focal. For instance, the subject is focal in (6a) but pre-focal in (6b) when the object is focused. Similar comparisons were made for the final-syllable vowel of focused objects and verbs when followed by the particle, with non-focused counterparts lacking immediate particle adjacency. Each focused unit was compared to its non-focused variants within the same clause type.
(6)
a.
Tarık
mı
fındık-lar-ı
topla-mış?
Tarık
QP
hazelnut-PL-ACC
pick-PERF
‘Did Tarık (or someone else) pick the hazelnuts?’
b.
Tarık
fındık-lar-ı
mı
topla-mış?
Tarık
hazelnut-PL-ACC
QP
pick-PERF
‘Did Tarık pick the hazelnuts (or something else)?’
c.
Tarık
fındık-lar-ı
topla-mış
mı?
Tarık
hazelnut-PL-ACC
pick-PERF
QP
‘Did Tarık pick the hazelnuts (or not)?’
Since whistling could induce fatigue, the target sentences included 18 polar questions (6 items × 3 conditions) and 21 focus constructions (3 items × 7 conditions).
We collected the same stimuli for ST polar questions and focus constructions from the whistlers for a direct comparison of ST and WT.
3.2. Participants and methodology
Four fluent male whistlers, aged 21–47 at the time of the study, participated in this research. All participants were residents of Kuşköy village. Following Meyer’s (Reference Meyer2015, p. 57) classification, three participants were traditional whistlers, having acquired the whistled modality in traditional contexts. The youngest participant was a late whistler, having learned whistling through formal practice at school. All participants reported using whistling in their daily activities. They signed a consent form and received a small compensation for their participation.
Participants were randomly paired to perform written dialogues in both ST and WT displayed on a computer screen. One participant asked the questions while the other responded, then they switched roles, with the former questioners answering the same questions in a new random order. For ST, participants sat across from each other at a table with a computer in front of them. For WT, they were positioned 25 meters apart to reflect natural whistling conditions, with each whistling the dialogue lines from the screen. The ST dialogues were performed first, followed by WT after a short break. All whistlers used a two-finger technique to produce the whistle. All recordings used the same equipment.
3.3. Measurement points and the parsing system
After extracting the target ST and WT sentences, we annotated the sentences. In WT, waveforms and spectrograms were investigated to parse the whistled speech into words, syllables and target segments building on the findings from studies in the literature (Meyer, Reference Meyer, Trouvain and Barry2007, Reference Meyer2015; Rialland, Reference Rialland2005).
As discussed in Section 2, vowels and consonants are characterized by modulations in frequency and amplitude in the whistled modality, as illustrated in Figures 1 and 2. In the frequency domain, vowels are reported to exhibit relatively stable frequency bands: Rialland (Reference Rialland2005) describes three quasi-stable bands from high to low, while Meyer (Reference Meyer, Trouvain and Barry2007, Reference Meyer2015) details a decreasing hierarchy of mean frequencies with some overlap among vowels in the following way: [i], [ʏ] [ɨ], [e] [œ] [ʊ], [o] [a]. Consonants, in contrast, display rapid and variable frequency movements. Rialland (Reference Rialland2005) identifies four major frequency bands, and Meyer (Reference Meyer, Trouvain and Barry2007) reports five distinct frequency shapes in intervocalic position. The locus of frequencies is ranked from highest to lowest in the following order: coronals, velars and labials. For amplitude, vowels have higher and more sustained energy. Consonants show more complex and abrupt amplitude patterns: voiceless plosives, fricatives and affricates feature sharp onsets and offsets; approximants and voiced fricatives show continuous amplitude with dips; and nasals and voiced plosives have gradual amplitude decay.
The boundaries of a target polar question in WT (frequency range: 50–11,000 Hz).

Figure 1a. Long description
At the top is the sound waveform. The middle section displays a spectrogram with a frequency range up to 11,000 Hz, revealing multiple distinct, parallel frequency bands which are whole-number multiples of the fundamental frequency. Below the spectrogram is a TextGrid with four annotated tiers aligned with the acoustic signal: tier 1 shows words (Zeynep, mektup-lar-ı, mı, saklamış); tier 2 shows linguistic glosses (Zeynep, letter-PL-ACC, QP, hide-PERF); tier 3 breaks words into syllables; and tier 4 provides individual speech sounds. The fundamental frequency is visible at the very bottom of the spectrogram.
The boundaries of a target polar question in WT (frequency range: 50–5,000 Hz).

Figure 1b. Long description
The top section shows the waveform. The middle section shows the spectrogram, but the upper frequency limit is reduced to 5,000 Hz. This zoom provides greater visual clarity of the lowest, fundamental frequency contour, which is used for study measurements. The bottom section is a TextGrid containing five tiers: words, linguistic glosses, syllables, individual sounds and an added fifth tier providing the English translation: ‘Did Zeynep hide the letters (or something else)?’
The boundaries of a target focus construction in WT (frequency range: 50–11,000 Hz).

Figure 2a. Long description
The top panel displays the waveform. The middle panel is a spectrogram set to a frequency range of 50–11,000 Hz, illustrating the fundamental frequency trace at the bottom and its higher, whole-number multiple harmonics above it. The bottom panel is a TextGrid with five aligned tiers: words (Nurten, arabayı, siliyor), glosses (Nurten, car-ACC, wipe-IMPF), syllables, individual phonetic sounds and a final tier for the English translation: ‘Nurten is wiping the car’.
The boundaries of a target focus construction in WT (frequency range: 50–5,000 Hz).

Figure 2b. Long description
The top panel displays the sound waveform. The middle panel is a spectrogram set to a frequency range of 50–5,000 Hz, providing a zoomed-in, clearer view of the lowest, fundamental frequency contour used for the study’s acoustic measurements. The bottom panel is a TextGrid with five aligned tiers: words (Nurten, arabayı, siliyor), glosses (Nurten, car-ACC, wipe-IMPF), syllables, individual phonetic sounds and a final tier for the English translation: ‘Nurten is wiping the car’.
Our data set was not designed to examine consonant and vowel frequency and amplitude modulations in controlled phonetic environments, such as word initial, medial and final positions. However, with the exception of the missing [v] and [ʒ], all consonants appeared in a variety of positions, which enabled the following observations with respect to frequency shapes: (i) vowels, liquids [r], [l], glide [j] and fricative [h] appear with a continuous frequency shape, (ii) voiceless plosives, fricatives and affricates show a discontinuous frequency shape but rare exceptions included a continuous shape in intervocalic position for [t] and [s], and (iii) nasals, voiced plosives and fricatives are observed with either continuous or non-continuous frequency shapes. However, certain sounds can show inter and intra-whistler variation in amplitude envelopes and frequency shapes. For example, the [d] sound produced by the same whistler can be realized either with a discontinuous high-frequency shape and decayed amplitude followed by silence or with a continuous high-frequency shape accompanied by a continuous amplitude with a dip.
When obstruents and nasal consonants are realized with non-continuous frequency shapes, they can still be identified based on amplitude envelopes and also how they modulate the frequency of the neighboring vowels which brings us to the final point. Vowels are significantly influenced especially by neighboring obstruents and nasal consonants, as these frequency modulations serve to a large extent to signal the distinguishing characteristic consonants. For example, in Figure 1, the vowels [e, a, ɨ], which appear with various neighboring consonants, can be characterized by different frequency shapes, indicating transitions influenced by the frequency of the neighboring consonants. In Figure 1, the [ɨ] sound before the question particle illustrates a falling transition signaling the low-frequency [m] consonant and the [ɨ] sound before the verb illustrates a rising transition signaling the high-frequency [s] sound. All these parameters were considered while parsing the target sentences into segments, and the sound files were played repeatedly to ensure correct grouping.
The following figures illustrate two sentences from the stimuli based on two different frequency ranges. The setting between 50 and 11,000 Hz shows the higher frequency components, while the one between 50 and 5000 Hz ensures visual clarity. As illustrated in Figures 1a–2a, there are higher frequency components in whistled speech that are whole-number multiples of the lowest frequency component.Footnote 13 The measurements in the current study are taken from the fundamental frequency component that appears at the bottom in the spectrograms.
For the analysis, in the polar question data set, 72 target sentences were expected for both WT and ST (6 sentences × 3 conditions × 4 whistlers). However, nine WT sentences from two whistlers were excluded due to incorrect placement or repetition of the question particle, and one verb measurement was removed due to the occurrence of a different tense/aspect marker. In ST, four sentences from the same two speakers were excluded due to mispronunciations or misplaced question particles. Additionally, three ST verbs were excluded because the respondent’s answer overlapped with the final syllable of the verb in the question. As such, out of the expected 216 measurement points (3 syllables × 72 sentences), 15 were missing in the ST data, and 28 were missing in the WT data.
In the focus data set, 84 sentences (3 target sentences × 7 conditions × 4 whistlers) were expected for both ST and WT. However, unlike standard ST, the Giresun dialect does not permit a focused subject in its base position when followed by a discourse-given object. Of the 24 sentences with subject focus, 16 were instead produced with focus on the object or verb. For instance, Figure 3 shows subject focus with post-focal compression through the utterance, while Figure 4 displays the same sentence with verb focus, indicated by high boundary tones marking the edges of pre-focal domains.
A focus construction in ST with focus on the subject.

Figure 3. Long description
A pitch contour graph titled ‘İK_Nurten_arabayı_siliyor_CF_SUBJ’ plotting pitch (Hz) on the y-axis against time (s) on the x-axis. The graph is vertically divided by dotted lines into three word segments: ‘Nurten’, ‘araba-yı’ and ‘sil-iyor’, accompanied by linguistic glosses and an English translation. The pitch contour begins with a short, low arc hovering around 150 Hz during the initial subject ‘Nurten’. As it crosses into the object ‘araba-yı’, the pitch jumps sharply to its maximum peak of approximately 230 Hz. After hitting this peak, the contour steadily falls throughout the remainder of the object segment. Upon entering the final verb segment, ‘sil-iyor’, the pitch contour flattens out, remaining low and continuing a very gradual decline from roughly 125 Hz down to 100 Hz, visually illustrating the post-focal compression.
A focus construction in ST with focus on the verb instead of the subject.

Figure 4. Long description
A pitch contour graph titled ‘EC_Nurten_arabayı_siliyor_CF_SUBJ’ plotting Pitch (Hz) against Time (s), segmented identically to Figure 3 into ‘Nurten’, ‘araba-yı’ and ‘sil-iyor’. The contour flow in this figure is distinctly different, maintaining a much higher pitch across the pre-focal domains. During the subject ‘Nurten’, the pitch rises steadily from roughly 150 Hz to nearly 180 Hz. Moving into the object segment ‘araba-yı’, the pitch begins high at 230 Hz, dips smoothly to 200 Hz in the middle and then rises back up to a high boundary peak of about 240 Hz precisely at the right edge of the word. Finally, as the contour crosses into the focused verb segment ‘sil-iyor’, it drops steeply and continuously, falling from 200 Hz down to about 100 Hz by the end of the utterance.
We concluded that speakers of this dialect prefer focus to appear in the immediate preverbal position. If the subject is focused, it is preferred that the discourse-given object be either dislocated to the sentence-initial or sentence-final position or elided. Hence, we excluded conditions (a) and (d) in Table 1 from the analysis for both ST and WT. With the two excluded conditions, 60 sentences (3 target sentences × 7 conditions × 4 whistlers) were expected for both ST and WT. Additionally, three sentences were excluded from the analysis of ST due to unnatural intonation patterns, in which focus prominence was not realized on the target constituent but on another constituent. As such, out of the expected 180 measurement points (3 syllables × 60 sentences), 6 were missing in the ST data, and none were missing in the WT data.
As indicated in the research questions, frequency, intensity and duration were selected as our measurement parameters. In total, three sets of measurements were taken for both ST and WT: (i) mean frequency and intensity values from the target vowels, that is, the stressed-syllable vowels of subject, object and verb for statistical analysis, (ii) duration measurements from the target vowels for statistical analysis and (iii) listing of frequency and intensity values of the words for data visualization through contours. For the mean frequency and intensity measurements, the target vowels’ brief intervals at the left and right boundaries were excluded to override variation due to consonant-vowel transitions, which, as discussed earlier, modulates the frequency value of vowels. As for duration, the duration of the whole segment was measured.
We used Praat (5.3.53) (Boersma & Weenink, Reference Boersma and Weenink2025) to extract frequency and intensity values of ST and WT words and vowels manually via ‘get pitch/pitch listing’ and ‘get intensity/intensity listing’ commands in Praat. For ST, the pitch range was set to between 50 and 400 Hz, and it was between 50 and 11,000 Hz for WT. As for duration, we used a script (Pengfei, Reference Pengfei2016) to automatically extract the duration from the TextGrid file given the particular tier using Praat (6.4.27).
3.4. Data analysis
The analysis of the data relied on two tracks the results of which are discussed in detail in Section 4: (i) statistical analysis and (ii) data visualization analysis through MATLAB.
For the statistical analysis, we used R (R Core Team, 2021). We collected frequency, intensity and duration measurements for each annotated stressed-syllable vowel in the target constituents of polar questions and focus constructions. Each measurement was labeled with the participant, experimental item and the syntactic role of the constituent containing the vowel (Subject, Object, Verb). Measurements from the focus construction stimuli were further labeled according to the type of focus (PF, CF or BF). For the polar question stimuli, measurements were labeled based on whether the vowel was located in a focused or non-focused constituent. To distinguish the non-focused variants, we referred to them as pre-focal and post-focal, depending on their linear position relative to the focused constituent. A more detailed description of the coding and analysis of the data is provided in Supplementary Material B for focus constructions, C for polar questions and D for the vowel–consonant modulation (coarticulation) analysis.
We used the Wilcoxon signed-rank test, a non-parametric alternative of the paired t-test, to test for differences between groups. We used a non-parametric test because the small sample size of the compared groups did not allow accurate formal normality test results, and the visualization of the group distributions showed obvious deviations from normality. We used paired tests to account for the fact that in each of the compared groups, a single measurement from the same participant was present, and these came from the same stimuli. However, for the sentence final syllable duration analysis only, discussed in Section 4.3, we used the unpaired, Wilcoxon rank-sum test. This is because when comparing syntactic roles with each other, rather than making comparisons within them, the available focus variants were not the same for all syntactic roles. For example, a verb could only be post-focal, whereas a subject could only be pre-focal. Therefore, pairing the data meaningfully was not possible for the final syllable duration analysis. Hence, an unpaired test was used.
As for the visualization of the frequency and intensity modulations, we used MATLAB R2018b, which enabled us to post-process the extracted frequency and intensity values for the normalized contours. The time axis was warped by fixing the start and end times of each word across the speakers and distributing the sample points evenly within the interval since Praat uses uniform sampling. As a rule, the first word starts at t = 0, each word takes 0.3 s, the silence between successive words takes 0.05 s, and in polar sentences, the question particle takes 0.1 s. For the contours obtained by averaging over the four speakers, the individual contours were first upsampled to the least common multiple of the four (potentially different) sample counts. The upsampling was done by linear interpolation, which also handles the not-a-number (NaN) occurrences. Averaging was done by ignoring all speakers even if only one provides a NaN for a given time point, that is, a NaN value was assumed for the average in those cases. This was done to prevent discontinuity and hence misinterpretation of the average behavior. The next section discusses the details of the analysis.
4. Results
As stated before, the target vowels are located within the stressed syllable of either the subject, object or the verb of the sentences we used in the experiment. Therefore, for ease of reference while reporting the results, we will refer to these vowels as the subject, object or the verb, depending on the syntactic role of the constituent they are located in. The syllable order is indicated as penultimate and final only when there are two measurement points from the verb.
4.1. Polar questions
Our first and second research questions were concerned with whether the constituents that immediately precede the question particle -mI, focused constituents, in ST and WT were marked by prosodic cues in contrast to their non-focused counterparts. Therefore, we compared the frequency, intensity and duration of vowels in focused and non-focused constituents. The non-focused pre-focal and post-focal constituents are further categorized into groups with respect to their distance from the focused constituent, which is indicated by the number ‘1’ or ‘2’, with ‘2’ being the most distant.
4.1.1. Spoken Turkish (ST)
The results indicated that, in the full-fledged system of ST, all the constituents immediately followed by the question particle had higher frequency values than their non-focused counterparts. Figure 5 illustrates the average modulation of frequency contour based on the position of the question particle in a polar question.Footnote 14 Note that, each focused constituent is accompanied by a rise in frequency compared to their non-focused counterparts.
(7)
Ahmet
(mi)
tatil-e
(mi)
gid-ecek
(mi)?
Ahmet
QP
vacation-DAT
QP
go-FUT
QP
Will Ahmet (or someone else) go on a vacation?
Will Ahmet go on a vacation (or somewhere else)?
Will Ahmet go on a vacation (or not)?
The frequency contour of a polar question in ST averaged across speakers with the question particle (QP) following the subject, object or verb.

Figure 5. Long description
Each line demonstrates a prominent rise in frequency at its focused constituent compared to its non-focused path.
The red line (verb polar) stays relatively flat and low across ‘Ahmet’ and ‘tatile’ but rises sharply during ‘gidecek’, peaking near 250 Hz at the final QP before falling.
The green line (object polar) remains lower during ‘Ahmet’, rises gradually through ‘tatile’ and peaks around 240 Hz at the second QP, followed by a sharp drop during ‘gidecek’.
The blue line (subject polar) rises sharply during the initial ‘Ahmet’ segment, peaking at roughly 250 Hz at the first QP, then steadily falls through the rest of the utterance.
A line graph titled ‘ST, Frequency (Hz) for ‘Ahmet - tatile - gidecek’ (speakers averaged)’. The y-axis shows frequency (Hz) from 50 to 400; the x-axis shows warped time (s). The graph is divided into sequential word segments: Ahmet, QP, tatile, QP, gidecek and QP. Three colored lines trace the pitch contour for different focus conditions.
The formal tests comparing frequency showed that focused constituents had significantly higher frequency than non-focused constituents. Focused subjects had significantly higher frequency than non-focused subjects in sentences, where the object was focused (pre-focal 1) (W = 205, N = 21, p = .001, r = 0.77) and where the verb was focused (pre-focal 2) (W = 272, N = 23, p < .001, r = 0.97). Moreover, focused objects had significantly higher frequency than non-focused objects in sentences, where the subject was focused (post-focal 1) (W = 231, N = 21, p < .001, r = 0.99) and where the verb was focused (pre-focal 1) (W = 209, N = 20, p < .001, r = 1). Finally, focused verbs had significantly higher frequency than non-focused verbs in sentences, where the object was focused (post-focal 1) (W = 210, N = 20, p < .001, r = 1) and where the subject was focused (post-focal 2) (W = 210, N = 20, p < .001, r = 1). The distributions of the compared groups are illustrated in Figure 6.
Target ST vowel frequency in focused, pre-focal and post-focal constituents by syntactic role in polar questions. Numbered dots indicate mean pitch.

Figure 6. Long description
Verb: Contains Focused, sitting highest with a mean of 235 Hz, followed by Postfocal_1 dropping down to 137 Hz, and Postfocal_2 falling lowest to 128 Hz.
Object: Contains Prefocal_1 (mean 206 Hz), Focused, which peaks highest at a mean of 245 Hz, and Postfocal_1, falling much lower to a mean of 158 Hz.
Subject: Contains Prefocal_1 (mean 218 Hz), Prefocal_2 (mean 210 Hz) and Focused, which falls higher up the axis at a mean of 243 Hz.
The plots fall into three distinct clusters:
The image is a violin and box plot titled ‘Figure 6: Target ST vowel frequency in focused, pre-focal and post-focal constituents by syntactic role in polar questions’. The y-axis shows frequency (Hertz) from roughly 100 to over 300. The x-axis divides the data by syntactic role: subject, object and verb. A color-coded legend identifies the varieties: Prefocal_1, Prefocal_2, Focused, Postfocal_1 and Postfocal_2. Numbered black dots inside the box plots indicate the mean pitch values.
The test comparing intensity showed that different syntactic roles behave differently. Focused subjects had significantly higher intensity than non-focused subjects in sentences where the verb was focused (pre-focal 2) (W = 207, N = 23, asymptotic p = .0372, r = 0.5). Moreover, focused verbs had significantly higher intensity than non-focused verbs in sentences, where the object was focused (post-focal 1) (W = 205, N = 20, p < .001, r = 0.95) and where the subject was focused (post-focal 2) (W = 209, N = 20, p < .001, r = 0.99). The distributions of the compared groups are illustrated in Figure 7.
Target ST vowel intensity in focused, pre-focal and post-focal constituents by syntactic role in polar questions. Numbered dots indicate mean intensity.

Figure 7. Long description
Verb: Contains Focused highest in its cluster at a mean of 73 dB, followed by a sharp drop to Postfocal_1 (mean 68 dB) and Postfocal_2 (mean 68 dB) which sit at the bottom of the axis.
Object: Contains Prefocal_1 (mean 74 dB), Focused peaking higher at 76 dB, and Postfocal_1 dropping back down to a mean of 74 dB.
Subject: Contains Prefocal_1 (mean 75 dB) and Prefocal_2 (mean 75 dB) at similar levels, and Focused, sitting slightly higher with a mean of 76 dB.
The plots are grouped into three clusters:
The image is a violin and box plot titled ‘Figure 7: Target ST vowel intensity in focused, pre-focal and post-focal constituents by syntactic role in polar questions’. The y-axis displays intensity (decibel) from roughly 65 to over 80. The x-axis categorizes data by syntactic role: subject, object and verb. A legend identifies varieties: Prefocal_1, Prefocal_2, Focused, Postfocal_1 and Postfocal_2. Numbered black dots within the plots show mean intensity.
With regard to duration, we have not found any significant differences between any of the focus variety groups within each syntactic role.
4.1.2. Whistled Turkish (WT)
The frequency contour of the sentence in (7) is shown in WT in Figure 8. Note that the final syllable of the subject and the verb have higher frequency values in subject polar and verb polar conditions, respectively, compared to their non-focused counterparts in the other conditions. However, this is not the case for the object.
The frequency contour of a polar question in WT averaged across speakers with the question particle (QP) following the subject, object or the verb.

Figure 8. Long description
The blue line (subject polar) rises sharply at the end of ‘Ahmet’ and remains high (around 2500 Hz) through the first QP and then follows a U-shaped dip through the rest of the utterance. The green line (object polar) tracks lower during ‘Ahmet’, dips and rises through ‘tatile’ and appears in the second QP around 2200 Hz, lacking a distinct prominent peak. The red line (verb polar) tracks lower initially, rises through ‘tatile’ and spikes to a prominent peak near 3000 Hz early in ‘gidecek’ before dropping into the final QP.
A line graph titled ‘WT, Frequency (Hz) for “Ahmet - tatile - gidecek” (speakers averaged)’. The y-axis shows frequency (Hz) from 1000 to 5000; the x-axis shows warped time (s). The graph is divided into alternating word and question particle (QP) segments: Ahmet, QP, tatile, QP, gidecek and QP. Because the QP shifts position based on focus, each QP segment only displays the line for its specific condition.
The tests comparing frequency showed that only focused subjects and verbs had significantly higher frequency than their non-focused counterparts. Focused subjects had significantly higher frequency than non-focused subjects in sentences, where the object was focused (pre-focal 1) (W = 150, N = 19, p = .025, r = 0.58) and where the verb was focused (pre-focal 2) (W = 179, N = 20, p = .004, r = 0.7). Moreover, focused verbs had significantly higher frequency than non-focused verbs in sentences, where the object was focused (post-focal 1) (W = 149, N = 17, p < .001, r = 0.95) and where the subject was focused (post-focal 2) (W = 180, N = 19, p < .001, r = 0.89). The distributions of the compared groups are illustrated in Figure 9.
Target WT vowel frequency in focused, pre-focal and post-focal constituents by syntactic role in polar questions. Numbered dots indicate mean pitch.

Figure 9. Long description
Verb: Contains Focused sitting highest in its cluster with a mean of 2226 Hz, followed by a sharp drop down to Postfocal_1 (mean 1890 Hz) and Postfocal_2 (mean 1930 Hz).
Object: Contains Prefocal_1 (mean 2185 Hz), Focused sitting slightly lower on the axis at a mean of 2162 Hz, and Postfocal_1 rising back up to a mean of 2205 Hz.
Subject: Contains Prefocal_1 (mean 2181 Hz) and Prefocal_2 (mean 2169 Hz) at similar levels, with Focused falling higher up the axis at a mean of 2312 Hz.
The plots fall into three distinct clusters:
The image is a violin and box plot titled ‘Figure 9: Target WT vowel frequency in focused, pre-focal and post-focal constituents by syntactic role in polar questions’. The y-axis shows frequency (hertz) from roughly 1500 to over 2800. The x-axis divides data by syntactic role: subject, object and verb. A legend identifies varieties: Prefocal_1, Prefocal_2, Focused, Postfocal_1 and Postfocal_2. Black dots inside the plots indicate mean pitch values.
The tests comparing intensity did not show any significant differences between any of the focus variety groups within each syntactic role.
However, the tests comparing duration showed that focused verbs had significantly shorter duration than their non-focused counterparts. Focused verbs had significantly shorter duration than non-focused verbs in sentences, where the object was focused (post-focal 1) (W = 0, N = 17, p < .001, r = −0.99) and where the subject was focused (post-focal 2) (W = 0, N = 20, p < .001, r = −0.91). The distributions of the compared groups are illustrated in Figure 10.
Target WT vowel duration in focused, pre-focal and post-focal constituents by syntactic role in polar questions. Numbered dots indicate mean duration.

Figure 10. Long description
Verb: Contains Focused sitting lowest at a mean of 143 ms, followed by a sharp rise to Postfocal_1 (mean 239 ms) and Postfocal_2 (mean 242 ms) sitting highest.
Object: Contains Prefocal_1 (mean 122 ms), Focused dropping lowest to a mean of 97 ms, and Postfocal_1 rising back up to a mean of 125 ms.
Subject: Contains Prefocal_1 (mean 154 ms) and Prefocal_2 (mean 150 ms) sitting higher on the axis, while Focused falls lowest in the cluster with a mean of 129 ms.
The plots fall into three distinct clusters:
The image is a violin and box plot titled ‘Figure 10: Target WT vowel duration in focused, pre-focal and post-focal constituents by syntactic role in polar questions’. The y-axis shows duration (milliseconds) from under 100 to over 300. The x-axis divides data by syntactic role: subject, object and verb. A legend identifies varieties: Prefocal_1, Prefocal_2, Focused, Postfocal_1 and Postfocal_2. Black dots inside the plots indicate mean duration values.
Note that focused polar verbs are followed by the question particle, while their non-focused counterparts occur in clause-final position.
The next section discusses an extra analysis that we did on the object measurements from both languages as a result of noticing a potentially interesting pattern in the data.
4.1.3. Vowel-consonant transition
Although not part of our original research questions, the lack of significant differences between focused and non-focused objects in WT led us to consider a potential confounding variable. In the stimuli, the syllable of subjects and verbs (except one of the subjects) in which the target vowel appeared, ended in consonants, creating a consistent vowel-consonant transition in the target syllable. In contrast, the syllable of objects in which the target vowel appeared ended in vowels and were followed by either a question particle or a consonant from the next constituent, introducing variable vowel-consonant transitions. This variability, particularly in the type of following consonant, may have affected frequency measurements. To test the susceptibility of both ST and WT to coarticulation effects, we grouped the frequency data for non-focused objects, to factor out focus as a variable, based on whether the following consonant was coronal, labial or velar, and we compared these groups.
In the WT data, target vowels in objects followed by coronal consonants had significantly higher frequency than those followed by labial (W = 90, N = 14, p = .016, r = 0.71) and velar (W = 92, N = 14, p = .01, r = 0.75) consonants. The distributions of the compared groups are illustrated in Figure 11.
Target WT vowel frequency by place of articulation of the following consonant. Data are from the polar questions stimuli. Numbered dots indicate mean pitch.

Figure 11. Long description
Velar: Falls at a nearly identical vertical position to the labial plot, with a nearly matching mean pitch of 2154 Hz.
Labial: Falls visibly lower on the axis compared to the coronal plot, with its mean pitch dropping down to 2153 Hz.
Coronal: Sits highest on the y-axis, indicating a higher overall frequency range, and contains the highest mean pitch at 2276 Hz.
The plots are arranged across three categories:
The image is a violin and box plot titled ‘Figure 11: Target WT vowel frequency by place of articulation of the following consonant’. The y-axis displays frequency (hertz) ranging from 1750 to over 2500. The x-axis categorizes the data by following consonant: coronal, labial and velar. Numbered black dots inside the box plots indicate the mean pitch values.
In the ST data, target vowels in objects followed by coronal consonants had significantly lower frequency than those followed by labial (W = 27, N = 16, p = .033, r = −0.6) consonants. The distributions of the compared groups are illustrated in Figure 12.
Target ST vowel frequency by place of articulation of the following consonant. Data are from the polar questions stimuli. Numbered dots indicate mean pitch.

Figure 12. Long description
Velar: Falls lowest on the axis, containing the shortest mean duration at 105 ms.
Coronal: Falls just below the labial plot with a mean duration of 111 ms.
Labial: Sits highest on the axis compared to the others, containing the longest mean duration at 114 ms.
The plots are arranged across three categories, all sitting relatively close together on the y-axis:
The image is a violin and box plot titled ‘Figure 12: Target ST vowel duration by place of articulation of the following consonant’. The y-axis displays duration (milliseconds) ranging from roughly 60 to over 160. The x-axis categorizes the data by following consonant: coronal, labial and velar. Numbered black dots inside the box plots indicate the mean duration values.
These seemingly contradictory results may be influenced by differences in the sentence length of the target sentences, as illustrated in Section 3.1.2, and the role of consonant-vowel frequency modulations in ST and WT, which are discussed in detail in Section 5.
The next section discusses the results of focus constructions.
4.2. Focus constructions
Our third and fourth research questions were concerned with whether focused constituents were marked by prosodic cues or whether the non-focal domains were compressed in ST and WT. To identify the focus marking strategy in focused constituents, we first made comparisons of frequency, intensity and duration between focused and non-focused constituents. As a second step, we made the same comparisons between focus subtypes to illustrate possible differences among them. Additionally, to test for compression in the pre-focal and post-focal domains, we compared the constituents that bore BF with their non-focused counterparts in narrow focus constructions, namely, PF and CF.
4.2.1. Spoken Turkish (ST)
The results indicate that in ST, only the focused verb was marked by distinctive cues – having greater frequency, intensity and duration values compared to its non-focused counterpart, as illustrated in Figures 13 and 14 for frequency and intensity.
(8)
Serpil
lahana-yı
sar-ıyor
Serpil
cabbage-ACC
wrap-IMPF
‘Serpil is wrapping the cabbage’.
The frequency contour of a focus construction in ST averaged across speakers and conditions: broad focus (BF), when contrastive focus (CF) or presentational focus (PF) is on the verb (V) or object (O).

Figure 13. Long description
A line graph titled Figure 13 displays average frequency contours (Hz) across the utterance. The graph features three colored lines representing different focus conditions: a blue line for subject focus, a green line for object focus and a red line for verb focus. Across the initial pre-focal segments, the frequency trajectories remain relatively flat and track closely together. However, as the contours enter the final verb segment, the red line (verb focus) rises sharply to a distinct, prominent peak, reflecting the heightened frequency of the focused verb. In contrast, the blue and green lines (representing the non-focused verb in subject and object conditions) maintain a significantly lower, flatter trajectory through this final domain, slowly falling by the end of the utterance.
The intensity contour of a focus construction in ST averaged across speakers and conditions: broad focus (BF), when contrastive focus (CF) or presentational focus (PF) is on the verb (V) or object (O).

Figure 14. Long description
A line graph titled Figure 14 displays average intensity contours (decibel) across the utterance. Like the frequency graph, it utilizes three colored lines to denote focus conditions: a blue line for subject focus, a green line for object focus and a red line for verb focus. Throughout the earlier pre-focal domains, the intensity levels of all three lines follow a similar baseline pattern, rising and falling gently with the natural syllables. Upon reaching the final verb segment’s final syllable, the red line (verb focus) surges upward to a relatively higher intensity peak. Conversely, the blue and green lines (non-focused verb variants) experience no such surge, maintaining a steadier, lower trajectory through the verb segment.
The formal tests comparing the frequency, intensity and duration of focused and non-focused constituents showed that (i) only focused verbs had higher frequency than non-focused verbs (W = 253, N = 22, p < .001, r = 1), as illustrated in Figure 15, (ii) only focused verbs had higher intensity than non-focused verbs (W = 239, N = 22, p < .001, r = 0.89), as illustrated in Figure 16, and (iii) only focused verbs had longer duration than non-focused verbs (W = 238, N = 22, p = .001, r = 0.88), as illustrated in Figure 17.
Target ST vowel frequency in focused and non-focused constituents by syntactic role in focus constructions. Numbered dots indicate mean frequency.

Figure 15. Long description
In contrast, the verb category features boxes positioned lower on the y-axis than the object boxes. There is a clear vertical separation between the two verb conditions: the focused verb (Focus 1) is positioned higher with a mean of 173 Hz, while the non-focused verb (Focus 0) is the lowest on the plot with a mean of 123 Hz.
For the object category, both focus conditions are positioned at the top of the scale, sharing an identical mean frequency of 195 Hz. Their boxes and violin distributions overlap almost entirely, indicating very little variation in frequency between focused and non-focused objects in this context.
The plot displays frequency (hertz) on the y-axis (ranging from 100 to over 200) and syntactic role on the x-axis, comparing Focus 0 (red) and Focus 1 (teal).
Target ST vowel intensity in focused and non-focused constituents by syntactic role in focus constructions. Numbered dots indicate mean intensity.

Figure 16. Long description
In the verb category, there is a more distinct vertical separation between the two conditions. The focused verb (Focus 1) has a mean of 72 dB, placing it level with the non-focused object. The non-focused verb (Focus 0) is positioned lowest on the plot with a mean of 69 dB.
For the object category, both boxes are positioned toward the top of the scale. The focused object (Focus 1) is the highest overall with a mean of 73 dB, while the non-focused object (Focus 0) is slightly lower with a mean of 72 dB. Their distributions overlap significantly, indicating high intensity regardless of focus in this role.
The plot displays intensity (decibel) on the y-axis (ranging from 65 to over 75) and syntactic role on the x-axis, comparing Focus 0 (red) and Focus 1 (teal).
Target ST vowel duration in focused and non-focused constituents by syntactic role in focus constructions. Numbered dots indicate mean duration.

Figure 17. Long description
In the verb category, there is a clear vertical separation between the two conditions. The focused verb (Focus 1) is positioned significantly higher on the y-axis with a mean of 63 ms, representing the highest frequency values in the plot. The non-focused verb (Focus 0) is the lowest overall, with a mean of 53 ms.
For the object category, the two focus conditions are nearly identical in their vertical positioning and distribution. The non-focused object (Focus 0) has a mean of 58 ms, while the focused object (Focus 1) has a mean of 57 ms. Their boxes overlap almost entirely in the center of the y-axis range.
The plot displays duration (milliseconds) on the y-axis (ranging from 40 to over 80) and syntactic role on the x-axis, comparing Focus 0 (red) and Focus 1 (teal).
The tests comparing the frequency, intensity and duration of different types of focused constituents showed that (i) verbs that bore CF (W = 66, N = 11, p < .001, r = 1) and those that bore PF (W = 65, N = 11, p = .002, r = 0.97) had higher frequency than verbs that bore BF, as illustrated in Figure 18, (ii) the verbs that bore CF (W = 66, N = 11, p < .001, r = 1) and PF (W = 57, N = 11, p = .032, r = 0.73) had higher intensity than verbs that bore BF, as illustrated in Figure 19, and (iii) no significant differences in terms of duration were found.
Target ST vowel frequency in constituents that bear broad focus (BF), contrastive focus (CF) and presentational focus (PF) by syntactic role in focus constructions. Numbered dots indicate mean frequency.

Figure 18. Long description
Verb role: The boxes are positioned significantly lower on the y-axis than their object counterparts. There is clearer vertical separation here: Nonfocus (PF) is the highest at 177 Hz, followed by Nonfocus (CF) at 168 Hz. The BF condition is the lowest on the entire plot, with a mean of 135 Hz.
Object role: All three boxes are clustered at the top of the scale, indicating higher frequencies. The BF condition has the highest mean at 202 Hz, followed by Nonfocus (PF) at 198 Hz and Nonfocus (CF) at 191 Hz. The significant overlap in boxes and violin distributions suggests similar frequency patterns across these categories in the object position.
The plot displays frequency (hertz) on the y-axis and syntactic role on the x-axis, comparing Broad Focus (BF), Nonfocus (CF) and Nonfocus (PF).
Target ST vowel intensity in constituents that bear broad focus (BF), contrastive focus (CF) and presentational focus (PF) by syntactic role in focus constructions. Numbered dots indicate mean intensity.

Figure 19. Long description
Verb role: All boxes in this category are positioned lower than those in the object role. The BF condition exhibits the lowest intensity on the plot with a mean of 69 dB. Conversely, the CF and PF conditions are positioned higher with identical means of 72 dB.
Object role: The boxes are clustered at the higher end of the intensity scale. The BF condition is the most intense with a mean of 75 dB. Both CF and PF conditions show identical mean intensities of 73 dB, with their distributions overlapping considerably.
The plot displays intensity (decibel) on the y-axis and syntactic role on the x-axis, comparing three focus types: broad focus (BF, red), contrastive focus (CF, green) and presentational focus (PF, blue).
The tests attempting to uncover potential compression effects in the non-focal domain in narrow focus constructions showed that non-focused verbs, both when the object bore CF (W = 3, N = 9, p = .019, r = −0.87) and when it bore PF (W = 6, N = 11, p = .013, r = −0.82), had lower frequency than verbs that bore BF. The distributions of the compared groups are illustrated in Figure 20. However, comparisons of intensity showed a potential compression effect on objects, instead of verbs. Non-focused objects, both when the verb bore CF (W = 3, N = 11, p = .005, r = −0.91) or PF (W = 2, N = 11, p = .003, r = −0.94), had lower intensity than objects that bore BF. The distributions of the compared groups are illustrated in Figure 21.
Target ST vowel frequency in constituents that bear broad focus (BF) and those in non-focused constituents located in sentences where another constituent bears contrastive (CF) or presentational focus (PF) by syntactic role in focus constructions. Numbered dots indicate mean frequency.

Figure 20. Long description
Verb role: All boxes in this category are positioned much lower on the y-axis than those in the object role. There is a distinct vertical hierarchy here: the BF condition is the highest in the group with a mean of 135 Hz, followed by Nonfocus (CF) at 125 Hz and Nonfocus (PF) at the lowest position on the entire plot with a mean of 121 Hz.
Object role: The boxes are clustered at the top of the scale, representing the highest frequencies in the plot. The BF condition is positioned highest with a mean of 202 Hz. Both Nonfocus (CF) and Nonfocus (PF) conditions are positioned slightly lower, sharing an identical mean of 195 Hz. Their distributions overlap significantly near the 200 Hz mark.
Broad Focus (BF, red), Nonfocus (CF) (green) and Nonfocus (PF) (blue).
Target ST vowel intensity in constituents that bear broad focus (BF) and those in non-focused constituents in sentences where another constituent bears contrastive (CF) or presentational focus (PF) by syntactic role in focus constructions. Numbered dots indicate mean intensity.

Figure 21. Long description
Verb role: All three boxes are positioned significantly lower on the y-axis than the object boxes. Notably, all three focus types – BF, Nonfocus (CF) and Nonfocus (PF) – share an identical mean of 69 dB, with their box plots and violin distributions overlapping almost entirely at the bottom of the scale.
Object role: The boxes are positioned at the higher end of the intensity scale. The BF condition is the highest overall with a mean of 75 dB. The Nonfocus (CF) and Nonfocus (PF) conditions are positioned slightly lower and level with each other, both sharing a mean of 72 dB. Their violin distributions show more variance toward lower intensities compared to the BF condition.
The plot displays intensity (decibel) on the y-axis and syntactic role on the x-axis, comparing three focus conditions: Broad Focus (BF, red), Nonfocus (CF) (green) and Nonfocus (PF) (blue).
The next section discusses the results in WT.
4.2.2. Whistled Turkish (WT)
Figure 22 exemplifies a sentence in different focus types in WT.
The pitch contour of a focus construction in WT averaged across speakers and conditions: broad focus (BF), contrastive focus (CF) or presentational focus (PF) is on the verb (V) or object (O).

Figure 22. Long description
Red line ({CF&PF}-V) represents focus on the verb ‘sarıyor’. It remains at or below the other contours throughout the sentence.
Green line ({CF&PF}-O) represents focus on the object ‘lahanayı’. It follows the broad focus baseline closely during the first segment but reaches a higher peak (approx. 2700 Hz) at the end of the ‘lahanayı’ segment and remains slightly elevated through the start of the final segment.
Blue line (BF) represents broad focus. It fluctuates between approximately 1700 Hz and 2700 Hz, showing a characteristic ‘dip-and-rise’ pattern within each of the three word segments.
The y-axis shows frequency (Hz) from 1000 to 5000; the x-axis shows warped time (s). Three colored lines trace the frequency contours for different focus conditions in Whistled Turkish (WT):
The tests comparing the frequency, intensity and duration of focused and non-focused constituents showed that (i) focused objects had higher frequency than non-focused objects (W = 243, N = 24, p = .006, r = 0.62), as illustrated in Figure 23, and (ii) no significant differences were found in terms of intensity and duration.
Target WT vowel frequency in focused and non-focused constituents by syntactic role in focus constructions. Numbered dots indicate mean frequency.

Figure 23. Long description
In the verb category, both boxes are positioned notably higher on the y-axis than those in the object category. In this role, the non-focused constituent (Focus 0) is positioned higher with a mean of 2446 Hz, whereas the focused constituent (Focus 1) has a slightly lower mean of 2394 Hz.
In the object category, the focused constituent (Focus 1) is positioned slightly higher on the y-axis with a mean frequency of 2212 Hz, while the non-focused constituent (Focus 0) has a mean of 2138 Hz. The boxes and violin distributions for both conditions show considerable overlap in the lower frequency range of the plot.
The plot displays frequency (hertz) on the y-axis (ranging from 1750 to 2750) and syntactic role on the x-axis, comparing Focus 0 (red) and Focus 1 (teal) in Whistled Turkish (WT).
The tests comparing the frequency, intensity and duration of focused constituents that bore different types of focus showed that (i) verbs that bore BF had higher frequency than verbs that bore PF (W = 71, N = 12, p = .009, r = 0.82), as illustrated in Figure 24, and (ii) no significant differences were found in terms of intensity and duration.
Target WT vowel frequency in constituents that bear broad focus (BF), contrastive focus (CF) and presentational focus (PF) by syntactic role in focus constructions. Numbered dots indicate mean pitch.

Figure 24. Long description
Verb role: All boxes are positioned notably higher on the y-axis than their object counterparts. There is a clearer vertical hierarchy: BF is positioned highest with a mean of 2502 Hz and shows a prominent upward tail in its violin distribution. CF follows with a mean of 2403 Hz, and PF is the lowest in this group with a mean of 2386 Hz.
Object role: The three boxes are clustered at the lower end of the y-axis. The CF condition has the highest mean at 2217 Hz, followed by PF at 2207 Hz and BF at 2191 Hz. Their distributions overlap significantly, suggesting similar frequency patterns across focus types in the object position.
The plot displays frequency (hertz) on the y-axis and syntactic role on the x-axis, comparing three focus conditions: broad focus (BF, red), contrastive focus (CF, green) and presentational focus (PF, blue).
The tests attempting to uncover potential compression effects in the non-focal domain in narrow focus constructions showed that non-focused objects, when the verb bore PF had lower frequency than objects that bore BF (W = 13, N = 12, p = .042, r = −0.67). No such difference was observed with CF-marked verbs. Figure 25 shows the group distributions.
Target WT vowel frequency in constituents that bear broad focus (BF) and those in non-focused constituents in sentences where another constituent bears contrastive (CF) or presentational focus (PF) by syntactic role in focus constructions. Numbered dots indicate mean pitch.

Figure 25. Long description
Verb role: There is a clear vertical shift upward compared to the object counterparts. The BF condition is the highest overall with a mean of 2502 Hz and features a prominent upward tail in its violin distribution. It is followed by Nonfocus (PF) with a mean of 2467 Hz, while Nonfocus (CF) is the lowest in this group with a mean of 2424 Hz.
Object role: All three boxes are clustered at the lower end of the frequency scale, primarily between 2000 and 2400 Hz. The BF condition is positioned highest with a mean of 2191 Hz, followed by Nonfocus (CF) at 2152 Hz and Nonfocus (PF) at 2125 Hz. The boxes and violin distributions overlap significantly, indicating similar frequency ranges.
The plot displays frequency (hertz) on the y-axis and syntactic role on the x-axis, comparing three focus conditions: Broad Focus (BF, red), Nonfocus (CF) (green) and Nonfocus (PF) (blue).
The next section discusses sentence final lengthening in ST and WT.
4.3. Sentence-final syllable duration
Although it was not part of our initial set of research questions, while extracting the frequency contours of individual items from the polar questions stimuli, we observed that the target vowels within the verb, even when they were not followed by the question particle, had the longest duration among the compared vowels. We aimed to determine whether focus constructions exhibited a similar pattern and whether this pattern was shared across the two modalities – spoken and whistled. Therefore, we compared the duration of the target vowels in the final syllables of the sentences with the target vowels within the constituents that preceded the verb, for both polar questions and focus constructions.
The duration comparisons using the Wilcoxon rank-sum test with the ST data from the focus constructions stimuli showed that target vowels within the penultimate syllables of the verbs had significantly longer duration than those within the final syllables of the verbs (W = 855, N = 35, asymptotic p = .01, r = 0.36). In addition, when the BF data are excluded from the analysis, target vowels within the penultimate syllables of the verbs had significantly longer duration than both those in the objects (W = 362, N = 22, p = .031, r = 0.37) and those in the final syllables of the verbs (W = 405, N = 24, asymptotic p = .015, r = 0.41). Given that focused verbs in ST are marked by longer duration, as discussed in Section 4.2.1, and that the penultimate syllable is accented in the data, the longer duration of the penultimate-syllable vowel compared to the final-syllable vowel is expected. The mean durations of the compared groups are illustrated in Figure 26.
Mean duration of target ST vowels in constituents that bear broad focus (BF), contrastive focus (CF) and presentational focus (PF) by syntactic role in focus constructions.

Figure 26. Long description
Contrastive focus (CF, green line) and presentational focus (PF, blue line): Both follow a similar ‘peak’ trajectory. They start with shorter durations than BF at the object position (CF: 54.4 ms; PF: 59 ms) but rise sharply to peak at the verb penultimate syllable (CF: 63.4 ms; PF: 63.2 ms). Both then decrease at the verb final syllable (CF: 55.1 ms; PF: 56 ms).
Broad focus (BF, red line): This condition starts with the highest duration at the object position (60.7 ms). It then shows a consistent downward trend, dropping to 54.4 ms at the verb penultimate syllable and reaching the lowest point of the graph at the verb final syllable (49.6 ms).
The line graph illustrates the mean duration in milliseconds of target ST vowels across different focus types and syntactic roles. The y-axis ranges from 52 to 64 ms, and the x-axis lists three roles: object, verb (penultimate syllable) and verb (final syllable).
ST data from the polar constructions stimuli showed that target vowels within both subjects (W = 3107, N = 65, asymptotic p < .001, r = 0.34) and verbs (W = 3126.5, N = 61, asymptotic p < .001, r = 0.41) were longer than those within objects. The mean durations of the compared groups and polar questions stimuli are illustrated in Figure 27, respectively.
Mean duration of target ST vowels in focused and non-focused constituents by syntactic role in polar questions.

Figure 27. Long description
At the subject position, the non-focused constituent is notably longer than the focused one. At the object position, durations are nearly identical. At the verb position, the focused constituent exhibits the longest duration in the entire plot.
Focus 1 (teal line): Starts at 59.5 ms for the subject, drops to its minimum of 55.7 ms for the object and reaches its maximum of 63.6 ms for the Verb.
Focus 0 (red line): Starts at 62.7 ms for the subject, drops to its minimum of 55.8 ms for the object and rises to 63 ms for the verb.
Both conditions follow a V-shaped trajectory, with the lowest durations occurring at the object position.
The line graph illustrates mean duration (milliseconds) on the y-axis (ranging from 56 to 64) against syntactic role on the x-axis. It compares non-focused (Focus 0, red) and focused (Focus 1, teal) constituents.
Our duration comparisons using the Wilcoxon rank-sum test with the WT data from the focus constructions stimuli showed that target vowels within the final syllables of the verbs had longer duration than both those within objects (W = 3476, N = 60, p < .001, r = 0.93) and those within the penultimate syllables of the verbs (W = 3596, N = 60, p < .001, r = 1). Moreover, in the polar questions stimuli, the target vowels within verbs had longer duration than both those within subjects (W = 3081, N = 58, p < .001, r = 0.58) and objects (W = 3429, N = 55, p < .001, r = 0.76). The mean durations of the compared groups for the focus constructions and polar questions stimuli are illustrated in Figures 28 and 29, respectively.
Mean duration of target WT vowels in constituents that bear broad focus (BF), contrastive focus (CF) and presentational focus (PF) by syntactic role from the focus constructions stimuli.

Figure 28. Long description
Verb (final syllable): A dramatic upward trend occurs for all conditions. CF rises most sharply to reach the highest duration on the graph at 295.3 ms. PF follows closely at 288.4 ms, and BF increases to 263.5 ms, remaining the shortest of the three focus types at this final position.
Verb (penultimate syllable): All three focus types show a decrease in duration. PF remains the longest in this role at 121.6 ms, whereas BF drops to 109.1 ms and CF is the shortest at 103.9 ms.
Object position: BF starts with the longest duration at 132.4 ms, while PF (125.9 ms) and CF (124.9 ms) are positioned slightly lower and close to one another.
The line graph in image_2d0bf6.png displays mean duration (milliseconds) on the y-axis, ranging from 100 to 300, for Whistled Turkish (WT) across three syntactic roles: object, verb (penultimate syllable) and verb (final syllable). It compares three focus types: broad focus (BF, red), contrastive focus (CF, green) and presentational focus (PF, blue).
Mean duration of target WT vowels in focused and non-focused constituents by syntactic role from the polar questions stimuli.

Figure 29. Long description
Verb position: Both conditions show an upward trend, but the separation increases drastically. Focus 0 rises to the graph’s peak at 240.6 ms, while Focus 1 rises more moderately to 143 ms.
Object position: Both conditions drop to their lowest durations in the sentence, with Focus 0 at 123.1 ms and Focus 1 at 97.1 ms.
Subject position: Focus 0 starts at 151.7 ms, while Focus 1 is shorter at 129.2 ms.
Throughout the entire plot, the non-focused (Focus 0) constituents maintain a significantly higher duration than the focused (Focus 1) ones.
The line graph in image_2d04ec.png illustrates mean duration (milliseconds) on the y-axis, ranging from 100 to 250, for Whistled Turkish (WT) across three syntactic roles: subject, object and verb. It compares non-focused (Focus 0, red) and focused (Focus 1, teal) constituents.
Table 2 summarizes the significant differences observed in the analysis of ST and WT polar and focus stimuli.
Summary of the results. ‘>’ denotes ‘higher than’ and ‘<’ denotes ‘lower than’. ‘S’, ‘O’ and ‘V’ denote subject, object and verb, respectively; and ‘C’ denotes ‘constituents of all syntactic roles’. Subscripts indicate subcategories

Table 2. Long description
Sentence final lengthening: In focus constructions, ST duration is V-Penultimate Syllable > V-Final Syllable, while WT is V-Final Syllable > V-Penultimate Syllable and O. In polar questions, both ST and WT show V > O; ST also shows S > O, while WT shows V > S.
Vowel-consonant transitions: Frequency analysis shows ST vowels followed by coronals < labials. In WT, vowels followed by coronals > labials and velars.
Focus constructions: ST shows focused V is higher across frequency, intensity and duration. WT shows O-Focused > O-Nonfocused for frequency, but no intensity or duration differences are noted. Specific subcategory frequency contrasts (e.g., V-BF > V-PF) are also detailed.
Polar questions: In ST, frequency is C-Focused > C-Nonfocused, while WT shows this specifically for S and V. ST shows intensity increases for focused S and V, whereas WT shows no intensity differences. WT shows V-Focused > V-Nonfocused for duration, but ST shows no differences.
The next section is a general discussion of these results.
5. Discussion
The first two research questions examined prosodic strategies in polar questions in ST and their transposition to WT. Findings showed that in the full-fledged system of ST, all constituents directly before the question particle had a higher frequency than non-focused ones. Intensity also signaled focus: it was higher for focused verbs compared to their non-focused counterparts when the subject or object was focused and for focused subjects compared to their non-focused counterparts when the verb was focused. Duration did not serve as a distinctive cue in ST polar questions.
As for WT, the subject and the verb immediately followed by the question particle were found to have higher frequency values than their non-focused counterparts. The results show that frequency modulation is used to transpose the prosodic contour of ST polar questions into WT, and hence, the channel of frequency simultaneously transposes segmental cues and prosodic cues. However, a natural question is raised as to why the prosodic strategies of the spoken modality are transposed to the whistled modality, excluding the object. The results discussed in section 4.1.2 showed that in WT, the frequency value of a vowel is easily modulated by the frequency of the following consonant, as vowels followed by coronal consonants had significantly higher frequency values than those followed by velar and labial consonants. In Figure 30, the object’s word-final target vowel had a lower frequency when followed by the bilabial consonant [m] of the question particle, but a higher frequency when followed by the coronal [s] of the verb without a question particle. This frequency modulation caused by vowel-consonant transition does not occur with subjects and verbs, as their target vowels always end in the same consonant even in the presence of the question particle. Thus, the frequency of neighboring consonants does not affect frequency in subject and verb constructions.Footnote 15
The pitch contour of a polar question in WT averaged across speakers with the question particle (QP) following the subject, object or verb.

Figure 30. Long description
Red (verb polar): It exhibits a significant upward trend during the ‘saklamış’ segment and the final ‘QP’, with a peak near 2900 Hz before the final fall.
Green (object polar) follows the lower baseline during the ‘Zeynep’ and first ‘QP’ segments but rises sharply during ‘mektupları’ and the second ‘QP’. It reaches a peak of approximately 2700 Hz during the second QP segment before dropping.
Blue (subject polar) shows a distinct frequency rise during the initial ‘Zeynep’ segment and the first ‘QP’. It peaks at approximately 2900 Hz at the end of the first QP segment and then steadily falls.
The y-axis shows frequency (Hz) from 1000 to 5000; the x-axis shows warped time (s). Three colored lines trace the frequency contours for different polar focus conditions in Whistled Turkish (WT):
It is possible that the exceptional pattern for the object may be due to frequency modulation caused by vowel-consonant transitions. In other words, the prosodic modulation may be obscured by the frequency modulation caused by vowel-consonant transitions. However, the results of our analysis cannot provide evidence that directly supports this claim as we used only the nonfocused object data and did not test for an interaction between focus and vowel-consonant transition effects.
Similar modulations are reported in spoken languages, where consonants trigger formant transitions in neighboring vowels. Ladefoged and Johnson (Reference Ladefoged and Johnson2011, p. 198) suggest that ‘a consonant can be said to be a particular way of beginning or ending a vowel’. In this study, we did not measure the formants of the vowels to check consonant-vowel transition effects in ST, and we could not find the same effect in ST when the measurement point was the fundamental frequency of the target vowels. In fact, vowels preceding coronal consonants had a lower frequency than the ones preceding labials. This seemingly contradictory result may be due to the number of arguments in target sentences. Out of six polar questions, two appear in the Subject-Direct Object-Indirect Object-Verb (S-DO-IO-V) order, and the target vowel appears in the final syllable of the direct object. The remaining four sentences use the Subject-Object-Verb (S-O-V) order, where the target final syllable of the object is followed by the sentence-final verb in the absence of an indirect object. Crucially, the vowels in the target syllable of the objects that are followed by labial consonants are from the two S-DO-IO-V sentences. In the four S-O-V sentences, the target syllable of the object is followed by the sentence-final verb, which begins with a coronal or velar sound. The frequency goes down toward the end of a sentence unless there is an exceptional high frequency associated with a focused constituent. In the two longer sentences containing an indirect object (S-DO-IO-V), the frequency of the vowel preceding the labial consonant is not lowered as much as the vowel frequencies in the other four sentences, hence the observed difference. A natural question is raised at this point as to why the same pattern is not observed in WT. We argue that frequency modulations due to vowel-consonant transitions are more robust in WT, as these modulations are the only means of signaling certain consonants in this modality; therefore, the same pattern of decreasing the frequency toward the end of a sentence is not observed in the whistled modality. In ST, on the other hand, frequency variation is used to signal intonation rather than segmental distinctions. Hence, consonant transition effects in WT are not expected to be observed for ST. To sum up, the findings on frequency patterns illustrate that prosodic cues are transposed into the whistled modality when possible to signal polar questions, aligning with Levshina’s (Reference Levshina2022) principle of positive correlation, where greater effort is used for higher communicative gain.
In contrast to ST, duration is another significant cue in polar questions in WT, but it does not necessarily encode all constituents or focused constituents. The non-focused verbs had longer duration than their focused counterparts followed by the question particle, but the same pattern was not observed with subjects and objects. Two natural questions arise at this point: (i) Why is longer duration not used to mark focused verbs, but used for their non-focused counterparts instead? and (ii) Why are subjects and objects an exception to this pattern? This finding should be considered alongside the findings discussed in Section 4.3 on sentence-final duration. We argue that non-focused verbs had longer durations than their focused variants because non-focused verbs appeared in sentence-final position, whereas focused verbs were followed by a sentence-final question particle. Since the sentence-final syllable is lengthened in WT irrespective of focushood, non-focused verbs were longer than focused verbs, which did not occur in sentence-final position. Because subjects and objects do not appear in sentence-final position, and because duration is not a cue to focus for these constituents, the same contrast was not observed for subjects and objects.
We now turn our attention to the examination of focus constructions which are addressed in the last two research questions. In ST, only the focused verb was marked by distinctive cues, exhibiting greater frequency, intensity and duration values than its non-focused counterpart. As for focus subtypes, a narrowly focused CF and PF verb had higher frequency and intensity values compared to a BF marked verb. When the object bore PF or CF, the verb had lower frequency compared to its counterpart in the BF condition. This shows that narrowly focused verbs exhibited boosting strategies, that is, increase in frequency and intensity, while the narrowly focused objects triggered frequency compression as a deboosting strategy in the post-focal domain. Moreover, when the verb bore CF or PF, the pre-focal object had lower intensity than a BF marked object. This shows that when the verb is narrowly focused in addition to boosting strategies on the verb, deboosting in intensity is observed on the pre-focal object.
As discussed in Section 3.3, the ST variety reported in this study has a more robust syntactic strategy for focus: a focused subject appears in the immediate preverbal position, which serves as the strict focus position. When focus is on the immediate preverbal object, the object receives no overt marking. However, when the verb is focused, the verb is marked through frequency modulation. These observations align with Levshina’s (Reference Levshina2022) principle of negative correlation, which states that less effort is used for highly accessible information and more for less accessible information. In ST, focus on the preverbal object is the default (highly accessible) option and thus unmarked, whereas focus on the verb (less accessible) involves overt prosodic marking, making zero marking the most economical strategy for the object.
It is surprising that while the marked position (i.e., the verb) was signaled through frequency in ST data in the current study, the unmarked object position was signaled in the same way in the whistled modality. This seemingly contradictory pattern aligns with Levshina’s (Reference Levshina2022) principle of positive correlation: more effort is used when communicative benefit is high. The most economic strategy is to leave the focused object unmarked in the whistled modality similar to the spoken modality, but the intelligibility must also be ensured for the constructions with high communicative benefits in this reduced acoustic system. Hence, the most frequent strategy – focusing the immediate preverbal constituent – used by the speakers is marked via frequency modulations in the whistled modality. Thus, spoken modality favors efficiency through minimal marking for accessible information, while the whistled modality prioritizes clarity for key content. Whistlers also produced the BF-marked verb with a higher frequency value compared to the PF-marked verb, a difference that requires further explanation, which we leave to future studies.
One final point concerns the differing treatment of polar questions and focus constructions in the spoken and whistled modality. We labeled the constituents preceding the question particle as focused because they evoke a set of alternatives and because the high pitch accent of the H*L% contour (Göksel et al. Reference Göksel, Kelepir, Üntak-Tarhan, Grijzenhout and Kabak2009) maps onto this constituent in ST. However, focused constituents showed some variation in realization across stimuli and modalities. First, as discussed in Section 3.3, in the ST focus-construction stimuli, of the 24 sentences intended to have subject focus, 16 were instead produced with focus on the object or the verb. As a result, we excluded the subject-focus conditions from the data set, suggesting that subject focus must occur in the immediate preverbal position in the absence of an intervening discourse-given object. In contrast, the subject-focus condition in the polar-question stimuli was produced by the participants without this constraint. Second, in the whistled modality, only polar questions are prosodically transposed from ST in the same way, with all focused elements marked by frequency modulation, but this is not the case in focus constructions. If they are all focused constituents, why does the immediate preverbal requirement apply only to statements in ST, and why are polar questions and focus constructions transposed into the whistled modality using different strategies? Regarding the first question, we suggest that the observed difference may be due to the presence of the question particle in subject polar questions. Specifically, when a question particle explicitly signals focushood, the immediate preverbal constraint may be overridden for the subject. A useful way to test this hypothesis would be to elicit grammaticality judgments from the same speakers in contexts where subject focus is accompanied by overt focus particles such as only or even in the presence of a discourse-given object in the immediate preverbal position. As for the second question, we suggest that this difference may stem from their distinct roles in the common ground. Questions and focus constructions both serve as tools for managing common ground, helping interlocutors organize and update shared information. A speaker may pose a response-seeking question – polar or wh- – to highlight a unit needing accommodation in the common knowledge base. Focused constituents can fulfill this need, establishing a close link between questions and focus. When a question is explicit, the focus in the answer typically aligns with the wh-word or the element marked by the question particle, ensuring question-answer congruence. This alignment reflects how a speaker’s communicative intent in the question shapes the informational structure of the answer. Without such congruence, communication may break down, as the answer would fail to meet the informational needs of the interlocutor. Returning to our findings in WT, not all positions are signaled through frequency modulations in focus constructions because the packaging, and hence the position of the focused constituent, is also predictable from the immediately preceding question. As for polar questions, information packaging is not necessarily predictable from the immediate context. We suggest that that is why the strategies available in polar questions are transposed into the whistled modality in exactly the same way to guide the hearer as much as possible to avoid a breakdown in communication. Although frequency modulation is costly in polar questions, the output is highly beneficial for effective communication, in line with the positive correlation principle. Abiding by the same principle, in focus constructions, more effort is used for the highly beneficial position only.
Finally, we will discuss phrase final lengthening which is observed with preboundary constituents irrespective of focushood. In spoken and sign languages, it is a well-established fact that the duration of segments is increased near prosodic boundaries through phrase final lengthening (Wightman et al., Reference Wightman, Shattuck-Hufnagel, Ostendorf and Price1992; Wilbur, Reference Wilbur1999). An increase in duration signals the boundaries of prosodic phrases, including prosodic words, phonological phrases and intonational phrases. In the ST data, in polar questions and focus constructions, the verb had longer duration than the object. As shown in Section 4.3, in WT, the duration of the sentence-final constituent was always longer than the non-final constituents. The finding that duration peaks at the verb shows that lengthening also signals phrase final boundaries in the whistled modality, too. This lengthening effect was observed both in polar questions and focus constructions. In the whistled modality, Meyer (Reference Meyer2015, p. 82) also showed that whistled vowels are about 26% longer than their spoken counterparts, with the longer vowels typically occurring at the end of a speech group. Because the stimuli in polar questions and focus constructions were entirely different, a direct comparison could not be carried out to find out whether question intonation is marked in a distinctive way in the whistled modality and we leave this issue for further investigation.
6. Conclusion
Whistled languages are acoustically reduced modalities of spoken languages, relying on frequency and amplitude modulation to convey lexical and prosodic information. Whistled languages provide natural contexts for studying whether the frequency channel can simultaneously be used to convey lexical and prosodic information to maintain intelligibility over long distances.
The findings show that, although frequency modulations primarily signal segmental cues for conveying lexical information, prosodic cues remain important in WT. In polar questions, as in ST, focused constituents preceding the question particle had higher frequency than non-focused ones, and this strategy was not position-specific. However, frequency modulation due to vowel-consonant transitions obscured this effect, reflecting modality-specific constraints. In focus constructions, unlike ST, WT only marks the default preverbal focus position, suggesting that WT uses available cues to highlight the most common focus position in the base language. While prosodic cues were broadly used in polar questions, they were restricted in focus constructions. This difference is attributed to communicative needs: polar questions require clear transmission to avoid breakdowns, whereas focus constructions rely on context and prior discourse for interpretation. The study proposes the ‘positive correlation principle’ as the main efficiency driver in WT, and whistlers exert greater effort for higher communicative benefit. A follow-up perception study on polar questions and focus constructions would shed light on how salient these prosodic cues are for whistlers.
Future research on the prosody of tonal whistled languages will further show how a single acoustic channel is used to simultaneously convey lexical and prosodic information. Comparing tonal and non-tonal whistled languages will contribute to our understanding of the strategies humans use to encode multiple layers of linguistic information in a reduced modality.
Supplementary material
The supplementary material for this article can be found at http://doi.org/10.1017/langcog.2026.10091.
Data availability statement
The anonymized data, supplementary materials and the R scripts used for the data analysis can be found in the following OSF repository: https://osf.io/25m9r/overview?view_only=8d5416e393c24dd5900daa4151bd8836
Acknowledgments
We are grateful to all the participants for their contribution. Our gratitude also goes to the audiences at the 21st International Conference on Turkish Linguistics (ICTL 2023) and the 46th Annual Conference of the German Linguistic Society (DGfS 2024) for their valuable feedback. We would also like to thank Enis Gümüş, Stefano Canalis, Carlos Gussenhoven, Esther Janse and Jeremy Steffman for their insightful discussions at various stages of the paper. Finally, we thank the two anonymous reviewers for their constructive comments and suggestions. Any remaining errors are our own.
Author contribution
Conceptualization: A.G.; data analysis: K.B.Ç., data curation: İ.Ş., İ.C., K.B.Ç.; data collection: A.G.; data curation: İ.Ş., İ.C., K.B.Ç.; funding acquisition: A.G.; investigation: A.G.; methodology: A.G.; software: İ.Ş.; validation: İ.C.; visualization: İ.Ş., K.B.Ç.; writing – original draft: A.G., K.B.Ç.; writing – review and editing: A.G., İ.Ş., İ.C., K.B.Ç. All authors read and approved the submitted version.
Competing interests
The authors declare none.

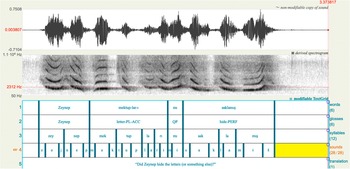
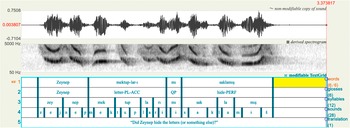
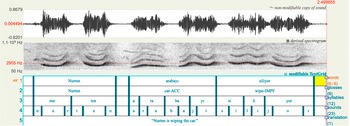
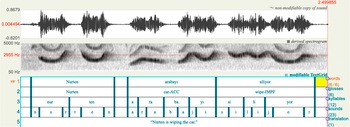


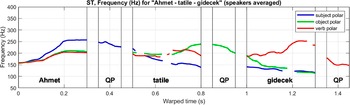

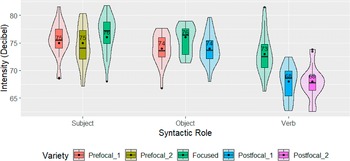

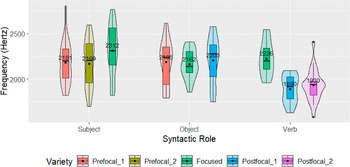


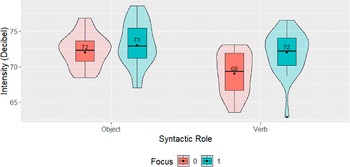
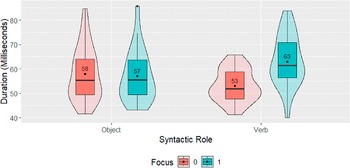


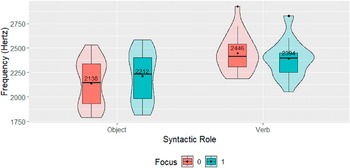
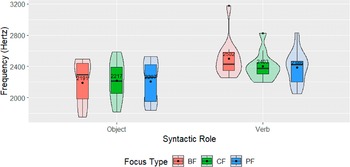

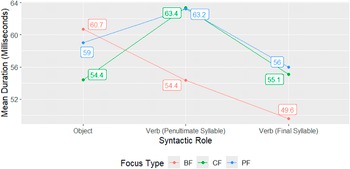
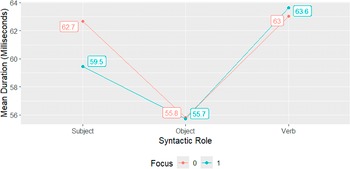
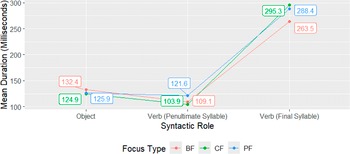

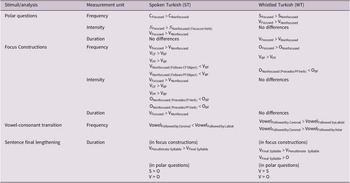
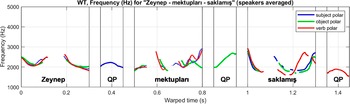


 Open access

