

China's population is ageing rapidly. In the 2011 census, people aged >60 years accounted for 13·3 % of the population, up nearly 3 % since 2000. China already has about 102 million people aged ≥ 60 years, more than one-fifth of the world's older population. The proportion of people in these older age groups is estimated to increase rapidly during the period 2000–2035, with a predicted one in four people aged ≥ 60 years in 2035( 1 ). Changes in the age structure in China may have various impacts, one of which is the increasing prevalence of non-communicable diseases (NCD)( 1 , 2 ).
Diet plays an important role in the prevention of NCD, including CVD, type 2 diabetes, the metabolic syndrome and cancers( 2 – Reference Roberts and Barnard 5 ), and the associations between macronutrient (carbohydrate, protein and fat) intakes and NCD risk have been well documented( Reference Nielsen and Joensson 6 – Reference Baş, Altan and Dinçer 11 ). For example, evidence shows that carbohydrate intake can influence the development of type 2 diabetes by affecting blood glucose and insulin concentrations( Reference Nielsen and Joensson 6 , Reference Boling, Westman and Yancy 7 ). In addition, compared with a low-fat diet (10–15 % of total energy), a low-carbohydrate diet (limited to 30–130 g/d) can improve glucose control, insulin response, and atherogenic dyslipidaemia and attenuate other cardiovascular risk factors( Reference Nielsen and Joensson 6 , Reference Hite, Berkowitz and Berkowitz 10 ). A systematic review and meta-analysis of data from 111 articles reporting on seventy-four randomised controlled trials has shown that a higher-protein diet (>30 % of energy input) can potentially improve adiposity, blood pressure and TAG concentrations compared with a low-protein meal ( < 15 % energy)( Reference Santesso, Akl and Bianchi 8 ). A low-fat diet, particularly low in saturated fat, has been shown to have a positive role in the prevention of CVD( Reference Woodside, McKinley and Young 9 , Reference Baş, Altan and Dinçer 11 ), although reduction in saturated fat intake must be evaluated in the context of replacement with other macronutrients( Reference Siri-Tarino, Sun and Hu 12 ).
In China, nutritional changes and epidemiological transitions have begun and are occurring at an extremely accelerated rate. Nutritional changes are linked to epidemiological transitions and an increased burden of NCD, including a rapid increase in the prevalence of overweight, obesity and NCD( Reference Du, Lu and Zhai 13 ). Although the association between macronutrient intakes and NCD risk is well established, population surveys of diet and nutrition often do not include people aged ≥ 60 years( Reference Cui and Dibley 14 , Reference Liu, Fang and Zhao 15 ), resulting in fewer studies evaluating macronutrient intakes among older Chinese people. Therefore, it is important to evaluate the current macronutrient intake status of older Chinese people. It is also important to evaluate differences in intakes by region, urbanicity and sociodemographic characteristics, as health outcomes such as NCD (e.g. obesity) may be influenced by urbanicity and socio-economic differences between regions( Reference Kun, Liu and Pei 16 – Reference Zimmer and Kwong 18 ). More detailed contextual evidence may help to inform regional health policies and planning. The present study aimed to investigate whether the macronutrient intake levels of older Chinese met the Dietary Reference Intakes (DRI)( 19 ) and to evaluate the associations between macronutrient intakes of men and women, in two age groups (60–69 and ≥ 70 years), and BMI, education levels, work status, urbanicity and four socio-economic regions of China (Northeast, East Coast, Central and Western).
Methods
Study design
The China Health and Nutrition Survey (CHNS) is an ongoing open cohort survey. It is an international collaborative project between the Carolina Population Centre of the University of North Carolina at Chapel Hill and the National Institute of Nutrition and Food Safety at the Chinese Center for Disease Control and Prevention( 20 ). Survey protocols and instruments and the process followed for obtaining informed consent for the CHNS were approved by the institutional review committees of the University of North Carolina at Chapel Hill and the National Institute of Nutrition and Food Safety at the Chinese Centre for Disease Control and Prevention. All participants gave written informed consent( Reference Cui and Dibley 14 ). Approval for using the CHNS data was given by the University of Newcastle, Australia (approval number: H-2013-0360).
The first round of the CHNS, including collection of household, community, and health/family planning facility data, was conducted in 1989. Later, seven additional surveys or rounds of data collection were conducted in 1991, 1993, 1997, 2000, 2004, 2006 and 2009( 20 ). Data collected in the CHNS 2009 were used in the present study. A total of 2746 people aged ≥ 60 years had complete dietary intake data. The survey has been described in detail elsewhere( Reference Popkin, Du and Zhai 21 , Reference Zhang, Zhai and Du 22 ), and data collected in the survey have been used to describe nutritional changes( Reference Cui and Dibley 14 , Reference Li, Li and Ma 23 ), chronic health conditions( Reference Hu, Reilly and Liang 24 ), and trends in the prevalence and incidence of chronic conditions( Reference Xi, Liang and He 25 , Reference Liang, Xi and Hu 26 ). A brief description of sample collection procedures and measures is given below.
Sample collection procedures and division of China into four regions
A multistage, random-cluster process was used in the survey to draw a sample of about 4400 households, with a total of 26 000 individuals in nine provinces. These nine provinces vary substantially in geography, economic development and health indicators. A multistage, random-cluster sampling process was used to select the sample surveyed in each of the provinces. Counties in the nine provinces were stratified by income levels (low, middle and high), and a weighted sampling scheme was used to randomly select four counties in each province. The provincial capital (or big city) and a lower-income city were selected. Subsequently, two urban neighbourhoods and two suburban neighbourhoods within the cities and one county capital town and three villages within the counties were randomly selected. Finally, twenty households were randomly selected within each neighbourhood. All individuals in each household were interviewed in the CHNS( 20 ).
China is a developing country with a vast territory. Different regions have different geographical, economic, cultural and social conditions. Based on the level of economic development, China can be divided into four major regions (East Coast, Central China, Northeast China and Western China). China has been divided into four regions to improve regional coordination and interactions so as to form a proper regional development pattern( Reference Liu, Swee-Hock and Wong 27 ). The nine provinces (Fig. 1) selected in the CHNS are distributed in these four regions, i.e. Heilongjiang and Liaoning in Northeast China; Shandong and Jiangsu in the East Coast; Henan, Hubei, and Hunan in Central China; and Guangxi and Guizhou in Western China. Thus, the survey covers all levels of socio-economic development in China (Fig. 1). As socio-economic factors have a potential impact on nutritional status, dietary patterns and NCD prevalence( Reference Liu, Fang and Zhao 15 , Reference Mukhopadhyay and Thomassin 28 , Reference Dai, Sriboonchitta, Zi, Van-Nam, Vladik and Songsak 29 ), China was divided into four major regions for further analysis in the present study.
Provinces selected in the China Health and Nutrition Survey (CHNS): Heilongjiang and Liaoning in Northeast China; Shandong and Jiangsu in the East Coast; Henan, Hubei and Hunan in Central China; Guangxi and Guizhou in Western China. ![]() , Provinces selected in the CHNS;
, Provinces selected in the CHNS; ![]() , provinces not selected in the CHNS. Source: China Health and Nutrition Survey(
20
) (http://www.cpc.unc.edu/projects/china/about/proj_desc/chinamap).
, provinces not selected in the CHNS. Source: China Health and Nutrition Survey(
20
) (http://www.cpc.unc.edu/projects/china/about/proj_desc/chinamap).

Collection of dietary intake data
In the CHNS, dietary intake assessment is performed using a combination of three consecutive 24 h recalls at the individual level and a food inventory at the household level carried out over the same 3 d period( Reference Batisa, Sotres-Alvareza and Gordon-Larsen 30 ). Household food consumption was determined using a weighing technique. All foods (including edible oils) remaining after consumption of the last meal before initiation of the survey were weighed and their weights recorded. Foods that were brought into the household unit during the three survey days were weighed. Preparation waste was estimated when weighing was not possible. All the remaining foods were weighed and their weights recorded again at the end of the survey( 20 ).
Individual dietary recall data were collected from every household member over three consecutive days that were randomly allocated. Individual dietary intake data were collected by asking each household member (expect children aged < 12 years) to report all foods consumed at home or away from home over the previous 24 h. Details regarding the types and amounts of foods consumed, type of meal consumed and place of consumption of all food items during the previous day were recorded by trained field interviewers using food models and picture aids( 20 ). The amount of each dish was estimated from the household inventory and the proportion of each dish consumed was reported by each person interviewed( Reference Zhai, Du and Wang 31 ).
The quality of data collection was checked by comparing individual dietary intake based on 24 h recall data with an individual's average daily dietary intake calculated from the household survey. Discrepancies in data collected were resolved by revisiting the households and estimating their food consumption again at both the household and individual levels. Overall, over 99 % of the sample was available for all the 3 d of data collection; only in a few cases did the participants miss a day because of absence. Moreover, data quality control was ensured by giving high-standard training to the field interviewers, which involved training for at least 3 d in the collection of dietary intake data( 20 ). Initial data cleaning was done in the CHNS, which included deletion of duplicate records, deletion of blank recodes and recoding out-range values to missing status( 20 ).
Calculations based on the Chinese Food Composition Table
The mean daily energy intake (kcal), carbohydrate intake (g), fat intake (g) and protein intake (g) values were obtained from the dietary intake data collected in the CHNS, which were derived from the Chinese Food Composition Table( Reference Yang, He and Pan 32 ). The energy value of a food is the sum of values of all energy-producing nutrients, i.e. carbohydrate, protein and fat (not including alcohol), multiplied by the corresponding energy conversion factor (1 g = 4 kcal for carbohydrate, 1 g = 4 kcal for protein and 1 g = 9 kcal for fat). As kJ is more commonly used in nutrition research, kcal was converted to kJ for further calculation (1 kcal = 4·18 kJ)( Reference Yang, He and Pan 32 ).
The MUFA:SFA ratio was also calculated based on the Chinese Food Composition Table. MUFA and SFA values for each food are available in the Food Composition Table( Reference Yang, He and Pan 32 ). Individual daily intake value for each food item was obtained from the dietary intake data( Reference Wang, Wang and Zhang 33 ). Average daily monounsaturated and saturated fat intakes for each individual were calculated using 24 h recall data in conjunction with the Chinese Food Composition Table. Previous evidence has shown that the Mediterranean diet can reduce the risk of NCD and certain cancers( Reference Esposito, Maiorino and Di Palo 34 , Reference Mitrou, Kipnis and Thiébaut 35 ), with a MUFA:SFA ratio >1·6 being one component of adherence to the Mediterranean diet. Therefore, a MUFA:SFA ratio >1·6 was used as the cut-off point to evaluate whether individuals had a high MUFA:SFA ratio.
Chinese Dietary Reference Intake standard
Chinese DRI have been used as a standard to determine the recommended dietary intake levels for Chinese people( 19 ). According to the DRI for Chinese residents, the adequate intake of carbohydrate should account for 55–65 % of total energy (carbohydrate-energy percentage); the recommended nutrient intake of protein should account for 15 % of total energy (protein-energy percentage); and the adequate intake of fat should account for 20–30 % of total energy (fat-energy percentage). The DRI cut-point method was used to estimate whether the macronutrient intake levels of Chinese people met the recommendations (adequate intake for carbohydrate and fat and recommended nutrient intake for protein).
Other variables
Height and weight were measured directly, based on a standard protocol recommended by the WHO, by trained health workers. Weight in lightweight clothing was measured to the nearest 0·01 kg on a calibrated beam scale, and height was measured to the nearest 0·1 cm without shoes using a portable stadiometer( 20 ). BMI was calculated using the following formula( Reference Chen and Lu 36 ): weight in kg/(height in m)2, and divided into four categorical levels based on the WHO suggestion for Chinese, which are underweight: BMI < 18·5 kg/m2; normal: BMI 18·5–23·9 kg/m2; overweight: BMI 24·0–27·9 kg/m2; and general obesity: BMI ≥ 28·0 kg/m2( Reference Chen and Lu 36 ). Education level was recoded into four categories based on six education categories in the questionnaire: illiteracy; low: primary school; medium: lower middle school; high: upper middle school, technical school and college/university. Work status was divided into two levels based on the answer to the question ‘Are you presently working?’ The urbanicity index was used instead of urban/rural measurement as this measurement is based only on an absolute threshold of population and/or population density( Reference Yan, Li and Li 37 ). Urbanicity is defined by a multidimensional twelve-component urbanisation index, which captures population density and physical, social, cultural and economic environments, which has been explained in previous studies( Reference Yan, Li and Li 37 , Reference Jones-Smith and Popkin 38 ). Tertiles of the urbanisation index were used to define low, medium and high urbanicity in the present study.
Statistical analysis
Data analysis was carried out using the statistical/data analysis package STATA/SE 13.1 (STATA; StataCorp). Average total macronutrient intakes are reported as means and standard deviations, with data distribution being indicated with standard deviation. Margin plots were used to demonstrate macronutrient-energy intake for the three levels of urbanicity across the four regions of China. The χ2 test was used to assess the association between the different levels (below, meeting and above the recommendations) of DRI for macronutrients and age groups, sex, education level, work status, BMI groups, urbanicity levels and the four regions of China. ANOVA were used to assess whether any association existed between relative macronutrient intakes and these predictor factors. Univariate and multivariable linear regression models were used to explore the association between macronutrient intakes and these predictor factors.
Results
Information regarding the 2746 (1300 men and 1446 women) participants aged ≥ 60 years included in the present study was obtained from data collected in the CHNS 2009. Of these participants, 57 % (n 1564) were aged 60–69 years and 43 % (n 1182) were aged ≥ 70 years. The total number of participants living in the Northeast, East Coast, Central and Western regions was 485 (17·7 %), 674 (24·5 %), 862 (31·4 %) and 725 (26·4 %), respectively.
Total energy and macronutrient (carbohydrate, protein and fat) intakes, energy from macronutrients (%) and MUFA:SFA ratios of the participants, classified by age groups, sex, urbanicity levels, BMI groups, education levels, work status and the four socio-economic regions of China, are summarised in Table 1.
Total energy and macronutrient intakes, energy from macronutrients and MUFA:SFA ratios of the participants (Mean values and standard deviations)

Total energy, carbohydrate, protein, and fat intakes and MUFA:SFA ratios
In general, older people who were aged 60–69 years had higher total energy and macronutrient intakes than those who were aged ≥ 70 years. Males had higher total energy and macronutrient intakes than females (Table 1).
As shown in Table 1, people living in low-urbanicity areas had higher total energy and carbohydrate intakes than those living in high- and medium-urbanicity areas. People living in the East Coast region had the highest energy intakes, while those living in the Western region had the lowest total energy and carbohydrate intakes. People with a higher BMI had lower total carbohydrate intakes. People with low and medium education levels had higher carbohydrate intakes than those who were illiterate and with high education levels. Older people with a job had higher total carbohydrate and protein intakes, but did not have higher total fat intakes (Table 1).
Compared with energy and carbohydrate intakes, an inconsistency was observed in total protein and fat intakes. Older people living in high-urbanicity areas had higher total protein and fat intakes than people living in low- and medium-urbanicity areas. People living in the Western region had the lowest total protein and fat intakes, while those living in the East Coast region had the highest protein and fat intakes. People with a higher BMI had higher total fat intakes. Older people with medium education levels had the highest total protein and fat intakes (Table 1).
The MUFA:SFA ratios were stable across the four socio-economic regions of China, ranging from 1·3 to 1·5 (Northeast: 1·4, East Coast: 1·4, Central: 1·3, and Western: 1·5). As a MUFA:SFA ratio >1·6 was considered to be the standard, the average MUFA:SFA ratios were lower than our standard. Only one-fifth of the older people had a higher MUFA:SFA ratio (>1·6) across the four regions of China.
Energy from carbohydrate, protein and fat (relative carbohydrate, protein and fat intakes,%)
As shown in Table 1, among older Chinese people, there were large variations in relative carbohydrate, protein and fat intakes across different urbanicity levels and across the four regions of China.
People living in low-urbanicity areas had higher relative carbohydrate intakes than those living in medium- and high-urbanicity areas; people living in the Western region had the highest intakes and those living in the East Coast region had the lowest intakes. Compared with relative carbohydrate intakes, an opposite trend was observed for relative protein and fat intakes. People living in medium- and high-urbanicity areas had higher fat intakes than those living in low-urbanicity areas; people living in the East Coast region had the highest relative protein and fat intakes, while those living in the Western region had the lowest fat intakes (Table 1).
As large variations existed in relative macronutrient intakes across the urbanicity levels and across the four regions of China, the difference in relative macronutrient intakes among the three levels of urbanicity within the four regions was assessed (Fig. 2). After generating margin plots (with 95 % CI), it was found that people living in the high-urbanicity areas of the East Coast region had the lowest relative carbohydrate intakes (47 %, n 297), while those living in the low-urbanicity areas of the Western region had the highest relative carbohydrate intakes (62 %, n 532). Among people living in high-urbanicity areas in the four socio-economic regions of China, those living in the Northeast region had the highest relative carbohydrate intakes (55 %, n 210).
Relative macronutrient intakes by urbanicity levels across the four regions. Sample size: n 2746. (a) Carbohydrate, (b) protein and (c) fat. ![]() , Low;
, Low; ![]() , medium;
, medium; ![]() , high.
, high.
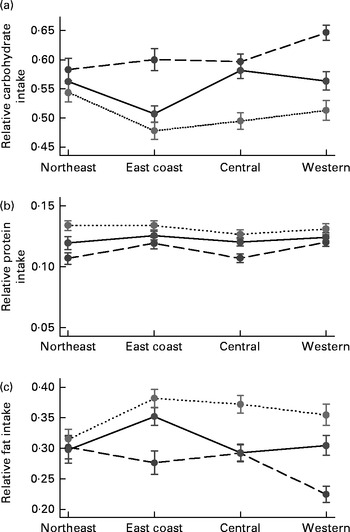
The average relative protein intake was less than 15 % across the urbanicity levels in China (Table 1). There was not much difference in relative protein intakes among the different urbanicity levels across the four regions of China, with intakes ranging from 11 to 13 %. People living in high-urbanicity areas had much higher relative fat intakes than those living in low- and medium-urbanicity areas across the East Coast, Central and Western regions, but not in the Northeast region. The greatest difference among the different urbanicity levels was observed in the Western region and the smallest difference in the Northeast region (Fig. 2).
Percentage of older people with intake levels meeting the Dietary Reference Intakes
The percentage of older people with relative macronutrient intake levels meeting, below and above the DRI, classified by age groups, sex, BMI groups, education levels, work status, urbanicity levels and the four socio-economic regions of China, is shown in Fig. 3.
Percentage of older people with intake levels meeting (![]() ), below (
), below (![]() ) and above (
) and above (![]() ) the Dietary Reference Intakes (DRI) for macronutrients: (a) carbohydrate; (b) protein; (c) fat. * The χ2 test was used examine the association between the three levels of meeting the DRI and age groups, sex, BMI groups, education levels, work status, urbanicity levels and the four socio-economic regions of China (P< 0·005).
) the Dietary Reference Intakes (DRI) for macronutrients: (a) carbohydrate; (b) protein; (c) fat. * The χ2 test was used examine the association between the three levels of meeting the DRI and age groups, sex, BMI groups, education levels, work status, urbanicity levels and the four socio-economic regions of China (P< 0·005).
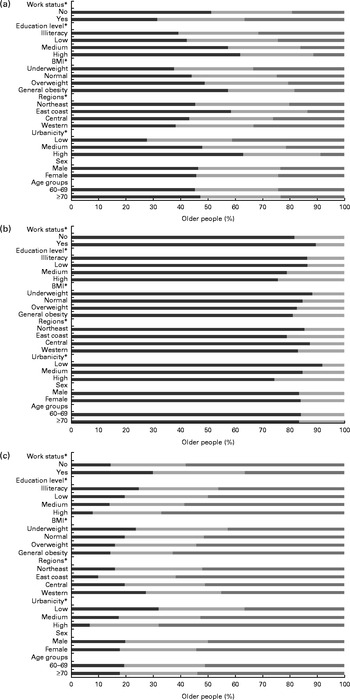
Less than one-third of the older Chinese people included in the present study had relative carbohydrate and fat intakes that met the DRI and less than one-fifth had relative protein intake levels that met the DRI. Across the four regions of China, more than four-fifths of the older people had lower relative protein intakes and none had higher relative protein intakes. Moreover, more than 50 % of the older people had higher relative fat intakes (Fig. 3).
There were no significant differences in the percentage of older Chinese with relative macronutrient intake levels meeting, below or above the DRI with respect to different age groups (carbohydrate: P= 0·6, protein: P= 0·65, and fat: P= 0·41) and sex (carbohydrate: P= 0·88, protein: P= 0·66, and fat: P= 0·08). However, there were significant differences in the percentage of older Chinese with intake levels meeting the recommended macronutrient intake percentage (from DRI) with respect to different urbanicity levels, regions, BMI groups, education levels and work status (P< 0·005).
Linear regression models
As differences existed in relative macronutrient intakes across the urbanicity levels, socio-economic regions, BMI groups, education levels and work status, the association between relative macronutrient intakes and these predictor factors was assessed using linear regression models. Both univariate and multivariate model analyses were conducted, and results are presented in Table 2. As shown in Fig. 4, total carbohydrate-energy, protein-energy and fat-energy intakes by sex were normally distributed. As MUFA:SFA ratios tended to be stable by different predictor variables (Table 1), they were not included in further analysis.
Results of linear regression model analyses for the relative contribution of macronutrients, classified by predictor factors (Coefficients and 95 % confidence intervals)

Ref, reference.
* The final multivariable models were adjusted for age groups, sex and BMI groups for carbohydrate, for age groups, sex, BMI groups and work status for protein, and for age groups and BMI groups for fat.
Distribution of total (a) carbohydrate-energy, (b) protein-energy and (c) fat-energy intakes by sex. ![]() , Density;
, Density; ![]() , normal carbohydrate-energy intake;
, normal carbohydrate-energy intake; ![]() , normal protein-energy intake;
, normal protein-energy intake; ![]() , normal fat-energy intake.
, normal fat-energy intake.

There were no statistically significant differences in relative carbohydrate intakes between the age groups (P= 0·28, 95 % CI − 1·51, 0·44) and sexes (P= 0·81, 95 % CI − 0·84, 1·09) in the univariate model. The final multivariable regression model revealed strong associations between relative carbohydrate intakes and work status (P< 0·001, 95 % CI 2·16, 4·38), education levels (P< 0·01), urbanicity levels (P< 0·001) and the four socio-economic regions of China (P< 0·001). Compared with older people who were not working, people undertaking paid work had a 3·3 % higher relative carbohydrate intake (P< 0·001, 95 % CI 2·16, 4·38). Compared with people who were illiterate, people with low, medium and high education levels had a lower relative carbohydrate intake (P< 0·01). Older people living in low-urbanicity areas had an 8·1 % higher relative carbohydrate intake than those living in high-urbanicity areas, which was statistically significant (P< 0·001). Compared with older people living in the East Coast region, people living in the Northeast, Central and Western regions of China had higher relative carbohydrate intakes (4·7, 3·3 and 5·4 % higher, respectively).
No statistically significant differences were found in relative protein intakes between sexes, BMI groups and age groups (P>0·05). However, there were strong associations between relative protein intakes and urbanicity levels, education levels, work status and the four socio-economic regions of China. Older people living in low- and medium-urbanicity areas had lower relative protein intakes than those living in high-urbanicity areas (P< 0·001). Compared with people who were illiterate, those with low, medium and high education levels had higher relative protein intakes. Compared with older people living in the East Coast region, those living in the Central or Northeast region had lower relative protein intakes, which were 0·6 and 0·8 % lower. Older people living in the Western region had only a 0·03 % higher intake, which was not statistically significant (P= 0·84, 95 % CI − 0·29, 0·35).
There were no statistically significant differences in relative fat intakes between the age groups (P= 0·06, 95 % CI − 0·04, 1·92). However, associations were found between relative fat intakes and sex, BMI groups, urbanicity levels, work status, education levels and the four socio-economic regions of China. In the final linear regression model, the relative fat intakes of older women were found to be 1·4 % higher than those of older men (P= 0·01, 95 % CI 0·35, 2·35); older people with a job had lower relative fat intakes than those with no job (P< 0·001, 95 % CI − 4·97, − 2·67); compared with older people who were illiterate, those with low, medium and high education levels had higher relative fat intakes (1·5, 3·3 and 2 %, respectively); older people living in medium- and low-urbanicity areas had 6·3 and 3·3 % lower relative fat intakes than those living in high-urbanicity areas. Compared with those living in the East Coast region, there were statistically significant differences in the relative fat intakes of older people living in the Northeast, Central and Western regions (P< 0·01).
In summary, statistically significant associations were observed between the relative intakes of the three macronutrients and education levels, urbanicity levels and socio-economic regions. Although BMI exhibited statistically significant associations with relative carbohydrate and fat intakes in the univariate model, these associations were not statistically significant in the final multivariable linear regression model when other predictor variables were included in the model. Older people who were illiterate and living in low-urbanicity areas had higher relative carbohydrate intakes but lower relative protein and fat intakes. Compared with older people living in the East Coast region, people living in the Northeast, Central and Western regions had higher relative carbohydrate intakes, but an opposite trend was observed for relative protein and fat intakes.
Discussion
Few older people included in the present study had carbohydrate and protein intake levels that met the DRI and more than half of the older people had fat intake levels that exceeded the recommended levels. Moreover, there were significant differences in the relative intakes of the three macronutrients according to education levels, urbanicity levels and the four socio-economic regions of China.
In the present study, the greatest variation in macronutrient intakes was observed in people with intake levels that met the energy recommendation for carbohydrate and fat, while the least variation was observed in those with intake levels that met the energy recommendation for protein. The variation in macronutrient intakes by urbanicity levels and across the four socio-economic regions of China may be due to economic growth, modernisation, urbanisation and agri-food system globalisation. These factors can affect eating habits and potentially result in an increased prevalence of obesity and NCD in different regions of China( Reference Mukhopadhyay and Thomassin 28 , Reference Dai, Sriboonchitta, Zi, Van-Nam, Vladik and Songsak 29 , Reference Reynolds, Gu and Whelton 39 ). The increasing number of NCD cases will no doubt put a further drain on the health systems and raise the economic costs of prevention and treatment of NCD in China( Reference Zhao, Zhai and Hu 40 , Reference Popkin, Kim and Rusev 41 ).
The most interesting finding was recorded for fat intakes in the present study. More than 50 % of the older Chinese people had relative fat intakes higher than those recommended, with women having higher fat intakes than men. Fat intake percentages were also higher in people living in higher-urbanicity areas than in those living in low- and medium-urbanicity areas. The MUFA:SFA ratio was not high, with only one-fifth of the older people having a high MUFA:SFA ratio (>1·6). Total fat intakes and total fat-energy were high and MUFA:SFA ratios were low, which indicates that older people have a higher risk of overweight and obesity, particularly women and also those living in high-urbanicity areas. Previous studies have shown that the prevalence of overweight and obesity is higher in women than in men and that the prevalence of overweight and obesity is higher in people living in urban areas than in those living in rural areas across the whole of China( Reference Yu, Lin and Haas 17 , Reference Reynolds, Gu and Whelton 39 ). A recent study from the CHNS, comparing older people (aged ≥ 60 years) living in two provinces in Eastern China and two provinces in Western China, has shown that people living in the Eastern regions and in urban areas are more likely to be overweight or obese when compared with those living in the Western regions and rural areas( Reference Kun, Liu and Pei 16 ). Women have a higher life expectancy and an increased risk of obesity and NCD compared with men in China( 42 ). Therefore, women may need to spend more on health to maintain a better quality of life. In addition, diet and exercise interventions are extremely important for preventing obesity and NCD( Reference Wyness 43 , Reference Lambers, Laetghem and Acker 44 ). Older women who are living in high-urbanicity areas may benefit from health education, diet and exercise interventions. Targeted screening for risk factors may also help to reduce the number of NCD cases in China.
Although there are some studies that have been conducted to evaluate nutritional status and nutrition transition( Reference Cui and Dibley 14 , Reference Liu, Fang and Zhao 15 ), the present study is the first to assess the macronutrient intake status of older Chinese people (aged ≥ 60 years) across three levels of urbanicity in four regions of China. A study from the CHNS has examined the trends in dietary energy, fat, carbohydrate and protein intakes among Chinese children and adolescents from 1991 to 2009 and demonstrated that the daily proportion of energy from protein and fat has increased steadily. The proportion of energy from protein and fat had increased to 13·1 and 30 %, respectively, in 2009. In addition, the daily carbohydrate intake and proportion of energy from carbohydrate had declined steadily, with reductions to 254·1 g and 56·8 % in 2009( Reference Cui and Dibley 14 ). In the present study, the proportions of energy from carbohydrate, protein and fat were 56·1, 11·9 and 30·6 %, respectively, in the older people. It can be seen that the macronutrient intakes among older people and children in China were quite similar in 2009.
In the present study, compared with people who were illiterate, people with medium and high education levels were found to have lower relative carbohydrate intakes, higher relative protein intakes and higher relative fat intakes, indicating that education levels affect the prevalence of NCD. Evidence from previous studies has also shown that there are strong associations between education levels and NCD prevalence( Reference Dalstra, Kunst and Borrell 45 – Reference Marengoni, Anglemana and Melisa 47 ). Although macronutrient intake is one of the important factors affecting the prevalence of NCD, education levels can also potentially affect macronutrient intake and eating habits.
Data collected in the CHNS 2009 were used to carry out a cross-sectional analysis in the present study. Individual, consecutive food records collected over 3 d, in addition to food weighing, were used in the CHNS to assess food and nutrient intakes, providing a more accurate estimate of individual intake than 24 h food records. This method has also been used in another study carried out in China( Reference Shi, Hu and Yuan 48 ).
Findings from the present study provide important insights into the macronutrient intake status of older Chinese people. The different macronutrient intakes observed across urbanicity levels in the four socio-economic regions suggest that there are considerable variations in dietary patterns, which may affect the risk factors for NCD. In addition, the different intakes observed across different socio-economic regions suggest that health prevention and clinical interventions will need to be tailored towards different regional contexts for programmes to be effective or successful at reducing the risk of NCD. Although alcohol is one of the macronutrients to provide energy, only one-quarter of the older Chinese people included in the present study consumed alcohol in the previous year. Thus, alcohol consumption was not included in the analysis in the present study.
The strengths of the present study include the use of individual, consecutive 3 d recall methods to improve the accuracy of recall and hence analysis and results( Reference Shi, Hu and Yuan 48 ). Examination of macronutrient intakes over four diverse socio-economic regions of China allowed a more detailed, contextual analysis to be undertaken for a large sample of older Chinese people in two age cohorts. Moreover, the use of the urbanicity index helped to capture details of population density and physical, social, cultural and economic environments rather than only an absolute threshold of population and/or population density based on the urban/rural measurement. However, some limitations may apply. The cross-sectional design does not enable analysis of macronutrient intake transitions over time. In addition, the CHNS does not present national data; therefore, the westernmost region of China was excluded from the present study. Although physical activity levels should be considered when comparing DRI, the CHNS does not measure physical activity levels in these populations. Therefore, we were unable to analyse macronutrient intakes based on different physical activity levels. The inclusion of physical activity data in future nutritional surveys would increase the usefulness of research for clinical applications. However, these limitations do not affect the significance of the study results. In the present study, to a large extent, diverse macronutrient intakes were observed among older Chinese people, providing important information for preventive health strategies for NCD.
Conclusion
In the present study, data collected in the CHNS 2009 were used to carry out a cross-sectional analysis for evaluating the macronutrient (carbohydrate, protein and fat) intake status of older Chinese people ( ≥ 60 years) in four regions of China. Few people were found to have carbohydrate, protein and fat intake levels that met the DRI. Most of the people had high fat intakes, particularly those living in high-urbanicity areas. Furthermore, there were strong associations between macronutrient intakes and different urbanicity levels and the four socio-economic regions of China. The present study provides important evidence that can inform policy makers in making DRI recommendations and help prevent NCD in older Chinese people. In addition, the different macronutrient intakes associated with different urbanicity levels across the four socio-economic regions indicates that there are considerable variations in dietary patterns, which may affect the incidence and prevalence of NCD. Therefore, clinical interventions and health policies for older people should be recognised and adapted to regional contexts to maximise success.
Acknowledgements
The authors thank the National Institute of Nutrition and Food Safety, the Chinese Center for Disease Control and Prevention, the Carolina Population Center (5 R24 HD050924), the University of North Carolina at Chapel Hill, the NIH (R01-HD30880, DK056350, R24 HD050924, and R01-HD38700), and the Fogarty International Center, NIH, for providing financial support for collecting CHNS data and analysis files from 1989 to 2011 and conducting future surveys and the China–Japan Friendship Hospital, Ministry of Health, for providing support for conducting the CHNS 2009. They also thank the University of Newcastle, Australia, for funding X. X.'s scholarship in gender, health and ageing research and for providing assistance to carry out the present analysis, which is part of the requirement for her PhD studies. The present study was supported by the infrastructure and staff of the Research Centre for Gender, Health and Ageing, who are members of the Hunter Medical Research Institute. They also thank Cassie Curryer, Research Centre for Gender, Health and Ageing, for providing assistance with editing.
The authors’ contributions are as follows: X. X. conducted the analyses and wrote the manuscript; J. E. B., Z. S. and J. J. H. provided guidance to carry out the data analysis and reviewed the manuscript. All authors approved the final version of the manuscript.
None of the authors has any conflicts of interest to declare.


