Introduction
Amyotrophic lateral sclerosis (ALS) is a neurodegenerative disease that targets upper motor neurons (UMNs) and lower motor neurons. The clinical diagnosis of ALS is based on the El Escorial revised clinical and electrophysiological criteriaReference Brooks, Miller, Swash and Munsat1; however, these criteria have low sensitivity for distinguishing patients with ALS (56%). The accurate diagnosis is further complicated by its phenotypic variability and confounded with several neurological conditions that mimic ALS.Reference Guennoc, Camu and Corcia2 Diagnostic sensitivity is improved by use of the Awaji criteria,Reference de Carvalho, Dengler and Eisen3 which require special-needle electromyography of at least two muscles that are innervated by the cervical spinal cord, two muscles in the lower limbs, and one muscle in each of the bulbar and thoracic paraspinal regions. Sensitivity of this method was 78% in a large Chinese cohort.Reference Li, Liu and Cui4 Although the Awaji criteria are generally useful for the analysis of lower motor neuron abnormalities, the detection of UMN abnormalities with methods such as transcranial stimulation requires further investigationReference Guennoc, Camu and Corcia2 and should be supported by new UMN biomarkers.
After its first description by Charcot, numerous studies have investigated whether ALS degeneration is anterograde, initiating in superior motor neurons, or retrograde, first affecting alpha motor neuron bodies or inferior motor neurons in the brainstem and ventral horn of the spinal cord. The early loss of general fine motor control and thenar function in ALS, which depends on an important corticomotoneuronal contingent, suggests that degeneration begins in the primary motor cortex.Reference Eisen and Weber5 The “dying-forward” hypothesis, which states that corticomotoneurons are the first affected neurons in ALS, is supported by transcranial magnetic stimulation studies invariably demonstrating UMN involvement as a subclinical, preclinical, and early feature in ALS.Reference Kiernan, Vucic and Cheah6 Yet, defenders of the “dying-back” theory have observed that synaptic denervation precedes the onset of motor neuron degeneration. Moreover, the neurophysiological criteria of ALS are based on the signs of denervation. There are insufficient strategies for exploring the pyramidal tract to inform early ALS pathology, underscoring a need for UMN biomarkers.
The present research evaluates a potential cortical magnetic resonance imaging (MRI) marker of ALS. In previous decades, MRI has been used minimally in patients with ALS, for example, to rule out compression at the level of the craniocervical junction as well as cerebral and brainstem lesions. Today, MRI offers a myriad of potential biomarkers. MR spectroscopy measures the peaks of neuronal metabolites such as N-acetyl aspartate (NAA) and metabolite ratios such as NAA/creatine. This last ratio is increased within 3 weeks after initiating riluzole therapy.Reference Kalra, Arnold and Cashman7 Moreover, diffusion tensor imaging (DTI) now allows the quantitative measurement of the magnitude and directionality of diffusion of water molecules in 3D space, although these measurements are still dependent on the skill of the operator. The sensitivity and specificity of DTI for detecting ALS-related changes in the corticospinal tract are 0.81 and 0.70, respectively, whereas combination of this biomarker with spectral GABA in MR spectroscopy achieves specificity of 0.86 and an area under the curve (AUC) of 0.93.Reference Foerster, Carlos and Dwamena8 Another disease-sensitive MRI pattern in motor regions of the brain is voxel-based volumetry of precentral gray matter, primarily in the dominant hemisphere.Reference Grolez, Moreau and Danel-Brunaud9 Conventional brain MRI performed in patients with ALS revealed hyperintensity in the corticospinal tracts on T2 and proton density sequences. One of the first reports to document this phenomenon identified paramagnetic effects on T2-weighted MRI colocalized with iron deposits revealed by Perls staining in six postmortem ALS brains.Reference Oba, Araki and Ohtomo10 The dark gyriform line of hypointensity in the motor cortex was related to hyperintensity in the semioval centers seen on a magnetization transfer sequence, although this was a less specific finding.Reference Alvarez-Uría Tejero, Sáiz Ayala, Fernández Rey, Santamarta Liébana and Costilla García11 White matter hyperintensity along the corticospinal tract is nonspecific, not easily quantifiable, and has not been correlated with disease severity or the rate of disease progression. On the other hand, cortical hypointensity has been largely ignored or detected exceptionally in clinical practice.Reference Pradat and El Mendili12, Reference Chen and Shang13 Yet, cortical iron accumulation is clearly identifiable in the ALS brain, correlates with age in healthy subjects, and is detected independently of age in ALS subjects.Reference Adachi, Sato and Saito14 Cortical hypointensity on T2 MRI has also been confirmed on 7 Tesla susceptibility-weighted imaging (SWI) as a significant increase in magnetic susceptibility in the somatotopic representation of the hand and foot in the primary motor cortex. Hypointensity was further correlated with nonheme iron concentrations and clinical limb scores in the patients with ALS.Reference Costagli, Donatelli and Biagi15 Additionally, postmortem studies have identified iron deposits in the precentral cortex using Perls staining and antiferritine antibodies.Reference Adachi, Sato and Saito14–Reference Kwan, Jeong and Van Gelderen16 Among the mechanisms implicated in ALS-related iron accumulation, such as oxidant stress and neuroinflammation, the most sustainable hypothesis is the presence of an inappropriate iron ligand.Reference Ignjatović, Stević and Lavrnić17 After observing a paramagnetic effect and ribbon-shaped signal attenuation at the posterior border of the precentral gyrus in several patients with ALS, we decided to conduct a prospective study to explore the diagnostic and predictive qualities of this marker.
Materials and Methods
Subjects
The protocol was approved by institutional committees and by a government council for a grant in 2014. Patients who were screened for a clinical trial or entry into the institutional registry of ALS were invited to participate in a noninvasive MRI study to reinforce the ALS diagnosis and preclude the possibility of concomitant pathologies. Among 87 patients interviewed, 38 met the inclusion criteria. All patients provided written informed consent to participate in this study as well as the control subjects. The cohort was composed of patients with ALS who were expected to undergo a second MRI 18 months later. Visits were scheduled every 3 months. For each patient, we searched for a healthy subject of the same demographic characteristics. Eligible patients were 40–70 years old, without the need for respiratory support and had a recent and definite diagnosis of ALS as per the revised El Escorial criteriaReference Brooks, Miller, Swash and Munsat1 as well as supporting evidence from neurophysiological studies. Briefly, the criteria included lower motor neuron symptoms and pyramidal signs in three regions, which were confirmed by electromyography and nerve conduction studies. Electromyography studies evaluated the Awaji criteria or targeted signs of active disseminated denervation, while nerve conduction studies were performed to identify low-amplitude compound motor potentials.Reference de Carvalho, Dengler and Eisen3 All included patients underwent a thorough clinical examination and electrocardiography and respiratory studies such as spirometry and functional capacity scoring on the Amyotrophic Lateral Sclerosis Functional Rating Scale, revised.Reference Cedarbaum, Stambler and Malta18 Muscular strength was also assessed using the scale established by the Medical Research Council in 1943 with modifications by Daniels and Worthingham (1946) and H. Kendall and F. Kendall (1949), where 0 = no contractions, 1 = flicker or trace of contraction, 2 = partial range of motion, active movement with gravity eliminated, 3 = active movement against gravity, 4 = active movement against gravity and some resistance, and 5 = normal power.19 These evaluations place particular emphasis on the deltoids, biceps brachii, extensor carpi, and digitorum as well as the quality of prehension and fine movements, especially by the thenar group. Muscular strength findings were further supported by Manual Muscle Testing of the weakest extremities.Reference Ciesla, Dinglas, Fan, Kho, Kuramoto and Needham20
Image Acquisition
All included subjects underwent brain MRI on a Siemens SKyra 3T device (Erlangen, Germany) using a 64-channel head coil to search for paramagnetic effects in axial cuts of the bilateral motor cortex on a highly T2*-weighted sequence. The standardized sequence parameters were as followsReference Ignjatović, Stević, Lavrnić, Daković and Bačić21: repetition time = 700 ms, echo time = 35 ms, flip angle = 20°, axial slice thickness = 3 mm, spacing: 0.9 mm, and matrix size = 320 × 240. Images were normalized to a scale of 0–255 arbitrary units of signal intensity (AUSI) and stored in a picture archiving and communication system device for further viewing and sharing by the researchers who performed image interpretation and measurements.
Postprocessing
We evaluated the presence of a “black ribbon” (BR) of low signal intensity using the same technical conditions and parameters described above. Briefly, a standardized T2-weighted sequence was used to acquire fine axial image slices on the 3T device. Three independent observers used two different types of software to score the area and signal intensity in the demarcated precentral region. After analyzing the consistency of visual interpretations on DICOM-MIR and/or OSIRIX in an ordinal scale (0 = no BR, 1 = discrete BR, 2 = evident BR, and 3 = marked BR), results were validated by first analyzing the precentral images with a 3D builder software that allows the measurement of the low intensity peaks and subsequently with Image J software (U.S. National Institutes of Health, Bethesda, Maryland, USA) (Figure 1). Eight-bit gray-scale images were adjusted to brightness/contrast of 10/850. Contour detection was performed under zoom to facilitate area and intensity measurements (Figure 2A). In order to analyze signal intensity in the same region in healthy control subjects, we performed 3D reconstruction of the BR to model the most implicated ROI in axial cuts 25/33, 26/33, and 27/33; 3D reconstructions were also useful to study the somatotopic representation of iron deposits (Figure 3).
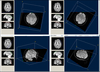
(A) Inter-rater reproducibility of signal intensity measurements in the region of interest performed by two physicians at separate institutions. Pearson’s coefficient is 0.95 (p < 0.001). (B) Relationship between visual interpretation of the black ribbon rated on a 4-point scale and signal intensity in arbitrary units (r = −0.818, p < 0.001).
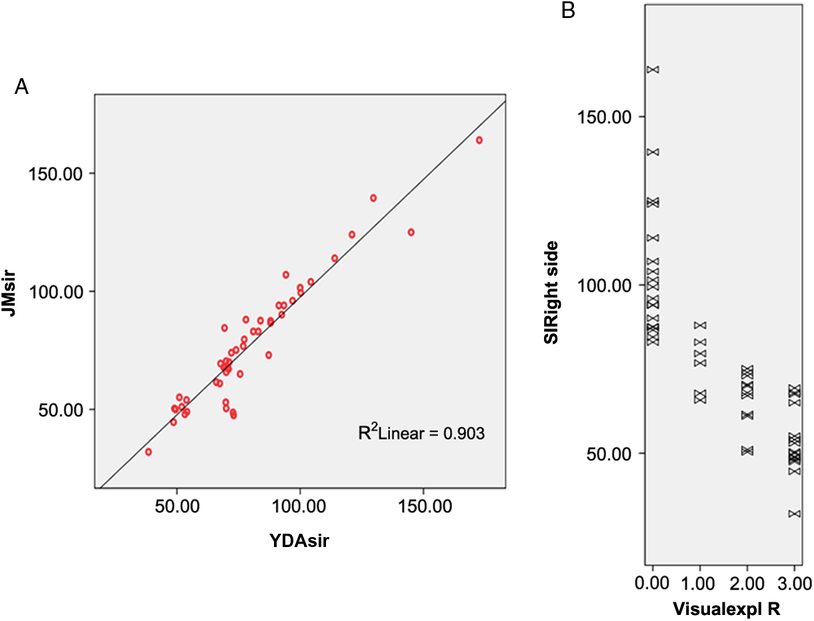
(A) Contour detection of the right “black ribbon” (BR) to measure signal attenuation. (B) Receiver operating characteristic curve of signal intensity showing an area under the curve (AUC) of 0.951.
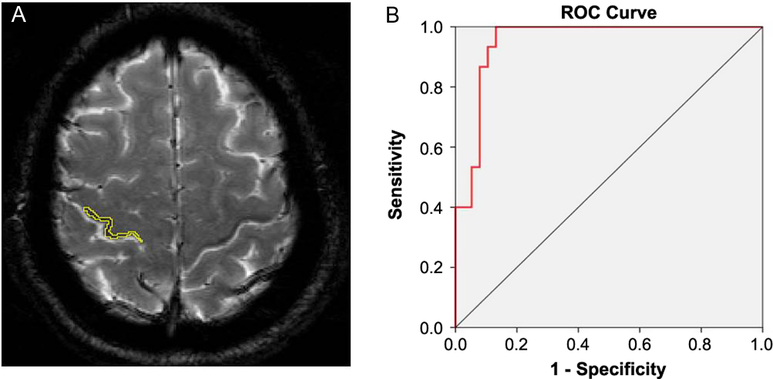
Three-dimensional view of the precentral black ribbon. This reconstruction is very useful to visualize the extent of the ribbon and its somatotopic representation.
Statistical Analysis
Data obtained from three observers, blind to clinical diagnosis, were evaluated in terms of inter-rater concordance on a simple ordinal scale characterizing the ribbon (absent, discreet, moderate, and marked) in both hemispheres. Inter-rater reliability was estimated with kappa statistics. Intra-rater concordance was calculated by the re-evaluation of 25 axial cuts that had been analyzed by the observer, 3 weeks prior. The results were finally validated by the BR area and signal measurements.
After performing a descriptive analysis of variables in each group, we compared the mean values between the ALS and control groups using t test as principal variables, signal intensities, and areas, which are normally distributed. Also, multivariate analysis was performed to identify the best radiological predictor of ALS, taking ALS diagnosis, evolution time, or functional scale as a dependent variable. p Value under 0.05 was considered statistically significant. Parametric analyses were performed to obtain data when a normal distribution was verified using Kolmogorov–Smirnov test for normality. Otherwise, nonparametric tests were applied. All statistical analyses were performed using the SPSS statistical package for Windows, version 22.0 (IBM, Chicago, Illinois).
Results
Clinical Data
Thirty-six patients with ALS participated in the study. Seventeen healthy controls responded to the invitation; one of them was discarded for having tattooed eyebrows and another for manifesting claustrophobia during the study. The ALS group included 20 men and 16 women with a mean (± standard deviation) age of 54.5 ± 8.9 years. The control group included 8 men and 7 women with a mean age of 54.4 ± 9.0 years. There were no significant between-group differences in age or gender. Clinical motor neuron disease had cervicobrachial onset in 66.66% of patients, bulbar onset in 16.66% of patients, and lower limb onset in 16.66% of patients. Other clinical characteristics such as body mass index, deterioration index,Reference Kimura, Fujimura and Ishida22 forced vital capacity by manual spirometry, and quality of lifeReference Jenkinson and Fitzpatrick23 are summarized in Table 1.
Clinical characteristics of participants
Data represent the mean (standard error of the mean). ALS = amyotrophic lateral sclerosis; ALSAQ-5 = Amyotrophic Lateral Sclerosis Assessment Questionnaire 5; ALSFRS-R = Amyotrophic Lateral Sclerosis Functional Rating Scale, revised; BMI = body mass index; FVC = forced vital capacity.
Validation Process
Twenty-nine patients with definite ALS (80.55%) exhibited a ribbon of reduced signal intensity in the posterior tier of both precentral gyri and four patients (11%) exhibited the sign unilaterally, contralateral to the affected arm. The visual observer analysis had a intra-rater and inter-rater concordance of 0.98 and 0.97, respectively, after the training period, indicating excellent consistency. Signal intensity of the BR was also significantly correlated with the ordinal scale of visual interpretation with correlation coefficients of −0.770 for the left side and −0.833 for the right side (p < 0.001) (Figure 1B). Yet, there was not so good relationship between measured BR area and visual evaluation results (Spearman’s rho coefficient = 0.370, p = 0.04) for the right side and (0.432, p = 0.01) for the left side.
BR Sign Measurement
Visual analysis of the BR yielded good intra-rater and inter-rater kappa values that ranged from 0.69 to 0.98. Visual interpretations were complemented by measurements of signal intensity in the delineated area of the sign (Figure 2A) and a ribbon model placed over the precentral region when signal attenuation was not distinguishable. A quantitative analysis of signal attenuation confirmed enhanced paramagnetic effect in 33 patients with ALS (91.66%). Patients displaying the sign presented a BR in multiple image slices (2–9 axial cuts). Inter-rater correlation for these measurements was 0.953 (p < 0.001); sample results from two observers (Y.A. and J.M.) are shown in Figure 1A. The area of hypointensity obtained by multiplying the area of each inner slice (i.e., excluding the two edges) by 3 mm yielded a mean (± standard error of the mean) area of 75.4 ± 9.0 mm3 in the left hemisphere and 84.0 ± 9.0 mm3 in the right hemisphere. The 3D reconstruction model shown in Figure 3 was used to design and position a BR paradigm ROI for further measurements, especially when the sign was discrete or invisible (e.g., in control subjects). Signal intensity under the cut-off value of 83 AUSI was able to diagnose ALS with 97% accuracy, 92% sensitivity, 93% specificity, and a predictive positive value of 0.97. The area under the receiver operating characteristic (ROC) curve of 0.95 is presented in Figure 2B.
Negative Cases and a 1-sided False Positive
As described earlier, three patients diagnosed with ALS did not exhibit the BR sign on T2* MRI. The first case was a 61-year-old woman with controlled type II diabetes, who was retrospectively diagnosed with a Vulpian-Bernhardt form of disease when dysphagia and dysphonia subsided after anxiolytic treatment. Subsequent studies also revealed cervical canal stenosis, which explained the presence of pyramidal signs in the lower limbs. The second case diagnosed 4 years earlier with a rigid-akinetic Parkinson’s disease, at the time of inclusion, presented slow slurred speech, tendency to head drop, amyotrophy and fasciculations in upper extremities and tongue, clonus and Babinski sign, and the need for strong support to get out of the wheelchair. Among other neurophysiological findings, reduction in compound motor action potential amplitude in the four extremities confirmed the diagnosis of ALS. Six months later, in the presence of urinary urgencies, a urodynamic study revealed an overactive bladder with hypertonic dyssynergia. The MRI study showed hypointensity of the putamen in T2* sequence while cisterns of the posterior fossa were widened. The diagnosis of multiple system atrophy was stated after completing the evaluation of autonomic function. The third case was a 46-year-old farmer with rapidly progressive disease who indicated that he had two siblings who had died of poliomyelitis and a 26-year-old niece from Veracruz State who used crutches to walk. The patient did not exhibit any mutations in SOD 1, C9orf72, TARDTP, or FUS upon gene sequencing.
Finally, a 57-year-old male healthy control subject displayed a discrete unilateral BR sign with borderline signal intensity. The subject reported intermittent cervical pain, and a complementary study of the cervical spine 2 months later revealed degenerative changes and normal neurological findings. The patient was subsequently referred to a spine specialist.
Relationships between Imaging Markers and Clinical Status
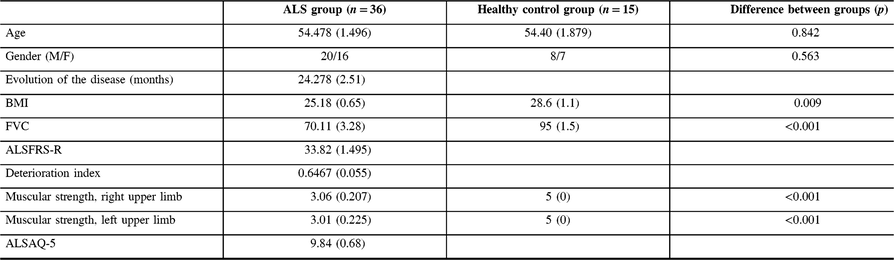
In the whole cohort, 34 subjects (33 patients and 1 control subject) exhibited the BR sign in the posterior bank of the motor cortex. A quantitative analysis confirmed that patients with ALS had significantly higher paramagnetic effect in this region, and a receiver operating characteristic analysis indicated that a cut-off value of 83 AUSI in the posterior bank of the motor cortex had an AUC of 0.95 (p < 0.001) for discriminating patients with ALS from control subjects. Additionally, there was a reliable correlation between muscle strength in the contralateral upper extremities and signal intensity of the BR (Figure 4A). Respiratory forced vital capacity and body mass index showed significant relationships with signal attenuation in the BR area with a Pearson’s coefficient of 0.355 (p = 0.036) and 0.363 (p = 0.010), respectively. Patient-scored quality of life was only correlated with deterioration index (Pearson’s coefficient = 0.506, p = 0.002). There was a marginal correlation between measured BR area and body mass index (p = 0.044), while BR signal intensities in both precentral gyri were significantly correlated with forced vital capacity (Spearman r = 0.380, p = 0.020, in the right hemisphere and r = 0.33, p = 0.047, in the left hemisphere).
(A) Relationship between signal intensity in the right black ribbon and muscle strength in the contralateral arm in all subjects. Pearson’s coefficient is 0.578 (p < 0.001). (B) Correlation between signal intensity in the right black ribbon and strength in the left arm in the ALS group. Spearman’ rho is 0.380 (p = 0.020). (C) Relationship between signal intensity in the right black ribbon and forced vital capacity Spearman’ rho is 0.376 (p = 0.026).
Longitudinal Results
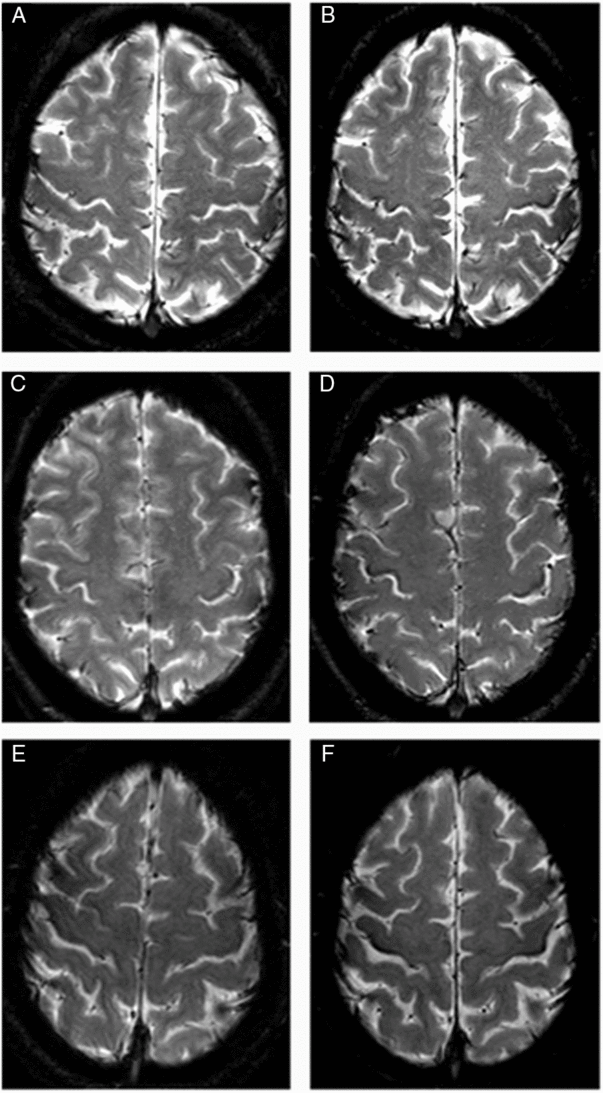
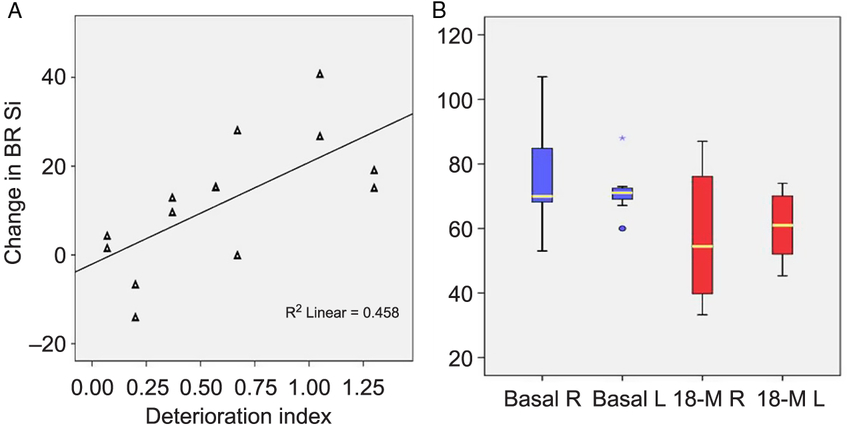
Two patients from the original cohort were further excluded for having another diagnosis, 6 subjects died during the time interval, 8 did not present themselves to the programed MRI, and 12 were dispensed due to poor tolerance of the dorsal decubitus or the use of respiratory device. Seven patients underwent a second study at 18 months follow-up. All subjects exhibited changes in BR signal intensity and area when compared with the first visit (Figure 5). Signal intensity was the most objective and sensitive variable for estimating the changes in the BR paramagnetic effect over the 18-month interval. A multivariate analysis indicated a significant change of 12 AUSI between the first and second MRI studies (F = 6.96, p = 0.014) (Figure 6B). The joint measurements of both hemispheres, before and after the 18-month interval, showed an even more significant difference from the mean values of 68.5 to 49 AUSI, 95%CI: 61.4–75.6 to 37.9–60.1 (p = 0.004). Interestingly, this difference in intensity corresponding to the elapsed period in each BR is related to the rate of deterioration of patients (rho coefficient = 0.677; r 2 = 0.458; p = 0.008) (Figure 6A). This correlation is even more important than that of Kimura’s index of deterioration with the intensities of all the initial BRs (Pearson correlation: −0.299; p = 0.053) despite the small sample of patients followed for 1 year and a half.
Six axial cuts of the brain on T2* at inclusion and 18 months follow-up. On the left: initial measurements in three patients with ALS. On the right side (B,D,F): measurements under the same conditions 18 months later. You can notice the greater attenuation of the signal after the time interval.
Changes in signal intensity after 18 months. (A) Changes are significantly correlated with the deterioration index on the left figure (p = 0.008). (B) Right and left signal intensity measurements in BR at inclusion and after 18 months. A multivariable analysis detected significant changes between the time points (f = 6.96, p = 0.014).
Discussion
To our knowledge, this is the first study to demonstrate that identification and measurement of a hypointense BR sign on axial cuts of T2-weighted MRI is a useful biomarker for discriminating classical ALS. Images were acquired with a conventional sequence on a 3T device in a quick and noninvasive manner. Visual interpretation of the BR sign had great diagnostic potential and supported an ALS diagnosis in 85% of cases. In cases where the sign was weak or questionable (six patients), the post-treatment of images using a paradigm ROI was an inexpensive and fast way to identify signal attenuation. Finally, there were significant associations between muscle strength in the contralateral upper extremity or forced vital capacity and the degree of signal attenuation in the ribbon. The sign became more pronounced over time in seven subjects who were followed-up for 18 months, suggesting that signal attenuation was associated with increased disease severity and/or duration.
Several MRI studies have described a pronounced T2* signal restriction in the primary motor cortex of patients with ALS.Reference Costagli, Donatelli and Biagi15, Reference Kwan, Jeong and Van Gelderen16, Reference Ignjatović, Stević, Lavrnić, Daković and Bačić21, Reference Schweitzer, Liu and Gupta24 In these studies, the signal was precisely attributed to iron deposits in the deep layers or at the posterior border of M1, a site of increased oxidative damage and neuroinflammatory changes in ALS.
Adachi et al.Reference Adachi, Sato and Saito14 recently described precentral hypointensity on axial susceptibility-weighted images, and this sign was also visible on conventional T2 but not on T2* images. Other authors have defended SWI as a reliable method for measuring iron content in the brain and especially in the motor cortex of patients with ALS.Reference Kwan, Jeong and Van Gelderen16, Reference Yu, Qi and Wang25, Reference Prell, Hartung and Tietz26 In the present study, SWI acquired outside of the protocol showed the BR, but it is notable that vascular branches can easily hide or confound the interpretation of this sign and the accuracy of ROI placement. In our experience, the multiecho T2-weighted sequence obtained with the parameters described in this study best delineates the hypointense BR sign and facilitates the measurement of BR signal intensity. Furthermore, T2* allows better differentiation between gray matter and white matter changes, offering an advantage for the detection of small lesions not seen on macroscopic examination such as micro-bleeds and cortical superficial siderosis defined as a characteristic curvilinear pattern of low signal.Reference De Reuck, Deramecourt and Auger27
The present study had some limitations. First, the size of the control group may have been low, as iron deposits have also been described in healthy subjects, especially in the elderly.Reference Adachi, Sato and Saito14 One control subject exhibited borderline values of signal intensity and the sign could not be identified in one patient who exhibited typical ALS according to the diagnosis put forward by two specialists in neuromuscular pathology, despite a doubtful family history. Another issue is that we did not compare our marker with markers on SWI because the study was not planned to include this sequence. Moreover, the size of the groups may have been low, but the measurements of sensitivity and specificity were first calculated with a simple visual interpretation and then by measurements of signal intensity in both hemispheres, 72 from patients with ALS and 30 from controls. This allowed us to calculate an area under the ROC curve of 0.95 that provides us a reliable index of accuracy of the BR signal intensity to discriminate patients with ALS from healthy subjects. A recent publication reported that iron-related hypointensities are a reliable marker of UMNs degeneration in ALS, especially in patients with bulbar onset.Reference Vázquez-Costa, Mazón and Carreres-Polo28 No predominance of upper or lower motor neuron syndrome was found here in the study patients as most of them had increased tendon reflexes or clonus. Muscular strength was definitely the most related variable reflecting both upper and lower MNS but most precisely related to compound motor action potential amplitudes (lower motor neuron). The limitation is that the reflexes were examined to find out in which extremities they are brisk (3+ or 4+) and the presence of Babinski, Hoffman, and/or Trömner sign. If most patients have UMN manifestations in all four limbs, we have noticed in the most affected extremities, the disappearance of the reflexes with the installation of flaccidity while the BR continues to correlate with the weakest contralateral upper limb. The participation of the UMN probably needs to be quantified more accurately in ALS, by mapping the reflexes and the recording of spasticity, including bulbar territory.
An important perspective is to further develop the sign by including patients diagnosed with possible ALS and probable ALS in order to find out if the sensitivity remains in the early stages of the disease. Signal attenuation in the BR was able to detect changes related to the deterioration index in the longitudinal arm of the study, and the sign may reflect disease progression. Therefore, it could help to stratify patients with ALS or to include less heterogeneous groups in future clinical trials to reinforce the study of the outcome measures, specifically treatment-related changes. The new iron chelators recently proposed for the diseaseReference Moreau, Danel and Devedjian29 constitute a treatment that probably modifies the iron deposits and, therefore, the BR. It would be important to measure the changes under this treatment compared with a placebo group over a period of 18 months or shorter.
Conclusion
In summary, to our knowledge, this study is the first to show such a high sensitivity in a MRI marker of ALS. Also, the BR sign seems to have an optimal specificity, since two of three negative cases were diagnosed afterward with entities mimicking ALS.
Furthermore, the BR showed a significant relationship with the loss of muscle strength and respiratory capacity. Changes in the BR after 18 months are related to the rapid evolution of the disease. This sign should be developed in larger groups of patients with other motor neuron diseases at earlier stages and also in longitudinal studies, such as clinical trials, in order to test its reliability.
Acknowledgments
The authors would like to thank Nurse Guisety who accompanied and cared for the study subjects.
Funding
This work was funded by a CONACYT (Comisión Nacional de Ciencia y Tecnología) grant [number 234154].
Disclosures
The authors have no conflicts of interest to declare.
Statement of Authorship
Conception of the work: MCB, CR, and ORMM
Acquisition analysis: MCB, Y de A, JMZ, ORMM
Interpretation of data. MCB, CR, JMZ, Y de A, and ORMM
Drafting or revising manuscript: MCB, CR, JMZ, and ORMM
Approving the final version and agree to be accountable for all aspects of the work to ensure its integrity: MCB, ORMM, CR, Y de A, and JMZ.