





1. Introduction
This paper presents a mathematical derivation of magnetic field anomalies in three dimensions induced by a tsunami generated by a slender fault. Recent field observations have shown that earthquake-generated tsunamis are able to induce a measurable modification of the Earth’s magnetic field (Toh et al. Reference Toh, Satake, Hamano, Fujii and Goto2011; Minami & Toh Reference Minami and Toh2013; Tatehata, Ichihara & Hamano Reference Tatehata, Ichihara and Hamano2015; Lin, Toh & Minami Reference Lin, Toh and Minami2021). Physically, this intriguing phenomenon is due to electromagnetic induction, whereby a conductor (seawater) that moves inside an existing magnetic field (the Earth’s) generates an electric field with associated electric currents, which in turn perturb the ambient magnetic field. The strength of this perturbation is proportional to the fluid conductivity $\sigma$
, speed
$\sigma$
, speed $u$
and length scale
$u$
and length scale $\lambda$
of the fluid motion (Galtier Reference Galtier2016). For a tsunami, the large speed
$\lambda$
of the fluid motion (Galtier Reference Galtier2016). For a tsunami, the large speed $u\sim 100\,\textrm{m s}^{-1}$
and length scale
$u\sim 100\,\textrm{m s}^{-1}$
and length scale $\lambda \sim 10^5\,\textrm{m}$
mean that the induced perturbation of the Earth’s magnetic field is strong enough to be detected by underwater geomagnetic observatories (Toh et al. Reference Toh, Satake, Hamano, Fujii and Goto2011).
$\lambda \sim 10^5\,\textrm{m}$
mean that the induced perturbation of the Earth’s magnetic field is strong enough to be detected by underwater geomagnetic observatories (Toh et al. Reference Toh, Satake, Hamano, Fujii and Goto2011).
Renzi & Mazza (Reference Renzi and Mazza2023) recently derived the underlying mathematics explaining this interesting phenomenon, using an idealised two-dimensional geometry, with one-dimensional wave propagation along the longitudinal $x$
-axis. They showed that the tsunami-induced magnetic field is made by an evanescent component, fast decaying with time soon after the occurrence of the earthquake, and a transient oscillatory component which travels away from the epicentre. This oscillatory component, in turn, is made by a self-induction and a magnetic diffusion part. The self-induction part, proportional to an Airy function, moves jointly with the tsunami. However, the diffusive part, proportional to a Scorer function, displays a phase difference with respect to the tsunami and travels ahead of it. Developing a large-time asymptotic theory, Renzi & Mazza (Reference Renzi and Mazza2023) showed that the relative importance of self-induction versus diffusive components depends on the magnetic Reynolds number,
$x$
-axis. They showed that the tsunami-induced magnetic field is made by an evanescent component, fast decaying with time soon after the occurrence of the earthquake, and a transient oscillatory component which travels away from the epicentre. This oscillatory component, in turn, is made by a self-induction and a magnetic diffusion part. The self-induction part, proportional to an Airy function, moves jointly with the tsunami. However, the diffusive part, proportional to a Scorer function, displays a phase difference with respect to the tsunami and travels ahead of it. Developing a large-time asymptotic theory, Renzi & Mazza (Reference Renzi and Mazza2023) showed that the relative importance of self-induction versus diffusive components depends on the magnetic Reynolds number,
 \begin{equation} {{R}_m}=\frac {h\sqrt {gh}}\eta , \end{equation}
where $h$
is the water depth,
$h$
is the water depth, $g$
is gravity and
$g$
is gravity and $\eta$
is magnetic diffusivity, providing a mathematical framework to interpret the observations of Toh et al. (Reference Toh, Satake, Hamano, Fujii and Goto2011), Minami & Toh (Reference Minami and Toh2013) and Zhang et al. (Reference Zhang, Baba, Linag, Shimizu and Utada2014a
).
$\eta$
is magnetic diffusivity, providing a mathematical framework to interpret the observations of Toh et al. (Reference Toh, Satake, Hamano, Fujii and Goto2011), Minami & Toh (Reference Minami and Toh2013) and Zhang et al. (Reference Zhang, Baba, Linag, Shimizu and Utada2014a
).
Propagation in two horizontal dimensions is more complex and not fully investigated mathematically. Zhang et al. (Reference Zhang, Utada, Shimizu, Baba and Maeda2014b ) developed a three-dimensional electromagnetic (EM) induction code with a heterogeneous source term, based on the modified iterative dissipative method (MIDM). Their model showed good agreement with site data concerning the 2011 Tohōku tsunami at several locations in the Pacific Ocean. Minami et al. (Reference Minami, Toh, Ichihara and Kawashima2017) developed a finite element numerical model to simulate electromagnetic fields associated with tsunamis propagating over three-dimensional space with realistic smooth bathymetry. Their model shows that close to the epicentre, a linear long wave approximation is enough to characterise the associated magnetic anomaly. However, at greater distances from the epicentre, it is essential to include dispersive effects to accurately reproduce magnetic variations.
While previous numerical studies have made noteworthy contributions, there remains a distinct need for a mathematical model to provide deeper insights into the effects of dispersion in two-horizontal dimensions (2-HD) on the tsunami and induced magnetic field. A mathematical investigation of the problem can offer a clearer understanding of how 2-HD propagation influences the dynamics of the coupled tsunami–magnetic field system. This understanding is especially critical for the future development and reliability of tsunami early warning systems (TEWSs) based on magnetic field detection.
Here, we present a novel theory for electromagnetic anomalies induced by a tsunami generated by a slender fault, i.e. a deformation of the seabed whose lateral extension $2L$
is much larger than the longitudinal scale
$2L$
is much larger than the longitudinal scale $2d$
, so that there is a natural small parameter
$2d$
, so that there is a natural small parameter $\epsilon =d/L\ll 1$
. Large tsunamis frequently originate from slender seabed ruptures, where
$\epsilon =d/L\ll 1$
. Large tsunamis frequently originate from slender seabed ruptures, where $\epsilon$
typically decreases with increasing earthquake magnitude (Mei & Kadri Reference Mei and Kadri2018; Li, Mei & Chan Reference Li, Mei and Chan2019). It is also theoretically possible for less severe earthquakes to arise from slender faults (Li et al. Reference Li, Mei and Chan2019).
$\epsilon$
typically decreases with increasing earthquake magnitude (Mei & Kadri Reference Mei and Kadri2018; Li, Mei & Chan Reference Li, Mei and Chan2019). It is also theoretically possible for less severe earthquakes to arise from slender faults (Li et al. Reference Li, Mei and Chan2019).
Mei & Kadri (Reference Mei and Kadri2018) studied the propagation of underwater sound signals generated by a slender fault using a frequency-domain approach with a multiple-scale expansion in the spatial coordinates $X=\epsilon ^2x,Y=\epsilon x$
. A similar method was later employed by Williams, Kadri & Abdolali (Reference Williams, Kadri and Abdolali2021) for acoustic-gravity waves generated by multiple slender ruptures on an elastic seabed. This approach is well suited to acoustic-gravity waves because their dynamics are governed by discrete modal wavenumbers, given by the acoustic–gravity dispersion relation (Renzi & Dias Reference Renzi and Dias2014; Renzi Reference Renzi2017; Mei & Kadri Reference Mei and Kadri2018; Williams et al. Reference Williams, Kadri and Abdolali2021). In that setting, the solution naturally decomposes into a discrete set of propagating and evanescent modes whose spatial variation is weak and accumulates only over long ranges; hence, the introduction of explicit slow spatial coordinates. Once generated, the acoustic modes propagate transoceanically without coupling to the surface gravity wave, as they travel much faster (Renzi Reference Renzi2017; Mei & Kadri Reference Mei and Kadri2018).
$X=\epsilon ^2x,Y=\epsilon x$
. A similar method was later employed by Williams, Kadri & Abdolali (Reference Williams, Kadri and Abdolali2021) for acoustic-gravity waves generated by multiple slender ruptures on an elastic seabed. This approach is well suited to acoustic-gravity waves because their dynamics are governed by discrete modal wavenumbers, given by the acoustic–gravity dispersion relation (Renzi & Dias Reference Renzi and Dias2014; Renzi Reference Renzi2017; Mei & Kadri Reference Mei and Kadri2018; Williams et al. Reference Williams, Kadri and Abdolali2021). In that setting, the solution naturally decomposes into a discrete set of propagating and evanescent modes whose spatial variation is weak and accumulates only over long ranges; hence, the introduction of explicit slow spatial coordinates. Once generated, the acoustic modes propagate transoceanically without coupling to the surface gravity wave, as they travel much faster (Renzi Reference Renzi2017; Mei & Kadri Reference Mei and Kadri2018).
In contrast, the electromagnetic anomaly associated with a tsunami is a broadband signal continuously driven by the evolving surface gravity wave (Renzi & Mazza Reference Renzi and Mazza2023); hence, a broadband approach in the wavenumber domain is more appropriate. Following the framework of Mei, Stiassnie & Yue (Reference Mei, Stiassnie and Yue2005) (Chapter 14), we adopt a two-dimensional Fourier transform in the horizontal plane and then apply the method of multiple scales in time. We introduce two slow time scales, $t_1=\epsilon t$
,
$t_1=\epsilon t$
, $t_2=\epsilon ^2t$
, anticipating that the wavefront evolution occurs on time scales much longer than the generation process itself. We show that these temporal scales are required to resolve secularities arising at
$t_2=\epsilon ^2t$
, anticipating that the wavefront evolution occurs on time scales much longer than the generation process itself. We show that these temporal scales are required to resolve secularities arising at $O(\epsilon )$
and
$O(\epsilon )$
and $O(\epsilon ^2)$
.
$O(\epsilon ^2)$
.
Using linearised potential flow theory, a double Fourier transform, to account for a broad band of wavelengths and propagation directions, and a multiple-scale perturbative approach with three timings (Michele, Renzi & Sammarco Reference Michele, Renzi and Sammarco2019), we determine the super slow evolution of the wave field and induced magnetic anomaly for transoceanic propagation at large distances from the fault. The framework is validated through comparison with deep-ocean hydrodynamic and magnetic observations from the 2011 Tōhoku-oki tsunami.
We show that lateral propagation along the main fault direction decreases the period of both the surface wave and induced magnetic anomaly with respect to a two-dimensional scenario. The initial seabed displacement generates transient waves propagating along a direction orthogonal to the fault. Over time, however, lateral propagation becomes significant, causing the wave fronts to stretch and bend, eventually spreading in all directions, though the main direction of travel remains the longitudinal one. The magnetic anomaly follows a similar pattern, but gradually separates from the tsunami, with the magnetic signal travelling ahead of the leading tsunami crest at large time. Remarkably, the distance between the leading magnetic signal and the leading tsunami crest is found to be proportional to the fault’s longitudinal scale.
Furthermore, we investigate the parametric dependence of surface wave behaviour and the induced magnetic field on lateral propagation and the magnetic Reynolds number. Our results demonstrate that increased lateral propagation diminishes the detectability of the magnetic anomaly. Finally, we derive an asymptotic formula for the magnetic anomaly associated with the leading long wave propagating ahead of the wave group. Remarkably, this formula provides highly accurate predictions, even under conditions of appreciable lateral propagation along the fault’s main axis. These findings offer valuable insights for the development of tsunami early warning systems based on the detection of magnetic precursors.
2. Mathematical model
We consider a magnetically conductive ocean layer of depth $h$
, bounded above by air and below by the seafloor. The magnetic diffusivity is
$h$
, bounded above by air and below by the seafloor. The magnetic diffusivity is $\eta =1/(\mu _0\sigma )$
, where
$\eta =1/(\mu _0\sigma )$
, where $\mu _0=4\pi \times 10^{-7}\,\textrm{N}\,\textrm{A}^{-2}$
is the permeability of free space and
$\mu _0=4\pi \times 10^{-7}\,\textrm{N}\,\textrm{A}^{-2}$
is the permeability of free space and $\sigma$
is the electrical conductivity (Wang & Liu Reference Wang and Liu2013; Minami, Toh & Tyler Reference Minami, Toh and Tyler2015). For seawater, the electrical conductivity is
$\sigma$
is the electrical conductivity (Wang & Liu Reference Wang and Liu2013; Minami, Toh & Tyler Reference Minami, Toh and Tyler2015). For seawater, the electrical conductivity is $\sigma _w\sim 2-6\,\textrm{S}\,\textrm{m}^{-1}$
, depending on salinity, while for the seafloor, typical values are of the order
$\sigma _w\sim 2-6\,\textrm{S}\,\textrm{m}^{-1}$
, depending on salinity, while for the seafloor, typical values are of the order $\sigma _s\sim 0.1\,\textrm{S}\,\textrm{m}^{-1}$
. The electrical conductivity of air is of the order of
$\sigma _s\sim 0.1\,\textrm{S}\,\textrm{m}^{-1}$
. The electrical conductivity of air is of the order of $\sigma _a\sim 1\times 10^{-15}\,\textrm{S}\,\textrm{m}^{-1}$
and, hence, it can be neglected.
$\sigma _a\sim 1\times 10^{-15}\,\textrm{S}\,\textrm{m}^{-1}$
and, hence, it can be neglected.
Within the framework of kinematic dynamo theory (Galtier Reference Galtier2016), we assume that the small perturbation of the Earth’s magnetic field associated with the tsunami has negligible influence on the oceanic flow field. Hence, the hydrodynamic and electromagnetic problems are decoupled, see Tyler (Reference Tyler2005), Wang & Liu (Reference Wang and Liu2013) and Minami et al. (Reference Minami, Toh and Tyler2015). In the following, we will first solve the mathematical problem for the tsunami and then move to the magnetic field.
2.1. Tsunami
We develop a general model for transient dispersive waves generated by slender fault on an ocean of constant depth $h$
. Set a Cartesian reference frame with the
$h$
. Set a Cartesian reference frame with the $(x,y)$
plane on the undisturbed sea surface, with the
$(x,y)$
plane on the undisturbed sea surface, with the $x$
-axis along the main propagation direction and the vertical
$x$
-axis along the main propagation direction and the vertical $z$
-axis positive upwards, with its origin at the undisturbed sea level, as sketched in figure 1. Hence, the liquid layer occupies the region
$z$
-axis positive upwards, with its origin at the undisturbed sea level, as sketched in figure 1. Hence, the liquid layer occupies the region $-h\lt z\lt 0$
, while air is located at
$-h\lt z\lt 0$
, while air is located at $z\geqslant 0$
, and the seafloor is at
$z\geqslant 0$
, and the seafloor is at $z\leqslant -h$
.
$z\leqslant -h$
.
Sketch of the system’s geometry. The slender fault has characteristic width $2d$
much smaller than its length
$2d$
much smaller than its length $2L$
.
$2L$
.

The liquid is inviscid and incompressible and the motion is irrotational. Therefore, there exists a velocity potential $\varPhi (x,y,z,t)$
such that the velocity field
$\varPhi (x,y,z,t)$
such that the velocity field $\boldsymbol {u}=\boldsymbol{\nabla }\varPhi$
, where
$\boldsymbol {u}=\boldsymbol{\nabla }\varPhi$
, where $t$
is time. Wave motion is generated by a localised seabed displacement with vertical velocity
$t$
is time. Wave motion is generated by a localised seabed displacement with vertical velocity $W(x,y,t)$
, starting at time
$W(x,y,t)$
, starting at time $t=0$
. The rise time of seabed deformation at any cross-section is typically very short, of the order of a few minutes (Li et al. Reference Li, Mei and Chan2019), which is much smaller than the time scale of tsunami propagation (Mei et al. Reference Mei, Stiassnie and Yue2005). Hence, we consider an instantaneous uplift of the seabed, whose surface is denoted by
$t=0$
. The rise time of seabed deformation at any cross-section is typically very short, of the order of a few minutes (Li et al. Reference Li, Mei and Chan2019), which is much smaller than the time scale of tsunami propagation (Mei et al. Reference Mei, Stiassnie and Yue2005). Hence, we consider an instantaneous uplift of the seabed, whose surface is denoted by $z=-h$
for
$z=-h$
for $t\leqslant 0^-$
and by
$t\leqslant 0^-$
and by $z=-h+H_0$
for
$z=-h+H_0$
for $t\geqslant 0^+$
. The function
$t\geqslant 0^+$
. The function $H_0=H_0(x,y)\ll h$
describes a slender fault of characteristic width
$H_0=H_0(x,y)\ll h$
describes a slender fault of characteristic width $2d$
along the
$2d$
along the $x$
-axis and length
$x$
-axis and length $2L$
along the
$2L$
along the $y$
-axis, with
$y$
-axis, with $\epsilon =d/L\ll 1$
. In this context, we consider scenarios where
$\epsilon =d/L\ll 1$
. In this context, we consider scenarios where $d$
is finite and
$d$
is finite and $L\in \mathbb{R}^+$
, so that the limit
$L\in \mathbb{R}^+$
, so that the limit $\epsilon =0$
corresponds to a one-dimensional wave field excited by a fault of infinite length along the
$\epsilon =0$
corresponds to a one-dimensional wave field excited by a fault of infinite length along the $y$
-axis. The present formulation is valid for an arbitrary constant water depth
$y$
-axis. The present formulation is valid for an arbitrary constant water depth $h$
and does not rely on any asymptotic relationship between depth and the horizontal length scales of the problem. The seabed vertical velocity is
$h$
and does not rely on any asymptotic relationship between depth and the horizontal length scales of the problem. The seabed vertical velocity is $W(x,y,t)=H_0(x,y)\delta (t)$
, where
$W(x,y,t)=H_0(x,y)\delta (t)$
, where $\delta (t)$
is the Dirac delta distribution.
$\delta (t)$
is the Dirac delta distribution.
A typical seabed deformation generates a tsunami with an amplitude $a\sim 1\,\textrm{m}$
in open ocean and wavelength proportional to the deformation’s scale
$a\sim 1\,\textrm{m}$
in open ocean and wavelength proportional to the deformation’s scale $d$
, usually of the order
$d$
, usually of the order $10^3{-}10^5\,\textrm{m}$
(Mei et al. Reference Mei, Stiassnie and Yue2005). Since the tsunami amplitude is much smaller than both its wavelength and the ocean depth, a linearised model can be used. Within the framework of linear potential flow theory, the velocity potential
$10^3{-}10^5\,\textrm{m}$
(Mei et al. Reference Mei, Stiassnie and Yue2005). Since the tsunami amplitude is much smaller than both its wavelength and the ocean depth, a linearised model can be used. Within the framework of linear potential flow theory, the velocity potential $\varPhi (x,y,z,t)$
must satisfy the Laplace equation in the fluid domain and associated boundary conditions on the surface and at the seabed:
$\varPhi (x,y,z,t)$
must satisfy the Laplace equation in the fluid domain and associated boundary conditions on the surface and at the seabed:
 \begin{align} &\qquad\qquad {\nabla} ^2\varPhi =0, \quad z\in (-h,0), \end{align}
 \begin{align} &\qquad\qquad\quad \frac {\partial \varPhi }{\partial z}=\frac {\partial \zeta }{\partial t}, \quad z=0, \end{align}
 \begin{align} &\qquad\qquad\, \frac {\partial \varPhi }{\partial t}+g\zeta =0, \quad z=0, \end{align}
 \begin{align} & \frac {\partial \varPhi }{\partial z}=W(x,y,t)=H_0(x,y)\delta (t), \quad z=-h, \end{align}
where $g$
is the acceleration due to gravity,
$g$
is the acceleration due to gravity, $\zeta (x,y,t)$
is the free-surface elevation and
$\zeta (x,y,t)$
is the free-surface elevation and $|\boldsymbol{\nabla }H_0|$
is sufficiently small such that second-order terms are negligible (Mei et al. Reference Mei, Stiassnie and Yue2005).
$|\boldsymbol{\nabla }H_0|$
is sufficiently small such that second-order terms are negligible (Mei et al. Reference Mei, Stiassnie and Yue2005).
2.1.1. Non-dimensionalisation
Let us now introduce the following non-dimensional variables:
 \begin{align} x= {\rm d}x',\!\quad\! y = Ly',\!\quad\! z=hz',\quad\! t=h/\sqrt {gh}\, t',\!\quad\! \varPhi =A\sqrt {gh}\,\varPhi ',\!\quad\! \zeta =A\zeta ',\!\quad\! H_0=A H_0^{\prime}, \end{align}
where $A\ll h$
is the maximum vertical displacement of the seabed. Hence, the boundary-value problem (BVP) in (2.1)–(2.4) becomes
$A\ll h$
is the maximum vertical displacement of the seabed. Hence, the boundary-value problem (BVP) in (2.1)–(2.4) becomes
 \begin{align} &\frac {\partial ^2 \varPhi '}{\partial {x'}^2}+\epsilon ^2\frac {\partial ^2\varPhi '}{\partial {y'}^2}+\beta ^2\frac {\partial ^2 \varPhi '}{\partial {z'}^2}=0, \quad z'\in (-1,0), \end{align}
 \begin{align} &\qquad\qquad\,\quad \frac {\partial \varPhi '}{\partial z'}=\frac {\partial \zeta '}{\partial t'}, \quad z'=0, \end{align}
 \begin{align} &\qquad\qquad\quad \frac {\partial \varPhi '}{\partial t'}+\zeta '=0, \quad z=0, \end{align}
 \begin{align} &\qquad\quad \frac {\partial \varPhi '}{\partial z'}=H_0^{\prime}(x',y')\delta (t'), \quad z'=-1, \end{align}
where the property $\delta (\alpha t) = \delta (t)/|\alpha |$
has been used and
$\delta (\alpha t) = \delta (t)/|\alpha |$
has been used and $\beta =d/h$
.
$\beta =d/h$
.
Since $d$
and
$d$
and $h$
are both finite,
$h$
are both finite, $\beta =O(1)$
, i.e. a finite constant independent of
$\beta =O(1)$
, i.e. a finite constant independent of $\epsilon$
. Physically,
$\epsilon$
. Physically, $\mu =1/\beta =h/d$
measures the strength of frequency dispersion, as the dominant excited wavelength is controlled by the characteristic source scale
$\mu =1/\beta =h/d$
measures the strength of frequency dispersion, as the dominant excited wavelength is controlled by the characteristic source scale $d$
(Li et al. Reference Li, Mei and Chan2019). Thus,
$d$
(Li et al. Reference Li, Mei and Chan2019). Thus, $\beta =O(1)$
(equivalently
$\beta =O(1)$
(equivalently $\mu =O(1)$
) ensures that dispersive effects are fully retained. While
$\mu =O(1)$
) ensures that dispersive effects are fully retained. While $\varepsilon$
controls the geometric slenderness of the source, dispersive effects are governed by the geometric parameter
$\varepsilon$
controls the geometric slenderness of the source, dispersive effects are governed by the geometric parameter $\beta$
, with no asymptotic coupling between the two. Finally, in (2.6), the small parameter
$\beta$
, with no asymptotic coupling between the two. Finally, in (2.6), the small parameter $\varepsilon ^2$
introduces slow propagation along
$\varepsilon ^2$
introduces slow propagation along $y'$
.
$y'$
.
To consider a broad band of spatial scales and propagation directions, we introduce the Fourier transform pair
 \begin{align} \hat {f'}\big(z',t';k^{\prime}_x,k^{\prime}_y \big)&=\frac {1}{2\pi }\int _{-\infty }^{\infty }\int _{-\infty }^{\infty } f'\big(x',y',z',t' \big)\,{\textrm{exp}}\big [-\textrm{i}\big(k_x^{\prime} x'+k_y^{\prime}y' \big)\big ]\,{\textrm{d}} x'\,{\textrm{d}} y', \\[-12pt] \nonumber \end{align}
 \begin{align} f'\big(x',y',z',t' \big)&=\frac {1}{2\pi }\int _{-\infty }^{\infty }\int _{-\infty }^{\infty } \hat {f'}\big(z',t';k_x^{\prime},k_y^{\prime} \big)\,{\textrm{exp}}\big [\textrm{i}\big(k_x^{\prime} x'+k_y^{\prime} y' \big)\big ]\,{\textrm{d}} k_x^{\prime}\,{\textrm{d}} k_y^{\prime}. \\[9pt] \nonumber \end{align}
Using (2.10), combining (2.7)–(2.8) and dropping the primes for simplicity, the BVP (2.6)–(2.9) becomes
 \begin{align} & \frac {\partial ^2\hat \varPhi }{\partial z^2}-\frac {1}{\beta ^2}\big (k_x^2+\epsilon ^2 k_y^2\big )\hat \varPhi =0,\quad z\in (-1,0), \\[-12pt] \nonumber \end{align}
 \begin{align} &\qquad\qquad \frac {\partial ^2\hat \varPhi }{\partial t^2}+\frac {\partial \hat \varPhi }{\partial z}=0,\quad z=0, \\[-12pt] \nonumber \end{align}
 \begin{align} &\qquad\qquad \frac {\partial \hat \varPhi }{\partial z}=\hat H_0\,\delta (t),\quad z=-1. \\[9pt] \nonumber \end{align}
2.1.2. Multiple-scale analysis
To investigate the effect of emerging $y$
-axis propagation at large time, we introduce the slow and super-slow times
$y$
-axis propagation at large time, we introduce the slow and super-slow times
 \begin{equation} t_1=\epsilon t,\quad t_2=\epsilon ^2 t, \end{equation}
and concurrently expand the potential in powers of $\epsilon$
,
$\epsilon$
,
 \begin{equation} \hat \varPhi (z,t,t_1,t_2;k_x,k_y)=\hat \varPhi _0+\epsilon \hat \varPhi _1+\epsilon ^2\hat \varPhi _2+O (\epsilon ^3). \end{equation}
Substituting the latter expansion into the BVP (2.12)–(2.14) and noting that
 \begin{align} \frac {\partial }{\partial t}\rightarrow \frac {\partial }{\partial t}+\epsilon \frac {\partial }{\partial t_1}+\epsilon ^2\frac {\partial }{\partial t_2}, \end{align}
we can now solve at each order of $\epsilon$
.
$\epsilon$
.
Leading order $O(1)$
Retaining only terms independent of $\epsilon$
, the BVP reads
$\epsilon$
, the BVP reads
 \begin{align} & \frac {\partial ^2\hat \varPhi _0}{\partial z^2}-\frac {k_x^2}{\beta ^2}\,\hat \varPhi _0=0, \quad z\in (-1,0), \end{align}
 \begin{align} &\quad\,\, \frac {\partial ^2\hat \varPhi _0}{\partial t^2}+\frac {\partial \hat \varPhi _0}{\partial z}=0, \quad z=0, \end{align}
 \begin{align} & \frac {\partial \hat \varPhi _0}{\partial z}=\hat H_0(k_x,k_y)\,\delta (t),\quad z=-1. \\[9pt] \nonumber \end{align}
The solution to (2.18) is
 \begin{equation} \hat \varPhi _0=A(t,t_1,t_2)\sinh \left (\frac {k_x}{\beta }z\right )+B(t,t_1,t_2)\cosh \left (\frac {k_x}{\beta }z\right )\!. \end{equation}
Substituting the latter in (2.20), we find
 \begin{equation} A = B \tanh \left (\frac {k_x}{\beta }\right )+\frac {\beta \hat H_0\, \delta (t)}{k_x \cosh \left (k_x/\beta \right )}. \end{equation}
Further substitution of (2.21) and (2.22) in (2.19) yields a differential equation for $B(t,t_1,t_2)$
, namely
$B(t,t_1,t_2)$
, namely
 \begin{equation} \frac {\partial ^2 B}{\partial t^2}+\omega ^2 B=-\frac {\hat H_0\,\delta (t)}{\cosh (k_x/\beta )}, \end{equation}
where
 \begin{equation} \omega ^2=\frac {k_x}{\beta }\tanh \left (\frac {k_x}{\beta }\right )\!. \end{equation}
This dispersion relation is valid for $\beta =O(1)$
(i.e.
$\beta =O(1)$
(i.e. $\mu =O(1)$
) and naturally contains the weakly dispersive limit
$\mu =O(1)$
) and naturally contains the weakly dispersive limit $\beta \gg 1$
(
$\beta \gg 1$
( $\mu \ll 1$
) as a special case (Mei et al. Reference Mei, Stiassnie and Yue2005).
$\mu \ll 1$
) as a special case (Mei et al. Reference Mei, Stiassnie and Yue2005).
Because of the discontinuity at $t=0$
introduced by the Dirac delta, we solve (2.23) for
$t=0$
introduced by the Dirac delta, we solve (2.23) for $t\geqslant 0^+$
. Let us now consider the initial conditions associated with (2.23). Physically,
$t\geqslant 0^+$
. Let us now consider the initial conditions associated with (2.23). Physically, $B(t=0^+)$
represents an initial pressure impulse acting on the free surface (Mei et al. Reference Mei, Stiassnie and Yue2005). Since we do not consider surface pressure perturbations, we have
$B(t=0^+)$
represents an initial pressure impulse acting on the free surface (Mei et al. Reference Mei, Stiassnie and Yue2005). Since we do not consider surface pressure perturbations, we have
 \begin{equation} B=0, \quad t=t_1=t_2=0^+. \end{equation}
Furthermore, integrating (2.23) across the delta function yields
 \begin{equation} \frac {\partial B}{\partial t}= -\frac {\hat H_0}{\cosh (k_x/\beta )}, \quad t=t_1=t_2=0^+. \end{equation}
Hence, the fluid is set into motion because of an acceleration imparted by the seabed deformation during the instantaneous uplift.
The initial-value problem (2.23)–(2.26) yields
 \begin{equation} B = a(t_1,t_2)\cos (\omega t)+b(t_1,t_2)\sin (\omega t), \end{equation}
where
 \begin{equation} a(0^+,0^+) = 0,\quad b(0^+,0^+) = -\frac {\hat H_0}{\omega \cosh (k_x/\beta )}. \end{equation}
Finally, substitution of (2.22) and (2.27) into (2.21) gives the leading order potential for $t\gt 0^+$
,
$t\gt 0^+$
,
 \begin{equation} \hat \varPhi _0 = \left [\tanh \left (\frac {k_x}{\beta }\right ) \sinh \left (\frac {k_x z}{\beta }\right )+\cosh \left (\frac {k_x z}{\beta }\right )\right ] \left [a(t_1,t_2)\cos (\omega t)+b(t_1,t_2)\sin (\omega t)\right ] \!. \end{equation}
The free-surface elevation can now be determined from (2.8) by Fourier transforming with (2.10), introducing the slow times (2.15) and expanding $\hat \zeta$
in powers of
$\hat \zeta$
in powers of $\epsilon$
. At the zeroth order, it is
$\epsilon$
. At the zeroth order, it is
 \begin{equation} \left . \hat \zeta _0=-\frac {\partial \hat \varPhi _0}{\partial t}\right |_{z=0}=\omega \left [a(t_1,t_2)\sin (\omega t)-b(t_1,t_2)\cos (\omega t)\right ]. \end{equation}
The unknown amplitudes $a(t_1,t_2)$
and
$a(t_1,t_2)$
and $b(t_1,t_2)$
, satisfying the initial conditions (2.28), are to be determined at the higher orders.
$b(t_1,t_2)$
, satisfying the initial conditions (2.28), are to be determined at the higher orders.
Note that, in the two-dimensional limit $\epsilon =0$
, the seabed deformation
$\epsilon =0$
, the seabed deformation $H_0^{\prime}$
in (2.9) is a function of
$H_0^{\prime}$
in (2.9) is a function of $x'$
only. Hence, the Fourier transform (2.10) yields
$x'$
only. Hence, the Fourier transform (2.10) yields $\hat {H}_0=\breve {H}_0(k_x)\delta (k_y)$
, where
$\hat {H}_0=\breve {H}_0(k_x)\delta (k_y)$
, where $\breve {H}_0(k_x)$
is the one-dimensional Fourier transform of
$\breve {H}_0(k_x)$
is the one-dimensional Fourier transform of $H_0$
along
$H_0$
along $x$
, and again primes are dropped for simplicity. Following the same procedure as previously, but with
$x$
, and again primes are dropped for simplicity. Following the same procedure as previously, but with $t_1=t_2=0$
, the free-surface elevation in the Fourier space is
$t_1=t_2=0$
, the free-surface elevation in the Fourier space is
 \begin{equation} \hat \zeta _0=\frac {\breve {H}_0(k_x)\delta (k_y)}{\cosh (k_x/\beta )}\cos (\omega t). \end{equation}
Inverse transform via (2.11) yields
 \begin{equation} \zeta _0(x,t)=\frac {1}{2\pi } \int _{-\infty }^{\infty } \frac {\breve {H}_0(k_x)}{\cosh (k_x/\beta )}\cos (\omega t)\,\exp (\textrm{i} k_x x)\,{\textrm{d}} k_x. \end{equation}
As expected, the free-surface elevation (2.32) is one-dimensional and corresponds to the well-known solution of Mei et al. (Reference Mei, Stiassnie and Yue2005). We now move to the higher orders of $\epsilon$
.
$\epsilon$
.
Order $O(\epsilon )$
Retaining only terms proportional to $\epsilon$
, the BVP for
$\epsilon$
, the BVP for $\hat \varPhi _1$
reads
$\hat \varPhi _1$
reads
 \begin{align} & \frac {\partial ^2\hat \varPhi _1}{\partial z^2}-\frac {k_x^2}{\beta ^2}\,\hat \varPhi _1=0, \quad z\in (-1,0)\,, \end{align}
 \begin{align} & \frac {\partial ^2\hat \varPhi _1}{\partial t^2}+\frac {\partial \hat \varPhi _1}{\partial z}=-2\frac {\partial ^2\varPhi _0}{\partial t\partial t_1}, \quad z=0\,, \end{align}
 \begin{align} &\qquad\quad \frac {\partial \hat \varPhi _1}{\partial z}=0,\quad z=-1 \,. \end{align}
Again, (2.33) gives
 \begin{equation} \hat \varPhi _1=C(t,t_1,t_2)\sinh \left (\frac {k_x}{\beta }z\right )+D(t,t_1,t_2)\cosh \left (\frac {k_x}{\beta }z\right )\!. \end{equation}
Application of the homogeneous seabed boundary condition (2.35) yields $C=D\tanh (k_x/\beta )$
. Substituting (2.21) and (2.36) into the free-surface condition (2.34) yields
$C=D\tanh (k_x/\beta )$
. Substituting (2.21) and (2.36) into the free-surface condition (2.34) yields
 \begin{equation} \frac {\partial ^2 D}{\partial t^2}+\omega ^2 D = 2\omega \left [\frac {\partial a}{\partial t_1}\sin (\omega t)-\frac {\partial b}{\partial t_1}\cos (\omega t) \right ]. \end{equation}
Now, the inhomogeneous term on the right-hand side of (2.37) contains the homogeneous solution ( $\sin (\omega t), \cos (\omega t)$
), making it a resonant forcing term. To avoid secularity, it must be
$\sin (\omega t), \cos (\omega t)$
), making it a resonant forcing term. To avoid secularity, it must be
 \begin{equation} \frac {\partial a}{\partial t_1}\sin (\omega t)-\frac {\partial b}{\partial t_1}\cos (\omega t) = 0. \end{equation}
This is possible for all $t\gt 0^+$
only if
$t\gt 0^+$
only if $a=a(t_2)$
and
$a=a(t_2)$
and $b=b(t_2)$
. Hence, the zeroth-order potential
$b=b(t_2)$
. Hence, the zeroth-order potential $\hat \varPhi _0$
(2.29) does not depend on
$\hat \varPhi _0$
(2.29) does not depend on $t_1$
. As a consequence, the BVP (2.33)–(2.35) is homogeneous. However, the homogeneous solution for
$t_1$
. As a consequence, the BVP (2.33)–(2.35) is homogeneous. However, the homogeneous solution for $t\gt 0^+$
is already contained in the zeroth-order term
$t\gt 0^+$
is already contained in the zeroth-order term $\hat \varPhi _0$
and, hence, it can be omitted, i.e.
$\hat \varPhi _0$
and, hence, it can be omitted, i.e. $\hat \varPhi _1=0$
. This is a consolidated procedure in the multiple-scale approach, for example, see Mei et al. (Reference Mei, Stiassnie and Yue2005).
$\hat \varPhi _1=0$
. This is a consolidated procedure in the multiple-scale approach, for example, see Mei et al. (Reference Mei, Stiassnie and Yue2005).
The equation for the free-surface elevation is
 \begin{equation} \hat \zeta _1=-\frac {\partial \hat \varPhi _1}{\partial t}-\frac {\partial \hat \varPhi _0}{\partial t_1}, \end{equation}
which yields trivially $\hat \zeta _1=0$
. The expressions for the unknown amplitudes
$\hat \zeta _1=0$
. The expressions for the unknown amplitudes $a(t_2)$
and
$a(t_2)$
and $b(t_2)$
must be found at the order
$b(t_2)$
must be found at the order $O(\epsilon ^2)$
.
$O(\epsilon ^2)$
.
Order $O(\epsilon ^2)$
At second order in $\epsilon$
, the BVP is
$\epsilon$
, the BVP is
 \begin{align} & \frac {\partial ^2\hat {\varPhi }_2}{\partial z^2}-\left (\frac {k_x}{\beta }\right )^2\,\hat \varPhi _2=\left (\frac {k_y}{\beta } \right )^2\hat \varPhi _0, \quad z\in (-1,0), \end{align}
 \begin{align} &\qquad\,\, \frac {\partial ^2\hat \varPhi _2}{\partial t^2}+\frac {\partial \hat \varPhi _2}{\partial z}=-2\frac {\partial ^2\hat \varPhi _0}{\partial t\partial t_2}, \quad z=0, \end{align}
 \begin{align} &\qquad\qquad\quad \frac {\partial \hat \varPhi _2}{\partial z}=0,\quad z=-1, \end{align}
hence, the leading order potential forces the lateral propagation along $y$
at order
$y$
at order $O(\epsilon ^2)$
.
$O(\epsilon ^2)$
.
The particular solution to (2.40) which satisfies (2.42) is
 \begin{equation} \hat \varPhi _2=\frac {1}{2}\frac {k_y^2}{k_x\beta }\left [\!(z+1)\sinh \left (\!\frac {k_x}{\beta }z\!\right )\!+\tanh \left (\!\frac {k_x}{\beta }\!\right )\cosh \left (\!\frac {k_x}{\beta }z\!\right ) \!\right ]\!\left [a(t_2)\cos (\omega t)+b(t_2)\sin (\omega t)\right ]\!, \end{equation}
where again the homogeneous solution is discarded as it is already included at the leading order. Substituting (2.43) into the free-surface boundary condition (2.41) yields
 \begin{equation} \varOmega _a(t_2)\cos (\omega t) + \varOmega _b(t_2)\sin (\omega t) = 0, \end{equation}
where
 \begin{align} \varOmega _a(t_2)&= \frac {a(t_2)}{2}\frac {k_y^2}{k_x\beta }\left [\tanh \left (\frac {k_x}{\beta }\right )(1-\omega ^2)+\frac {k_x}{\beta }\right ]+2\omega \frac {{\textrm{d}} b}{{\textrm{d}} t_2}, \nonumber \\[-12pt] \end{align}
 \begin{align} \varOmega _b(t_2) &= \frac {b(t_2)}{2}\frac {k_y^2}{k_x\beta }\left [\tanh \left (\frac {k_x}{\beta }\right )(1-\omega ^2)+\frac {k_x}{\beta }\right ]-2\omega \frac {{\textrm{d}} a}{{\textrm{d}} t_2}. \end{align}
Now, (2.44) is satisfied for all $t\gt 0^+$
only if
$t\gt 0^+$
only if $\varOmega _a=\varOmega _b=0$
. Cross-differentiating (2.45) and (2.46) yields a system of evolution equations for
$\varOmega _a=\varOmega _b=0$
. Cross-differentiating (2.45) and (2.46) yields a system of evolution equations for $a(t_2)$
and
$a(t_2)$
and $b(t_2)$
, namely
$b(t_2)$
, namely
 \begin{align}& \frac {d^2a}{{\textrm{d}} t_2^2}+\left (\frac {\mathcal{F}}{2\omega } \right )^2a=0, \end{align}
 \begin{align}&\qquad b = \frac {2\omega }{\mathcal{F}}\frac {{\textrm{d}} a}{{\textrm{d}} t_2}, \end{align}
where, making use of (2.24),
 \begin{equation} \mathcal{F}= \frac {1}{2}\frac {k_y^2}{k_x\beta }\left [\tanh \left (\frac {k_x}{\beta }\right )(1-\omega ^2)+\frac {k_x}{\beta }\right ]=\frac {1}{2}k_y^2\frac {\omega ^2}{k_x^2}\left [1+\frac {2k_x/\beta }{\sinh (2k_x/\beta )} \right ]\!. \end{equation}
Solution of the system of ordinary differential equations (ODEs) (2.47)–(2.48), together with the initial conditions (2.28), yields
 \begin{align} a&=-\frac {\hat H_0}{\omega \cosh (k_x/\beta )}\sin \left (\frac {\mathcal{F}}{2\omega }t_2\right )\!, \end{align}
 \begin{align} b &= -\frac {\hat H_0}{\omega \cosh (k_x/\beta )}\cos \left (\frac {\mathcal{F}}{2\omega }t_2\right )\!. \end{align}
Substituting (2.50)–(2.51) back into (2.29) and recalling $t_2=\epsilon ^2 t$
yields the sought leading order potential in non-dimensional form
$t_2=\epsilon ^2 t$
yields the sought leading order potential in non-dimensional form
 \begin{eqnarray} \hat \varPhi _0(z,t;k_x,k_y) = &-&\frac {\hat H_0(k_x,k_y)}{\omega \cosh (k_x/\beta )}\left [\tanh \left (\frac {k_x}{\beta }\right )\sinh \left (\frac {k_x}{\beta }z\right )+\cosh \left (\frac {k_x}{\beta }z \right )\right ]\nonumber \\ &\times & \sin \left [\left (\omega +\epsilon ^2\frac {k_y^2}{2k_x}C_{g}\right )t\right ]\!, \end{eqnarray}
where, again, primes are omitted for the sake of simplicity and
 \begin{equation} C_{g}=\frac {\omega }{2k_x}\left (1+\frac {2k_x/\beta }{\sinh (2k_x/\beta )} \right ) \end{equation}
is the group velocity in the $x$
direction. Substitution of (2.50)–(2.51) into (2.30) and inverse transformation (2.11) give the leading order free-surface elevation in non-dimensional form,
$x$
direction. Substitution of (2.50)–(2.51) into (2.30) and inverse transformation (2.11) give the leading order free-surface elevation in non-dimensional form,
 \begin{equation} \zeta _0(x,y,t) =\frac {1}{2\pi }\int _{-\infty }^{\infty } \int _{-\infty }^{\infty }\frac {\hat H_0(k_x,k_y)}{\cosh (k_x/\beta )}\cos \left (\tilde \omega t \right ){\textrm{exp}}\left [\textrm{i}(k_x x+k_y y)\right ]\,{\textrm{d}} k_x\,{\textrm{d}} k_y, \end{equation}
where, again, primes are omitted for brevity and
 \begin{equation} \tilde {\omega } = \omega + \epsilon ^2\frac {k_y^2}{2k_x}C_g \end{equation}
is the higher-order effective frequency accounting for $y$
-axis propagation, which has a leading order effect in slowly modulating the wave field. Equation (2.54) highlights that the effect of 2-HD propagation is to increase the frequency (i.e. reduce the period) of each wave component, since
$y$
-axis propagation, which has a leading order effect in slowly modulating the wave field. Equation (2.54) highlights that the effect of 2-HD propagation is to increase the frequency (i.e. reduce the period) of each wave component, since $\tilde {\omega }\gt \omega$
. We next turn to the magnetic field.
$\tilde {\omega }\gt \omega$
. We next turn to the magnetic field.
2.2. Magnetic field
The magnetic formulation developed in the following applies to the deep-ocean regime, where the induction response is governed primarily by the large-scale tsunami flow and is least affected by coastal, bathymetric or site-specific conductivity effects. The total magnetic field in physical variables is
 \begin{align} \boldsymbol {B}=\boldsymbol {b}+\boldsymbol {F}, \end{align}
where $\boldsymbol {b}=(b_x,b_y,b_z)$
is the perturbation induced by the tsunami, generated by sea bed displacement, and
$\boldsymbol {b}=(b_x,b_y,b_z)$
is the perturbation induced by the tsunami, generated by sea bed displacement, and
 \begin{equation} \boldsymbol {F}=\left (F_x,F_y,F_z\right ) = F\left (\cos I\cos \varTheta ,\, - \cos I \sin \varTheta ,\,\sin I \right ) \end{equation}
is the steady Earth’s field. In (2.57), $I$
is the dip angle at which the magnetic field lines intersect the Earth’s surface (ranging from
$I$
is the dip angle at which the magnetic field lines intersect the Earth’s surface (ranging from $0^\circ$
at the equator to
$0^\circ$
at the equator to $90^\circ$
at the poles) and
$90^\circ$
at the poles) and $\varTheta$
is the angle between the wave propagation direction and the magnetic meridian (an imaginary line on the Earth’s surface that connects the magnetic north and south poles), see Wang & Liu (Reference Wang and Liu2013).
$\varTheta$
is the angle between the wave propagation direction and the magnetic meridian (an imaginary line on the Earth’s surface that connects the magnetic north and south poles), see Wang & Liu (Reference Wang and Liu2013).
Under the assumption that the characteristic speed of fluid flow is much smaller than the speed of light, the magnetic field $\boldsymbol {B}$
satisfies the induction equation for incompressible fluids in the non-relativistic limit,
$\boldsymbol {B}$
satisfies the induction equation for incompressible fluids in the non-relativistic limit,
 \begin{equation} \frac {\partial \boldsymbol {B}}{\partial t}+\boldsymbol {u}\boldsymbol{\cdot }\boldsymbol{\nabla }\boldsymbol {B}=\boldsymbol {B}\boldsymbol{\cdot }\boldsymbol{\nabla }\boldsymbol { u}+\eta {\nabla} ^2\boldsymbol {B}, \end{equation}
where $\eta$
is the constant magnetic diffusivity (
$\eta$
is the constant magnetic diffusivity ( $\textrm{m}^2\,\textrm{s}^{-1}$
) and
$\textrm{m}^2\,\textrm{s}^{-1}$
) and $\boldsymbol {u}=\boldsymbol{\nabla }\varPhi$
is the ocean’s velocity field (Gilbert Reference Gilbert2003; Galtier Reference Galtier2016). Equation (2.58) describes the induction of magnetic field
$\boldsymbol {u}=\boldsymbol{\nabla }\varPhi$
is the ocean’s velocity field (Gilbert Reference Gilbert2003; Galtier Reference Galtier2016). Equation (2.58) describes the induction of magnetic field $\boldsymbol {B}$
in a fluid medium moving with velocity
$\boldsymbol {B}$
in a fluid medium moving with velocity $\boldsymbol {u}$
. Physically, the terms on the left-hand side of (2.58) represent the material derivative of the magnetic field. The first term on the right-hand side of (2.58) represents the field production by stretching of the magnetic flux lines (analogous to the vortex-stretching term in the vorticity equation, see Kundu, Cohen & Dowling Reference Kundu, Cohen and Dowling2016) and, finally, the second term on the right-hand side represents diffusional transport of the magnetic field (analogous to diffusion of vorticity by viscosity, see Moreau Reference Moreau1990). Similar dynamics is also found in mass/temperature transport, e.g. see Michele et al. (Reference Michele, Stuhlmeier and Borthwick2021, Reference Michele, Borthwick and van den Bremer2023). Now, let us consider the physical scales associated with (2.58). Typically,
$\boldsymbol {u}$
. Physically, the terms on the left-hand side of (2.58) represent the material derivative of the magnetic field. The first term on the right-hand side of (2.58) represents the field production by stretching of the magnetic flux lines (analogous to the vortex-stretching term in the vorticity equation, see Kundu, Cohen & Dowling Reference Kundu, Cohen and Dowling2016) and, finally, the second term on the right-hand side represents diffusional transport of the magnetic field (analogous to diffusion of vorticity by viscosity, see Moreau Reference Moreau1990). Similar dynamics is also found in mass/temperature transport, e.g. see Michele et al. (Reference Michele, Stuhlmeier and Borthwick2021, Reference Michele, Borthwick and van den Bremer2023). Now, let us consider the physical scales associated with (2.58). Typically, $|\boldsymbol {F}|=F\sim 10^4$
nT, whereas
$|\boldsymbol {F}|=F\sim 10^4$
nT, whereas $|\boldsymbol {b}|=b \sim 1-10$
nT; for example, see Minami & Toh (Reference Minami and Toh2013) and Wang & Liu (Reference Wang and Liu2013). Therefore,
$|\boldsymbol {b}|=b \sim 1-10$
nT; for example, see Minami & Toh (Reference Minami and Toh2013) and Wang & Liu (Reference Wang and Liu2013). Therefore, $b\ll F$
and the induction (2.58) simplifies into the kinematic dynamo equation
$b\ll F$
and the induction (2.58) simplifies into the kinematic dynamo equation
 \begin{equation} \frac {\partial {\boldsymbol {b}}}{\partial t}-\eta {\nabla} ^2{\boldsymbol {b}}={\boldsymbol {F}}\boldsymbol{\cdot }\boldsymbol{\nabla }{\boldsymbol {u}}, \end{equation}
where $\boldsymbol {F}$
is assumed constant during the duration of the tsunami and second-order terms are neglected (see Wang & Liu Reference Wang and Liu2013; Minami, Schnepf & Toh Reference Minami, Schnepf and Toh2021; Renzi & Mazza Reference Renzi and Mazza2023).
$\boldsymbol {F}$
is assumed constant during the duration of the tsunami and second-order terms are neglected (see Wang & Liu Reference Wang and Liu2013; Minami, Schnepf & Toh Reference Minami, Schnepf and Toh2021; Renzi & Mazza Reference Renzi and Mazza2023).
In the air layer, the conductivity $\sigma _a\sim 0$
, and hence, the diffusivity
$\sigma _a\sim 0$
, and hence, the diffusivity $\eta =\eta _a\rightarrow \infty$
and (2.59) simplifies to
$\eta =\eta _a\rightarrow \infty$
and (2.59) simplifies to
 \begin{align} &{\nabla} ^2{\boldsymbol {b}}=\boldsymbol {0},\quad z\in (0,\infty ). \end{align}
In the water layer, the magnetic field satisfies
 \begin{equation} \frac {\partial {\boldsymbol {b}}}{\partial t}-\eta _w{\nabla} ^2{\boldsymbol {b}}={\boldsymbol {F}}\boldsymbol{\cdot }\boldsymbol{\nabla }{\boldsymbol {u}},\quad z\in (-h,0), \end{equation}
where $\boldsymbol {u}$
is the velocity associated with the wave field, and finally, in the seafloor layer,
$\boldsymbol {u}$
is the velocity associated with the wave field, and finally, in the seafloor layer,
 \begin{equation} \frac {\partial {\boldsymbol {b}}}{\partial t}-\eta _s{\nabla} ^2{\boldsymbol {b}}=\boldsymbol {0}, \quad z\in (-\infty ,-h), \end{equation}
where $\eta _w=1/(\mu _0\sigma _w)$
and
$\eta _w=1/(\mu _0\sigma _w)$
and $\eta _s=1/(\mu _0\sigma _s)$
represent the magnetic diffusivity in saltwater and the seafloor, respectively. We now turn to the boundary conditions: we require that
$\eta _s=1/(\mu _0\sigma _s)$
represent the magnetic diffusivity in saltwater and the seafloor, respectively. We now turn to the boundary conditions: we require that $|{\boldsymbol {b}}|$
be bounded in the far field as
$|{\boldsymbol {b}}|$
be bounded in the far field as $|z|\rightarrow \infty$
(Wang & Liu Reference Wang and Liu2013; Renzi & Mazza Reference Renzi and Mazza2023).
$|z|\rightarrow \infty$
(Wang & Liu Reference Wang and Liu2013; Renzi & Mazza Reference Renzi and Mazza2023).
2.2.1. Non-dimensionalisation and multiple scale analysis
Let us introduce the following non-dimensional quantities for the analysis of the magnetic field:
 \begin{equation} {\boldsymbol {F}}=F\kern-1.5pt{\boldsymbol {F}}',\,\,\,{\boldsymbol {b}}=FA{\boldsymbol {b}}'/h. \end{equation}
Applying the latter in combination with (2.5) to the governing equation (2.60), valid in the air region, yields
 \begin{equation} \frac {\partial ^2{\boldsymbol {b}}'}{\partial x'^2}+\epsilon ^2\frac {\partial ^2{\boldsymbol {b}}'}{\partial y'^2}+\beta ^2\frac {\partial ^2{\boldsymbol {b}}'}{\partial z'^2}=\boldsymbol {0},\quad z'\in (0,\infty ). \end{equation}
Similarly, the non-dimensional form of (2.61) becomes
 \begin{align} &\beta ^2 \frac {\partial {\boldsymbol {b}}^\prime }{\partial t^\prime }-\frac {1}{{{R}_m^w}}\left [\frac {\partial ^2{\boldsymbol {b}}^\prime }{{\partial x^\prime} ^2}+\epsilon ^2\frac {\partial ^2{\boldsymbol {b}}^\prime }{{\partial y^\prime} ^2}+\beta ^2\frac {\partial ^2{\boldsymbol {b}}^\prime }{{\partial z^\prime} ^2}\right ]= \end{align}
 \begin{align} & \big(F_x^{\prime},F_y^{\prime},F_z' \big)\, \begin{bmatrix} \displaystyle \frac {\partial u_x^{\prime}}{\partial x'} & \epsilon \displaystyle \frac {\partial u_x^{\prime}}{\partial y'} & \beta \displaystyle \frac {\partial u_x^{\prime}}{\partial z'}\\ \\ \displaystyle \epsilon \frac {\partial u_y^{\prime}}{\partial x'} & \displaystyle \epsilon ^2\frac {\partial u_y^{\prime}}{\partial y'} & \epsilon \beta \displaystyle \frac {\partial u_y^{\prime}}{\partial z'}\\ \\ \beta \displaystyle \frac {\partial u_z^{\prime}}{\partial x'} &\epsilon \beta \displaystyle \frac {\partial u_z^{\prime}}{\partial y'} & \beta ^2\displaystyle \frac {\partial u_z^{\prime}}{\partial z'} \end{bmatrix}^T\!, \quad z'\in (-1,0), \end{align}
where ${{R}_m^w}=h\sqrt {gh}/\eta _w$
is the magnetic Reynolds number of seawater. Finally, the non-dimensional form of the governing equation in the seafloor (2.62) is
${{R}_m^w}=h\sqrt {gh}/\eta _w$
is the magnetic Reynolds number of seawater. Finally, the non-dimensional form of the governing equation in the seafloor (2.62) is
 \begin{align} &\beta ^2 \frac {\partial {\boldsymbol {b}}^\prime }{\partial t^\prime }-\frac {1}{{{R}_m^s}}\left [\frac {\partial ^2{\boldsymbol {b}}^\prime }{{\partial x^\prime} ^2}+\epsilon ^2\frac {\partial ^2{\boldsymbol {b}}^\prime }{{\partial y^\prime} ^2}+\beta ^2\frac {\partial ^2{\boldsymbol {b}}^\prime }{{\partial z^\prime} ^2}\right ]=\boldsymbol { 0},\quad z^\prime \in (-\infty ,-1), \end{align}
where ${{R}_m^s}=h\sqrt {gh}/\eta _s\ll {{R}_m^w}$
. We emphasise that the fluid velocity vanishes in the seabed, so the usual definition of magnetic Reynolds number as the ratio of motional forcing to magnetic diffusion is not applicable. Here,
${{R}_m^s}=h\sqrt {gh}/\eta _s\ll {{R}_m^w}$
. We emphasise that the fluid velocity vanishes in the seabed, so the usual definition of magnetic Reynolds number as the ratio of motional forcing to magnetic diffusion is not applicable. Here, ${{R}_m^s}$
should instead be interpreted as a dimensionless magnetic diffusion parameter in the seafloor. We retain the notation for consistency with the seawater case, but note this distinction explicitly.
${{R}_m^s}$
should instead be interpreted as a dimensionless magnetic diffusion parameter in the seafloor. We retain the notation for consistency with the seawater case, but note this distinction explicitly.
Application of the double Fourier transform (2.10) to (2.64) yields
 \begin{equation} -k_x^2 \hat {\boldsymbol {b}}-\epsilon ^2 k_y^2 \hat {\boldsymbol {b}} + \beta ^2 \frac {\partial ^2 \hat {\boldsymbol {b}}}{\partial z^2}=\boldsymbol {0},\quad z\in (0,\infty ). \end{equation}
Similarly, (2.66) becomes
 \begin{align} &\beta ^2 \frac {\partial \hat {\boldsymbol {b}}}{\partial t}-\frac {1}{{{R}_m^w}}\left [-k_x^2\hat {\boldsymbol {b}} -\epsilon ^2 k_y^2\hat {\boldsymbol {b}} +\beta ^2\frac {\partial ^2\hat {\boldsymbol {b}}}{\partial z^2}\right ]= \end{align}
 \begin{align} &(F_x,F_y,F_z)\, \begin{bmatrix} \displaystyle \textrm{i} k_x \hat {u}_x & \epsilon \textrm{i} k_y \hat {u}_x & \beta \displaystyle \frac {\partial \hat {u}_x}{\partial z}\\ \\ \epsilon \textrm{i} k_x \hat {u}_y & \epsilon ^2\textrm{i} k_y \hat {u}_y & \epsilon \beta \displaystyle \frac {\partial \hat {u}_y}{\partial z}\\ \\ \beta \textrm{i} k_x \hat {u}_z &\epsilon \beta \textrm{i} k_y \hat {u}_z & \beta ^2\displaystyle \frac {\partial \hat {u}_z}{\partial z} \end{bmatrix}^T \!,\quad z\in (-1,0), \end{align}
and finally, (2.67) becomes
 \begin{align} &\beta ^2 \frac {\partial \hat {\boldsymbol {b}}}{\partial t}-\frac {1}{{{R}_m^s}}\left [-k_x^2\hat {\boldsymbol {b}} -\epsilon ^2 k_y^2\hat {\boldsymbol {b}} +\beta ^2\frac {\partial ^2\hat {\boldsymbol {b}}}{\partial z^2}\right ]=0,\quad z\in (-\infty ,-1), \end{align}
where, again, primes have been dropped for the sake of simplicity.
Finally, let us introduce the multiple scales (2.15) and expand the magnetic and velocity fields in powers of the small parameter $\epsilon$
,
$\epsilon$
,
 \begin{equation} \hat {\boldsymbol {b}} = \hat {\boldsymbol {b}}_0+\epsilon \hat {\boldsymbol {b}}_1+\epsilon ^2 \hat {\boldsymbol {b}}_2; \quad \hat {\boldsymbol {u}} = \hat {\boldsymbol {u}}_0+\epsilon \hat {\boldsymbol {u}}_1+\epsilon ^2 \hat {\boldsymbol {u}}_2. \end{equation}
At the leading order, the governing equations (2.68)–(2.71) become
 \begin{equation} \beta ^2\frac {\partial ^2\hat {\boldsymbol {b}}_0}{\partial z^2}-k_x^2\hat {\boldsymbol {b}}_0=\boldsymbol {0},\quad z\in (0,\infty ) \end{equation}
in the air layer,
 \begin{align} &\beta ^2 \frac {\partial \hat {\boldsymbol {b}}_0}{\partial t}+\frac {k_x^2}{{{R}_m^w}} \hat {\boldsymbol {b}}_0-\frac {\beta ^2}{{{R}_m^w}}\frac {\partial ^2 \hat {\boldsymbol {b}}_0}{\partial z^2}= \end{align}
 \begin{align} &(F_x,F_y,F_z)\, \begin{bmatrix} \textrm{i} k_x \hat {u}_{x_0} & 0 & \beta \displaystyle \frac {\partial \hat {u}_{x_0}}{\partial z}\\ \\ 0 & 0 & 0\\ \\ \beta \textrm{i} k_x \hat {u}_{z_0} & 0 & \beta ^2\displaystyle \frac {\partial \hat {u}_{z_0}}{\partial z} \end{bmatrix}^T \!,\quad z\in (-1,0) \end{align}
in the water layer and
 \begin{align} &\beta ^2 \frac {\partial \hat {\boldsymbol {b}}_0}{\partial t}+\frac {k_x^2}{{{R}_m^s}} \hat {\boldsymbol {b}}_0-\frac {\beta ^2}{{{R}_m^s}}\frac {\partial ^2 \hat {\boldsymbol {b}}_0}{\partial z^2}=0,\quad z\in (-\infty ,-1) \end{align}
in the seafloor.
2.2.2. Vertical magnetic field
Field observations show that the vertical magnetic field component reaches its peak earlier than the horizontal component (Minami & Toh Reference Minami and Toh2013). Consequently, the vertical component is considered the most suitable for potential use in early warning systems. In this section, we focus on the vertical magnetic field. A similar procedure can also be applied to obtain the horizontal components, which, in some cases, can exhibit an initial rise, as discussed by Minami et al. (Reference Minami, Toh and Tyler2015).
In Fourier space, the vertical magnetic field $\hat {b}_{z_0}$
is governed by a Helmholtz equation in the air layer,
$\hat {b}_{z_0}$
is governed by a Helmholtz equation in the air layer,
 \begin{equation} \frac {\partial ^2 \hat {b}_{z_0}}{\partial z^2}-\frac {k_x^2}{\beta ^2} \hat {b}_{z_0}=0, \quad z\in (0,\infty ), \end{equation}
a forced, linear equation of time-dependent Schrödinger form in the water layer,
 \begin{equation} \beta ^2 \frac {\partial \hat {b}_{z_0}}{\partial t} +\frac {k_x^2}{{{R}_m^w}} \hat {b}_{z_0}-\frac {\beta ^2}{{{R}_m^w}}\frac {\partial ^2 \hat {b}_{z_0}}{\partial z^2} = \beta \textrm{i} k_x F_x\frac {\partial \hat {\varPhi }_0}{\partial z}+\beta ^2 F_z \frac {\partial ^2\hat {\varPhi }_0}{\partial z^2}, \quad z\in (-1,0), \end{equation}
where the substitution $\hat {u}_{z_0}=\partial \hat {\varPhi }_0/\partial z$
has been made (see 2.52), and a homogeneous time-dependent equation in the seafloor layer,
$\hat {u}_{z_0}=\partial \hat {\varPhi }_0/\partial z$
has been made (see 2.52), and a homogeneous time-dependent equation in the seafloor layer,
 \begin{equation} \beta ^2 \frac {\partial \hat {b}_{z_0}}{\partial t} +\frac {k_x^2}{{{R}_m^s}} \hat {b}_{z_0}-\frac {\beta ^2}{{{R}_m^s}}\frac {\partial ^2 \hat {b}_{z_0}}{\partial z^2} = 0, \quad z\in (-\infty ,-1). \end{equation}
Finally, we request that $|\hat {b}_{z_0}|$
be bounded as
$|\hat {b}_{z_0}|$
be bounded as $|z|\rightarrow \infty$
. The system (2.77)–(2.79) can be solved separately in each domain and then matched by requesting that
$|z|\rightarrow \infty$
. The system (2.77)–(2.79) can be solved separately in each domain and then matched by requesting that $\hat {b}_{z_0}$
and
$\hat {b}_{z_0}$
and $\partial \hat {b}_{z_0}/\partial z$
be continuous at the interfaces
$\partial \hat {b}_{z_0}/\partial z$
be continuous at the interfaces $z=0$
(water–air) and
$z=0$
(water–air) and $z=-1$
(seabed–water). These matching conditions are a result of conservation of the magnetic flux
$z=-1$
(seabed–water). These matching conditions are a result of conservation of the magnetic flux
 \begin{align} \boldsymbol{\nabla }\boldsymbol{\cdot }{\boldsymbol {b}}=0 \end{align}
and continuity of the normal and tangential components of $\boldsymbol {b}$
across the air–water and water–soil interfaces, see Moreau (Reference Moreau1990) and Tyler (Reference Tyler2005). This boundary-value problem is solved here by means of a Green function approach (Morse & Feshback Reference Morse and Feshback1953).
$\boldsymbol {b}$
across the air–water and water–soil interfaces, see Moreau (Reference Moreau1990) and Tyler (Reference Tyler2005). This boundary-value problem is solved here by means of a Green function approach (Morse & Feshback Reference Morse and Feshback1953).
The Green function $G(z,\xi ,t;k_x,k_y)$
solves the governing equations (2.77)–(2.79) where the forcing term on the right-hand side of (2.78), valid in the liquid layer, is replaced by a double Dirac delta distribution
$G(z,\xi ,t;k_x,k_y)$
solves the governing equations (2.77)–(2.79) where the forcing term on the right-hand side of (2.78), valid in the liquid layer, is replaced by a double Dirac delta distribution $\delta (t-0^+)\delta (z-\xi )$
, with
$\delta (t-0^+)\delta (z-\xi )$
, with $\xi \in (-1,0)$
representing the vertical position of the source term, see Mei (Reference Mei1997) and Mei et al. (Reference Mei, Stiassnie and Yue2005). The derivation of the Green function is detailed in Appendix A.
$\xi \in (-1,0)$
representing the vertical position of the source term, see Mei (Reference Mei1997) and Mei et al. (Reference Mei, Stiassnie and Yue2005). The derivation of the Green function is detailed in Appendix A.
Use of Laplace’s convolution theorem and careful integration in the complex plane reveals that the vertical component of the magnetic field at the seabed is the sum of an evanescent part, which fast decays soon after generation, and a transient propagating component that travels away from the fault (see Appendix A). This physical picture is consistent with Renzi & Mazza (Reference Renzi and Mazza2023)’s results in two dimensions. The magnetic signal at the seabed for transoceanic tsunami propagation is given by
 \begin{align} b_{z0}(x,y,-1,t)&=\frac {1}{2\pi }\int _{-\infty }^{\infty }\int _{-\infty }^{\infty }\left \{\mathcal{G}_+(k_x,k_y)\exp \left [\textrm{i}(k_x x+k_y y+\tilde \omega t) \right ]\right .\nonumber \\&\quad +\left .\mathcal{G}_-(k_x,k_y)\exp \left [\textrm{i}(k_x x+k_y y-\tilde \omega t) \right ]\right \}\, {\textrm{d}} k_x\, {\textrm{d}} k_y, \end{align}
where $\tilde {\omega }$
(2.55) is the modified frequency taking into account
$\tilde {\omega }$
(2.55) is the modified frequency taking into account $y$
-axis propagation. Still in (2.81),
$y$
-axis propagation. Still in (2.81), $\mathcal{G}_\pm (k_x,k_y) = \mathcal{G}(\pm \textrm{i}\omega ,k_x,k_y)$
, where
$\mathcal{G}_\pm (k_x,k_y) = \mathcal{G}(\pm \textrm{i}\omega ,k_x,k_y)$
, where
 \begin{align} \mathcal{G}(s,k_x,k_y)&=-\frac {\hat {H}_0(k_x,k_y)}{2\omega \cosh ^2(k_x/\beta )}\frac {k_x^2}{\beta ^2}\left \{\alpha _w\left [-\textrm{i} F_x\frac {k_x}{\beta }\left (\cosh (\alpha _w)-\cosh \left (\frac {k_x}{\beta } \right )\right ) \right .\right .\nonumber \\&\quad -\left . F_z\alpha _w\sinh (\alpha _w)+F_z\frac {k_x}{\beta }\sinh \left (\frac {k_x}{\beta }\right )\right ]+\frac {|k_x|}{\beta }\left [-\textrm{i} F_x \frac {k_x}{\beta }\sinh (\alpha _w) \nonumber \right .\\&\quad +\left .\left .\alpha _w\left (-F_z\cosh (\alpha _w)+F_z \cosh \left (\frac {k_x}{\beta }\right )+\textrm{i} F_x\sinh \left (\frac {k_x}{\beta }\right ) \right )\right ]\right \}\nonumber \\&\quad \times \left \{\tilde {\omega }\left [\alpha _w\left (\sigma \alpha _s+\frac {|k_x|}{\beta }\right )\cosh (\alpha _w)+\left (\alpha _w^2+\sigma \alpha _s\frac {|k_x|}{\beta } \right )\sinh (\alpha _w)\right ]\right \}^{-1}. \end{align}
In (2.82), $\alpha _w(s,k_x)$
is the magnetic wavenumber in the water layer, given by (A11),
$\alpha _w(s,k_x)$
is the magnetic wavenumber in the water layer, given by (A11), $\alpha _s(s,k_x)$
is the magnetic wavenumber in the seabed layer, given by (A13), and
$\alpha _s(s,k_x)$
is the magnetic wavenumber in the seabed layer, given by (A13), and $\sigma =\textrm{sign}({Re}\{\alpha _s\})$
.
$\sigma =\textrm{sign}({Re}\{\alpha _s\})$
.
Equation (2.81) demonstrates that $y$
-axis propagation induces similar effects in the magnetic field as it does in the wave field, notably increasing the frequency of the signal components compared with one-horizontal-dimension (1-HD) propagation. In the following section, we derive an asymptotic formula for the magnetic anomaly induced by the leading long wave which separates from the group at very large distance from the fault.
$y$
-axis propagation induces similar effects in the magnetic field as it does in the wave field, notably increasing the frequency of the signal components compared with one-horizontal-dimension (1-HD) propagation. In the following section, we derive an asymptotic formula for the magnetic anomaly induced by the leading long wave which separates from the group at very large distance from the fault.
3. Asymptotic formula at very large distance from the fault
In this section, we derive an asymptotic formula for the magnetic signal associated with the leading long wave, in the weakly dispersive limit $\beta \gg 1$
(equivalently,
$\beta \gg 1$
(equivalently, $\mu \ll 1$
). For the sake of simplicity, we consider a symmetric deformation of the seabed with respect to both
$\mu \ll 1$
). For the sake of simplicity, we consider a symmetric deformation of the seabed with respect to both $x$
- and
$x$
- and $y$
-axes; similar calculations can be undertaken for more complex geometries, using superposition of effects (Mei et al. Reference Mei, Stiassnie and Yue2005). As a result of symmetry,
$y$
-axes; similar calculations can be undertaken for more complex geometries, using superposition of effects (Mei et al. Reference Mei, Stiassnie and Yue2005). As a result of symmetry, $\hat {H}_0(k_x,k_y)$
is real and even in
$\hat {H}_0(k_x,k_y)$
is real and even in $k_x$
and
$k_x$
and $k_y$
, and after some lengthy algebra, (2.54) becomes
$k_y$
, and after some lengthy algebra, (2.54) becomes
 \begin{align} \zeta _0(x,y,t) &= \frac {1}{2\pi }{\textrm{Re}} \Biggl \{ \int _0^{\infty }\int _0^\infty \frac {\hat {H}_0(k_x,k_y)}{\cosh (k_x/\beta )}\Bigl [\exp {\left (\textrm{i} (k_x x+k_y y+\tilde {\omega }t)\right )} \nonumber\\ &\quad +\exp {\left (\textrm{i} (k_x x+k_y y-\tilde {\omega }t)\right )}+\exp {\left (\textrm{i} (k_x x-k_y y+\tilde {\omega }t)\right )} \nonumber\\ &\quad +\exp {\left (\textrm{i} (k_x x-k_y y-\tilde {\omega }t)\right )}\Bigr ]\,{\textrm{d}} k_x\,{\textrm{d}} k_y \Biggr \}. \end{align}
To obtain an approximation for the magnetic field at large distance from the fault, consider an observer at $x\gt 0$
,
$x\gt 0$
, $y\gt 0$
(similar considerations can be made for observers at other locations). At large distance from the epicentre, i.e.
$y\gt 0$
(similar considerations can be made for observers at other locations). At large distance from the epicentre, i.e. $|\boldsymbol {x}|=|(x,y)|\gg 1$
, only outgoing waves survive (Mei et al. Reference Mei, Stiassnie and Yue2005), so that (3.1) can be rewritten more compactly as
$|\boldsymbol {x}|=|(x,y)|\gg 1$
, only outgoing waves survive (Mei et al. Reference Mei, Stiassnie and Yue2005), so that (3.1) can be rewritten more compactly as
 \begin{equation} \zeta _0(x,y,t)={\textrm{Re}}\left \lbrace \frac {1}{2\pi }\int _0^\infty \mathscr{H}\kern-1pt(\boldsymbol {k})\, \mu (\boldsymbol {x},t;\boldsymbol {k})\, {\textrm{d}}\boldsymbol {k} \right \rbrace , \end{equation}
where $\boldsymbol {k}=(k_x,k_y)$
is the wavenumber vector,
$\boldsymbol {k}=(k_x,k_y)$
is the wavenumber vector,
 \begin{equation} \mathscr{H}\kern-1pt(\boldsymbol {k}) = \frac {\hat {H}_0(\boldsymbol {k})}{\cosh (k_x/\beta )} \end{equation}
is a forcing function and
 \begin{equation} \mu (\boldsymbol {x},t;\boldsymbol {k}) = \exp \left (\textrm{i} \boldsymbol {k}\boldsymbol{\cdot }\boldsymbol {x}-\tilde {\omega t} \right ) \end{equation}
is the solution for an outgoing monochromatic wave in the transformed space, but accounting for the perturbed frequency $\tilde \omega$
(2.55). Note that the integral form (3.2) for the free-surface elevation is common to other linear-system responses, such as tsunamis generated by landslides (Renzi & Sammarco Reference Renzi and Sammarco2010).
$\tilde \omega$
(2.55). Note that the integral form (3.2) for the free-surface elevation is common to other linear-system responses, such as tsunamis generated by landslides (Renzi & Sammarco Reference Renzi and Sammarco2010).
In the limit ${{R}_m^s}\rightarrow 0$
(i.e. for an insulating seabed), the governing equation (2.75) for the vertical magnetic field in the water layer and the expression for the free-surface elevation (3.2) share the same functional structure as the relationships derived for one-dimensional propagation over insulating seabed by Renzi & Mazza (Reference Renzi and Mazza2023). They showed that if the leading surface wave has the expression
${{R}_m^s}\rightarrow 0$
(i.e. for an insulating seabed), the governing equation (2.75) for the vertical magnetic field in the water layer and the expression for the free-surface elevation (3.2) share the same functional structure as the relationships derived for one-dimensional propagation over insulating seabed by Renzi & Mazza (Reference Renzi and Mazza2023). They showed that if the leading surface wave has the expression
 \begin{align} \zeta _0(x,t)={\textrm{Re}}\left \lbrace \mathscr{a}\,\chi (x,t)\right \rbrace , \end{align}
then a Boussinesq expansion of the phase function in the weakly dispersive regime ( $\beta \gg 1$
) yields
$\beta \gg 1$
) yields
 \begin{align} b_{z_0}(x,-1,t)={\textrm{Re}}\left \lbrace \mathscr{b}\,\chi (x,t)\right \rbrace \end{align}
for the vertical magnetic field at the seabed ( $z=-1)$
, where
$z=-1)$
, where $\mathscr{a}$
and
$\mathscr{a}$
and $\mathscr{b}$
are complex constants related by
$\mathscr{b}$
are complex constants related by
 \begin{equation} \mathscr{b}\,=\mathscr{a}\,\frac {F_z}{1+2\textrm{i}/{{R}_m^w}}, \end{equation}
and $\chi (x,t)$
is a function representing the wave profile. Remarkably, this corresponds to a time-dependent extension for transient motion of the original Tyler formula, which is valid for long waves in simple harmonic motion, where
$\chi (x,t)$
is a function representing the wave profile. Remarkably, this corresponds to a time-dependent extension for transient motion of the original Tyler formula, which is valid for long waves in simple harmonic motion, where $\chi =\exp (i(k_x x-\omega t))$
, see Tyler (Reference Tyler2005).
$\chi =\exp (i(k_x x-\omega t))$
, see Tyler (Reference Tyler2005).
The main distinction between our problem and that of Renzi & Mazza (Reference Renzi and Mazza2023) is that the magnetic field and free-surface elevation now depend on both the longitudinal wavenumber $k_x$
and the transverse wavenumber
$k_x$
and the transverse wavenumber $k_y$
. If we write (3.2) as
$k_y$
. If we write (3.2) as
 \begin{align} \zeta _0(\boldsymbol {x},t)={\textrm{Re}}\left \lbrace \mathscr{a}\,\chi (\boldsymbol {x},t)\right \rbrace , \end{align}
where
 \begin{align} \mathscr{a}\,=\frac {1}{2\pi },\quad {\chi }(\boldsymbol {x},t)=\int _0^\infty \mathscr{H}\kern-1pt(\boldsymbol {k})\mu (\boldsymbol { x},t;\boldsymbol {k})\,{\textrm{d}}\boldsymbol {k}, \end{align}
it is plausible to expect that for slow lateral propagation and because of linearity, the magnetic field is
 \begin{equation} b_{z_0}(\boldsymbol {x},-1,t)={\textrm{Re}}\left \lbrace \mathscr{b}\,\chi (\boldsymbol {x},t)\right \rbrace , \end{equation}
where relationship (3.7) still applies at all transverse coordinates $y$
, but with the local wavenumber
$y$
, but with the local wavenumber $\boldsymbol {k}$
. This assumption is analogous to using the constant-depth dispersion relation, but with the local depth, in the context of the mild slope equation (Mei et al. Reference Mei, Stiassnie and Yue2005; Renzi Reference Renzi2017). Hence, the magnetic field associated with the leading long wave at large distance from the fault is
$\boldsymbol {k}$
. This assumption is analogous to using the constant-depth dispersion relation, but with the local depth, in the context of the mild slope equation (Mei et al. Reference Mei, Stiassnie and Yue2005; Renzi Reference Renzi2017). Hence, the magnetic field associated with the leading long wave at large distance from the fault is
 \begin{equation} b_{z_0}(x,y,-1,t)= \textrm{Re}\left \lbrace \frac {1}{2\pi }\int _0^\infty \frac {F_z}{{1+2\textrm{i}/{{R}_m^w}}}\,\mathscr{H}\kern-1pt(\boldsymbol {k}) \mu (\boldsymbol {x},t;\boldsymbol {k})\, {\textrm{d}}\boldsymbol {k} \right \rbrace \!. \end{equation}
Using a similar argument for the remaining directions of propagation in (3.1) and combining everything together, the vertical component of the magnetic field for all $(x,y)$
at large distance from the epicentre reads
$(x,y)$
at large distance from the epicentre reads
 \begin{equation} b_{z_0}(x,y,-1,t) = \frac {1}{2\pi }\textrm{Re} \left \lbrace \frac {F_z}{1+2\textrm{i}/{{R}_m}} \int _0^\infty \int _0^\infty \psi (x,y,t;k_x,k_y)\,{\textrm{d}} k_x\,{\textrm{d}} k_y\right \rbrace \! , \end{equation}
where
 \begin{align} \psi (x,y,t;k_x,k_y) &= \frac {\hat {H}_0(k_x,k_y)}{\cosh (k_x/\beta )}\Bigl [\exp {\left (\textrm{i} (k_x x+k_y y+\tilde {\omega }t)\right )}+\exp {\left (\textrm{i} (k_x x+k_y y-\tilde {\omega }t)\right )} \nonumber\\ &\quad +\exp {\left (\textrm{i} (k_x x-k_y y+\tilde {\omega }t)\right )}+\exp {\left (\textrm{i} (k_x x-k_y y-\tilde {\omega }t)\right )}\Bigr ]. \end{align}
Expressions (3.12)–(3.13) are algebraically simpler than the full solution (2.81)–(2.82) and, therefore, they are significantly easier and faster to calculate. This result has important practical implications, because (3.7) can be also solved for $\mathscr{a}$
as a function of
$\mathscr{a}$
as a function of $\mathscr{b}$
. This enables one to solve the inverse problem of finding the free-surface elevation of a tsunami corresponding to a recorded geomagnetic signal, for example, see Lin et al. (Reference Lin, Toh and Minami2021).
$\mathscr{b}$
. This enables one to solve the inverse problem of finding the free-surface elevation of a tsunami corresponding to a recorded geomagnetic signal, for example, see Lin et al. (Reference Lin, Toh and Minami2021).
4. Modelling benchmark: the 2011 Tōhoku tsunami
We consider the 11 March 2011 Tōhoku–oki tsunami to benchmark the theoretical model derived previously. The source is taken at the earthquake hypocentre $(38.103^\circ \textrm{N}, 142.{}860^\circ \textrm{E})$
, and wave propagation is examined towards the deep-ocean DART buoys 21 401
$(38.103^\circ \textrm{N}, 142.{}860^\circ \textrm{E})$
, and wave propagation is examined towards the deep-ocean DART buoys 21 401 $(42.617^\circ \textrm{N},\,152.583^\circ \textrm{E})$
and 21 419
$(42.617^\circ \textrm{N},\,152.583^\circ \textrm{E})$
and 21 419 $(44.455^\circ \textrm{N},\,155.736^\circ \textrm{E})$
, located at epicentral distances of approximately
$(44.455^\circ \textrm{N},\,155.736^\circ \textrm{E})$
, located at epicentral distances of approximately $965\,\textrm{km}$
and
$965\,\textrm{km}$
and $1287\,\textrm{km}$
, respectively (see figure 2 and Minami et al. Reference Minami, Toh, Ichihara and Kawashima2017).
$1287\,\textrm{km}$
, respectively (see figure 2 and Minami et al. Reference Minami, Toh, Ichihara and Kawashima2017).
Location of the 11 March 2011 Tōhoku–oki earthquake hypocentre (HC), the deep-ocean DART buoys 21 401 and 21 419, and the NWP geomagnetic seafloor station. Map data © 2025 Google, TMap Mobility Imagery ©NASA.

A local Cartesian reference frame is introduced with origin at the hypocentre, the $y$
-axis aligned with the main fault strike (
$y$
-axis aligned with the main fault strike ( $\approx 25^\circ$
) and the
$\approx 25^\circ$
) and the $x$
-axis orthogonal to it. The earthquake source is represented using a simplified geometric model consistent with published rupture dimensions for the Tōhoku event. Finite-fault and tsunami waveform inversion studies indicate rupture extents of the order of
$x$
-axis orthogonal to it. The earthquake source is represented using a simplified geometric model consistent with published rupture dimensions for the Tōhoku event. Finite-fault and tsunami waveform inversion studies indicate rupture extents of the order of $400\,\textrm{km}$
in length and
$400\,\textrm{km}$
in length and $180\,\textrm{km}$
in width (Yagi & Fukahata Reference Yagi and Fukahata2011). Accordingly, we adopt an effective source of dimensions
$180\,\textrm{km}$
in width (Yagi & Fukahata Reference Yagi and Fukahata2011). Accordingly, we adopt an effective source of dimensions $2L=400\,\textrm{km}$
and
$2L=400\,\textrm{km}$
and $2d=180\,\textrm{km}$
, and prescribe the vertical seabed deformation using a smooth Gaussian distribution (Sammarco & Renzi Reference Sammarco and Renzi2008; Renzi & Mazza Reference Renzi and Mazza2023) characterised by half-widths
$2d=180\,\textrm{km}$
, and prescribe the vertical seabed deformation using a smooth Gaussian distribution (Sammarco & Renzi Reference Sammarco and Renzi2008; Renzi & Mazza Reference Renzi and Mazza2023) characterised by half-widths $L$
and
$L$
and $d$
comparable to these geometric scales; hence, back to physical variables
$d$
comparable to these geometric scales; hence, back to physical variables
 \begin{align} H_0(x,y)=A\exp\! \left (-\frac {x^2}{d^2}-\frac {y^2}{L^2}\right )\!. \end{align}
This idealised representation captures the dominant spatial extent of the coseismic deformation.
Wave propagation is modelled over a flat seabed of constant depth $h$
. We adopt an effective depth
$h$
. We adopt an effective depth $h=4500\,\textrm{m}$
, corresponding approximately to the mean of the bathymetric depth near the source region (
$h=4500\,\textrm{m}$
, corresponding approximately to the mean of the bathymetric depth near the source region ( ${\approx} 3800\,\textrm{m}$
) and at the receivers (
${\approx} 3800\,\textrm{m}$
) and at the receivers ( ${\approx} 5200\,\textrm{m}$
). Since the coseismic deformation is applied instantaneously in the present model, the comparisons are made relative to an effective source time. Taking the rupture duration to be
${\approx} 5200\,\textrm{m}$
). Since the coseismic deformation is applied instantaneously in the present model, the comparisons are made relative to an effective source time. Taking the rupture duration to be ${\sim} 6\,\textrm{min}$
(Li et al. Reference Li, Mei and Chan2019), we interpret
${\sim} 6\,\textrm{min}$
(Li et al. Reference Li, Mei and Chan2019), we interpret $t=0$
as the centroid of moment release, corresponding to a uniform time shift of
$t=0$
as the centroid of moment release, corresponding to a uniform time shift of ${\sim} 3\,\textrm{min}$
relative to the earthquake origin time.
${\sim} 3\,\textrm{min}$
relative to the earthquake origin time.
The peak amplitude $A$
of the Gaussian seabed uplift is selected based on the displaced water volume. For a Gaussian source, the displaced volume is
$A$
of the Gaussian seabed uplift is selected based on the displaced water volume. For a Gaussian source, the displaced volume is $V=\iint H_0\,\textrm{d}x\,\textrm{d}y = A\pi \,{\rm d}L$
. Using
$V=\iint H_0\,\textrm{d}x\,\textrm{d}y = A\pi \,{\rm d}L$
. Using $A=11\,\textrm{m}$
yields
$A=11\,\textrm{m}$
yields $V\approx 6.2\times 10^{11}\,\textrm{m}^3$
, corresponding to an equivalent uniform vertical displacement of approximately
$V\approx 6.2\times 10^{11}\,\textrm{m}^3$
, corresponding to an equivalent uniform vertical displacement of approximately $9\,\textrm{m}$
over the
$9\,\textrm{m}$
over the $400\times 180\,\textrm{km}^2$
source region. This magnitude is consistent with the overall scale of coseismic deformation inferred from tsunami waveform inversions of the Tōhoku earthquake, which report mean slip amplitudes of approximately
$400\times 180\,\textrm{km}^2$
source region. This magnitude is consistent with the overall scale of coseismic deformation inferred from tsunami waveform inversions of the Tōhoku earthquake, which report mean slip amplitudes of approximately $9\,\textrm{m}$
over comparable areas (Satake et al. Reference Satake, Fujii, Harada and Namegaya2013). The parameter
$9\,\textrm{m}$
over comparable areas (Satake et al. Reference Satake, Fujii, Harada and Namegaya2013). The parameter $A$
should therefore be interpreted as an effective source amplitude that reproduces a realistic displaced water volume.
$A$
should therefore be interpreted as an effective source amplitude that reproduces a realistic displaced water volume.
For the present geometry, the resulting value of the small parameter is $\epsilon =0.45$
, which remains below unity, but is not
$\epsilon =0.45$
, which remains below unity, but is not $\ll 1$
, placing the model at the upper limit of its formal range of applicability. The parameter
$\ll 1$
, placing the model at the upper limit of its formal range of applicability. The parameter $\beta =20$
, so that the dispersion parameter
$\beta =20$
, so that the dispersion parameter $\mu =1/\beta =0.05$
, indicates that wave propagation in the transoceanic region is only weakly dispersive.
$\mu =1/\beta =0.05$
, indicates that wave propagation in the transoceanic region is only weakly dispersive.
Comparison between leading-order free-surface elevation (2.54) and deep-ocean DART observations at stations 21 401 and 21 419 for the 11 March 2011 Tōhoku–oki tsunami. The DART records were digitised from Minami et al. (Reference Minami, Toh, Ichihara and Kawashima2017). Parameters are $\epsilon =0.45$
and
$\epsilon =0.45$
and $\beta =20$
. Time is in minutes since the earthquake occurrence. The comparison illustrates the ability of the idealised hydrodynamic model to reproduce the timing, polarity and amplitude of the leading tsunami signal at basin scale.
$\beta =20$
. Time is in minutes since the earthquake occurrence. The comparison illustrates the ability of the idealised hydrodynamic model to reproduce the timing, polarity and amplitude of the leading tsunami signal at basin scale.

Figure 3 compares the modelled free-surface elevation with the deep-ocean DART records at stations 21 401 and 21 419. Despite the idealised nature of the hydrodynamic model, the arrival times of the leading tsunami signal are reproduced with good accuracy at both locations, confirming that the modelling approach captures the dominant propagation speed over basin scales. The polarity and overall amplitude of the first wave are also correctly represented. Discrepancies in the detailed waveform shape and in later oscillations are expected, as these features are sensitive to bathymetric variability introducing wave refraction and reflection, which are neglected in the present flat-bottom framework. The comparison is therefore intended as a benchmark of the hydrodynamic wave propagation component, demonstrating that even at the upper limit of its formal asymptotic range, the model reproduces the correct arrival times, polarity and amplitude scale of the tsunami signal at deep-ocean stations.
Comparison between the asymptotic vertical magnetic perturbation $b_{z_0}$
(3.12) and observations at the deep-ocean station NWP for the 11 March 2011 Tōhoku–oki tsunami. Model parameters are
$b_{z_0}$
(3.12) and observations at the deep-ocean station NWP for the 11 March 2011 Tōhoku–oki tsunami. Model parameters are $F=5\times 10^4\,\textrm{nT}$
,
$F=5\times 10^4\,\textrm{nT}$
, $F_z=-3.5\times 10^4\,\textrm{nT}$
and a representative deep-ocean conductivity
$F_z=-3.5\times 10^4\,\textrm{nT}$
and a representative deep-ocean conductivity $\sigma =2\,\textrm{S m}^{-1}$
(consistent with Wang & Liu Reference Wang and Liu2013). Observational data are digitised from Minami & Toh (Reference Minami and Toh2013). The model captures the correct polarity and timing of the signal, with amplitudes of the correct order.
$\sigma =2\,\textrm{S m}^{-1}$
(consistent with Wang & Liu Reference Wang and Liu2013). Observational data are digitised from Minami & Toh (Reference Minami and Toh2013). The model captures the correct polarity and timing of the signal, with amplitudes of the correct order.

Figure 4 compares the predicted vertical magnetic perturbation $b_{z_0}$
at the deep-ocean station NWP with the corresponding observations. While an effective depth is used to represent basin-scale tsunami propagation, the magnetic amplitude depends on the local water depth at the station; for this comparison, the local NWP depth (
$b_{z_0}$
at the deep-ocean station NWP with the corresponding observations. While an effective depth is used to represent basin-scale tsunami propagation, the magnetic amplitude depends on the local water depth at the station; for this comparison, the local NWP depth ( ${\approx} 5600\,\textrm{m}$
) is therefore used when interpreting the induced magnetic signal. Dimensional magnetic amplitudes are obtained using a representative regional main-field intensity
${\approx} 5600\,\textrm{m}$
) is therefore used when interpreting the induced magnetic signal. Dimensional magnetic amplitudes are obtained using a representative regional main-field intensity $F\simeq 5\times 10^4\,\textrm{nT}$
and a local vertical component
$F\simeq 5\times 10^4\,\textrm{nT}$
and a local vertical component $F_z\simeq -3.5\times 10^4\,\textrm{nT}$
at the NWP site, obtained from NOAA’s National Center for Environmental Information. This modelling approach is consistent with Wang & Liu (Reference Wang and Liu2013).
$F_z\simeq -3.5\times 10^4\,\textrm{nT}$
at the NWP site, obtained from NOAA’s National Center for Environmental Information. This modelling approach is consistent with Wang & Liu (Reference Wang and Liu2013).
The asymptotic formula (3.12) captures the correct polarity and the overall phase of the signal, with the transition from the leading negative lobe to the positive lobe occurring at the appropriate time. The peak magnitudes are of the correct order (a few nT), although the model slightly overestimates the maximum amplitude. This behaviour is consistent with the simplified nature of the present framework: the magnetic response scales with a depth-regulated mechanism (Renzi & Mazza Reference Renzi and Mazza2023) more strongly than the surface gravity wave, and its amplitude is therefore sensitive to unresolved bathymetric variability and three-dimensional conductivity structure. In addition, the asymptotic hydrodynamic description neglects seabed dissipation that reduces the far-field current amplitudes driving induction. Accordingly, within this reduced flat-seabed formulation, the predicted $b_z$
should be interpreted as an upper-bound estimate of the deep-ocean magnetic amplitude, while preserving the correct timing and polarity. With the model behaviour validated against observations, we now discuss the physical interpretation of the results.
$b_z$
should be interpreted as an upper-bound estimate of the deep-ocean magnetic amplitude, while preserving the correct timing and polarity. With the model behaviour validated against observations, we now discuss the physical interpretation of the results.
5. Discussion
For the sake of example, consider a double-Gaussian symmetric deformation of the seabed (Sammarco & Renzi Reference Sammarco and Renzi2008; Renzi & Sammarco Reference Renzi and Sammarco2010, Reference Renzi and Sammarco2012, Reference Renzi and Sammarco2016). Returning to the use of primes for non-dimensional variables, the seabed deformation is represented as follows:
 \begin{equation} H'(x',y') = \exp \big [-\big (x{'}^2+y{'}^2\big )\big ]. \end{equation}
The system parameters are $\epsilon =0.1$
and
$\epsilon =0.1$
and $\beta = 20$
, which are typical for slender faults (Li et al. Reference Li, Mei and Chan2019). Figures 5 and 6 show contour plots of the free-surface elevation (2.54) and vertical magnetic field (2.81) at the seabed in non-dimensional coordinates, at four different instants:
$\beta = 20$
, which are typical for slender faults (Li et al. Reference Li, Mei and Chan2019). Figures 5 and 6 show contour plots of the free-surface elevation (2.54) and vertical magnetic field (2.81) at the seabed in non-dimensional coordinates, at four different instants: $t_1'=70$
,
$t_1'=70$
, $t_2'=210$
,
$t_2'=210$
, $t_3'=1000$
and
$t_3'=1000$
and $t_4'=1400$
.
$t_4'=1400$
.
Tsunami (2.54) and magnetic field (2.81) propagation over transoceanic distances at different times, for the seabed deformation (5.1): $(a)$
free-surface elevation
$(a)$
free-surface elevation $\zeta '(x',y',t')$
at
$\zeta '(x',y',t')$
at $t_1'=70$
;
$t_1'=70$
; $(b)$
vertical component of the magnetic field on the seabed
$(b)$
vertical component of the magnetic field on the seabed $b^{\prime}_{z^{\prime}_0}(x',y',-1,t')$
at
$b^{\prime}_{z^{\prime}_0}(x',y',-1,t')$
at $t^{\prime}_1=70$
;
$t^{\prime}_1=70$
; $(c)$
free-surface elevation at
$(c)$
free-surface elevation at $t^{\prime}_2=210$
;
$t^{\prime}_2=210$
; $(d)$
vertical component of the magnetic field on the seabed at
$(d)$
vertical component of the magnetic field on the seabed at $t^{\prime}_2=210$
. Parameters are
$t^{\prime}_2=210$
. Parameters are $\epsilon =0.1$
,
$\epsilon =0.1$
, $\beta =20$
,
$\beta =20$
, $F_z'=-0.33$
,
$F_z'=-0.33$
, ${{R}_m^w}=1.4$
,
${{R}_m^w}=1.4$
, ${{R}_m^s}=0.04$
.
${{R}_m^s}=0.04$
.

Tsunami (2.54) and magnetic field (2.81) propagation over transoceanic distances at different times, for the seabed deformation (5.1): $(a)$
free-surface elevation
$(a)$
free-surface elevation $\zeta '(x',y',t')$
at
$\zeta '(x',y',t')$
at $t^{\prime}_3=1000$
;
$t^{\prime}_3=1000$
; $(b)$
vertical component of the magnetic field on the seabed
$(b)$
vertical component of the magnetic field on the seabed $b^{\prime}_{z^{\prime}_0}(x',y',-1,t')$
at
$b^{\prime}_{z^{\prime}_0}(x',y',-1,t')$
at $t^{\prime}_3=1000$
;
$t^{\prime}_3=1000$
; $(c)$
free-surface elevation at
$(c)$
free-surface elevation at $t^{\prime}_4=1400$
;
$t^{\prime}_4=1400$
; $(d)$
vertical component of the magnetic field on the seabed at
$(d)$
vertical component of the magnetic field on the seabed at $t^{\prime}_4=1400$
. Parameters are
$t^{\prime}_4=1400$
. Parameters are $\epsilon =0.1$
,
$\epsilon =0.1$
, $\beta =20$
,
$\beta =20$
, $F_z'=-0.33$
,
$F_z'=-0.33$
, ${{R}}_m^w=1.4$
,
${{R}}_m^w=1.4$
, ${{R}_m^s}=0.04$
. Note that the magnetic dip in panel (
${{R}_m^s}=0.04$
. Note that the magnetic dip in panel ( $d$
) is at
$d$
) is at $x\simeq 71$
, whereas the tsunami crest in panel (
$x\simeq 71$
, whereas the tsunami crest in panel ( $c$
) is at
$c$
) is at $x\simeq 70$
; hence, the magnetic signal precedes the tsunami leading crest by a unit distance, corresponding to the fault’s width.
$x\simeq 70$
; hence, the magnetic signal precedes the tsunami leading crest by a unit distance, corresponding to the fault’s width.

Waves originally propagate along the $x'$
-axis (figure 5
$x'$
-axis (figure 5 $a$
,
$a$
, $c$
), exhibiting dynamics akin to the 1-HD limit described by Renzi & Mazza (Reference Renzi and Mazza2023). At longer time, however, lateral propagation begins to influence the wave behaviour, resulting in the stretching and bending of the leading wave front, while the main direction of travel is still along the
$c$
), exhibiting dynamics akin to the 1-HD limit described by Renzi & Mazza (Reference Renzi and Mazza2023). At longer time, however, lateral propagation begins to influence the wave behaviour, resulting in the stretching and bending of the leading wave front, while the main direction of travel is still along the $x'$
-axis (figure 6
$x'$
-axis (figure 6 $a$
). As time progresses further, waves propagate in multiple directions, notably including the
$a$
). As time progresses further, waves propagate in multiple directions, notably including the $y'$
-axis, although longitudinal propagation along the
$y'$
-axis, although longitudinal propagation along the $x'$
-axis is still prevalent (figure 6
$x'$
-axis is still prevalent (figure 6 $c$
). The magnetic field demonstrates similar behaviour, initially exhibiting 1-HD dynamics (figure 5
$c$
). The magnetic field demonstrates similar behaviour, initially exhibiting 1-HD dynamics (figure 5 $b$
,
$b$
, $d$
) before bending and stretching as time progresses, ultimately spreading in various directions, with the dominant direction still being longitudinal (figure 6
$d$
) before bending and stretching as time progresses, ultimately spreading in various directions, with the dominant direction still being longitudinal (figure 6 $b$
,
$b$
, $d$
). Interestingly, the magnetic field initially travels almost together with the tsunami (figure 5), but over time, it separates and moves ahead, with a magnetic dip preceding the tsunami leading wave by a unit distance corresponding to the fault’s width (figure 6).
$d$
). Interestingly, the magnetic field initially travels almost together with the tsunami (figure 5), but over time, it separates and moves ahead, with a magnetic dip preceding the tsunami leading wave by a unit distance corresponding to the fault’s width (figure 6).
5.1. Effect of $y$
-axis propagation
$y$
-axis propagation

In this section, we study the effect of $y$
-axis propagation on both the gravity wave and magnetic fields. To highlight the differences compared with a 1-HD scenario, we now use dimensional variables and consider the same parameters as Renzi & Mazza (Reference Renzi and Mazza2023), i.e.
$y$
-axis propagation on both the gravity wave and magnetic fields. To highlight the differences compared with a 1-HD scenario, we now use dimensional variables and consider the same parameters as Renzi & Mazza (Reference Renzi and Mazza2023), i.e. $A=3$
m,
$A=3$
m, $h=2000$
m and
$h=2000$
m and $d = 5000$
m. The Earth’s magnetic field has components
$d = 5000$
m. The Earth’s magnetic field has components $F_x=F_y=40\,000$
nT and
$F_x=F_y=40\,000$
nT and $F_z=-20\,000$
nT;
$F_z=-20\,000$
nT; $\sigma _w = 4\,\textrm{S}\,\textrm{m}^{-1}$
and
$\sigma _w = 4\,\textrm{S}\,\textrm{m}^{-1}$
and $\sigma _s=0.1\,\textrm{S}\,\textrm{m}^{-1}$
(Wang & Liu Reference Wang and Liu2013; Minami et al. Reference Minami, Toh and Tyler2015).
$\sigma _s=0.1\,\textrm{S}\,\textrm{m}^{-1}$
(Wang & Liu Reference Wang and Liu2013; Minami et al. Reference Minami, Toh and Tyler2015).
Figures 7 and 8 show the temporal evolution of the free-surface elevation and vertical magnetic field on the seabed at two different locations, for varying values of the shape parameter $\epsilon$
. The selected points are
$\epsilon$
. The selected points are $P_1=(3500,0)$
km and
$P_1=(3500,0)$
km and $P_2=(1000,364)$
km. At point
$P_2=(1000,364)$
km. At point $P_1$
along the main direction of propagation on the
$P_1$
along the main direction of propagation on the $x$
-axis, the effect of lateral propagation is to slightly decrease the arrival time of the first tsunami crest and substantially decrease its amplitude, as
$x$
-axis, the effect of lateral propagation is to slightly decrease the arrival time of the first tsunami crest and substantially decrease its amplitude, as $\epsilon$
increases. Interestingly, for
$\epsilon$
increases. Interestingly, for $\epsilon =0.1$
, the leading wave is no longer the largest and the maximum crest is found in the trailing waves. Similar dispersive dynamics is also observed in the transverse propagation of landslide tsunamis along a plane beach (Sammarco & Renzi Reference Sammarco and Renzi2008). The magnetic field follows the general behaviour of the free-surface elevation. For small
$\epsilon =0.1$
, the leading wave is no longer the largest and the maximum crest is found in the trailing waves. Similar dispersive dynamics is also observed in the transverse propagation of landslide tsunamis along a plane beach (Sammarco & Renzi Reference Sammarco and Renzi2008). The magnetic field follows the general behaviour of the free-surface elevation. For small $y$
-axis propagation, an initial magnetic field anomaly of approximately
$y$
-axis propagation, an initial magnetic field anomaly of approximately $0.1\,\textrm{nT}$
arrives at the observation point approximately
$0.1\,\textrm{nT}$
arrives at the observation point approximately $10{-}15$
min before the tsunami crest, in agreement with field observations (Minami et al. Reference Minami, Toh and Tyler2015, Reference Minami, Schnepf and Toh2021). We remark that previous models based on a sinusoidal approximation of the tsunami wavefield do not capture this initial decrease of the vertical magnetic component (Tatehata et al. Reference Tatehata, Ichihara and Hamano2015). Such a signal is detectable by modern geomagnetic instrumentation, which achieves resolution down to 0.01 nT (Sugioka et al. Reference Sugioka, Hamano, Baba, Kasaya, Tada and Suetsugu2014; Renzi & Mazza Reference Renzi and Mazza2023). This suggests that the magnetic field can be used as a precursor to the tsunami, allowing for early warning and evacuation. When lateral propagation becomes more prominent (
$10{-}15$
min before the tsunami crest, in agreement with field observations (Minami et al. Reference Minami, Toh and Tyler2015, Reference Minami, Schnepf and Toh2021). We remark that previous models based on a sinusoidal approximation of the tsunami wavefield do not capture this initial decrease of the vertical magnetic component (Tatehata et al. Reference Tatehata, Ichihara and Hamano2015). Such a signal is detectable by modern geomagnetic instrumentation, which achieves resolution down to 0.01 nT (Sugioka et al. Reference Sugioka, Hamano, Baba, Kasaya, Tada and Suetsugu2014; Renzi & Mazza Reference Renzi and Mazza2023). This suggests that the magnetic field can be used as a precursor to the tsunami, allowing for early warning and evacuation. When lateral propagation becomes more prominent ( $\epsilon =0.1$
), the magnetic signal continues to precede the tsunami (see also figure 6), but its amplitude strongly diminishes, presenting challenges for early warning systems.
$\epsilon =0.1$
), the magnetic signal continues to precede the tsunami (see also figure 6), but its amplitude strongly diminishes, presenting challenges for early warning systems.
Time series of the free-surface elevation and vertical magnetic field on the seabed at location $P_1=(3500,0)\,\textrm{km}$
, for various values of the shape parameter
$P_1=(3500,0)\,\textrm{km}$
, for various values of the shape parameter $\epsilon$
. Other parameters are
$\epsilon$
. Other parameters are $A=3$
m,
$A=3$
m, $h=2000$
m,
$h=2000$
m, $d=5000$
m,
$d=5000$
m, ${{R}_m^w}=1.4$
,
${{R}_m^w}=1.4$
, ${{R}_m^s}=0.04$
. The inset shows the position of point
${{R}_m^s}=0.04$
. The inset shows the position of point $P_1$
with respect to the epicentre
$P_1$
with respect to the epicentre $E$
(values in km).
$E$
(values in km).

Time series of the free-surface elevation and vertical magnetic field on the seabed at location $P_2=(1000,364)\,\textrm{km}$
for various values of the shape parameter
$P_2=(1000,364)\,\textrm{km}$
for various values of the shape parameter $\epsilon$
. Other parameters are
$\epsilon$
. Other parameters are $A=3$
m,
$A=3$
m, $h=2000$
m,
$h=2000$
m, $d=5000$
m,
$d=5000$
m, ${{R}_m}=1.4$
,
${{R}_m}=1.4$
, ${{R}_m^s}=0.04$
. The inset shows the position of point
${{R}_m^s}=0.04$
. The inset shows the position of point $P_2$
with respect to the epicentre
$P_2$
with respect to the epicentre $E$
(values in km).
$E$
(values in km).

At point $P_2$
, positioned at a
$P_2$
, positioned at a $20^\circ$
angle with respect to the
$20^\circ$
angle with respect to the $x$
-axis,
$x$
-axis, $y$
-axis propagation is more prominent and, again, decreases the tsunami amplitude (see figure 8). Remarkably, the time of arrival of the first crest increases with higher
$y$
-axis propagation is more prominent and, again, decreases the tsunami amplitude (see figure 8). Remarkably, the time of arrival of the first crest increases with higher $\epsilon$
, which induces bending of the leading wave front, presenting a notable contrast with point
$\epsilon$
, which induces bending of the leading wave front, presenting a notable contrast with point $P_1$
. Regarding the magnetic field, again the vertical magnetic component follows the general behaviour of the free-surface elevation. An early arrival of the magnetic anomaly remains evident for very small
$P_1$
. Regarding the magnetic field, again the vertical magnetic component follows the general behaviour of the free-surface elevation. An early arrival of the magnetic anomaly remains evident for very small $y$
-axis propagation (
$y$
-axis propagation ( $\epsilon =0.01)$
. However, with
$\epsilon =0.01)$
. However, with $\epsilon = 0.1$
, the situation changes significantly: the magnetic field still travels ahead of the tsunami, although the amplitude of the early arrival signal is very small and falls below detectable limits, posing challenges in using magnetic anomalies as precursors for tsunamis. We next investigate the effects of the magnetic Reynolds number on the magnetic field.
$\epsilon = 0.1$
, the situation changes significantly: the magnetic field still travels ahead of the tsunami, although the amplitude of the early arrival signal is very small and falls below detectable limits, posing challenges in using magnetic anomalies as precursors for tsunamis. We next investigate the effects of the magnetic Reynolds number on the magnetic field.
5.2. Dependence on the magnetic Reynolds number
The magnetic Reynolds number, ${{R}_m^w}$
, plays a significant role in determining the strength of the magnetic anomaly that travels ahead of the tsunami, as well as its phase relative to the wave. This behaviour is linked to the water depth, as shown in (1.1) with
${{R}_m^w}$
, plays a significant role in determining the strength of the magnetic anomaly that travels ahead of the tsunami, as well as its phase relative to the wave. This behaviour is linked to the water depth, as shown in (1.1) with $\eta =\eta _w$
. In one-horizontal dimension (1-HD), Renzi & Mazza (Reference Renzi and Mazza2023) demonstrated that a decrease in the magnetic Reynolds number – caused by a reduction in the water depth at which seabed motion occurs – leads to an earlier arrival of the magnetic signal. Conversely, an increase in the water depth at which seabed motion occurs produces the opposite effect. Physically, Renzi & Mazza (Reference Renzi and Mazza2023) illustrated that the magnetic Reynolds number in the water layer quantifies the relative importance of the induction and diffusion components of the magnetic field, as described by the dynamo (2.59). Specifically, they obtained the relationship:
$\eta =\eta _w$
. In one-horizontal dimension (1-HD), Renzi & Mazza (Reference Renzi and Mazza2023) demonstrated that a decrease in the magnetic Reynolds number – caused by a reduction in the water depth at which seabed motion occurs – leads to an earlier arrival of the magnetic signal. Conversely, an increase in the water depth at which seabed motion occurs produces the opposite effect. Physically, Renzi & Mazza (Reference Renzi and Mazza2023) illustrated that the magnetic Reynolds number in the water layer quantifies the relative importance of the induction and diffusion components of the magnetic field, as described by the dynamo (2.59). Specifically, they obtained the relationship:
 \begin{equation} \xi = \frac {\textrm{induction}}{\textrm{diffusion}} = \frac {{{R}_m^w}}{2} = \frac {h\sqrt {gh}}{2\eta }. \end{equation}
Renzi & Mazza (Reference Renzi and Mazza2023) showed that, when tsunamigenic seabed motion occurs at water depth for which ${\xi }\lt 1$
, the diffusion term becomes more important. The magnetic field is dominated by a diffusive component that propagates at the lateral diffusion speed
${\xi }\lt 1$
, the diffusion term becomes more important. The magnetic field is dominated by a diffusive component that propagates at the lateral diffusion speed $c_d=2\eta /h$
, which exceeds the leading tsunami wave speed
$c_d=2\eta /h$
, which exceeds the leading tsunami wave speed $c_t=\sqrt {gh}$
, resulting in an early arrival of the vertical magnetic field at the seabed. This result agrees with Minami et al. (Reference Minami, Toh and Tyler2015), who showed that the magnetic anomaly is strongest when
$c_t=\sqrt {gh}$
, resulting in an early arrival of the vertical magnetic field at the seabed. This result agrees with Minami et al. (Reference Minami, Toh and Tyler2015), who showed that the magnetic anomaly is strongest when $\xi =c_t/c_d\simeq 1/\sqrt {2}$
, i.e.
$\xi =c_t/c_d\simeq 1/\sqrt {2}$
, i.e. ${{R}_m^w}\simeq 1.4$
. This corresponds to maximising Tyler’s formula (3.7) in physical variables, as a function of the water depth
${{R}_m^w}\simeq 1.4$
. This corresponds to maximising Tyler’s formula (3.7) in physical variables, as a function of the water depth $h$
. However, note that Minami et al. (Reference Minami, Toh and Tyler2015) consider monochromatic progressive waves of a given frequency
$h$
. However, note that Minami et al. (Reference Minami, Toh and Tyler2015) consider monochromatic progressive waves of a given frequency $\omega$
; hence, their result does not take into account the tsunamigenic seabed motion and the transient nature of the associated wave field.
$\omega$
; hence, their result does not take into account the tsunamigenic seabed motion and the transient nature of the associated wave field.
Conversely, when seabed motion occurs at water depth for which $\xi \gt 1$
, the induction term is more important. The case
$\xi \gt 1$
, the induction term is more important. The case $\xi \gg 1$
is akin to the limit
$\xi \gg 1$
is akin to the limit $\eta \rightarrow 0$
of the frozen flux regime (Davidson Reference Davidson2016). In this case, fluid elements initially on a magnetic field line remain on that line indefinitely, a principle known as Alfven’s theorem (Davidson Reference Davidson2016). Under these conditions, magnetic and wave fields propagate together, as the magnetic field is self-induced by the fluid, thereby precluding the possibility of advance warning.
$\eta \rightarrow 0$
of the frozen flux regime (Davidson Reference Davidson2016). In this case, fluid elements initially on a magnetic field line remain on that line indefinitely, a principle known as Alfven’s theorem (Davidson Reference Davidson2016). Under these conditions, magnetic and wave fields propagate together, as the magnetic field is self-induced by the fluid, thereby precluding the possibility of advance warning.
When accounting for slow lateral propagation in 2-HD, the dynamics become more complicated due to the interplay between the two parameters, ${{R}_m^w}$
and
${{R}_m^w}$
and $\epsilon$
. Figure 9 shows time series of the normalised vertical magnetic field,
$\epsilon$
. Figure 9 shows time series of the normalised vertical magnetic field, $|( {b_{z0}}/{F_z})( {h}/{\max \{{\zeta }\}})|$
, for different values of
$|( {b_{z0}}/{F_z})( {h}/{\max \{{\zeta }\}})|$
, for different values of ${{R}_m^w}$
and
${{R}_m^w}$
and $\epsilon$
, with the other parameters being the same as those in figure 7. The normalisation removes two separate effects: dividing by
$\epsilon$
, with the other parameters being the same as those in figure 7. The normalisation removes two separate effects: dividing by $\max \{{\zeta }\}$
removes dependence on the hydrodynamic forcing amplitude, while multiplying by
$\max \{{\zeta }\}$
removes dependence on the hydrodynamic forcing amplitude, while multiplying by $h$
cancels the geometric
$h$
cancels the geometric $1/h$
factor introduced by our scaling (2.63). This ensures that comparisons across depths reflect the intrinsic induction efficiency.
$1/h$
factor introduced by our scaling (2.63). This ensures that comparisons across depths reflect the intrinsic induction efficiency.
Non-dimensional time series of normalised vertical magnetic field at the seabed for various values of ${{R}_m^w}$
and
${{R}_m^w}$
and $\epsilon$
. Other parameters are
$\epsilon$
. Other parameters are $A=3$
m,
$A=3$
m, $d=2000$
m,
$d=2000$
m, ${{R}_m^s}=0.04$
.
${{R}_m^s}=0.04$
.

When ${{R}_m^w}$
is fixed, an increase in
${{R}_m^w}$
is fixed, an increase in $\epsilon$
reduces the initial amplitude of the magnetic signal (see again figure 9), which, in practical terms, can make early detection more challenging. This is because, as
$\epsilon$
reduces the initial amplitude of the magnetic signal (see again figure 9), which, in practical terms, can make early detection more challenging. This is because, as $\epsilon$
increases,
$\epsilon$
increases, $y$
-axis propagation becomes more noticeable. The leading magnetic dip at the front of the magnetic signal stretches and bends, causing energy to be distributed over a larger front (see again figure 6), which results in a reduction of the initial dip. Interestingly, the amplitude of the magnetic signals following the early arrival increases with increasing
$y$
-axis propagation becomes more noticeable. The leading magnetic dip at the front of the magnetic signal stretches and bends, causing energy to be distributed over a larger front (see again figure 6), which results in a reduction of the initial dip. Interestingly, the amplitude of the magnetic signals following the early arrival increases with increasing $\epsilon$
; however, these are later signals, making them unsuitable for early warning.
$\epsilon$
; however, these are later signals, making them unsuitable for early warning.
Decreasing the water depth at which seabed motion occurs consequently reduces ${{R}_m^w}$
. As a result, the relative importance of diffusion increases in comparison to induction (see again (5.2)). However, the wave amplitude
${{R}_m^w}$
. As a result, the relative importance of diffusion increases in comparison to induction (see again (5.2)). However, the wave amplitude $\zeta$
also increases because seabed motion becomes shallower. The net effect is that the normalised magnetic signal decreases, as illustrated in figure 9(b). Therefore, when the effects of shallower seabed motion are filtered out by considering the normalised magnetic field, as shown in figure 9, propagation in shallower waters leads to a decrease in the magnetic signal. A similar result was obtained by Minami et al. (Reference Minami, Toh and Tyler2015) for a monochromatic progressive wave and is confirmed here for a transient propagating wave.
$\zeta$
also increases because seabed motion becomes shallower. The net effect is that the normalised magnetic signal decreases, as illustrated in figure 9(b). Therefore, when the effects of shallower seabed motion are filtered out by considering the normalised magnetic field, as shown in figure 9, propagation in shallower waters leads to a decrease in the magnetic signal. A similar result was obtained by Minami et al. (Reference Minami, Toh and Tyler2015) for a monochromatic progressive wave and is confirmed here for a transient propagating wave.
5.3. Validity of the large-distance approximation
Here, we examine the validity of the asymptotic approximation (3.12). Recall that this approximation ignores the conductivity of the seabed and is only valid at a significant distance from the fault. Specifically, it applies to the magnetic anomaly associated with the leading long wave that moves ahead of the dispersive group during transoceanic propagation.
Figure 10 shows time series of the magnetic field at the seabed plotted using both the full solution (2.81) and the asymptotic approximation (3.12), for ${{R}_m^w}=1.4$
(panel a) and
${{R}_m^w}=1.4$
(panel a) and ${{R}_m^s}=0.5$
(panel b), with
${{R}_m^s}=0.5$
(panel b), with $\epsilon =0.1$
in both cases. All the other parameters are the same as in figure 9. Note that the asymptotic formula overestimates the amplitude of the magnetic field. This is due to the neglect of magnetic diffusion in the seabed and the long-wave approximation introduced when using the Tyler formula (3.7) to derive the asymptotic behaviour. However, despite
$\epsilon =0.1$
in both cases. All the other parameters are the same as in figure 9. Note that the asymptotic formula overestimates the amplitude of the magnetic field. This is due to the neglect of magnetic diffusion in the seabed and the long-wave approximation introduced when using the Tyler formula (3.7) to derive the asymptotic behaviour. However, despite $\epsilon = 0.1$
not being particularly small, which suggests that appreciable lateral propagation is occurring, the asymptotic approximation (3.12) is very accurate, with a relative error of approximately 5 % on the initial magnetic dip and a maximum relative error of approximately 10 % near the extremes. Furthermore, its computational cost (approximately one minute with MATLAB on a commercial PC equipped with Intel(R) Core(TM) i7–10 700 CPU at 2.90 GHz and 64 GB of RAM) is significantly lower than that of the full formula (several minutes). This is a significant advantage, as it means one can employ the asymptotic approximation (3.12) for real-time assessments and early warnings with minimal loss of precision, and then use (2.81) or full numerical computations for more refined analysis.
$\epsilon = 0.1$
not being particularly small, which suggests that appreciable lateral propagation is occurring, the asymptotic approximation (3.12) is very accurate, with a relative error of approximately 5 % on the initial magnetic dip and a maximum relative error of approximately 10 % near the extremes. Furthermore, its computational cost (approximately one minute with MATLAB on a commercial PC equipped with Intel(R) Core(TM) i7–10 700 CPU at 2.90 GHz and 64 GB of RAM) is significantly lower than that of the full formula (several minutes). This is a significant advantage, as it means one can employ the asymptotic approximation (3.12) for real-time assessments and early warnings with minimal loss of precision, and then use (2.81) or full numerical computations for more refined analysis.


6. Conclusions
We have developed a novel mathematical model for broad-banded, transient surface gravity waves generated by a sudden displacement of an otherwise flat seabed, characterised by a longitudinal dimension significantly smaller than the lateral extension (i.e. a slender fault). Employing a perturbative method with three-timing in a two-dimensional Fourier space, Green’s function approach and integration in the complex plane, we elucidated the long-term evolution of the wavefront and induced magnetic anomaly. The modelling approach is validated through comparison with deep-ocean hydrodynamic and magnetic signals from the 2011 Japan tsunami.
Our findings reveal significant insights into the behaviour of tsunamis and induced electromagnetic anomalies generated from slender faults. We showed that increasing the lateral fault extension decreases the amplitude of the surface waves and the induced magnetic field, increases the arrival time of the initial tsunami crest in the lateral direction, but notably decreases it in the longitudinal direction. Additionally, stronger lateral propagation leads to a significant decrease in the detectability of the magnetic anomaly.
The magnetic Reynolds number of the ocean layer, which depends on the water depth, plays a significant role in determining the magnitude and spatial distribution of the magnetic field. Within the constant-depth framework adopted here, deployment of geomagnetic observatories at locations with seafloor depths around 2000 m maximises the balance between magnetic signal strength and lead time. At this depth, the magnetic induction effect is maximised, allowing the magnetic signal to precede the tsunami by approximately 10–20 min. Modern seafloor magnetometers achieve resolutions down to 0.01 nT (Sugioka et al. Reference Sugioka, Hamano, Baba, Kasaya, Tada and Suetsugu2014), meaning that – based on the time traces shown in figures 7 and 8 – the tsunami arrival could be forecast 10–20 min in advance from the moment the magnetic anomaly is detected. In real-ocean settings, bathymetric variability will influence this optimal value and assessing its effect would require explicit modelling with realistic bathymetry. Our suggestion is qualitatively similar to the one proposed by Minami et al. (Reference Minami, Toh and Tyler2015), but their study focused on progressive waves in the frequency domain, without considering any correlation between the tsunamigenic source and the magnetic signal. In contrast, our work provides a rigorous mathematical framework that extends the results of Minami et al. (Reference Minami, Toh and Tyler2015) to a more realistic scenario, where the tsunami is accurately represented as a transient propagating wave and the magnetic field is directly linked to the tsunamigenic source in the time domain, as described in (2.81).
Finally, we present a novel asymptotic formula derived from the application of Tyler (Reference Tyler2005)’s approximation for very long waves, which allows for the rapid calculation of the early magnetic signal induced by the leading long wave. Our formula is very accurate, producing results with a relative error of approximately 5 % on the leading magnetic signal, even when appreciable propagation occurs along the fault’s main axis. It holds significant potential for early assessments in tsunami warning systems, as it can be used to solve the inverse problem of estimating tsunami height from geomagnetic recordings, marking an exciting development.
The intriguing interaction between 2-HD propagation and magnetic diffusion warrants further study to fully elucidate the functional dependence of the magnetic anomaly on the shape parameter $\epsilon$
and the magnetic Reynolds number across varying bathymetry. This dynamics underscores the interplay between two-horizontal-dimension propagation and water depth in shaping the detectability of magnetic anomalies as potential tsunami precursors. We also note that at very long distances from the fault, the tsunami phase velocity is influenced by factors such as water compressibility, seabed elasticity and the gravitational potential in the water layer (Abdolali, Kadri & Kirby Reference Abdolali, Kadri and Kirby2019). While considering these factors would lead to more accurate travel times for intercontinental distances of the order of
$\epsilon$
and the magnetic Reynolds number across varying bathymetry. This dynamics underscores the interplay between two-horizontal-dimension propagation and water depth in shaping the detectability of magnetic anomalies as potential tsunami precursors. We also note that at very long distances from the fault, the tsunami phase velocity is influenced by factors such as water compressibility, seabed elasticity and the gravitational potential in the water layer (Abdolali, Kadri & Kirby Reference Abdolali, Kadri and Kirby2019). While considering these factors would lead to more accurate travel times for intercontinental distances of the order of $O(10^7)$
metres, this is beyond the scope of the current study. Finally, we remark that as the tsunami approaches the coastline, nonlinear effects begin to manifest, amplifying wave heights and affecting the magnetic field further. Such research is critical for enhancing the reliability of tsunami early warning systems based on magnetic field detection.
$O(10^7)$
metres, this is beyond the scope of the current study. Finally, we remark that as the tsunami approaches the coastline, nonlinear effects begin to manifest, amplifying wave heights and affecting the magnetic field further. Such research is critical for enhancing the reliability of tsunami early warning systems based on magnetic field detection.
Declaration of interests
The authors report no conflict of interest.
Appendix A. Integration of the governing system of equations for the magnetic field
A.1. Green’s function
Consider the governing system of (2.77)–(2.79). The relevant Green function $G(z,\xi ,t)$
solves the initial-boundary-value problem
$G(z,\xi ,t)$
solves the initial-boundary-value problem
 \begin{align}&\qquad\qquad\qquad\qquad\qquad \frac {\partial ^2 G}{\partial z^2}-\frac {k_x^2}{\beta ^2} G=0,\quad z\in (0,+\infty ), \end{align}
 \begin{align}& \beta ^2 \frac {\partial G}{\partial t}+\frac {k_x^2}{{{R}_m^w}}G-\frac {\beta ^2}{{{R}_m^w}}\frac {\partial ^2 G}{\partial z^2}=\delta (t-0^+)\delta (z-\xi ),\quad z\in (-1,0),\; \xi \in (-1,0), \end{align}
and
 \begin{equation} \beta ^2 \frac {\partial G}{\partial t}+\frac {k_x^2}{{{R}_m^s}}G-\frac {\beta ^2}{{{R}_m^s}}\frac {\partial ^2 G}{\partial z^2}=0,\quad z\in (-\infty ,-1), \end{equation}
with the initial condition $G(z,\xi ,0)=0$
and the requirement that
$G(z,\xi ,0)=0$
and the requirement that $G$
be bounded as
$G$
be bounded as $|z|\rightarrow \infty$
. The dependence of
$|z|\rightarrow \infty$
. The dependence of $G$
on
$G$
on $k_x$
and
$k_x$
and $k_y$
is understood and has been omitted for the sake of brevity. Application of the Laplace transform pair
$k_y$
is understood and has been omitted for the sake of brevity. Application of the Laplace transform pair
 \begin{equation} \bar {G}(z,\xi ;s)=\int _0^\infty G(z,\xi ,t)\,\textrm{e}^{-st}\,{\textrm{d}} s; \quad G(z,\xi ,t)=\frac {1}{2\pi \textrm{i}}\int _\varGamma \bar {G}(z,\xi ;s)\,\textrm{e}^{st}\,{\textrm{d}} s, \end{equation}
where $\varGamma$
is a vertical line in the complex plane to the right of the singularities of
$\varGamma$
is a vertical line in the complex plane to the right of the singularities of $\bar {G}$
, yields a system of differential equations for
$\bar {G}$
, yields a system of differential equations for $\bar {G}$
, namely
$\bar {G}$
, namely
 \begin{align}&\qquad\qquad\quad \frac {\partial ^2 \bar {G}}{\partial z^2}-\frac {k_x^2}{\beta ^2}\bar {G}=0,\quad z\in (0,+\infty ), \end{align}
 \begin{align}& \frac {\partial ^2\bar {G}}{\partial z^2}-\left (\frac {k_x^2}{\beta ^2}+{{R}_m^w} s \right )\bar {G}=-\frac {{{R}_m^w}}{\beta ^2}\,\delta (z-\xi ),\quad z\in (-1,0), \end{align}
 \begin{align}&\qquad\,\, \frac {\partial ^2\bar {G}}{\partial z^2}-\left (\frac {k_x^2}{\beta ^2}+{{R}_m^s} s \right )\bar {G}=0,\quad z\in (-\infty ,-1). \end{align}
The bounded solution of (A5) is
 \begin{equation} \bar {G}=A \exp \left (-\frac {|k_x|}{\beta } z\right )\!, \quad z\in (0,\infty ), \end{equation}
with $k_x\in \mathbb{R}$
and
$k_x\in \mathbb{R}$
and $A$
an undetermined function of
$A$
an undetermined function of $\xi$
. Next, we solve (A6) by splitting the Green function into
$\xi$
. Next, we solve (A6) by splitting the Green function into $\bar {G}_\gt$
(for
$\bar {G}_\gt$
(for $z\gt \xi$
) and
$z\gt \xi$
) and $\bar {G}_\lt$
(for
$\bar {G}_\lt$
(for $z\lt \xi )$
, where the Dirac delta has no value (Mei Reference Mei1997). Solution of (A6) yields
$z\lt \xi )$
, where the Dirac delta has no value (Mei Reference Mei1997). Solution of (A6) yields
 \begin{align}&\qquad\,\,\, \bar {G}_\gt =B \cosh \left (\alpha _w z\right )+ C\sinh (\alpha _w z), \quad z\in (\xi ,0),\, \xi \in (-1,0), \end{align}
 \begin{align}& \bar {G}_\lt =D \cosh \left [\alpha _w (z+1)\right ]+ E\sinh [\alpha _w (z+1)], \quad z\in (-1,\xi ),\,\xi \in (-1,0), \end{align}
where
 \begin{equation} \alpha _w(s,k_x)=\sqrt {{{R}_m^w} s+\frac {k_x^2}{\beta ^2}} \end{equation}
is a magnetic wavenumber for the water layer in the complex $s$
-plane, with a branch cut introduced along the negative real
$s$
-plane, with a branch cut introduced along the negative real $s$
-axis to avoid multivaluedness, similar to Renzi & Mazza (Reference Renzi and Mazza2023). Finally, the bounded solution of (A7) is
$s$
-axis to avoid multivaluedness, similar to Renzi & Mazza (Reference Renzi and Mazza2023). Finally, the bounded solution of (A7) is
 \begin{align}& \bar {G}=F \exp \left [\sigma \alpha _s(z+1) \right ], \quad z\in (-\infty ,-1), \end{align}
 \begin{align}&\qquad\quad \alpha _s(s,k_x)=\sqrt {{{R}_m^s} s+\frac {k_x^2}{\beta ^2}} \end{align}
is a magnetic wavenumber for the soil layer in the complex $s$
-plane, with relevant branch cut as discussed in Appendix A.2, and
$s$
-plane, with relevant branch cut as discussed in Appendix A.2, and $\sigma =\textrm{sign}({Re}\{\alpha _s\})$
is introduced to ensure boundedness. The solutions in each layer, namely (A8), (A9), (A10) and (A12), must be matched at the interfaces
$\sigma =\textrm{sign}({Re}\{\alpha _s\})$
is introduced to ensure boundedness. The solutions in each layer, namely (A8), (A9), (A10) and (A12), must be matched at the interfaces $z=0$
,
$z=0$
, $z=-1$
and
$z=-1$
and $z=\xi$
to determine the six unknowns
$z=\xi$
to determine the six unknowns $A,B,\ldots ,F$
. Because of continuity, the following matching conditions apply (see Renzi & Mazza Reference Renzi and Mazza2023):
$A,B,\ldots ,F$
. Because of continuity, the following matching conditions apply (see Renzi & Mazza Reference Renzi and Mazza2023):
 \begin{align}&\, \bar {G}_\gt =\bar {G}, \quad \frac {{\textrm{d}} \bar {G}_\gt }{{\textrm{d}} z}=\frac {{\textrm{d}} \bar {G}}{{\textrm{d}} z}, \quad z=0, \end{align}
 \begin{align}& \bar {G}_\lt =\bar {G}, \quad \frac {{\textrm{d}} \bar {G}_\lt }{{\textrm{d}} z}=\frac {{\textrm{d}} \bar {G}}{{\textrm{d}} z}, \quad z=-1, \end{align}
 \begin{align}&\qquad\qquad \bar {G}_\gt =\bar {G}_\lt ,\quad z=\xi . \end{align}
Furthermore, integration across the singularity in (A6) yields another matching condition
 \begin{equation} \frac {{\textrm{d}}\bar {G}_\gt }{{\textrm{d}} z}-\frac {{\textrm{d}}\bar {G}_\lt }{{\textrm{d}} z}=-\frac {{{R}_m^w}}{\beta ^2},\quad z=\xi . \end{equation}
Equations (A14)–(A17) are a linear system of six equations in six unknowns, which can be solved analytically to give the Laplace transform of Green’s function in the water layer,
 \begin{align}& \bar {G}(z,\xi ;s)=\frac {{{R}_m^w}}{\beta ^2}\left [\alpha _w \cosh (\alpha _w z_\gt )-\frac {|k_x|}{\beta } \sinh (\alpha _w z_\gt ) \right ]\nonumber \\ &\quad\times \left [\alpha _w\cosh \left [\alpha _w(z_\lt +1) \right ]+\sigma \alpha _s \sinh \left [\alpha _w(z_\lt +1) \right ]\right ]\nonumber \nonumber \\ &\quad\times \frac {1}{\alpha _w} \left [\alpha _w\left (\sigma \alpha _s+\frac {|k_x|}{\beta }\right )\cosh (\alpha _w)+\left (\alpha _w^2+\sigma \alpha _s|\frac {|k_x|}{\beta } \right )\sinh (\alpha ) \right ]^{-1}\!, \!\quad z\in (-1,0). \end{align}
In the latter, $z_\gt =\max \{z,\xi \}$
,
$z_\gt =\max \{z,\xi \}$
, $z_\lt =\min \{z,\xi \}$
. Note that
$z_\lt =\min \{z,\xi \}$
. Note that $\bar {G}$
is a function of the complex variable
$\bar {G}$
is a function of the complex variable $s$
via
$s$
via $\alpha _w$
(A11) and
$\alpha _w$
(A11) and $\alpha _s$
(A13).
$\alpha _s$
(A13).
A.2. Magnetic field
Once $\bar {G}$
is known, the magnetic field can be obtained by inverse Laplace transform of
$\bar {G}$
is known, the magnetic field can be obtained by inverse Laplace transform of $\bar {G}$
and superposition of effects (Mei Reference Mei1997; Mei et al. Reference Mei, Stiassnie and Yue2005), which yields
$\bar {G}$
and superposition of effects (Mei Reference Mei1997; Mei et al. Reference Mei, Stiassnie and Yue2005), which yields
 \begin{equation} \hat {b}_{z_0}(z,t;k_x,k_y)=\int _{-1}^0\int _0^t f(\xi ,\tau )G(z,t-\tau ,\xi )\,{\textrm{d}}\tau \,{\textrm{d}}\xi . \end{equation}
In the latter,
 \begin{equation} f(z,t)=-\frac {\hat {H}_0(k_x,k_y)\, k_x^2}{\omega \cosh ^2(k_x/\beta )}\left \{F_z\cosh \left [\frac {k_x}{\beta }(z+1)\right ]+\textrm{i} F_x\sinh \left [\frac {k_x}{\beta }(z+1)\right ]\right \}\,\sin (\tilde {\omega }t) \end{equation}
is the forcing term on the right-hand side of (2.78), and again, dependence of $f$
and
$f$
and $G$
on
$G$
on $k_x$
and
$k_x$
and $k_y$
is omitted for brevity.
$k_y$
is omitted for brevity.
Now, (A19) reveals that the magnetic field can be obtained through the time convolution of the forcing term $f$
and the Green function
$f$
and the Green function $G$
. Application of the convolution theorem (Mei Reference Mei1997; Mei et al. Reference Mei, Stiassnie and Yue2005)
$G$
. Application of the convolution theorem (Mei Reference Mei1997; Mei et al. Reference Mei, Stiassnie and Yue2005)
 \begin{equation} \bar {\hat {b}}_{z0}(z;s,k_x,k_y)=\int _{-1}^0\bar {f}(\xi ;s)\bar {G}(z,\xi ;s)\,{\textrm{d}}\xi \end{equation}
allows us to obtain the Laplace–Fourier transform of the magnetic field at the seabed,
 \begin{align}& \bar {\hat {b}}_{z0}(-h;s,k_x,k_y)=\frac {\hat {H}_0(k_x,k_y)\tilde {\omega }}{\omega \cosh ^2(k_x/\beta )}\frac {k_x^2}{\beta ^2}\left \{\alpha _w\left [-\textrm{i} F_x\frac {k_x}{\beta }\left (\cosh (\alpha _w)-\cosh \left (\frac {k_x}{\beta } \right )\right ) \right .\right .\nonumber \\&\quad -\left . F_z\alpha _w\sinh (\alpha _w)+F_z\frac {k_x}{\beta }\sinh \left (\frac {k_x}{\beta }\right )\right ]+\frac {|k_x|}{\beta }\left [-\textrm{i} F_x \frac {k_x}{\beta }\sinh (\alpha _w) \nonumber \right .\\&\quad +\left .\left .\alpha _w\left (-F_z\cosh (\alpha _w)+F_z \cosh \left (\frac {k_x}{\beta }\right )+\textrm{i} F_x\sinh \left (\frac {k_x}{\beta }\right ) \right )\right ]\right \}\nonumber \\&\quad \times \left \{s \left (s^2+\tilde {\omega }^2\right )\left [\alpha _w\left (\sigma \alpha _s+\frac {|k_x|}{\beta }\right )\cosh (\alpha _w)+\left (\alpha _w^2+\sigma \alpha _s\frac {|k_x|}{\beta } \right )\sinh (\alpha _w)\right ]\right \}^{-1}. \end{align}
Equation (A22) must be inverse-transformed to the time domain via (A4). In the complex $s$
-plane,
$s$
-plane, $\alpha _w$
and
$\alpha _w$
and $\alpha _s$
introduce two branch points at the zeroes of the magnetic wavenumbers
$\alpha _s$
introduce two branch points at the zeroes of the magnetic wavenumbers $\alpha _w$
and
$\alpha _w$
and $\alpha _s$
, namely
$\alpha _s$
, namely
 \begin{equation} s=s_w=-\frac {k_x^2}{\beta ^2}\left ({{R}_m^w}\right )^{-1};\quad s=s_s=-\frac {k_x^2}{\beta ^2}\left ({{R}_m^s}\right )^{-1}, \end{equation}
which are both real and negative, with $|s_w|\ll |s_s|$
, because typically
$|s_w|\ll |s_s|$
, because typically ${{R}_m^w}\gg {{R}_m^s}$
. To circumvent multivaluedness, we introduce two branch cuts along the negative real
${{R}_m^w}\gg {{R}_m^s}$
. To circumvent multivaluedness, we introduce two branch cuts along the negative real $s$
-axis: one from
$s$
-axis: one from $s_w$
to negative infinity and the other from
$s_w$
to negative infinity and the other from $s_s$
to negative infinity. A similar example is shown by Carrier, Krook & Pearson (Reference Carrier, Krook and Pearson1966), page 85. Then, we choose the Riemann branch so that on the upper edge of the cuts,
$s_s$
to negative infinity. A similar example is shown by Carrier, Krook & Pearson (Reference Carrier, Krook and Pearson1966), page 85. Then, we choose the Riemann branch so that on the upper edge of the cuts, $\alpha _{(w,s)}=\textrm{i}|\alpha _{(w,s)}|$
.
$\alpha _{(w,s)}=\textrm{i}|\alpha _{(w,s)}|$
.
The poles of (A22) are located at the zeroes of its denominator: $s=0$
,
$s=0$
, $s=\pm \textrm{i}\tilde {\omega }$
, and at the complex zeroes (if any) of the transcendental equation
$s=\pm \textrm{i}\tilde {\omega }$
, and at the complex zeroes (if any) of the transcendental equation
 \begin{equation} \alpha _w\left (\sigma \alpha _s+\frac {|k_x|}{\beta }\right )\cosh (\alpha _w)+\left (\alpha _w^2+\sigma \alpha _s\frac {|k_x|}{\beta }\right )\sinh (\alpha _w)=0. \end{equation}
Note that for ${{R}_m^s}=0$
, corresponding to an insulating seabed,
${{R}_m^s}=0$
, corresponding to an insulating seabed, $\alpha _s=|k_x|/\beta$
, the branch point
$\alpha _s=|k_x|/\beta$
, the branch point $s_s$
moves at negative infinity and (A24) has zeroes corresponding to the real roots of the magnetic dispersion relation of Renzi & Mazza (Reference Renzi and Mazza2023), i.e.
$s_s$
moves at negative infinity and (A24) has zeroes corresponding to the real roots of the magnetic dispersion relation of Renzi & Mazza (Reference Renzi and Mazza2023), i.e. $\alpha _w=\textrm{i}\gamma _n$
,
$\alpha _w=\textrm{i}\gamma _n$
, $n=1,2,\ldots$
, where the
$n=1,2,\ldots$
, where the $\gamma _n$
solve
$\gamma _n$
solve
 \begin{equation} \tan (\gamma _n)=-\frac {2\gamma _n|k_x|/\beta }{k_x^2/\beta ^2-\gamma _n^2}, \quad n=1,2,\ldots .\end{equation}
Such roots generate negative real poles at
 \begin{equation} s=s_n=-({{R}_m^w})^{-1}(\gamma _n^2+k_x^2/\beta _n^2),\quad n=1,2,\ldots .\end{equation}
Physically, these correspond to evanescent modes that decay rapidly after generation, with a rate of at least $t^{-3/2}$
, as shown by Renzi & Mazza (Reference Renzi and Mazza2023). As a result, such modes do not influence the transoceanic propagation of the magnetic signal when the seabed is not conductive. Now, for a typical conductive seabed, where
$t^{-3/2}$
, as shown by Renzi & Mazza (Reference Renzi and Mazza2023). As a result, such modes do not influence the transoceanic propagation of the magnetic signal when the seabed is not conductive. Now, for a typical conductive seabed, where $\sigma _s\sim 0.1\,\textrm{S}\,\textrm{m}^{-1}$
(Wang & Liu Reference Wang and Liu2013; Minami et al. Reference Minami, Toh and Tyler2015), we have
$\sigma _s\sim 0.1\,\textrm{S}\,\textrm{m}^{-1}$
(Wang & Liu Reference Wang and Liu2013; Minami et al. Reference Minami, Toh and Tyler2015), we have ${{R}_m^s}\ll 1$
. Expanding
${{R}_m^s}\ll 1$
. Expanding $\alpha _s$
(A13) for small
$\alpha _s$
(A13) for small ${{R}_m^s}$
shows that the zeroes of (A24), if they exist, shift only slightly from their original positions at
${{R}_m^s}$
shows that the zeroes of (A24), if they exist, shift only slightly from their original positions at $s_n$
. As a consequence, the relevant poles still correspond to evanescent modes that can be neglected.
$s_n$
. As a consequence, the relevant poles still correspond to evanescent modes that can be neglected.
The pole at $s=0$
is a removable singularity, as
$s=0$
is a removable singularity, as $\bar {\hat {b}}_{z0}$
is finite in the limit
$\bar {\hat {b}}_{z0}$
is finite in the limit $s\rightarrow 0$
. Therefore, the only poles that influence transoceanic propagation are those at
$s\rightarrow 0$
. Therefore, the only poles that influence transoceanic propagation are those at $s=\pm \textrm{i}\tilde \omega$
, which correspond to transient propagating signals. Recall that in the two-dimensional model of Renzi & Mazza (Reference Renzi and Mazza2023), similar poles exist at
$s=\pm \textrm{i}\tilde \omega$
, which correspond to transient propagating signals. Recall that in the two-dimensional model of Renzi & Mazza (Reference Renzi and Mazza2023), similar poles exist at $s=\pm \textrm{i}\omega$
. Since
$s=\pm \textrm{i}\omega$
. Since $\tilde \omega \gt \omega$
, the effect of
$\tilde \omega \gt \omega$
, the effect of $y$
-axis propagation on the topology of the complex
$y$
-axis propagation on the topology of the complex $s$
-plane is to shift the imaginary poles away from the origin. Applying Cauchy’s integral formula (Mei Reference Mei1997) and the inverse Fourier transform (2.11) finally yields expression (2.81) for the magnetic field.
$s$
-plane is to shift the imaginary poles away from the origin. Applying Cauchy’s integral formula (Mei Reference Mei1997) and the inverse Fourier transform (2.11) finally yields expression (2.81) for the magnetic field.
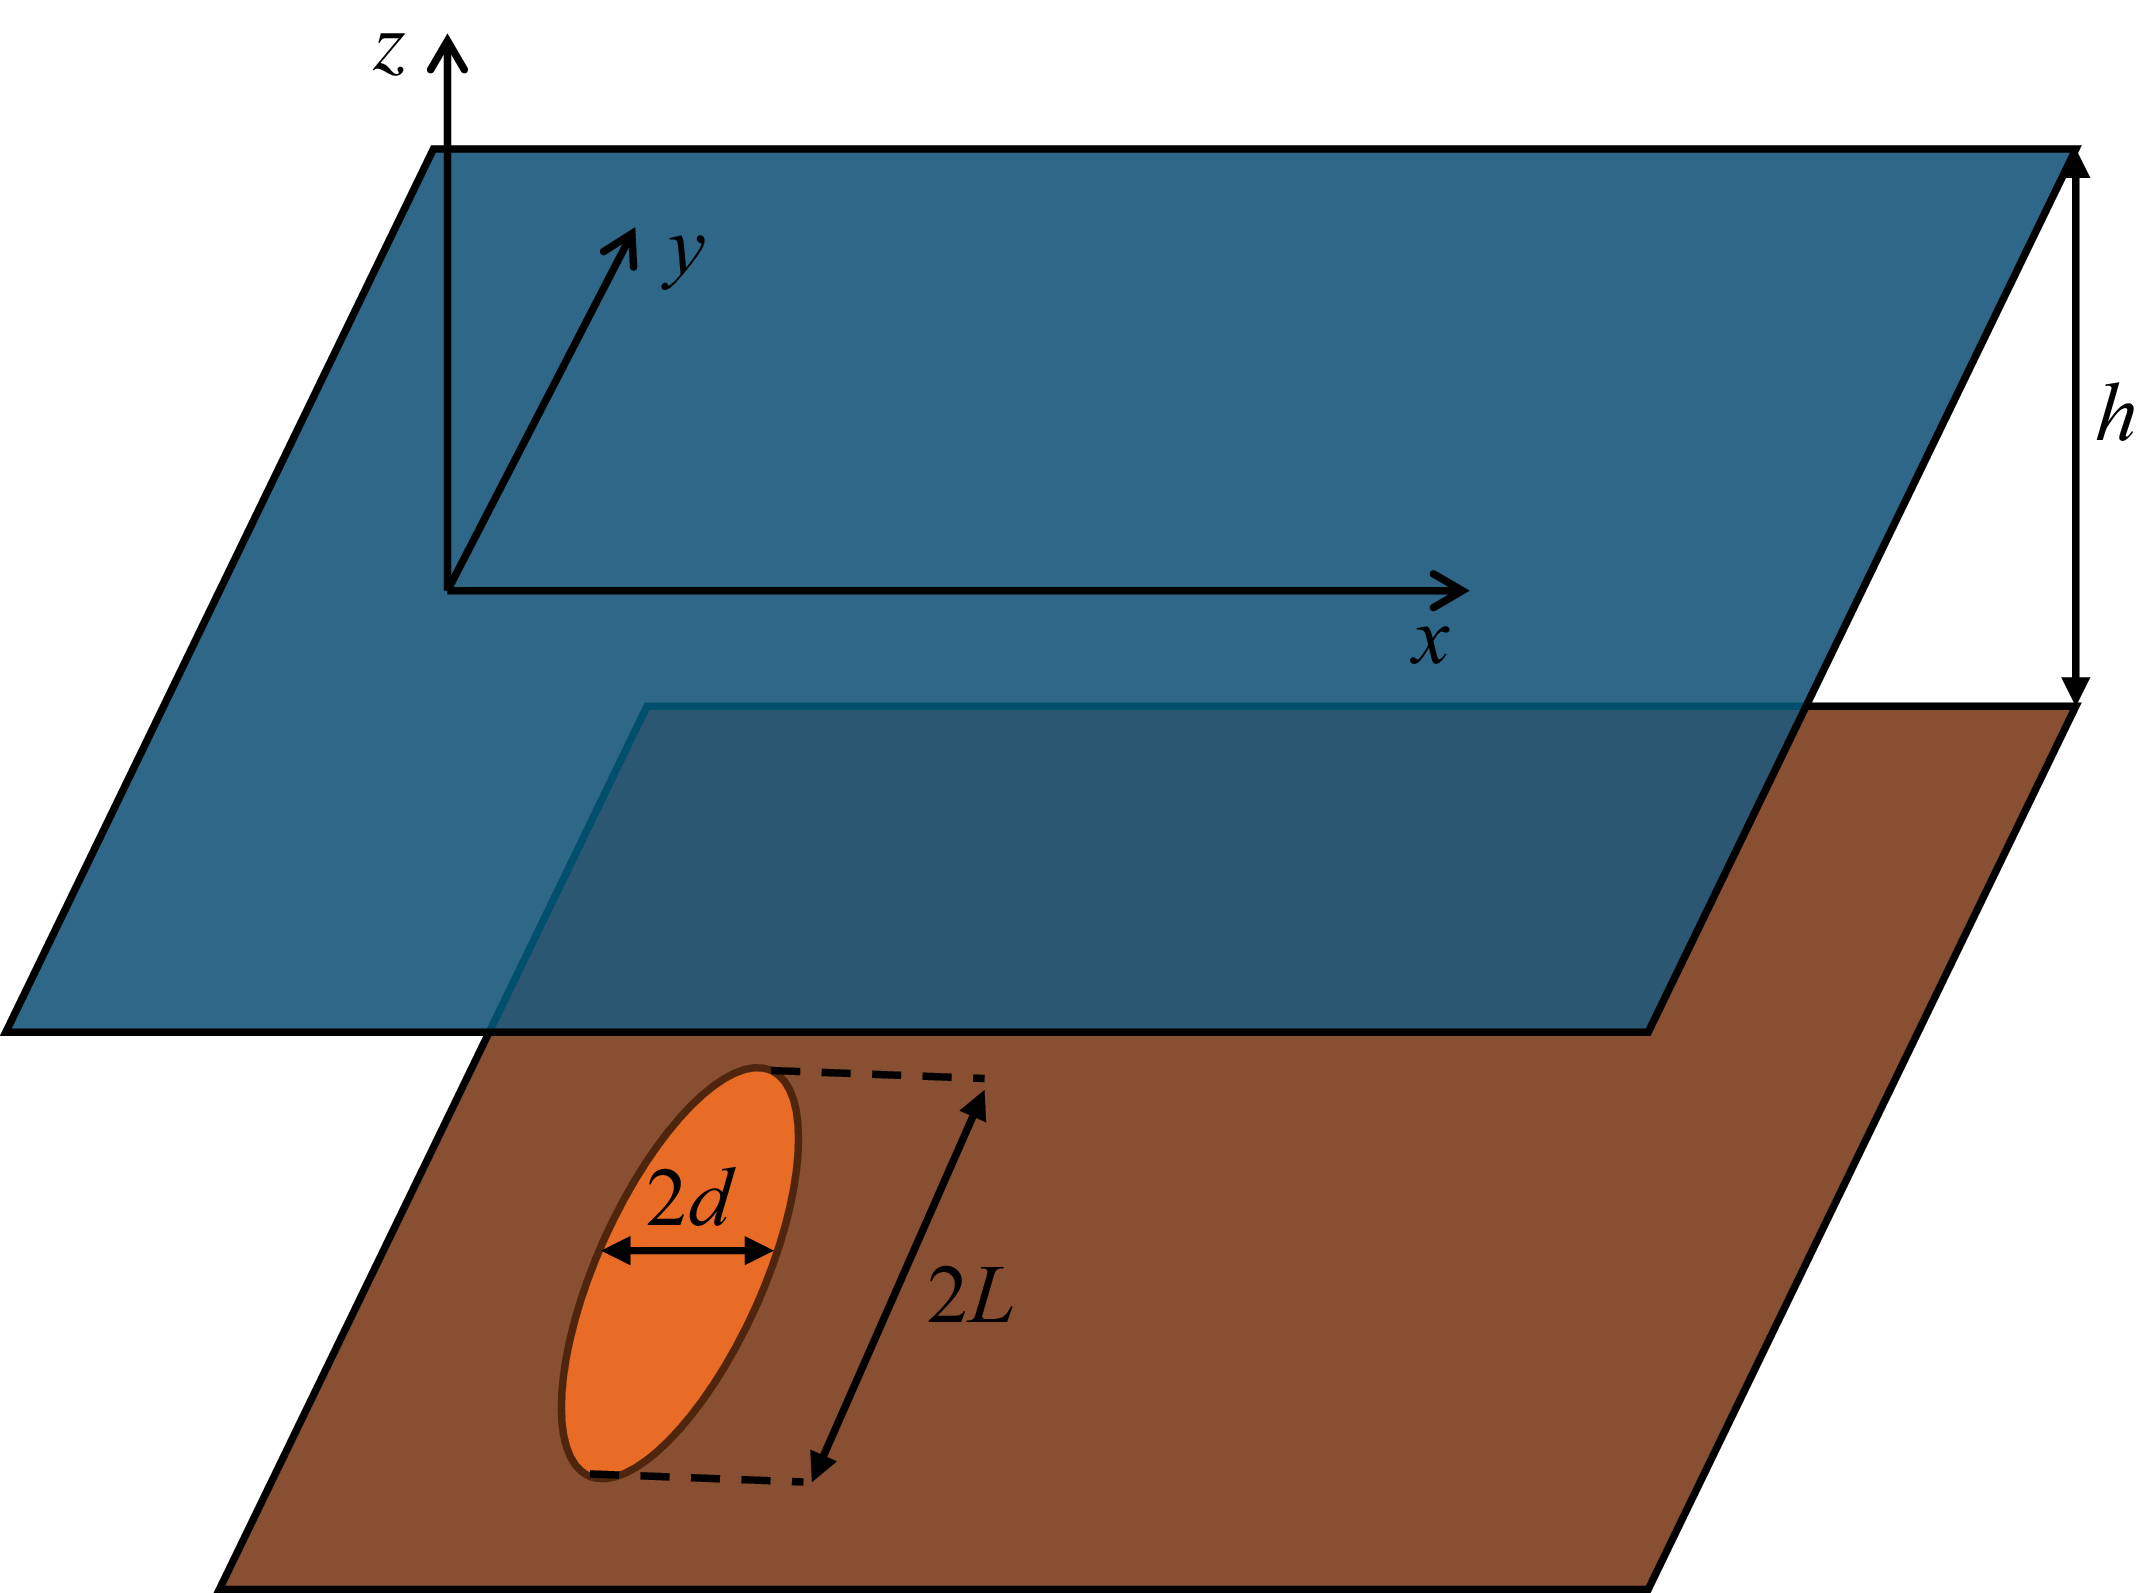


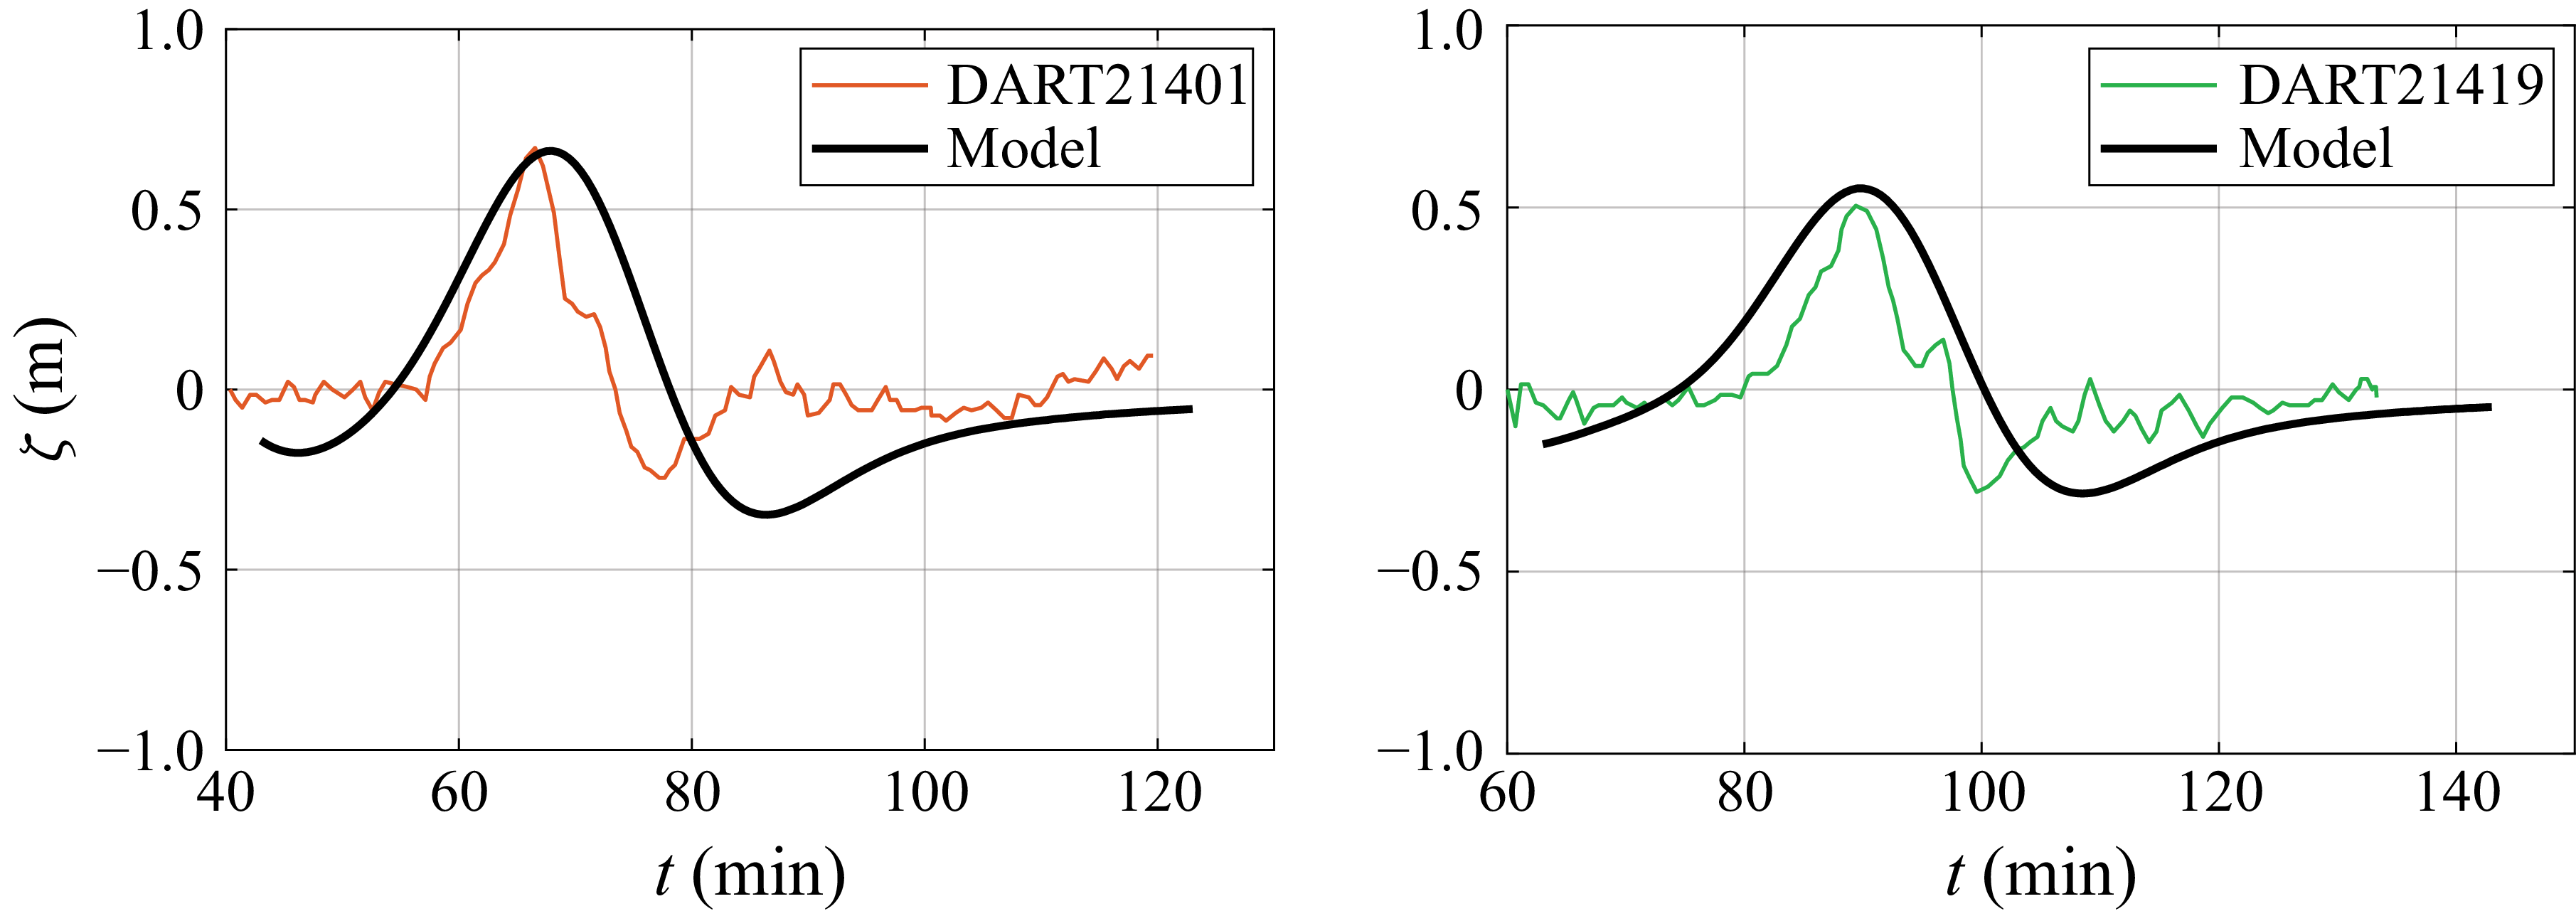


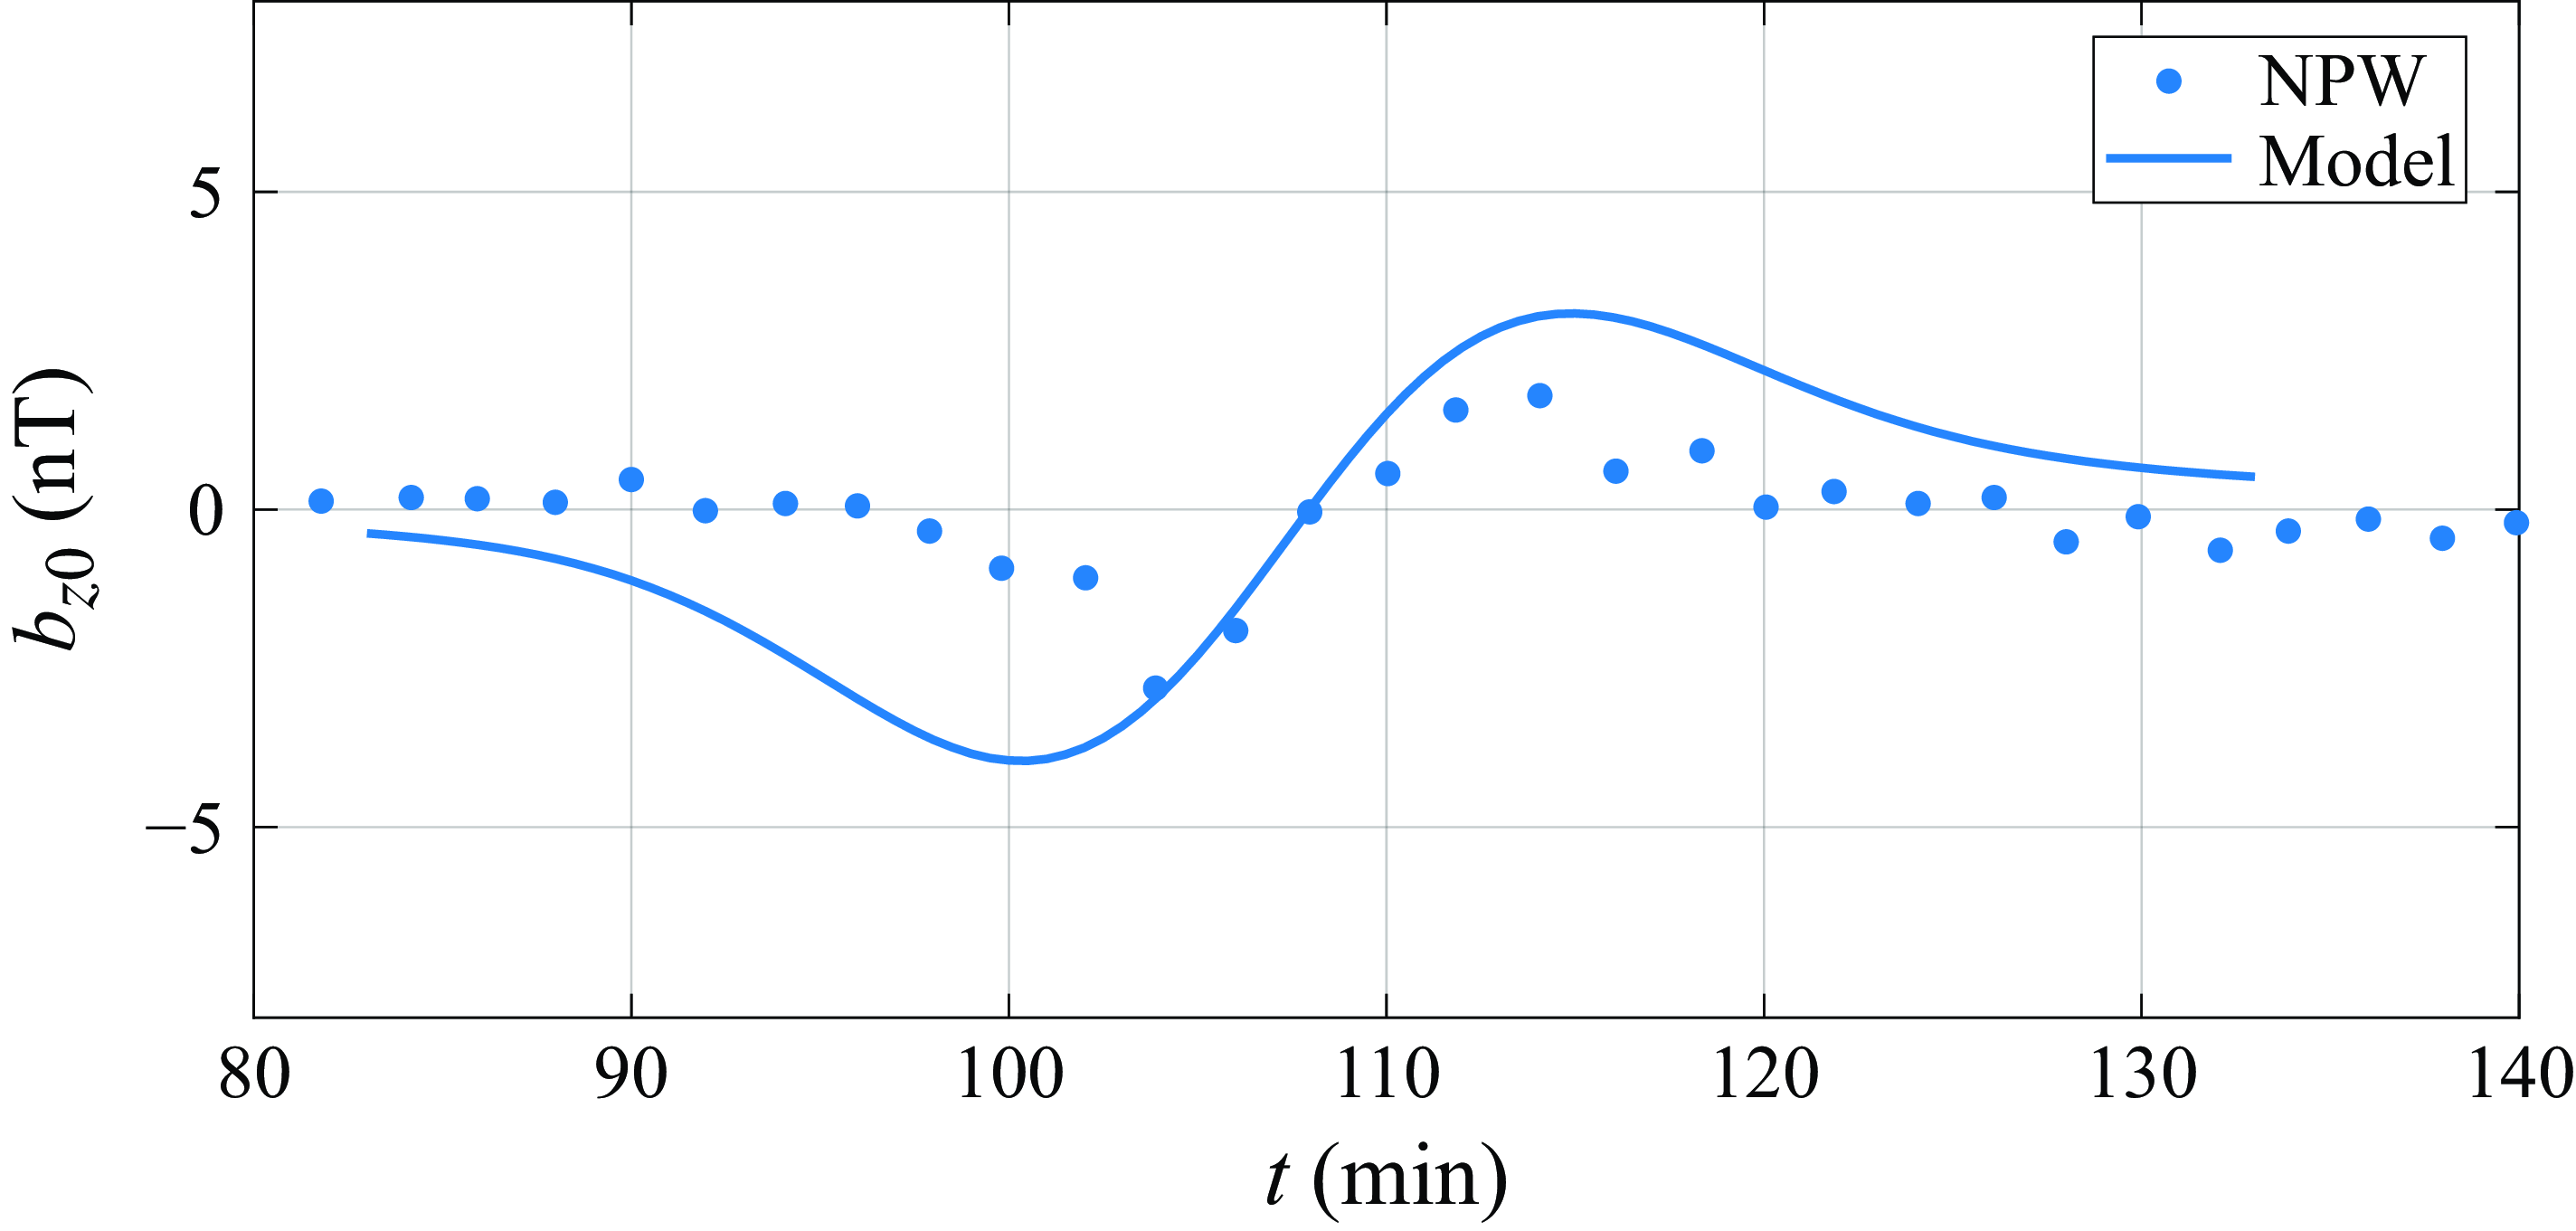


 Open access

