


Introduction
In cities worldwide, urban agriculture (UA) has attracted social, municipal, and scholarly attention (International Resource Panel, 2021), owing to its cross-cutting ecological, economic, and social significance (Peng et al., Reference Peng, Liu, Liu, Hu and Wang2015) for citizen participation, recreation, and the maintenance of agricultural landscapes, among others (Lovell and Johnston, Reference Lovell and Johnston2009; Lovell, Reference Lovell2010). Allotment gardens (AGs) are a popular form of UA, among other forms such as community gardens (essentially the same as AGs), vertical farms, rooftop gardens, school gardens, residential gardens, and institutional gardens (Taylor and Lovell, Reference Taylor and Lovell2012; Pulighe and Lupia, Reference Pulighe and Lupia2016; Hsiao, Reference Hsiao2021). AGs are not only used for producing vegetables, but also provide ecosystem services, such as access to fresh and healthy food, biodiversity conservation, nutrient cycling, and water runoff mitigation, in addition to providing recreation and learning opportunities (Guitart, Pickering and Byrne, Reference Guitart, Pickering and Byrne2012; Ruggeri, Mazzocchi and Corsi, Reference Ruggeri, Mazzocchi and Corsi2016; Mitarai and Matsushima, Reference Mitarai and Matsushima2017; Cabral et al., Reference Cabral, Keim, Engelmann, Kraemer, Siebert and Bonn2017). AGs also facilitate air quality control and rainwater infiltration in the surrounding areas (Speak, Mizgajski and Borysiak, Reference Speak, Mizgajski and Borysiak2015; Cabral et al., Reference Cabral, Keim, Engelmann, Kraemer, Siebert and Bonn2017). By maintaining AGs, users can experience a sense of fulfillment (Partalidou and Anthopoulou, Reference Partalidou and Anthopoulou2017). Families with children can learn much from engaging in the processes, hardships, and joys of growing vegetables (Pothukuchi, Reference Pothukuchi2004). Participants also become acquainted with others as they exchange information, collaborate, and help each other, leading to social cohesion (Teig et al., Reference Teig, Amulya, Bardwell, Buchenau, Marshall and Litt2009; Veen et al., Reference Veen, Bock, Van den Berg, Visser and Wiskerke2016). Therefore, scholars describe AGs as a ‘third space’ after home and work (DeSilvey, Reference DeSilvey2003). The evidence of the benefits of AGs indicates the need to expand their distribution across urban areas.
Despite the value provided by AGs, the land dedicated for these purposes has constantly declined in most cities because of urbanization (Acton, Reference Acton2011; Spilková and Vágner, Reference Spilková and Vágner2016; Dobson, Edmondson and Warren, Reference Dobson, Edmondson and Warren2020; Fletcher and Collins, Reference Fletcher and Collins2020). Conservation policies for agricultural land-use and AGs have generally been promoted in the context of urban planning (Ponizy and Stachura, Reference Ponizy and Stachura2017) and local greening policies (Partalidou and Anthopoulou, Reference Partalidou and Anthopoulou2017; Moriya and Funakubo, Reference Moriya and Funakubo2020). For instance, Japan enacted the Basic Act on the Promotion of Urban Agriculture in 2015 to conserve and promote UA, including AGs (Ministry of Agriculture, Forestry and Fisheries (MAFF) and Ministry of Land, Infrastructure, Transport and Tourism (MLIT), 2016; Tokyo Metropolitan Government, 2017). In some instances, specific policies have been introduced to enhance the quality and efficiency of AGs’ management (Fletcher and Collins, Reference Fletcher and Collins2020). However, such policies have generally been enacted without clarifying where and how the benefits by AGs will be prepared, managed, and delivered.
Existing studies imply that the context of urbanization and characteristics of residents influence the distribution of AGs. The benefits provided by AGs are often not universally accessible. First, the increase in urbanization affects the supply of AG plots. For instance, in European cities such as London (UK), the relationship between the number of AGs and people on waiting lists for plots differs significantly between the inner and outer parts of the city; for example, people in inner areas must wait several years for a plot (Fletcher and Collins, Reference Fletcher and Collins2020). AGs in Chicago (US) are primarily concentrated in areas with low levels of developmental pressure (Taylor and Lovell, Reference Taylor and Lovell2012). The distribution of AGs is negatively associated with the distance from the central area in Philadelphia (US) (Park and Ciorici, Reference Park and Ciorici2013) and positively associated with the urban greenery in Poznań (Poland) (Dymek et al., Reference Dymek, Wilkaniec, Bednorz and Szczepańska2021). Second, the characteristics of the residents, especially income level and age, affect the demand for AG plots. In Philadelphia (US), AGs are prevalent in low-income communities (Kremer and DeLiberty, Reference Kremer and DeLiberty2011; Park and Ciorici, Reference Park and Ciorici2013). In Chicago (US), AGs are more evenly distributed, but mainly in low-income communities that are supported by non-profit activities (Taylor and Lovell, Reference Taylor and Lovell2012). In contrast, AGs are also found in middle-income communities of Madison (US) (Smith, Greene and Silbernagel, Reference Smith, Greene and Silbernagel2013), high-income communities of Philadelphia (US) (Park and Ciorici, Reference Park and Ciorici2013), and communities with a high socio-economic status in St. Louis (US) (Braswell, Reference Braswell2018). The distribution of AGs is negatively associated with high rates of aging populations (Park and Ciorici, Reference Park and Ciorici2013). Some studies have noted AG distribution in Asian cities; in Osaka (Japan), AGs mainly appear in areas with a moderate population density and a high rate of aging populations (Ye and Yoshida, Reference Ye and Yoshida2018). In Taipei (Taiwan), AGs are 2–4 km from the railway stations (Hsiao, Reference Hsiao2022). More recently, researchers reported that the distribution of AGs in Tokyo (Japan) is associated with population density, land price, and other factors (Zheng et al., Reference Zheng, Akita, Araki and Fukuda2022). Respectively, based on the supply- and demand-side constraints of urbanization and residents’ characteristics, these studies reveal that AGs are widely dispersed in cities and their provision patterns are quite diverse. This is unique compared to other forms of UA, such as school gardens and residential gardens (Taylor and Lovell, Reference Taylor and Lovell2012), because AGs are public spaces accessible to everyone. However, the management of AGs in different urban contexts remains unclear.
Generally, well-managed AGs provide users with appropriate plots and facilities, such as shelters, bicycle stands, parking lots, and washrooms, at various costs (Wiltshire and Burn, Reference Wiltshire and Burn2015). Such provisions may differ based on the location of the AGs and the demands of potential users (Wiltshire and Burn, Reference Wiltshire and Burn2015). Differences in plots and facilities frequently influence user preferences (Suda, Kusunoki and Tokunaga, Reference Suda, Kusunoki and Tokunaga1995; Yuzawa, Reference Yuzawa2012). Therefore, AG provision is defined as the allocation of plots and facilities available in an AG to the users. Few studies have elucidated the context underlying AG provision. A review by Guitart, Pickering and Byrne (Reference Guitart, Pickering and Byrne2012) demonstrated that many publications on AGs have investigated low-income areas in the United States, whereas research on AGs in Asia has been limited (Hsiao, Reference Hsiao2021). Studies in Japan reveal that the economic and environmental performances of AGs are mostly defined based on land-use zoning rules: urbanization promotion areas (UPAs) and urbanization control areas under Japan's City Planning Act (Hashimoto, Sato and Morimoto, Reference Hashimoto, Sato and Morimoto2019). However, the spatial distribution of AGs in metropolitan regions and the process of allocating AG plots and facilities amid severe competition for urban land use are aspects that remain unclear.
Unlike in other countries, urban growth in East Asia has created a pattern of mixed agricultural and residential land use in suburban areas (Yokohari et al., Reference Yokohari, Takeuchi, Watanabe and Yokota2000; Yagi and Garrod, Reference Yagi and Garrod2018). Urban areas in Japanese megacities are generally developed around railroad stations to enable workers from the surrounding suburban areas to commute to the city center by train. This pattern has resulted in an urban sprawl from the city centers to suburbs. Therefore, considering the regional urbanization context, this study examines the extent to which urban development and the residents’ diverse demands, as key factors, affect the provision of AG plots and facilities in Tokyo, the largest metropolis. Examining AG provision patterns may provide valuable information for local governments, farmers, and non-profit organizations (NPOs) aiming to improve the management of AGs in different urban contexts.
Accordingly, this study has two primary aims:
• To examine the differences among existing AGs in terms of characteristics such as number of plots, plot sizes, and the main facilities.
• To clarify the relationship between AGs’ provision of plots and facilities and the influence of urban sprawl from the city center to the suburbs of Tokyo's metropolitan area.
By doing so, we expect to clarify some unique aspects of AG provision in Japanese megacities, distinguishing them from other types of UA or other countries, which may also help municipalities experiencing similar conditions improve their UA policies.
Methodology and data
Development of urban sprawl and the urban–rural mixture in Tokyo
Administratively, Tokyo Metropolis is home to approximately 14 million people and covers a territory of 2,194 km2. Except for the mountains and islands, the UPA classifies most of the area as a densely inhabited district, with a density of more than 4000 people per km2. The Tokyo Metropolis, which is governed by the Tokyo Metropolitan Government, consists of a central business district (CBD), sub-centers along or encircled by the Yamanote Line, suburban areas in 23 special wards, cities in the Tama area 20 km west of the Yamanote Line, and islands. However, these islands were excluded in this study.
After over 50 years of development and significant improvements in the city's urban infrastructure, Tokyo experienced its first wave of urbanization in the early 20th century (Okata and Murayama, Reference Okata, Murayama, Sorensen and Okata2011; Yoshida, Reference Yoshida2014; Liu et al., Reference Liu, Nath, Murayama and Manabe2022). During this period, the Yamanote Line was established, which encircled the CBD and sub-centers. Its main stations were radially connected to the suburban areas through private railways. The central regions lying inside and outside the Yamanote Line were mainly urbanized during this period (Hong, Reference Hong1993; Liu et al., Reference Liu, Nath, Murayama and Manabe2022), when vegetables for consumption were mostly produced in the suburban areas. The second wave of urbanization or suburbanization occurred amid the rapid economic growth of the 1960s and the 1970s, when vast tracts of agricultural land were converted into built-up areas (Okata and Murayama, Reference Okata, Murayama, Sorensen and Okata2011). Residential areas were mainly constructed near railway stations and sprawled outward from central Tokyo, which resulted in the conversion of more than 50% of the land to built-up areas within a distance band of 5–25 km from the Yamanote Line (Yamamoto et al., Reference Yamamoto, Kobayashi, Tabayashi and Sakurai1977). In addition, Tokyo experienced suburbanization in the 1980s and the 1990s as land prices in the city center soared owing to the bubble economy (Kanda, Isoda and Nakaya, Reference Kanda, Isoda and Nakaya2020). However, during the 2000s, Japan faced low economic growth, and Tokyo entered a new phase of urbanization (Kanda, Isoda and Nakaya, Reference Kanda, Isoda and Nakaya2020), or the so-called re-urbanization (Ushijima, Reference Ushijima2012), when people returned to the city center for convenience. Consequently, only a limited space was reserved for agricultural land use, mostly on the fringes of the metropolitan area, away from the railway stations. These developments have created a pattern of mixed urban–rural land use in suburban areas distant from the Yamanote Line (Yokohari et al., Reference Yokohari, Takeuchi, Watanabe and Yokota2000; Yagi and Garrod, Reference Yagi and Garrod2018).
Figure 1 illustrates the urban sprawl from the CBD to extra-urban areas, where built-up land within each 10 km distance band from the Yamanote Line is approximately 87.4, 75.3, 64.7, 49.0, and 5.7%, respectively. Areas located 15 km outside the Yamanote Line retained an agricultural land use pattern and were the so-called urban–rural mixtures.
The graphs present the three main variables (population density, built-up land-use percentage, and average income), and the map illustrates the population density indicating the urban sprawl in Tokyo. The graphs show the average values of each variable in points (more than five points) where each 2 km buffer line from the Yamanote Line crosses each 500 m buffer line from the stations. Data source: National Census in 2015 (500 m resolution grid). Estimated worker income in 2018 by Nippon Statistics Center Co (500 m resolution grid). High-Resolution Land Use and Land Cover Map of Japan, Version 21.11 (10 m resolution grid) provided by the Japan Aerospace Exploration Agency (https://www.eorc.jaxa.jp/ALOS/jp/dataset/lulc/lulc_v2111_j.htm).

AGs’ supply and demand in Tokyo
AGs in Japan expanded in the 1960s when farmers converted their idle agricultural lands to AGs to diversify their businesses (Oba and Obase, Reference Oba and Obase2001; Kudo, Reference Kudo2009). Simultaneously, many people began to use AGs for recreational purposes (Kudo, Reference Kudo2009). Present-day AG activities are supported by two pieces of legislation related to agricultural land lease and the promotion of AG in 1989 and 1990, respectively, and the demand for AG and their ecosystem services (Kudo, Reference Kudo2009).
In Japan, the provision of AGs involves the participation of local governments, farmers, Japan Agricultural Cooperatives, and NPOs. A tenant family can use an individual plot only under a limited-period contract. Many AGs provide facilities for agricultural equipment storage and rest, as well as instructors to facilitate learning activities. The harvest belongs to the tenants, who are not allowed to stay at the AG overnight, except for stay-type AGs (known as kleingartens) (Takano and Akita, Reference Takano and Akita2016; Zheng et al., Reference Zheng, Akita, Araki and Fukuda2022). In addition, some AG managers employ local farmers or other managers as part-time instructors to teach users how to grow vegetables. Most AGs provide agricultural equipment to gardeners if they have storage facilities. AGs benefit people who do not have much experience in farming and do not have their own equipment. AG users in Japan are motivated by several reasons: opportunities to grow their own vegetables, source fresh vegetables, improve one's health, exercise outside the home, and relax (Amemiya et al., Reference Amemiya, Terada, Watanabe, Nishitsuji and Yokohari2017). Moreover, many private companies have started supporting these gardens because of the emerging demand for AGs (Morofuji, Reference Morofuji2013; Amemiya et al., Reference Amemiya, Terada, Watanabe, Nishitsuji and Yokohari2017; Kamo and Yamada, Reference Kamo and Yamada2020).
As of the end of March 2018, 432 AGs were registered in Tokyo, excluding those in the islands (Tokyo Metropolitan Government, 2019). According to the Tokyo Metropolitan Government (2019), local governments own most AGs (84.8%), followed by farmers (10.7%), Japan Agricultural Cooperatives (2.8%), and NPOs (1.6%). Most AGs in Tokyo (73.6%) were founded after 2000 (Tokyo Metropolitan Government, 2019). In most AGs, the number of applicants in demand for plots exceeds the number of supplied plots available. In terms of competitiveness, applicants have a 1-in-1.88 chance of accessing a plot in the eastern part, a 1-in-1.43 chance in the central part, and a 1-in-1.02 chance in the western part of Tokyo (Tokyo Metropolitan Government, 2019).
The Japanese government's MAFF regularly publishes a list of AGs across the country as part of its open government data initiatives (https://www.maff.go.jp/j/nousin/kouryu/tosi_nougyo/index.html); it published a list of 317 (73.1%) AGs in the Tokyo Metropolis. Some AG managers have not agreed to disclose their information on the list; however, the MAFF list is the most accessible dataset. This list includes attribute data on number of plots, plot size, annual rent, contract duration, instructors, agricultural equipment storage facilities, and address as of March 2020. Four properties (i.e., specific plot areas, contract period in months, instructor, and agricultural equipment) include those of kleingarten. We created point data using the Geographic Information System (GIS; Esri ArcGIS Pro 2.7.4) by geocoding the addresses in the list, using data gathered from our prior fieldwork, interviews with managers, the National Land Numerical Information by the MLIT, websites, city bulletins, and aerial photos of Google Maps, as needed. Three AG locations could not be identified, and one was excluded because it was located on an island. Hence, we analyzed a final sample of 313 AGs (one garden has both regular plots and kleingarten). Prior to the research, interviews and fieldwork indicated that the pattern of provisioning plots and facilities for AGs varied.
Analytical framework
This study hypothesizes that AGs’ provision of plots and facilities reflects the differences in urban development and the characteristics of residents in the Japanese urbanization context. As mentioned previously, AG provision is defined as the allocation of plots and facilities to users. AG provision involves a balancing of supply and demand, as described in the approach by Park and Ciorici (Reference Park and Ciorici2013), wherein the supply-side context is presented as the land use corresponding to the stage of urban development, and the demand-side context is presented as the residents’ socio-demographic characteristics.
This study surveyed the provision of plots and facilities, grouped similar gardens, and treated each group as having a single type of AG provision. We hypothesized that properties including specific plot areas, number of plots, contract period in months, price per unit area, instructor, and agricultural equipment are potential determinants of AG provision. Specific plot areas and the number of plots are related to how many citizens can use gardens or whether the parcel of land allocated to each gardener within the limited garden area is spacious or narrow. AG managers may supply more plots in areas with many potential users and few gardens in the surrounding areas. The price per unit area is assumed to be determined by the number of potential users and the supply of surrounding gardens. Longer contract periods may provide users with opportunities to grow as many vegetables as desired. Research in Japan indicates that access to instructors and agricultural equipment (storage facilities) is more important (Aizaki, Endo and Yagi, Reference Aizaki, Endo and Yagi2004; Yuzawa, Reference Yuzawa2012) than other facilities. Therefore, we excluded other facilities such as water supply and drainage, compost, rest facilities, washrooms, parking lots, bicycle parking lots, and gardens for the welfare of persons with disabilities because of their low relative importance (Aizaki, Endo and Yagi, Reference Aizaki, Endo and Yagi2004; Yuzawa, Reference Yuzawa2012), limited data samples, and the expected difficulty in observing significant patterns.
On the supply side, this study assumes that variables including built-up land-use percentage covered by buildings, agricultural land-use percentage, distance from train stations, and distance from the Yamanote Line are key to understanding urban development. These variables influence the percentage of agricultural land. As urbanization pressure is correlated with the cost of land acquisition and management, the percentage of agricultural land is expected to be lower in areas with a high built-up land-use percentage. The urbanization pressure is related to the distance from train stations and the Yamanote Line, as explained in the context of Tokyo's urban sprawl.
On the demand side, this study considers socio-demographic variables including population, percentages of younger and older populations, number of households, daytime population, and income. Households with children may increase their willingness to participate in AGs because of the expected educational value of the gardens (Pothukuchi, Reference Pothukuchi2004; Mitarai and Matsushima, Reference Mitarai and Matsushima2017). Older people may be hesitant to participate because of the physical load of working in the gardens (Park and Ciorici, Reference Park and Ciorici2013); however, participating in AGs can help them build an active and healthy lifestyle (Van den Berg et al., Reference Van den Berg, van Winsum-Westra, de Vries and van Dillen2010). The nighttime population refers to the people living near the AG plots, whereas the daytime population refers to the number of people working or studying in the area. The amount of income may differentiate AG distribution in areas with low (Kremer and DeLiberty, Reference Kremer and DeLiberty2011; Taylor and Lovell, Reference Taylor and Lovell2012; Park and Ciorici, Reference Park and Ciorici2013; Castro, Samuels and Harman, Reference Castro, Samuels and Harman2013) and high income (Park and Ciorici, Reference Park and Ciorici2013; Braswell, Reference Braswell2018).
Data
We used the following variables to describe the urban sprawl around each AG in Tokyo (Table 1):
Properties of allotment gardens (AGs) derived from the national list of AGs and variables of urban development derived using ArcGIS

Among the urban development variables, we included the built-up land-use percentage, agricultural land-use percentage, distance from the nearest station, and distance from the Yamanote Line. The built-up land-use and agricultural land-use percentages were recalculated from the High-Resolution Land Use and Land Cover Map of Japan, Version 21.11 (10 m resolution grid) provided by the Japan Aerospace Exploration Agency (https://www.eorc.jaxa.jp/ALOS/jp/dataset/lulc/lulc_v2111_j.htm). The dataset was processed using images obtained via Sentinel-2, Landsat-8, and ALOS-2 from 2018 to 2020; the classification accuracy was 88.9% (https://www.eorc.jaxa.jp/ALOS/jp/dataset/lulc/lulc_v2111_j.htm). The Euclidean distance from the AGs to the nearest station or central area was calculated directly using GIS. The distance from the central area denotes the distance from the AGs to the Yamanote Line.
The socio-demographic variables included population, percentages of younger and older populations, number of households, daytime population, and worker income. The 2015 Population Census (2018) was used to gather demographic data on the population (total, male, and female populations); percentage of the young population (individuals aged up to 14 years), percentage of the older population (individuals aged 65 years and over); and number of households on a 500 m resolution grid. We utilized the Nippon Statistics Centre's data on daytime population, including the working population and students, estimated in 2015, and worker income, estimated in 2018, using a 500 m resolution grid.
Data processing
Data processing consisted of three steps. First, we prepared a simple tabulation of the properties for AG provision, including specific plot area, number of plots, contract period in months, price per unit area, instructor, agricultural equipment, and additional features, including cultivated area, total area, water supply and drainage, compost, rest facilities, washrooms, parking lots, bicycle parking lots, and gardens for the welfare of persons with disabilities. We visualized the median value for each 10 km distance band away from the Yamanote Line using GIS.
Second, we surveyed the AGs’ provision of plots and facilities. Six properties were extracted from the AG list, after which each property was standardized, and a cluster analysis was conducted to provide an overview of the AG provision patterns. The properties did not follow a normal distribution; thus, we calculated the robust z-scores, which are considered robust to the outliers, using formulas (1) and (2). Instructors and agricultural equipment were dummy variables, but were also transformed into robust z-scores for cluster analysis.


where the robust z-score z is obtained from property x in AG i, the median value of property x, and the interquartile ranges Q3–Q1 and N3–N1 in the normal distribution. Cluster analysis was applied in a non-hierarchical (k-means) manner using the ‘scikit-learn’ library in the python3 environment (Pedregosa et al., Reference Pedregosa, Varoquaux, Gramfort, Michel, Thirion, Grisel, Blondel, Prettenhofer, Weiss, Dubourg, Vanderplas, Passos, Cournapeau, Brucher, Perrot and Duchesnay2011). The clusters were categorized into various AG provision patterns, based on the significant characteristics of each property.
Third, we examined the relationship between the location of AGs, urban development, and the characteristics of residents using GIS. We calculated the built-up land-use percentage, agricultural land-use percentage, population density, percentages of younger and older populations, number of households, daytime population density, and average worker income, using 500 m resolution grids (target grid) and neighborhood grids (target grid + surrounding eight grids). Many datasets in Japan provide data in a 500 m grid. Citizens prefer AGs that are located closer to them (Aizaki, Endo and Yagi, Reference Aizaki, Endo and Yagi2004), within an average distance of 837 m in suburban cities (Kurita, Yamamoto and Shigeoka, Reference Kurita, Yamamoto and Shigeoka2010). Thus, the use of the target and neighborhood grids was considered potentially valuable. Of the five clusters obtained in the cluster analysis, only three clusters had sufficient samples of AGs; hence, only these were statistically analyzed using IBM SPSS Statistics 27. Non-parametric variables were verified using the Kruskal–Wallis test to determine whether significant differences existed in the aggregate values for each cluster (parametric variables are typically checked using an analysis of variance). If significant differences were evident, multiple comparisons were conducted using the Dunn–Bonferroni method to determine which combinations of clusters differed significantly (P: adjusted P-value using Bonferroni's method, P < 0.05).
Results
Characteristics of AGs in Tokyo
During the study period, 19,563 plots, spanning a total area of 430,266 m2 were provisioned across 313 AGs in Tokyo; however, the number of plots and plot size in each AG varied greatly. Table 2 depicts the AG plots and facilities provisioned in Tokyo and in each 10 km distance band. Approximately 83% of the total garden area contained plots, whereas the rest of the area was used for other purposes such as pathways and facilities. The median plot area was 15 m2 and the median number of plots was 52. The median annual contract price was 467 Japanese yen (JPY) per m2 (1 dollar [USD] ≈ 110 JPY). The contract period was typically two years; in certain cases, however, it was only 10 months or was as long as four years. In addition, 82 AGs provided instructors and others provided welfare facilities (five AGs provided plots to persons with disabilities, and seven reserved parking lots and toilets for persons with disabilities).
Basic statistics of allotment gardens (AGs) in Tokyo (N = 313)
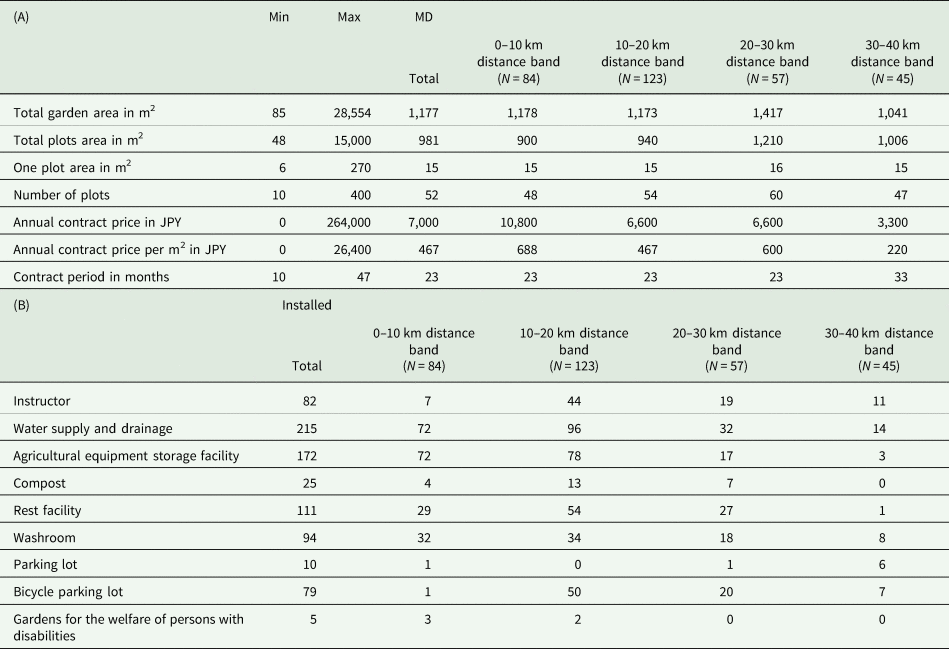
The table shows the median in each 10 km distance band from the Yamanote Line. Two gardens were omitted due to data uncertainties. (A) Basic information about AGs and the plots. (B) Facilities and services provided. Min, minimum; Max, maximum; MD, median.
Clusters of AGs
Using a non-hierarchical cluster analysis, we identified six clusters of AGs and regarded them as having distinct provision patterns: simple, hands-on, intermediate, high-class, middle-class, and large-area provision patterns. Figure 2 illustrates the difference between the range of the robust z-scores of each cluster, Table 3 provides the descriptive statistics, and Supplementary Fig. A1 shows examples of each type of AG provision.
A box plot of the z-scores of properties of the provision pattern of each allotment garden (AG). Patterns are divided into (A) and (B) based on the values for visual clarity. PA, plot area; NP, number of plots; CM, contract period in months; CP, annual contract price per area (square meter); IN, instructor; AE, agricultural equipment.

Statistics for each variable in allotment gardens (AGs)

IQR, interquartile range.
Simple provision (69 gardens): This pattern is characterized by a long duration of contracts and cheap annual contract price per square meter. The median contract period was 34 months, and the median annual contract price per square meter was 375 JPY. In addition, less than one-quarter of the AG managers provided an instructor and less than one-third provided agricultural equipment. The median plot size was 15 m2 and the median number of regular plots was 52. The managers of these types of AGs sublet the plot to the users for nearly three years and provide only a few facilities, which is the simplest approach for managing an AG.
Hands-on provision (40 gardens): This type of provision is characterized by a large plot size, short contract period, and relatively large number of facilities. The median plot size was 30 m2, which was larger than that in all gardens, except for those of the large-area provision category. The median contract period was 11 months or less than a year. Many gardens provide instructors and agricultural equipment. In addition, the median annual contract price per square meter was 1,467 JPY, which is much higher than that under the simple and intermediate provision types. The median number of regular plots was 72, which is more than that under the simple and intermediate provision types. The AG manager prepares the facilities and recruits users every year, which indicates a hands-on approach of AG provisioning.
Intermediate provision (195 gardens): This pattern was named based on its positioning between the simple and hands-on provision types. The median contract period was 23 months, the median annual contract price per square meter was 467 JPY, and the percentage of gardens providing agricultural equipment was 59.5%, which is between the percentages of agricultural equipment provided under simple and hands-on provision. However, the median size of the plots was 15 m2, and the median number of plots was 51, which fell below the median size and number of plots in hands-on type AGs, respectively. Finally, only a few gardens had instructors.
High-/middle-class provision (four and three gardens, respectively): AGs following these provision patterns have high annual contract prices. The median annual contract prices per square meter of the plots allocated under the high- and middle-class provision patterns were 20,387 JPY and 11,100 JPY, respectively. In addition, farm instructors and agricultural equipment were available in all gardens. However, the median plot areas (the median number of plots) for the high- and middle-class provision type were 7 and 8 m2 (93 and 166), respectively. These characteristics indicate that the gardens were divided into smaller plots to attract more users. Regarding the contract duration, six gardens were used for one year and one was used for two years. Cluster analysis categorized several gardens into these two clusters, and we regarded them as two different AG provision patterns. However, these patterns essentially possess the same characteristics, except for the annual contract prices.
Large-area provision (two gardens): The two AGs in this category have, by far, the largest plot sizes (218 and 270 m2); however, these gardens had only 13 and 18 plots, respectively, which indicates that a large parcel of land was devoted to one plot. One garden also had 13 plots for kleingarten. For gardens one and two, the contract periods were 36 and 12 months; the prices per square meter were 112.4 JPY and 37.0 JPY, respectively. One had an instructor; one did not have an instructor. However, both gardens were equipped with agricultural equipment.
Characteristics of the potential determinants
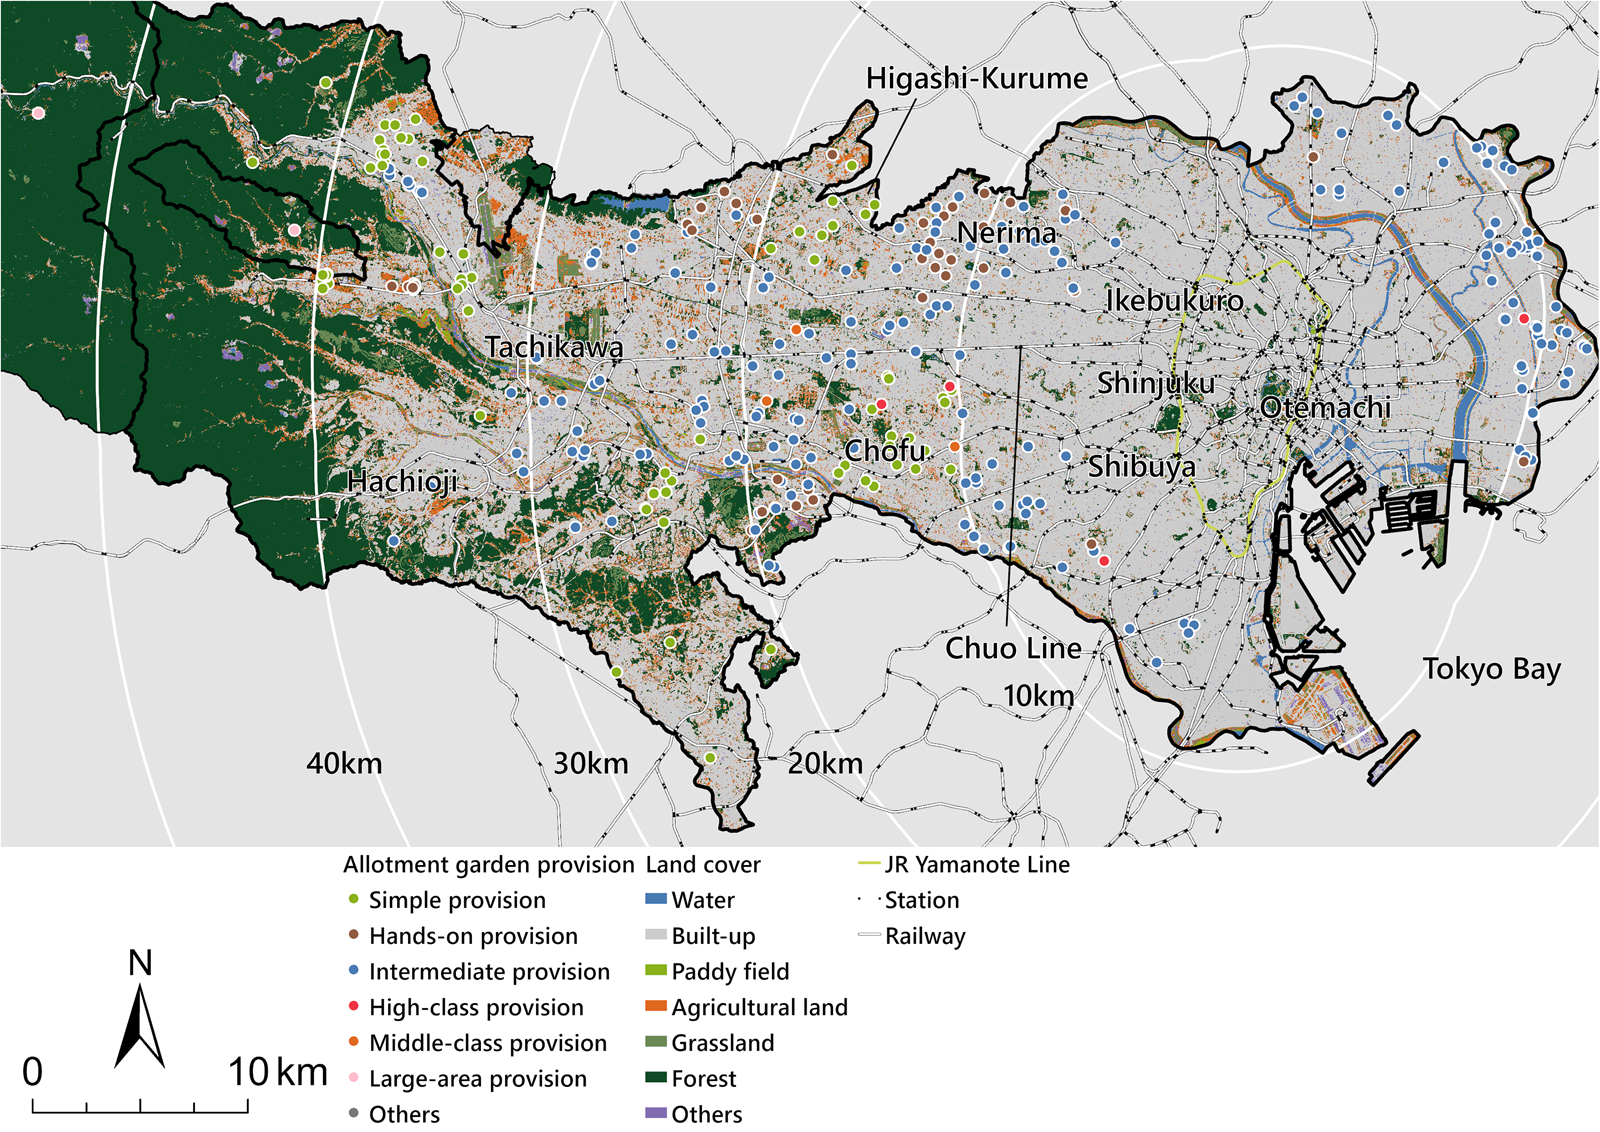
Figure 3 shows the geospatial characteristics of the six patterns of AG provision. Inside the area surrounded by the Yamanote Line or within a 5 km-radius outside the line, there were no AGs or instances of agricultural land use. Within a 10 km distance band from the Yamanote Line, nearly all the gardens were clustered into the intermediate provision category. Within the 10–25 km distance band from the Yamanote Line, multiple patterns were found. AGs under the simple and hands-on provision types were clustered in the north and south, respectively. Beyond a 25 km radius from the Yamanote Line, the number of AGs decreased sharply; however, there were many cases of agricultural land use, and a clear distinction was observed between areas with and without AGs. AGs located 50 km outside the Yamanote Line showed a simple provision pattern. AGs showing high- and middle-class provision patterns were dispersed in the 10–20 km distance band from the Yamanote Line.
Distribution of allotment gardens (AGs) in Tokyo. The background map shows the land cover from the High-Resolution Land Use and Land Cover Map of Japan, Version 21.11 (10 m resolution grid) provided by the Japan Aerospace Exploration Agency (https://www.eorc.jaxa.jp/ALOS/jp/dataset/lulc/lulc_v2111_j.htm).
We used the variables in Table 4 and Supplementary Table A1 to clarify the distribution of each AG provision pattern. The three provision patterns (simple, hands-on, and intermediate) exhibited sufficient sample sizes and did not follow a normal distribution. The Kruskal–Wallis test and multiple comparisons were conducted to determine whether the patterns differed significantly for each variable. In the following paragraphs, the values in parentheses are the medians.
Descriptive statistics of each variable of allotment garden (AG) provision: median (IQR); Kruskal–Wallis test: TS and P-value; multiple comparisons in target grid

IQR, interquartile range; TS, test statistics. Asterisks indicate significant differences (*P < 0.05). The results for the neighborhood grid are presented in Supplementary Table A1.
On the supply side, we observed the following differences in the variables of each AG provision pattern. The built-up land-use percentage in the target grid showed that compared with AGs under the hands-on (84%) and simple (83%) categories, a significantly higher percentage of intermediate provision AGs (89%) were located in areas with more built-up land. AGs under the high- and middle-class provision categories also tended to be located in highly urbanized areas (90% and 78%, respectively), whereas those under the large-area category were located in less urbanized areas (11%). In the neighborhood grid, the median built-up land-use percentages of most patterns were lower than those in the target grid. The agricultural land-use percentage in the target grid showed that compared with AGs under the simple (9%) and hands-on (10%) categories, a significantly lower percentage of intermediate provision AGs were located in areas with less agricultural land (5%). AGs of the high- and middle-class provision and large-area provision categories also tended to be located in areas with less agricultural land (5, 6, and 12%, respectively). A similar trend was observed in the neighborhood grids. The Kruskal–Wallis test indicated no significant difference in distance to the nearest station among AGs showing the simple (836 m), hands-on (867 m), and intermediate (790 m) provision patterns; however, those showing a high- and middle-class provision and large-area provision patterns tended to be located farther away from the stations (1,343, 1,143, and 1,833 m, respectively). An analysis of the AGs’ distance to the Yamanote Line indicated that AGs of the hands-on and intermediate-provision types were closer to the Yamanote Line (14,916 and 11,082 m, respectively) than simple provision AGs (24,743 m). AGs of the high-class provision type were closer to the Yamanote Line (9,729 m) than those of the middle-class provision type (17,576 m); large-area AGs tended to be in the suburbs (47,617 m).
On the demand side, this study considered the role of various socio-demographic variables. The population of areas showing the intermediate provision pattern in the target grid was significantly higher (3,051) than those showing the simple provision (1,890) pattern. Populations of areas showing hands-on, high-, and middle-class provision patterns were 2,554, 3,105, and 3,227, respectively; areas under the large-area provision category had the lowest population (200). Further analysis of the neighborhood grid revealed significant differences between AGs of the hands-on and simple provision categories. The percentage of the young population in the target grid areas showing hands-on provision was higher (14%) than those showing simple provision (12%). The corresponding percentages for the intermediate, high-, and middle-class provision patterns were 13, 13, and 14%, respectively; that for areas showing large-area provision was the lowest (7%). For the subsequent variables (population of older adults, number of households, and daytime population), a similar trend was observed between the target and the neighborhood grids. Hence, for these variables, we describe only the trends for the target grid. The older-population percentages in areas showing the simple, hands-on, intermediate, high-class, middle-class, and large-area provision patterns were 22, 23, 22, 20, 22, and 59%, respectively. The number of households under the intermediate provision category was higher (1,374) than those under the simple (831) and hands-on (1,093) categories. Areas showing high- and middle-class provision patterns had 1,540 and 1,384 households, respectively; areas under the large-area provision category had 37 households. According to the daytime population data, AGs of the intermediate provision category were located in significantly more populated areas (1,844) than those of the simple (1,369) and hands-on (1,462) categories. Large-area provision was observed in less-populated areas with a median of 222 people within the target grid. The daytime population of areas showing the middle-class provision pattern was higher (2,134) than of those showing the high-class pattern (1,855); however, the opposite trend was observed in the neighborhood grid (daytime population under middle-class provision: 18,189; under high-class provision: 19,678). The average income of residents in the target grid areas with a simple provision pattern was significantly lower (4,034 thousand JPY) than that in areas with the hands-on (4,505 thousand JPY) and intermediate (4,431 JPY) patterns. The average median income under the high- and middle-class provision categories was higher than that in the simple and intermediate categories, at 4,436 thousand JPY and 4,848 thousand JPY, respectively. In contrast, the average income of residents under the large-area provision category was approximately 3,356 thousand JPY, lower than the estimates under other patterns. A similar trend was observed within the neighborhood grids.
Discussion
Diversity in AG provision patterns
The results illustrate the diverse provision patterns of plots and facilities in AGs and their distributions, along with the variables of the state of urban development and the residents’ characteristics. The underlying implications of the six provision patterns are discussed below.
First, the results show the relationship between each type of AG provision and the state of urban development. The results showed that intermediate provision occurred in areas with a high built-up land-use percentage and a low agricultural land-use percentage. This trend can perhaps be explained by the characteristics of this pattern, in which AGs provide smaller and fewer plots in one garden, as well as few instructors; therefore, AGs in this category are too small to facilitate learning activities. Hands-on and simple provision occurred mainly in areas at a median distance of 15 and 25 km from the Yamanote Line, respectively. Compared with other patterns, these patterns were observed in areas with more agricultural land. This trend reflects the fact that the AG managers following these provision patterns tend to allocate more or larger plots. Large-area provision was observed in areas at a median distance of 48 km from the Yamanote Line and provided large plots. These results suggest that the percentage of agricultural land use may be a key determinant of AG provision. This finding is partially explained by the fact that most AGs in Japan were converted from idle agricultural land (Oba and Obase, Reference Oba and Obase2001; Kudo, Reference Kudo2009), unlike in other countries where the gardens were converted from other types of land, including vacant spaces (Park and Ciorici, Reference Park and Ciorici2013; Drake and Lawson, Reference Drake and Lawson2014).
Second, the demand-side results showed complicated relationships between AG provision and resident characteristics. Three population-related variables—total population, number of households, and daytime population—distinguish intermediate provisions from other patterns. A larger population implies a higher demand for AGs, resulting in a smaller plot size for intermediate provision, as shown by Fletcher and Collins (Reference Fletcher and Collins2020). Most AGs have a higher number of applications compared to the number of plots (Tokyo Metropolitan Government, 2019). The percentage of young people distinguished hands-on provision from simple provision. AGs under the hands-on provision category had large plots and more instructors. This result may be explained by the fact that households with children expect an educational value from AGs (Pothukuchi, Reference Pothukuchi2004; Mitarai and Matsushima, Reference Mitarai and Matsushima2017). The results showed a weak association between the percentage of the older population and AG provision patterns, although some studies have reported that older people account for many AG users in Japan (Higuchi, Reference Higuchi1999; Yuzawa, Reference Yuzawa2012), possibly because of AGs’ health benefits (Van den Berg et al., Reference Van den Berg, van Winsum-Westra, de Vries and van Dillen2010). The residents’ income level distinguishes simple provision from other patterns. This finding is probably related to the fact that under simple provision, plots are provided at cheaper rates. Notably, AGs in the high- and middle-class provision categories were located closer to the city center. Although their annual contract prices are too high for many people, they provide high-income households with an opportunity to easily engage in agricultural activities.
In summary, the supply-side variables, including the percentage of agricultural land use, and the demand-side variables, including the population, young population percentage, and income, significantly determine the provision of AG plots and facilities in Tokyo.
Geospatial contexts underlying AG provision
Some variables of the state of urbanization and the residents’ characteristics changed depending on the distance from the city center to the suburbs (Table 2). For instance, no AGs were located inside the CBD, and each distance band (i.e., 5–10, 10–25, and 25–50 km) exhibited a different AG provision pattern. This gradation was possibly enabled by the uniqueness of the wide range of built-up areas, a mixed urban–rural land use pattern, and the city's development history. As discussed in section ‘Development of urban sprawl and the urban–rural mixture in Tokyo’, Tokyo has a wide range of built-up areas, similar to those in Chicago and Los Angeles and different from those in European cities (Angel et al., Reference Angel, Blei, Lamson-Hall, Sanchez, Gopalan, Kallergis, Civco, Kumar, Madrid, Shingade and Hurd2016; Liu et al., Reference Liu, Nath, Murayama and Manabe2022). This diversity in built-up areas has enabled agricultural land to survive in areas with a mixed urban–rural land-use pattern (Yokohari et al., Reference Yokohari, Takeuchi, Watanabe and Yokota2000) during Tokyo's rapid urbanization (Bagan and Yamagata, Reference Bagan and Yamagata2012) and re-urbanization (Ushijima, Reference Ushijima2012; Kanda, Isoda and Nakaya, Reference Kanda, Isoda and Nakaya2020). These developments have resulted in the gradual spread of urbanization outward from the city center (i.e., urban sprawl in Tokyo).
The Kruskal–Wallis test did not reveal any significant difference within neighborhood-scale urbanization, that is, from the stations to the hinterlands. Seemingly, AGs are widely dispersed in areas outside the Yamanote Line, regardless of the distance from the line. AG managers may not consider accessibility to the stations as important, because many people visit gardens by walking, riding a bicycle, or riding a car during holidays (Amemiya et al., Reference Amemiya, Terada, Watanabe, Nishitsuji and Yokohari2017). A recent study in Japan focused on access to agricultural lands on foot (Iida et al., Reference Iida, Yamazaki, Hino and Yokohari2023). However, the decrease in population or built-up land-use percentage (Fig. 1) of areas containing AGs was possibly related to the spread of simple provisions in the hinterlands at a 14–18 km distance from the Yamanote Line. This aspect was not observed in the overall study area but is a local characteristic for profiling certain AGs.
In addition, the distribution map (Fig. 3) shows collective trends observed in the three most popular AG provision patterns: simple, hands-on, and intermediate provisions. The AGs along the Chuo Line mostly showed intermediate provision, whereas those away from the Chuo Line were divided into the simple and hands-on provision types. By scrutinizing the administrative divisions, we noted that these patterns were partially defined by city boundaries. In the hinterlands at a distance of 14–18 km from the Yamanote Line, the simple provision type was mainly observed, especially in the Chofu and Higashi-Kurume cities. However, the hands-on and intermediate provision patterns were observed in Nerima City, based on the degree of urbanization. This finding reflects the fact that 84% of AGs are owned by municipalities. The zoning system under the City Planning Act was determined by the municipalities (Zheng et al., Reference Zheng, Akita, Araki and Fukuda2022). Therefore, municipal boundaries are potential determinants of AG provision; however, a municipality-level analysis is beyond the scope of this study, which focuses on residents’ access to AGs.
Challenges and opportunities for AG provision
Our study aimed to identify the patterns and the demand- and supply-side characteristics of AG provision to support local governments, farmers, and NPOs in addressing the challenges arising out of specific provision patterns. In areas with intermediate provision, urgent political action is required to sustain urban agricultural land use and meet the emerging demand for AGs. However, for Japanese cities entering the re-urbanization phase, more agricultural land may be available in less populated areas owing to urban shrinkage in the near future. For example, in a related context, Leipzig in Germany has been hosting AGs to cope with vacant areas in urban shrinkage (Cabral et al., Reference Cabral, Keim, Engelmann, Kraemer, Siebert and Bonn2017). This upcoming trend could not only provide municipalities that manage most of the AGs with a chance to find new AGs and to provide larger and more plots in one garden of intermediate provision, but also provide private companies and NPOs with valuable investment opportunities. In areas with a high average income, private companies and NPOs can grow their business by managing the AGs under the high- and middle-class provision categories. In fact, Kamo and Yamada (Reference Kamo and Yamada2020) found that such businesses are continuing to expand in Tokyo. Such forms of interim usage in shrinkage cities could improve the social and environmental value of urban settings (Rall and Haase, Reference Rall and Haase2011). The potential transformation of AGs from hands-on provision to intermediate and high- or middle-class provisions can probably be observed in response to changes in the supply- and demand-side characteristics within the 10–25 km distance band from the Yamanote Line. If the population and corresponding demand increase in areas with a hands-on provision, municipalities may subdivide plots into smaller plots, as observed in the intermediate provision pattern, so that public services can maintain their equity. However, this may reduce the chances of benefiting from advantages such as easy access for households with children to AGs of the hands-on provision type. In summary, the relationship between AG provision and the influence of urban sprawl in Tokyo's metropolitan area draws our attention to the necessity to increase the number of plots available while responding to urban shrinkage, to take advantage of business opportunities in areas with a high average income, and to control possible excessive subdivision and price hikes under urbanization through policy.
Additional research is required to further observe the differences in the objectives and behaviors of actual and potential users. Structured interviews and questionnaires would be more practical for investigation and will be the subject of future research. In particular, identifying changes in the supply of and demand for AGs during the COVID-19 pandemic and considering the possible responses to the changes in urban planning could be meaningful. An increase in people's motivation to grow one's own vegetables has attracted attention during the pandemic, leading to discussions of the lifestyle supported by AGs as part of the new normal (Music et al., Reference Music, Finch, Gone, Toze, Charlebois and Mullins2021). Iida et al. (Reference Iida, Yamazaki, Hino and Yokohari2023) found that farming in AGs improved gardeners’ health and subjective well-being in Tokyo. Regardless of the end of the pandemic, urban planning must become more sensitive to societal changes to adapt to an uncertain future.
Conclusion
This study classified AGs in Tokyo based on the provision patterns of plots and facilities and examined the relationship between the geographical distribution of each AG provision pattern and urban sprawl. Our analysis yielded six AG provision patterns: simple, hands-on, intermediate, high-class, middle-class, and large-area provisions, based on the number and size of the plots, annual contract price and duration, and provision of instructors and facilities. Furthermore, we described the following determinants of AG provision: (1) the percentage of agricultural land; and (2) the characteristics of residents, including the population, percentage of the young population, and income. The Japanese context of urban sprawl alongside the scale, the mixed urban–rural land use, and rapid urbanization and re-urbanization influenced these determinants, resulting in a unique distribution of AGs and showing a basic gradation from the city center to the suburbs. Awareness of the characteristics of different AG provision types and their underlying contexts can encourage AG landowners, managers, and local government policymakers to design garden plots and facilities while responding to upcoming urban shrinkage, business opportunities, and possible excessive subdivision and price hikes.
Supplementary material
The supplementary material for this article can be found at https://doi.org/10.1017/S1742170523000376.
Data availability statement
The data are available from MAFF (https://www.maff.go.jp/j/nousin/kouryu/tosi_nougyo/index.html), the Japan Aerospace Exploration Agency (https://www.eorc.jaxa.jp/ALOS/jp/dataset/lulc/lulc_v2111_j.htm), the National Census (https://www.e-stat.go.jp/gis/statmap-search?type=1), and Nippon Statistics Center Co. (https://www.nihon-toukei.co.jp/simulation_mesh/).
Acknowledgements
We thank the AG managers for providing us with information. We also appreciate the anonymous reviewers’ comments. We thank Editage for English language editing.
Funding statement
This work was supported by the JSPS KAKENHI [grant number JP22KJ2704]; the Keio University Doctorate Student Grant-in-Aid Program from Ushioda Memorial Fund in 2021; and the Belmont Forum's Sustainable Urbanisation Global Initiative (SUGI): Food-Water-Energy Nexus/M-NEX project [grant number 11314551, Japan Science and Technology Agency (JST): 1009781].
Competing interest
None.


 Open access