


Introduction
Variability in the shape of ceramic vessels is a valuable source of information about craft organisation, knowledge transmission and artisanal skill. Such variation can be explored in two key dimensions: inter- and intra-vessel, each providing information on complementary aspects of craft production. Assessments of inter-vessel variability—measuring consistency in size and/or shape between vessels, within and between assemblages—are more commonly undertaken, relaying data regarding the degree of specialisation and control in production and the number of craftspeople involved.
Pottery vessels typically have curved shapes and linear measurements have limited sensitivity to such shape variations. Research on inter-vessel variability has therefore increasingly turned to outline-based geometric morphometric methods (GMM), which can capture subtle differences in shape through the use of a Cartesian co-ordinate system for shape quantification (Wang & Marwick Reference Wang and Marwick2020). This method has been applied to examine inter-vessel variation and standardisation between wares (Topi et al. Reference Topi2018; Klesner et al. Reference Klesner2025), across periods (Wang & Marwick Reference Wang and Marwick2020; Loftus Reference Loftus2022) and sites (Roux & Harush Reference Roux and Harush2022) and between different makers (Roux & Karasik Reference Roux, Karasik, Miloglav and Vukovic2018; Gandon et al. Reference Gandon2018).
Intra-vessel variability—the consistency in size and/or shape of features such as wall thickness or rotational symmetry within individual vessels—is less commonly explored. Yet, such data hold great potential for identifying the skill and personal style of individual potters, beneath the broader categorisation of ‘workshops’ or production sites, and hence for the reverse-engineering of craft organisation and knowledge transmission (Crown Reference Crown2007; Martinón-Torres & Uribe-Villegas Reference Martinón-Torres and Uribe-Villegas2015; Harush et al. Reference Harush2019, Reference Harush2020; Baysal & Yelözer Reference Baysal and Yelözer2023). Integration of 3D models within GMM studies of ceramics allows for more accurate quantification of vessel shape (Winemiller et al. Reference Winemiller2018) and more robust assessment of variability. Recent 3D GMM studies have identified individual style and skill in experimental and ethnographic pottery (Harush et al. Reference Harush2019, Reference Harush2020), visualised intra-vessel variability on archaeological ceramics (Loftus & Seguchi Reference Loftus and Seguchi2022) and piloted methods to quantify intra-vessel variation to identify primary forming methods (Thér & Wilczek Reference Thér and Wilczek2022; Caloi & Bernardini Reference Caloi and Bernardini2024).
Here, we present a quantitative method to assess inter- and intra-vessel morphological variation in archaeological ceramics from 3D models, working toward the comparison of skill and craft organisation in the archaeological record. We use a case study as a proof-of-concept and demonstrate how variation in vessels made within the same production system can inform us about the skills and habits of the makers of different wares, adding a new level of resolution to the study of ceramic variability.
Case study: the Serranía nariñense (Colombia)
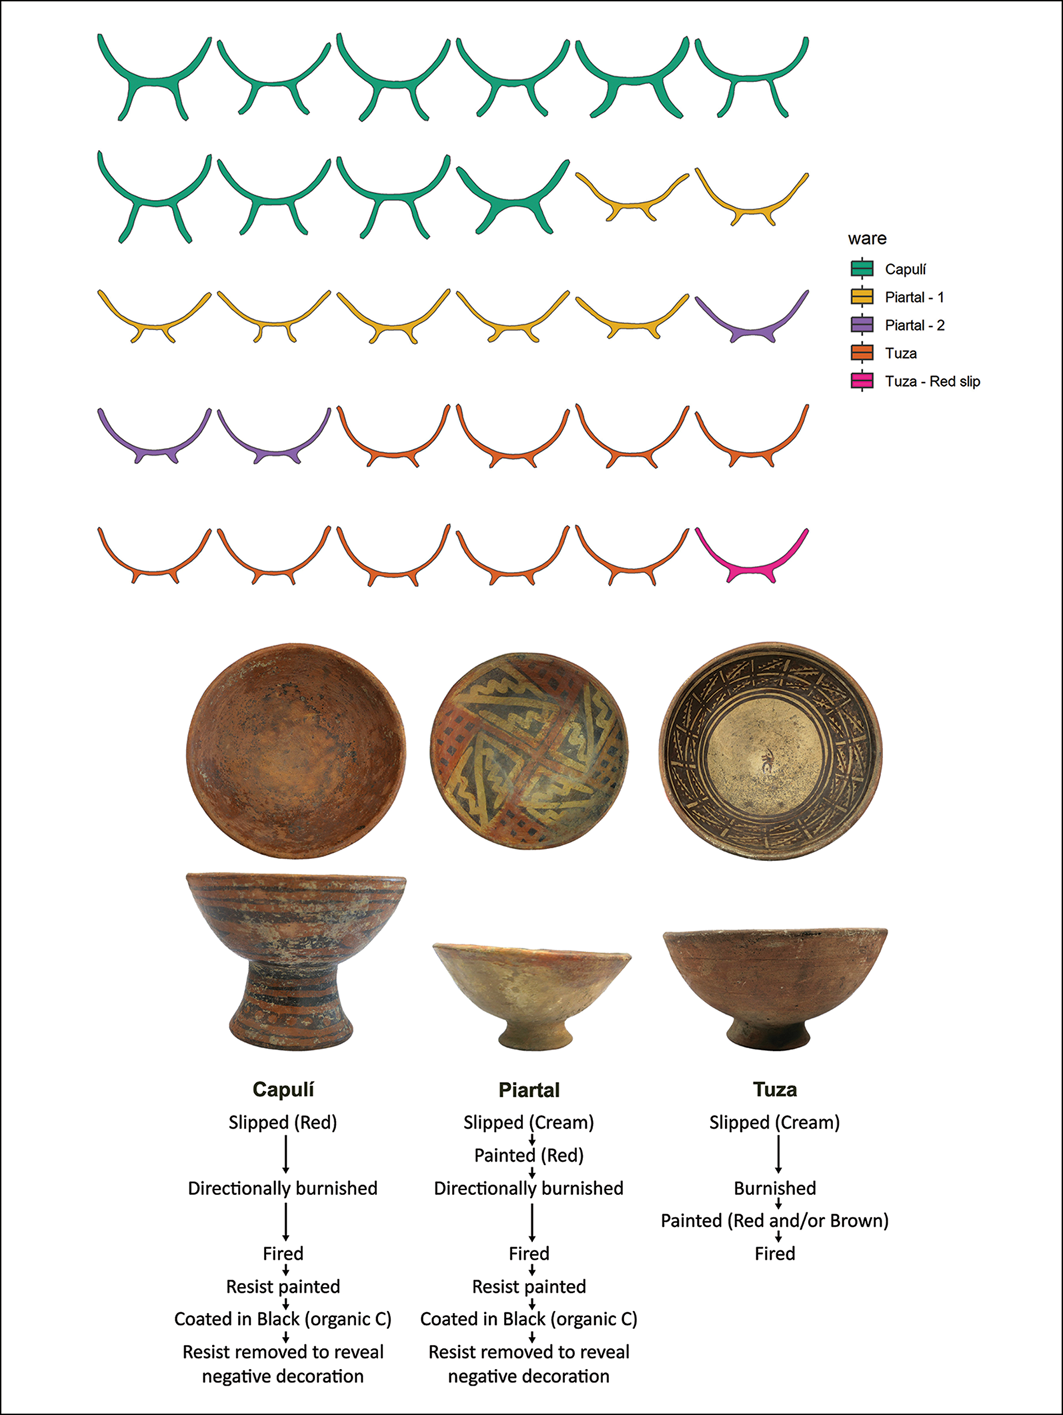
In the Serranía nariñense, three decorative wares, Capulí, Piartal and Tuza, differentiated by their distinct decorative styles, were produced in the pre-Hispanic period (c. fourth–sixteenth centuries AD). While these wares are recovered and discussed frequently, their predominant recovery context (from burials) and the lack of prior technical studies limit inferences about technologies of manufacture, craft organisation and the diachronic evolution of each ware. Prior research (Klesner et al. Reference Klesner2025) reconstructed the chaînes opératoires of these wares based on morphological, compositional and technological analysis (see Figure 1), and clarified technological and diachronic relationships but provided less insight into the craft organisation and skill of their makers.
Above) cross-sections of the analysed ceramics, grouped by ware (sizes normalised); below) example wares (from left to right: CA230334; CA230416; CA230354) showcasing decorative features and simplified decorative chaînes opératoires (figure by authors).

Figure 1 Long description
The image displays cross-sections of various ceramics grouped by ware, with sizes normalized for comparison. Above, the cross-sections are organized by different ware types, including Capuli, Piartal, and Tuza, each distinguished by unique colors. Below, three example wares are shown: Capuli, Piartal, and Tuza. Each example vessel illustrates distinctive decorative features and simplified decorative processes. The Capuli ware is slipped red, directionally burnished, fired, resist painted, coated in black, and has its resist removed to reveal negative decoration. The Piartal ware is slipped cream, painted red, directionally burnished, fired, resist painted, coated in black, and has its resist removed to reveal negative decoration. The Tuza ware is slipped cream, burnished, painted red and/or brown, and fired.
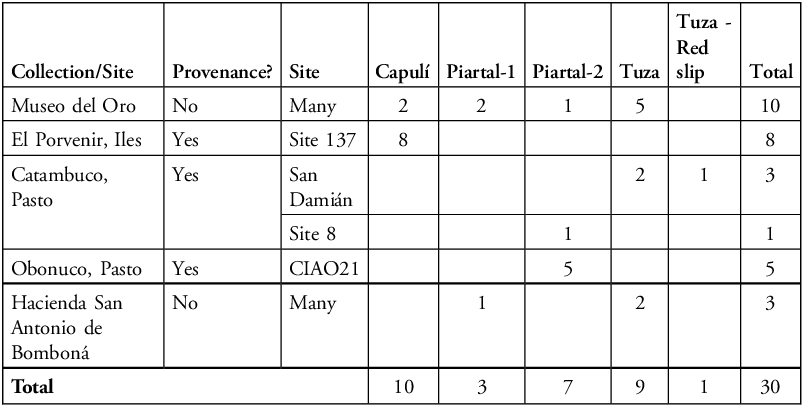
Thirty vessels, each broadly defined as a bowl with a pedestal foot, were selected for analysis (Table 1 & Table S1). The vessels were hand-built, most showing evidence of coil construction, with the bowls and pedestals made separately and later joined. Each ware is represented by 10 vessels, with Piartal and Tuza wares each further divided into subtypes (Klesner et al. Reference Klesner2025), that demonstrate the range of morphological features observed in the larger corpus, with a preference for well-preserved vessels.
Summary of the samples included in this study.

Table 1 Long description
The table presents a summary of thirty vessels, each broadly defined as a bowl with a pedestal foot, selected for analysis. The vessels were hand-built, most showing evidence of coil construction, with the bowls and pedestals made separately and later joined. The table is organized into columns labeled Collection/Site, Provenance, Site, Capulí, Piartal-1, Piartal-2, Tuza, Tuza - Red slip, and Total. It includes rows for different collections or sites such as Museo del Oro, El Porvenir, Iles, Catambuco, Pasto, Obonuco, Pasto, and Hacienda San Antonio de Bomboná. Each row details the provenance status, specific site information, and the number of vessels from each site categorized under various types like Capulí, Piartal-1, Piartal-2, Tuza, and Tuza - Red slip. The total number of vessels from each site is also provided. Notable trends include the Museo del Oro having the highest total of 10 vessels, while sites like Catambuco, Pasto, and Hacienda San Antonio de Bomboná have fewer vessels. The table highlights the distribution and types of vessels across different sites and collections.
Methods
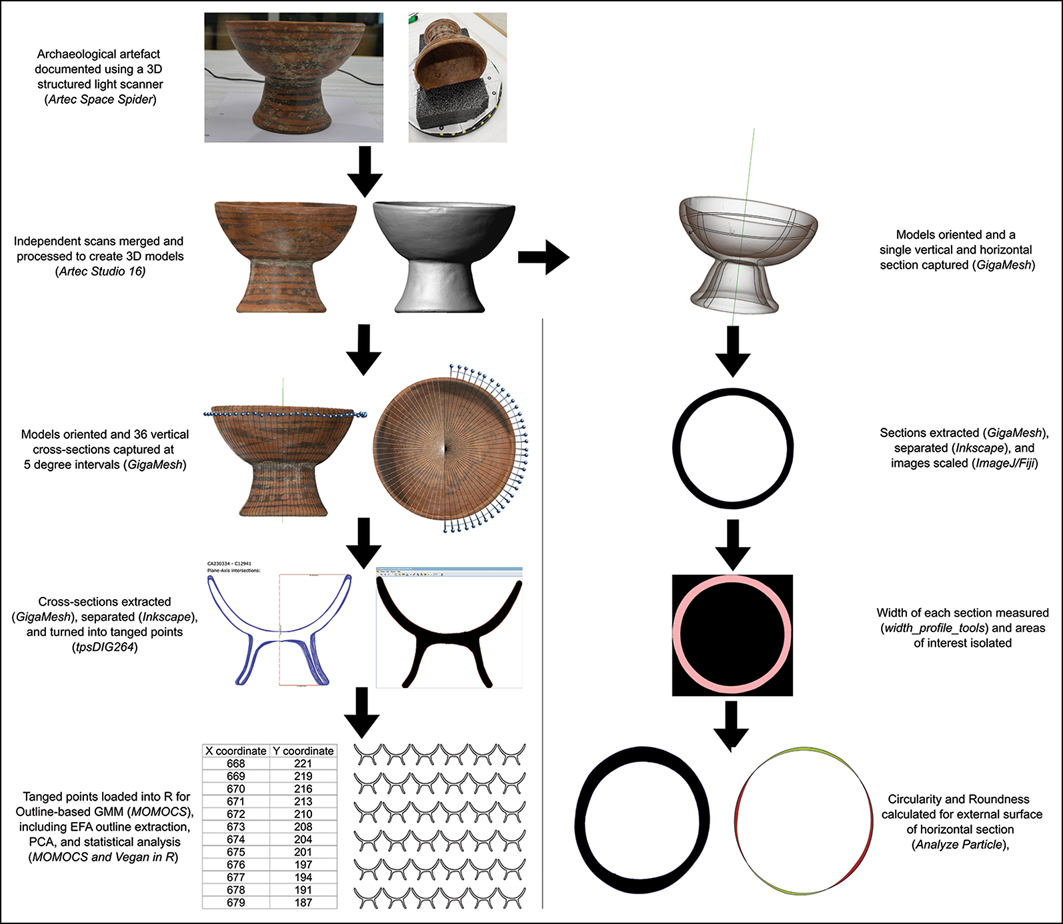
An Artec Space Spider handheld structured light scanner was used to collect morphological data, capturing 3D metrics at a resolution of up to 0.1mm and a point accuracy of up to 0.05mm using blue-light technology. Scans were merged and processed in Artec Studio 16 (Artec 3D) to generate 3D models, from which all subsequent data were derived (Figure 2).
Methods for quantitatively assessing variability in vessel shape from 3D models of ceramic vessels: left) protocol for outline-based GMM to assess inter- and intra-vessel variation; right) protocol to calculate variation in wall thickness, circularity and roundness (figure by authors).

Figure 2 Long description
The diagram presents two protocols for quantitatively assessing variability in ceramic vessel shapes using 3D models. On the left, the protocol for outline-based geometric morphometric methods (GMM) is shown, which involves capturing 36 vertical cross-sections at 5-degree intervals, extracting these cross-sections, and turning them into tanged points for statistical analysis. On the right, the protocol for calculating variation in wall thickness, circularity, and roundness is depicted, involving the extraction of sections, measurement of width, and isolation of areas of interest.
The 3D models were oriented and 36 cross-sections (every 5°) were extracted using the open-source software GigaMesh (v.5.15.2). Cross-sections containing less than 99% of the complete vessel were excluded to prevent the introduction of morphological variation resulting from use-life or burial (see online supplementary material (OSM) section S2). Most vessels retained 36 cross-sections, with a minimum of 31 meeting the >99% threshold. Cross-sections were processed in Inkscape (v.1.2.2), then converted into tanged points with tpsDIG264 (v.2.32) and loaded into the MOMOCS package (v.1.4.1) (Bonhomme et al. Reference Bonhomme2014) in R for further quantitative analyses, including Elliptical Fourier analysis (EFA) outline extraction, principal component analysis (PCA) for ordination and dimension reduction, and multivariate analysis of variance for group-based significance testing. All GMM visualisations and graphs were prepared in R (v.4.3.1) (R Core Team 2023) using RStudio (v.2023.06.1.524) (Posit Team 2023). OpenAI’s ChatGPT 5.1 was used for generating or debugging parts of the code.
Morphological variance within individual vessels was tested using a permutation test of homogeneity of multivariate dispersion on the Fourier coefficients (120 coefficients for 30 harmonics) for each cross-section. This consisted of measuring the distance between all individual group members (vessel cross-sections) and the group (vessel) centroid in multivariate principal co-ordinates analysis space using the betadisper() function of the vegan package (v.2.6-6.1) in R (Oksanen et al. Reference Oksanen2024). Groups (vessels) with higher mean distances indicated greater variance. To test if one or more groups (vessels) had a different level of morphological variability than the others, the distances of group members to the group centroid were subject to an analysis of variance. Additionally, pairwise comparisons of group mean dispersions were performed (permutest.betadisper()), which tested whether these distances differed between groups (vessels).
A horizontal cross-section was extracted per vessel, and variation in wall thickness was assessed using the open-source software ImageJ/Fiji (v. 1.54) (Schindelin et al. Reference Schindelin2012). Wall thicknesses were measured using the Width Profile tools in the MorphoLibJ plugin (v.1.6.2) (Legland et al. Reference Legland2016) and calculated as the distance between a given point on one side of the wall and the other, measured perpendicular to the centreline of the vessel wall. Two hundred measurements were taken, evenly distributed across each vessel cross-section. Circularity and roundness of the horizontal section perimeter were assessed using the Analyze Particles tool in ImageJ. For full methods, datasets and scripts, see https://zenodo.org/records/18680970
Results
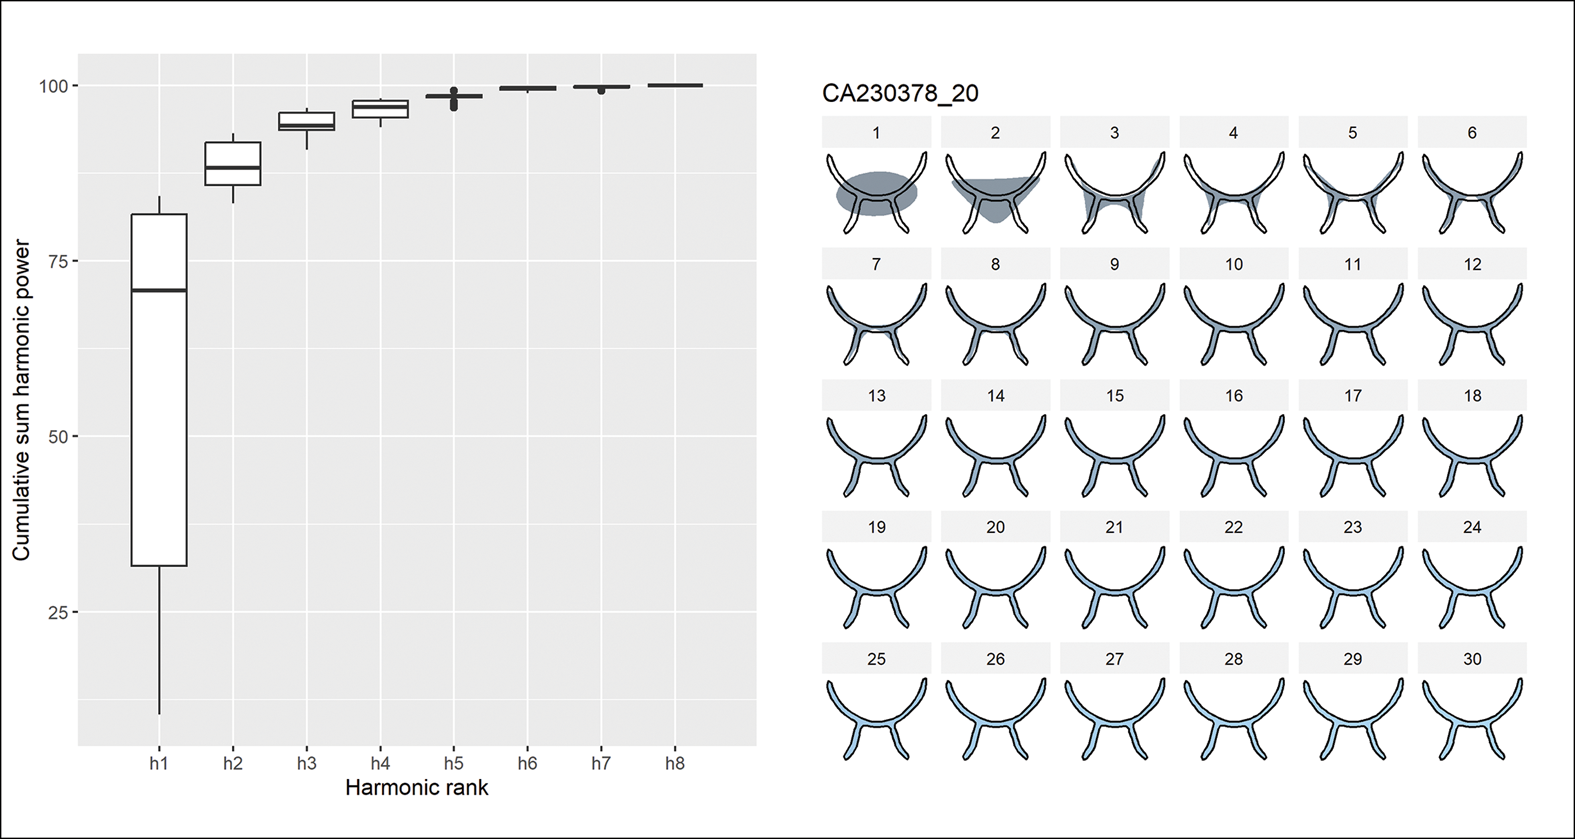
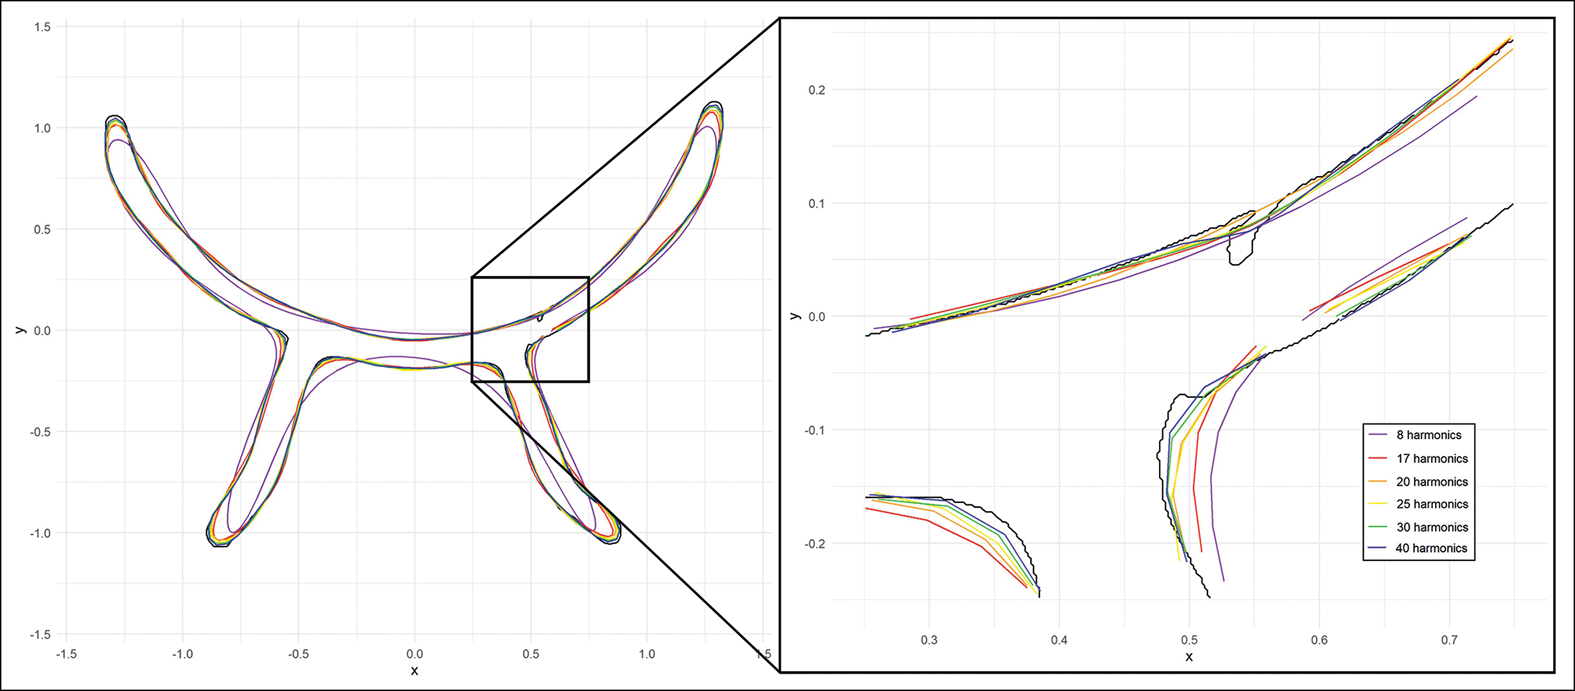
The first eight harmonics account for 99% of the variation in the data set, with 17 harmonics accounting for 99.9% of shape variation (Figure 3). However, given our interest in minor variations within vessels, EFA shapes produced using a larger number of harmonics were also investigated (Figure 4, OSM section S2). Thirty harmonics adequately capture vessel shape while minimising post-production variation.
Cumulative harmonic power (left) and visual representation of the EFA of differential numbers of harmonics (1–30) (right) (figure by authors).

Figure 3 Long description
The image contains two main parts: a box-and-whisker plot on the left and a visual representation of the EFA of differential numbers of harmonics on the right. The box-and-whisker plot displays cumulative sum harmonic power on the y-axis and harmonic rank on the x-axis. There are eight box plots labeled h1 to h8. Each box plot shows the distribution of harmonic power for each rank. The median values increase from h1 to h4 and then stabilize from h4 to h8. The boxes for h4 to h8 are tightly grouped near the top of the y-axis, indicating high cumulative harmonic power. The whiskers and outliers show variability in the data. The right side of the image shows a grid of 30 visual representations of the EFA of differential numbers of harmonics, labeled from 1 to 30. Each representation depicts the shape and symmetry of the harmonics. The shapes vary, with some showing more complexity and others being simpler. The visual representations provide a detailed look at the intra-vessel variability in the harmonics. All values are approximated.
Outline of a cross-section (CA230378), compared to the EFA shape constructed from 8, 17, 20, 25, 30 and 40 harmonics (figure by authors).

Figure 4 Long description
The line graph features multiple data lines representing the outline of a cross-section and EFA shapes constructed from 8, 17, 20, 25, 30, and 40 harmonics. The x-axis ranges from negative 1.5 to 1.5, and the y-axis ranges from negative 1.5 to 1.5. A zoomed-in section on the right highlights detailed variations in the data lines. The legend indicates the number of harmonics used for each line. All values are approximated.
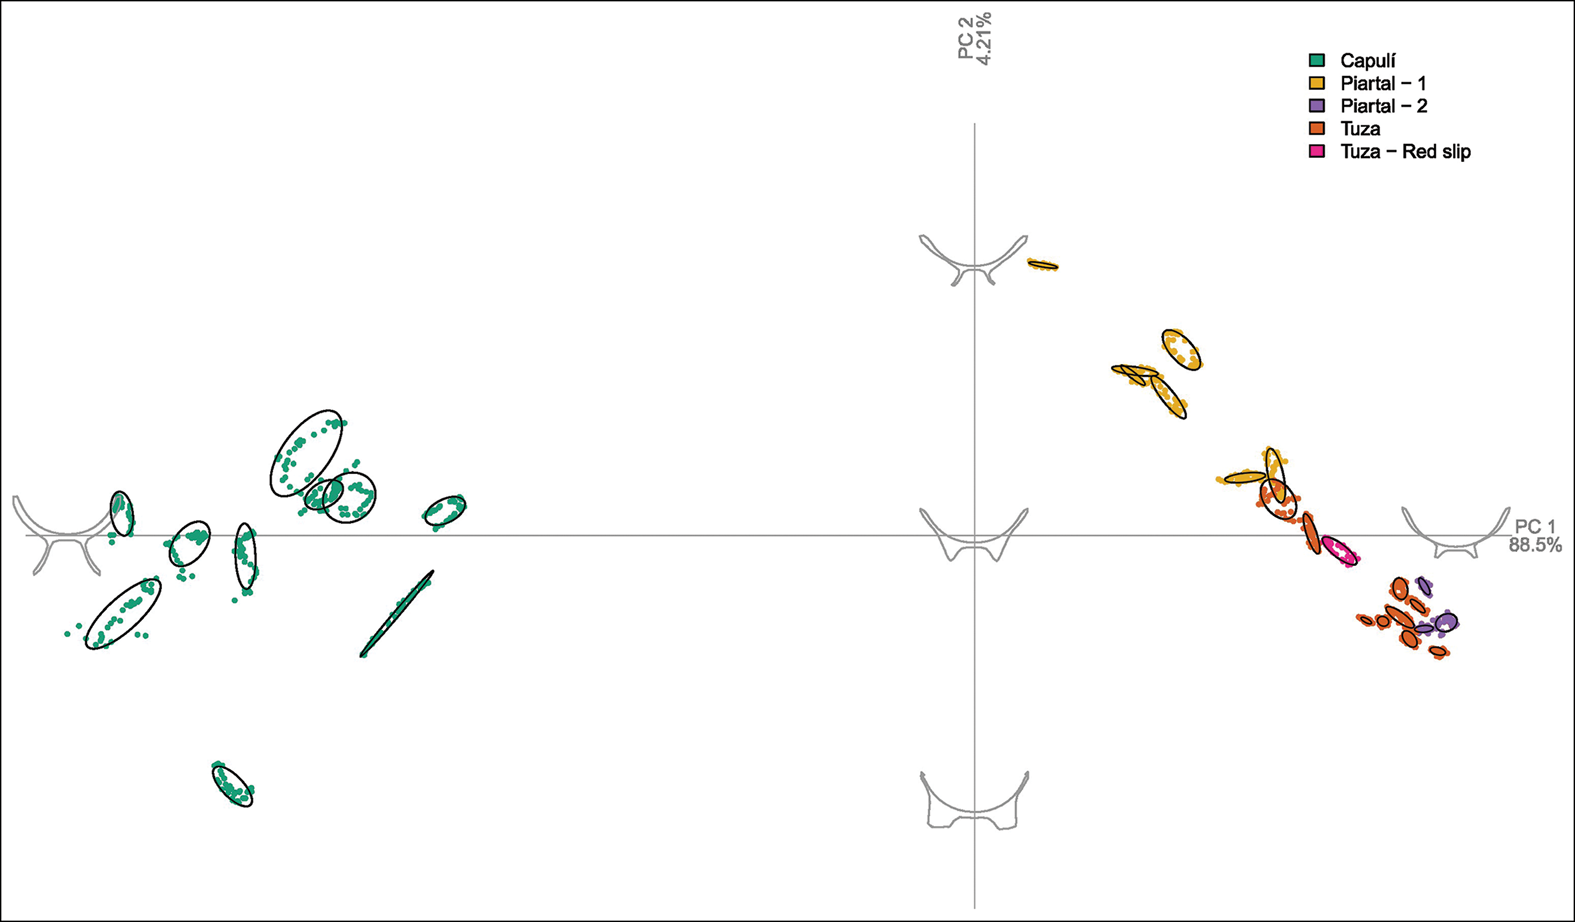
Principal components (PCs) 1 and 2 capture over 90% of variance (Figure 5). Capulí vessels have negative PC1 scores, correlating to a tall pedestalled base. Conversely, Piartal and Tuza vessels have positive PC1 scores, correlating to a shorter base. PC2 describes the nature of the bowl: positive values correspond to shallower bowls with straighter sides, while negative values describe deeper, hemispherical bowls. PC2 is also able to differentiate the two Piartal subtypes previously identified (Klesner et al. Reference Klesner2025), with higher scores in Piartal-1 vessels corresponding to their more open form, while Piartal-2 vessels show lower scores (deeper bowls) similar to Tuza vessels.
Biplot of PC1 versus PC2 for all cross-sections >99% preserved, with the ware of the sections indicated in colour and overlaid ellipses indicating 90% confidence intervals for cross-sections from individual vessels (figure by authors).

Figure 5 Long description
A scatter plot displays the relationship between principal components 1 and 2, capturing over 90% of variance. The plot includes several data points color-coded to represent different ware types: Capulí, Piartal 1, Piartal 2, Tuza, and Tuza Red slip. Overlaid ellipses indicate 90% confidence intervals for cross-sections from individual vessels. The x-axis represents principal component 1, accounting for 88.5% of the variance, while the y-axis represents principal component 2, accounting for 4.21% of the variance. The data points form distinct clusters, with some gaps and outliers visible. The overall trend shows no clear correlation between the two principal components. All values are approximated.
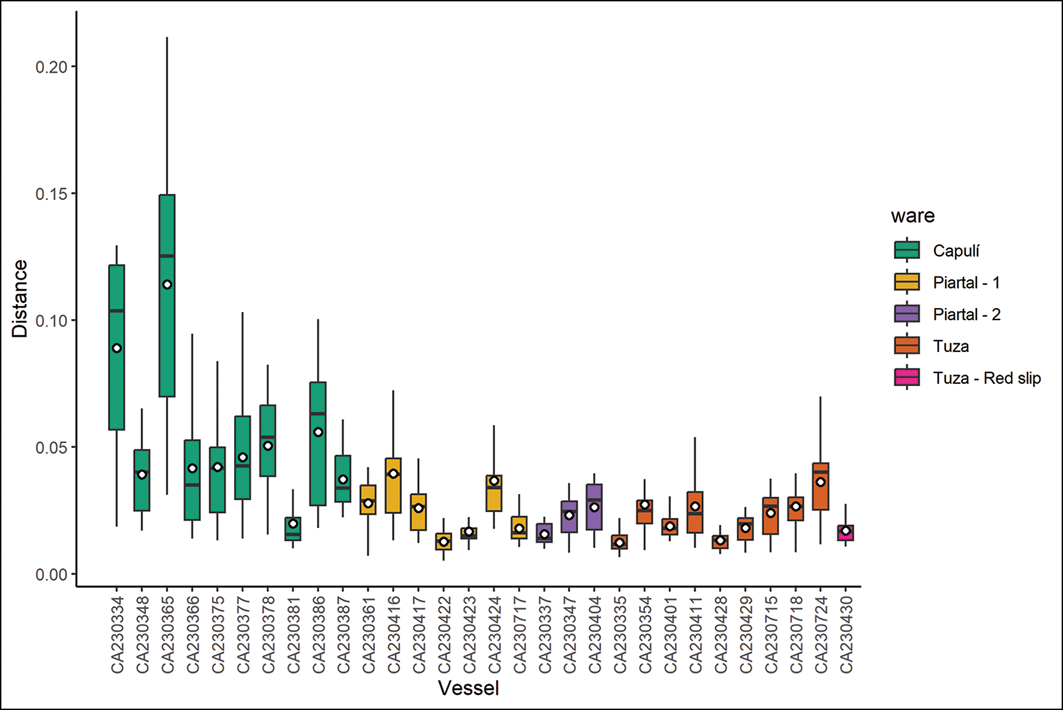
The PCA plot allows an initial assessment of intra-vessel variability, as data points for some vessels form tighter clusters, reflecting greater consistency among cross-sections. To obtain a quantitative proxy for intra-vessel variation, we calculated the group distance to the centroid value (DGroup, Table S6) from all vessel cross-sections (Figure 6). Capulí vessels demonstrate more variability in their DGroup values and have larger values overall, pointing to higher intra-vessel variation and varying skill levels of producers. Some Capulí vessels do, however, have very low DGroup values (e.g. CA230381) and were perhaps made by a more skilled craftsperson, or by someone who placed more emphasis on maintaining internal symmetry. On average, Piartal and Tuza vessels have lower DGroup values and demonstrate less variability in this metric. The vessel with the lowest average value (CA230335) shows evidence of wheel turning on the base.
Boxplot showing the distribution of distance to the centroid values for each vessel by ware, used to calculate the DGroup (mean value indicated by white dot) (figure by authors).

Figure 6 Long description
The box-and-whisker plot displays the distribution of distance to centroid values for various pottery vessels categorized by ware. The plot includes multiple vertical box plots, each representing a different vessel. The x-axis lists vessel identifiers, while the y-axis measures distance values ranging from 0.00 to 0.20. Each box plot shows the median value indicated by a white dot, with the lower and upper quartiles marked by the box edges. Whiskers extend to the minimum and maximum values, and outliers are represented by individual points. The plot uses different colors to distinguish between various wares: Capulí, Piartal - 1, Piartal - 2, Tuza, and Tuza - Red slip. The data indicates variability in distance to centroid values across different vessels and wares, with some vessels showing wider distributions and others more concentrated values. All values are approximated.
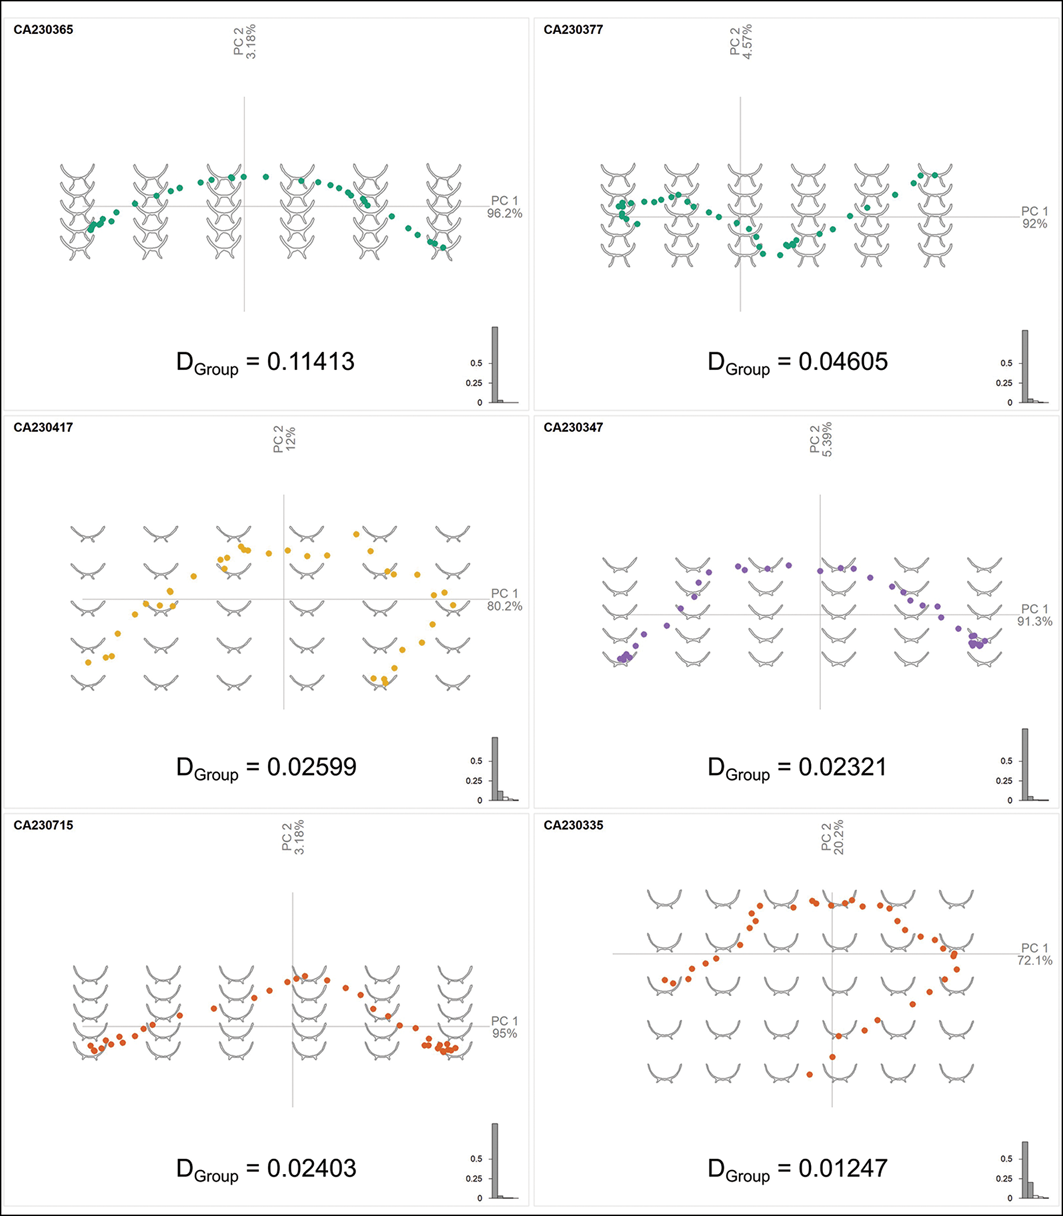
PCA of individual vessels reveals the specific nature of intra-vessel variation (Figure 7). To illustrate this, we selected six vessels based on their DGroup values: CA230335 (lowest value), CA230365 (highest value) and the vessels representing each ware’s median value—CA230377 (Capulí), CA230417 (Piartal-1), CA230347 (Piartal-2) and CA230715 (Tuza). CA230365 exhibits morphological variation in PC1 due to a misalignment between the internal axes of the bowl and base, causing the vessel to appear tilted. PC2 for CA230365 highlights variation in the forming and joining of the base, particularly where it meets the bowl, indicating that the base is slightly oblong at the join. In contrast, the Piartal-1 vessel CA230417 shows morphological variation resulting from differences in wall curvature across both the bowl and base, capturing a different idiosyncratic morphology, but with less overall variability as indicated by the DGroup value.
PC1 versus PC2 for the 36 cross-sections from each vessel (figure by authors).

Figure 7 Long description
The dot plot displays intra-vessel variability in ceramic vessels, with six distinct groups of data points. Each group represents a different vessel, identified by labels such as CA230365, CA230377, CA230417, CA230347, CA230715, and CA230335. The x-axis represents the first principal component (PC1), while the y-axis represents the second principal component (PC2). Each dot within a group signifies a cross-section of the vessel, with the distribution of dots indicating variability in size and shape features like wall thickness or rotational symmetry. The groups show varying levels of consistency, with some vessels exhibiting tighter clusters of dots, suggesting less variability, while others display more dispersed dots, indicating greater variability. The DGroup values, such as 0.11413 for CA230365 and 0.01247 for CA230335, quantify the overall variability within each vessel group. The plot highlights the potential for identifying individual potters' styles and skills through detailed analysis of intra-vessel variability. All values are approximated.
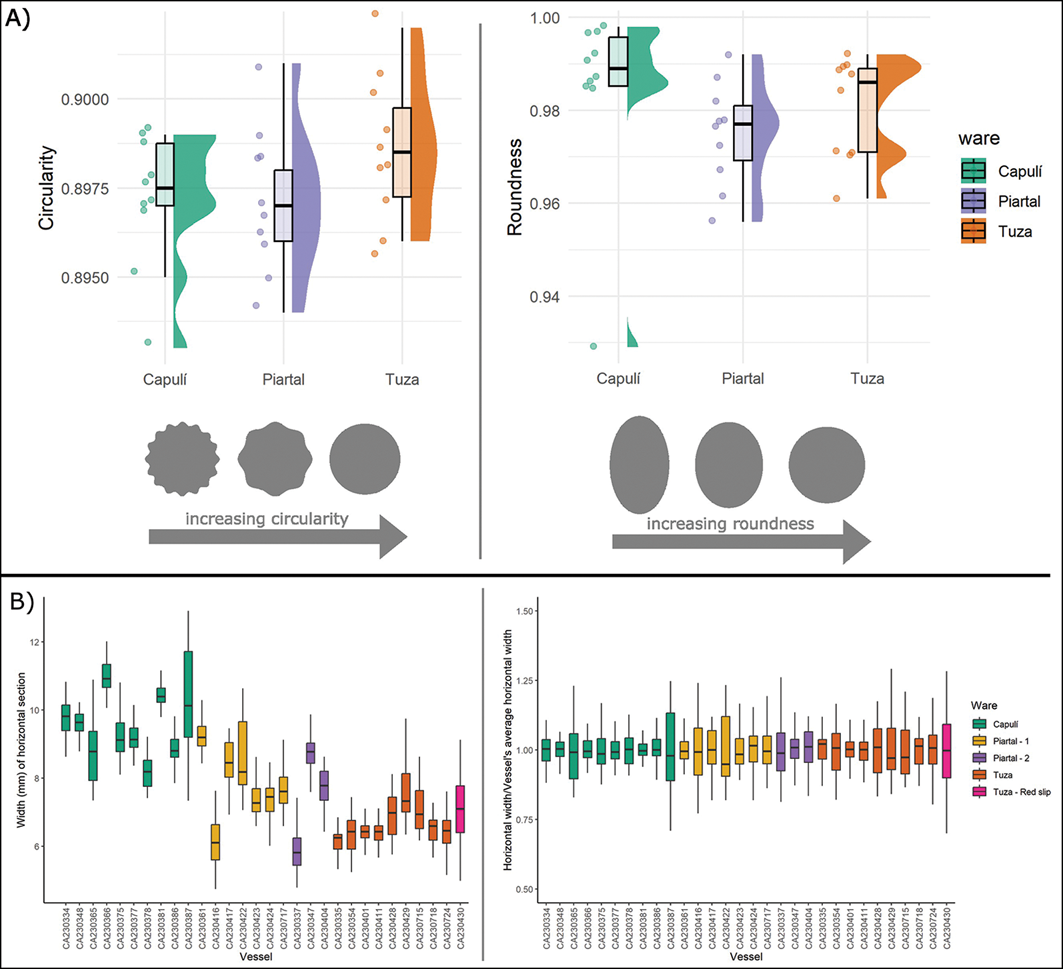
Internal symmetry was assessed through the measurements of circularity (C) and roundness (R) of the horizontal cross-sections (Figure 8A), where:
 $$C = 4\pi \left( {{{Area} \over {Perimete{r^2}}}} \right)\,\quad\quad\quad\quad\quad\quad R = {{4Area} \over {\pi {{\left( {Lengt{h_{Major\;Axis}}} \right)}^2}}}$$
Both parameters measure similarity to a perfect circle, expressed as a number between 0 and 1 (with 1 being a perfect circle). Circularity measures perimeter distortion across the circumference. The more deviations in the vessel symmetry, the larger the perimeter and the lower the circularity value. Capulí (average = 0.8972) and Piartal (average = 0.8971) wares have slightly lower circularity than Tuza vessels (average = 0.8986), but differences are not statistically significant. Roundness assesses how circular the vessel is regarding the aspect ratio and captures any elongation in the shape along the major axis. Capulí (average = 0.985) and Tuza (average = 0.981) wares have greater roundness than Piartal vessels (average = 0.975), but again differences are not statistically significant.
A) Circularity and roundness values calculated from horizontal sections; B) spread of intra-vessel wall thickness, showing the distribution of 200 width values taken sequentially for each vessel (left), and the same values normalised to the mean width of the vessel (right), grouped by their different wares (figure by authors).

Figure 8 Long description
A box-and-whisker plot displays circularity and roundness values for three different wares: Capulí, Piartal, and Tuza. The plot is divided into two sections: circularity on the left and roundness on the right. Each section contains three box plots representing the different wares. The x-axis labels the wares, while the y-axis measures circularity and roundness values. The circularity values range from approximately 0.8950 to 0.9000, and the roundness values range from approximately 0.94 to 1.00. Each box plot shows the median, lower quartile, upper quartile, and whiskers indicating the range of values. Outliers are marked as individual points. The Capulí ware has the lowest circularity and roundness values, while the Tuza ware has the highest. The Piartal ware falls in between. The plot also includes illustrations of shapes indicating increasing circularity and roundness. All values are approximated.
Inter- and intra-vessel variation was also examined through wall thickness. Piartal, Tuza and Capulí wares have significantly different mean wall thicknesses (p<0.001). Capulí vessels have thicker walls (Figure 8B, Table S7), aligning with their higher average height (109.7±19.2mm). Capulí and Piartal vessels have more inter-vessel variation in wall thickness (Table S7) compared to Tuza vessels, which are very consistent in their average wall thickness coefficient of variation (CV = 7%). However, the intra-vessel variation in wall thickness across these wares is consistent, with Capulí, Piartal and Tuza all having similar average intra-vessel CVs (see Table S8, CV = 8% for Capulí and Piartal, CV = 6% for Tuza).
Discussion
This study explores a range of metric and morphological parameters that can be readily extracted from 3D models, facilitating comparative analyses of ceramic traditions. The methods described can be applied to 3D meshes generated from a wide variety of techniques (micro-CT, structured light, photogrammetry, etc.), although assessment of wall-thickness variability requires the capture of both external and internal wall surfaces. Moreover, as circularity, roundness and the DGroup metric rely on exterior geometry, they can be generated from external scans of closed vessels to assess standardisation.
As this study serves as a proof-of-concept, our sample sizes are relatively small, and some differences do not reach statistical significance (Table S8). Nevertheless, our results demonstrate potential and provide a framework for future research. The foregoing discussion implicitly assumes that potters worked to the best of their ability in each instance to shape an ‘ideal’ bowl, with high rotational symmetry and low fluctuation in other metric/morphological parameters. Thus, deviations from this ‘ideal’ shape reflect limitations in motor skills (Thér & Wilczek Reference Thér and Wilczek2022). Alternative explanations—such as production expediency or a high tolerance for variability by consumers—are possible, but these parameters are still useful as characterisation aids to facilitate the testing of hypotheses.
Metrics such as roundness and circularity, and variations in wall thickness, are useful proxies of skill. The CVs for each metric readily allow for comparisons within and between wares, as well as an assessment of the extent to which these variations would be perceptible. This assessment is based on experimental findings regarding the limits of human perception, the so-called Weber fraction (Eerkens & Bettinger Reference Eerkens and Bettinger2001). Here, since CVs exceed 3% in practically all cases, we can assume that intra-vessel variations were perceptible and either deemed acceptable or higher standardisation was beyond the physical ability of potters. Additionally, we observe that the distribution of these values varies meaningfully. Considering internal symmetry, Capulí vessels consistently show the highest values for roundness, but not for circularity—perhaps reflective of a particular construction method, such as the use of a mould. Piartal vessels show the most variation for both parameters, which may indicate a wider range of construction methods and/or makers, and is potentially consistent with the identification of two morphological subtypes. Intra-vessel variation in wall thickness was consistent across the assemblage, which is likely indicative of their shared primary forming method, coil-construction. Prior research (Thér & Wilczek Reference Thér and Wilczek2022) has demonstrated that coil-construction (albeit combined with wheel finishing using a turntable) shows higher variation in horizontal wall thickness compared to wheel throwing, and this is a promising metric for the exploration of differences in forming methods (see OSM section S3).
The most robust indicator of morphological variability is the DGroup, which encapsulates all sources of morphological variation at once and reveals statistically significant differences between wares. This approach allows for both quantitative comparisons and visualisation of the sources of variation via PCA plots. A key limitation, however, is that the DGroup is relative to each PCA, therefore, unlike the metrics above, the DGroup cannot be compared between studies unless all artefacts to be compared are analysed together. Unlike previous studies using normalised PC-score CVs (Wang & Marwick Reference Wang and Marwick2020; Loftus Reference Loftus2022), we find the DGroup a more suitable variability metric, as calculating CVs from inherently dimensionless PC scores is not appropriate (see OSM section S4).
In our study, Capulí vessels generally show higher DGroup values, indicating overall lower rotational symmetry within vessels. This ware also displays the highest levels of morphological and metric variation between vessels (Klesner et al. Reference Klesner2025). The data thus suggest a decentralised craft tradition allowing for variations in vessel size and shape, accommodating a range of skill levels but lacking virtuoso artisans (Kuijpers Reference Kuijpers2018). Notably, there is an outlier in this group (CA230381), which shows the lowest DGroup value and the highest roundness, and is perhaps the work of an outstanding individual.
The generally lower DGroup values for Piartal and Tuza vessels are potentially indicative of more highly skilled makers. Such heightened skill may itself be a product of more intensified production. Allowing for some variation within wares, and bearing in mind our small sample size, there are no marked differences between the internal standardisation or rotational symmetry of Piartal and Tuza vessels. This is an interesting observation given the recent suggestion that Tuza wares may mark the introduction of foreign ideas or craft knowledge, as reflected in new decorative techniques and the possible use of rotary kinetic energy to shape vessels (Klesner et al. Reference Klesner2025). Aside from a slight circularity increase, the introduction of new technical knowledge was seemingly not accompanied by an increase in product standardisation.
A particularly promising future application of our methods may be the study of variability within single deposits, such as tombs, where morphometric variability may reflect different motor habits and hence the involvement of different manufacturers. Five Piartal vessels included in this study (CA230416–CA230424) derive from a single eleventh–twelfth-century AD tomb at CIAO21 (see OSM section S1) and represent the entire range of observed DGroup values and wall thickness CVs for Piartal-1, and have similarly large ranges in circularity and roundness. This variation between vessels indicates that the objects interred in this tomb were likely made by multiple individuals.
Conclusions
This study highlights the value of integrating metric and morphological parameters extracted from 3D models to analyse ceramic traditions. Despite the limited sample size, the results of our case-study analysis reveal meaningful patterns in vessel variability and skill levels. Capulí vessels show greater morphological variation, both within and between vessels, suggesting decentralised production with varying skill levels, while Piartal and Tuza vessels exhibit slightly higher symmetry but no significant difference in intra-vessel standardisation. Tuza vessels exhibit the least inter-vessel variation in horizontal wall thickness, suggesting somewhat more standardised production, although the difference is not statistically significant for the sample size.
Among the various metrics assessed, the DGroup metric, calculated from multiple virtual cross-sections from individual vessels, emerges as the most informative measure of inter- and intra-vessel variation. This metric not only captures overall morphological variability but gives an indication of central tendencies in vessel forming and finishing, potentially reflecting both individual habits and broader communities of practice and craft traditions. This method for assessing morphological variation is applicable across a range of ceramic assemblages and vessel shapes, offering a path to a richer picture of past technological practices.
Acknowledgements
We thank the Museo del Oro, Unión del Sur, the University of CESMAG (Centro de Estudios Superiores María Goretti) and Felipe Díaz del Castillo for permitting the analysis of archaeological material and providing access to collections and workspace. Special thanks to Lina María Campos-Quintero, Juanita Sáenz-Samper and María Alicia Uribe-Villegas (Museo del Oro); Felipe Cárdenas Arroyo; María Camila Maya Cabrera; PaulaAndrea Murillo Jaramillo (CESMAG); David Alejandro Pérez Fernández (Unión del Sur); and Lucero Aristizábal Losada and Marcela Bernal Arévalo for their support and archaeological insights, and to Jessica Pérez and Orlando del Castillo (Museo del Oro) for facilitating access. We are also grateful to Ángela María Lucero Bernal and Ana Milena Melo for their crucial assistance with 3D scanning. Lastly, we thank the Computational and Digital Archaeology Laboratory Group at the University of Cambridge and Enrico Crema for their valuable input.
Funding statement
This project received funding from the European Research Council under the European Union’s Horizon 2020 research and innovation programme (Grant No.101021480, REVERSEACTION). Access to instruments from the McDonald Institute for Archaeological Research was facilitated by a grant from the UK Research & Initiative Arts and Humanities Research Council Capability for Collections Fund for the Cambridge Heritage Science Hub Initiative (AH/V011685/1).
Data availability
Datasets, code and supplementary files are also available in a Zenodo repository: https://doi.org/10.5281/zenodo.18680970
Online supplementary material (OSM)
To view supplementary material for this article, please visit https://doi.org/10.15184/aqy.2026.10323 and select the supplementary materials tab.


 Open access