


INTRODUCTION
Authoritarian regimes in recent years increasingly shape the global information environment through cross-border media operations. Russia’s information campaigns targeting U.S. elections (Golovchenko et al. Reference Golovchenko, Buntain, Eady, Brown and Tucker2020; Jamieson Reference Jamieson2020; Levin Reference Levin2016) and China’s media outreach across Asia, Africa, and the West (Kurlantzick Reference Kurlantzick2023; Wasserman and Madrid-Morales Reference Wasserman and Madrid-Morales2018) exemplify this growing trend.Footnote 1 To disseminate their preferred content and narratives to foreign audiences, authoritarian governments employ a variety of approaches. Some establish state-run international broadcasters like Russia’s RT and Sputnik (Wagnsson Reference Wagnsson2023) and China’s CGTN and China Daily (Mattingly et al. Reference Mattingly, Incerti, Changwook, Moreshead, Tanaka and Yamagishi2025). Others implement more covert strategies, including co-opting foreign media outlets (Hamilton Reference Hamilton2018; Hsu Reference Hsu2014), embedding sponsored content disguised as independent journalism (Dai and Luqiu Reference Dai and Luqiu2020), and manipulating social media platforms through coordinated inauthentic behavior (Bauer and Wilson Reference Bauer and Wilson2022; Huang and Wang Reference Huang and Wang2019; Lukito et al. Reference Lukito, Suk, Zhang, Doroshenko, Kim, Min-Hsin and Xia2020).
Foreign-backed media operations present a major concern for democratic elections, yet rigorous evidence of whether and how they affect voters during campaigns remains sparse. Existing research predominantly scrutinizes Russian operations, particularly those targeting the United States (Bateman et al. Reference Bateman, Hickok, Courchesne, Thange and Shapiro2021), and primarily relies on observational data that inherently constrains causal inference. The broader literature also presents mixed findings: some studies report significant effects (Bailard Reference Bailard2016; Carter and Carter Reference Carter and Carter2021; Fisher Reference Fisher2020; Mattingly et al. Reference Mattingly, Incerti, Changwook, Moreshead, Tanaka and Yamagishi2025), but others show little to no impact (Bail et al. Reference Bail, Guay, Maloney, Combs, Hillygus, Merhout and Freelon2020; Eady et al. Reference Eady, Paskhalis, Zilinsky, Bonneau, Nagler and Tucker2023). The disproportionate focus on American populations further limits our understanding of how such operations function across diverse democratic contexts. These methodological and geographical limitations leave crucial questions unanswered: To what extent can foreign-backed media operations influence voters, especially beyond the American context? Under what conditions do these operations succeed or backfire?
This article addresses these gaps by presenting novel experimental evidence from a general election in Taiwan, which serves as an ideal laboratory for examining foreign-backed media effects for several reasons: Taiwan is frequently targeted by People’s Republic of China (PRC) influence campaigns (Mechkova et al. Reference Mechkova, Pemstein, Seim, Wilson and Wang2019); its political divisions mirror broader geopolitical attitudes toward the PRC; it maintains a Chinese-language information environment; and it represents a significant flashpoint between global powers. The PRC has long sought to influence Taiwan’s media landscape (Huang Reference Huang2017; Lee and Cheng Reference Lee and Cheng2019). The most prominent example is the 2008 acquisition of The China Times Media Group (hereafter CT) by Taiwanese billionaire Tsai Eng-meng, whose business empire is heavily tied to the PRC. Tsai openly stated his goal in acquiring this media group was to promote PRC-friendly perspectives in Taiwan. Since this acquisition, CT has faced multiple allegations of close PRC connections, including receiving direct editorial instructions (Aspinwall Reference Aspinwall2019) and financial subsidies (Kawase Reference Kawase2019; Yang Reference Yang2019), attending meetings convened by senior PRC officials (Brown Reference Brown2019), and publishing advertorials funded by the PRC (Hsu Reference Hsu2014).
Although concerns about this Beijing-aligned outlet have intensified (Hille Reference Hille2019), its actual impact on voters remains unclear, and existing theories offer contrasting predictions. Many influential theories would predict CT’s impact to be limited: viewers likely recognize and adjust for its media bias (Chiang and Knight Reference Chiang and Knight2011), question its hidden motives (Rhee, Crabtree, and Horiuchi Reference Rhee, Crabtree and Horiuchi2023), and resist counterattitudinal information (Mason Reference Mason2018; Taber and Lodge Reference Taber and Lodge2006). Today’s high-choice media environment may further limit CT’s potential reach (Arceneaux and Johnson Reference Arceneaux and Johnson2013).
Meanwhile, alternative theories would predict CT’s capacity to exert meaningful effects: viewers often fail to adequately correct for media bias (Cain, Loewenstein, and Moore Reference Cain, Loewenstein and Moore2005; Fisher Reference Fisher2020; Little Reference Little2023; Peisakhin and Rozenas Reference Peisakhin and Rozenas2018). Slanted outlets also deliberately amplify favorable content and minimize unfavorable stories, exposing audiences to filtered information (Gentzkow and Shapiro Reference Gentzkow and Shapiro2006). Recent studies have demonstrated that slanted media can alter political preferences (DellaVigna and Kaplan Reference DellaVigna and Kaplan2007; Martin and Yurukoglu Reference Martin and Yurukoglu2017), even with cross-cutting (Broockman and Kalla Reference Broockman and Kalla2025) and cross-border (DellaVigna et al. Reference DellaVigna, Enikolopov, Mironova, Petrova and Zhuravskaya2014; Peisakhin and Rozenas Reference Peisakhin and Rozenas2018) exposure. Furthermore, pro-Beijing messaging may gain more legitimacy when delivered through known local sources than directly from PRC state media (Dai and Luqiu Reference Dai and Luqiu2020), and evidence indicates that source familiarity influences news selection preferences (Peterson and Allamong Reference Peterson and Allamong2022). Anecdotal observations suggest that increased exposure to pro-Beijing content on social media can shift Taiwanese voters toward PRC interests (Huang Reference Huang2019), but CT’s impact remains a matter of speculation without direct evidence.
I conducted a preregistered, randomized field experiment during Taiwan’s 2020 general election to evaluate CT’s electoral effects. This experiment incentivized voters to browse a customized website featuring CT’s real-time political news in the weeks preceding the election. During the incentivized period, I sent participants daily reminders about the site to enforce compliance and tracked their browsing behavior with web traffic data. To capture changes in outcome measures, I administered a panel survey before and after the experiment. By linking individual survey responses to browsing histories, I examine how sustained exposure to CT content affects vote choices and attitudes toward the PRC. The detailed data on participants’ background characteristics also allow me to evaluate effect heterogeneity and competing explanations of the findings.
Despite the common view that PRC state media have little appeal (Repnikova Reference Repnikova2022), I show that a covert approach—foreign media co-optation—proved effective in the 2020 general election.Footnote 2 Exposure to CT substantially increases support for the PRC-favored candidate, who received extensive, positive coverage from this outlet throughout the campaign. Following sustained consumption of CT’s political news over a two-week period, 15.9% of participants who initially reported no intention to vote for the candidate demonstrated a measurable shift in electoral preference. Additional analysis reveals that the effects are concentrated among nonpartisan and PRC-friendly voters, whereas minimal impact is detected among PRC-skeptics. Exposure to CT also improves attitudes toward the PRC but backfires among those who had been dismissive of the PRC. Consistent with the effect heterogeneity, I find that PRC-friendly and PRC-skeptical participants exhibit divergent cognitive and emotional reactions to CT’s political news, but these differences are absent in the placebo condition, wherein participants were incentivized to consume CT’s entertainment news.
I argue that CT’s substantial impact stems primarily from the prevalence of persuadable voters in the election—specifically nonpartisan and PRC-friendly segments. Nonpartisans make up roughly 40% of the electorate, and my data demonstrate that these voters, characterized by political inattentiveness and moderate baseline views, are especially susceptible to CT’s influence. PRC-friendly voters are equally vulnerable. Both my survey and contemporaneous polling indicate that they exhibit substantially greater pre-election uncertainty in candidate choice than their PRC-skeptical counterparts, likely because of their preferred party’s unconventional nominee. This pronounced uncertainty creates fertile ground for CT’s influence; its editorial slant aligns with PRC-friendly voters’ predispositions while capitalizing on their unsettled state to sway these ideologically sympathetic yet wavering constituents. In contrast, CT’s limited impact among PRC-skeptics reflects its inability to convert ideological opponents, suggesting that its influence may wane when anti-Beijing attitudes continue to strengthen in Taiwan’s post-election landscape (Wang and Huang Reference Wang and Huang2024).
This study contributes to the growing literature on the impact of media influence operations by authoritarian regimes. Although most research examines state-run international broadcasting (e.g., Mattingly et al. Reference Mattingly, Incerti, Changwook, Moreshead, Tanaka and Yamagishi2025; Min and Luqiu Reference Min and Luqiu2021), far less is known about the effectiveness of media co-optation—the acquisition and steering of domestic news outlets to serve a foreign regime’s objectives. The covert strategy by the PRC has been documented not only in Taiwan but also in Australia (Hamilton Reference Hamilton2018), Japan (Ichihara Reference Ichihara2020), Singapore (Mahtani and Chandradas Reference Mahtani and Chandradas2023), the United States (Dai and Luqiu Reference Dai and Luqiu2020), New Zealand (Brady Reference Brady2018), and European countries (Benner et al. Reference Benner, Gaspers, Ohlberg, Poggetti and Shi-Kupfer2018, 22–5). Through a field experiment combining individual-level panel surveys with web-tracking during an actual general election, this study provides the first empirical evidence of the electoral impact of PRC-backed media operations in democratic contexts.
This study also advances our understanding of voter persuasion under high-competition, high-salience electoral conditions, where the minimal effects paradigm predicts little change. I build on previous studies of slanted media (Chiang and Knight Reference Chiang and Knight2011; DellaVigna and Kaplan Reference DellaVigna and Kaplan2007; Gerber, Karlan, and Bergan Reference Gerber, Karlan and Bergan2009; Grossman, Margalit, and Mitts Reference Grossman, Margalit and Mitts2022; Martin and Yurukoglu Reference Martin and Yurukoglu2017), the effectiveness of campaign communications (Broockman and Kalla Reference Broockman and Kalla2023; Greene Reference Greene2011; Kalla and Broockman Reference Kalla and Broockman2018), and information processing (Taber and Lodge Reference Taber and Lodge2006; Zaller Reference Zaller1992), showing that repeated exposure to slanted outlets like CT can sway voters even in hard-fought races. Although these results may be driven by Taiwan’s unique political context, they align with seminal theories and studies of persuasion, such as belief-based models highlighting the role of prior attitudes in message reception (Zaller Reference Zaller1992), motivated reasoning research on asymmetric processing of congruent and incongruent information (Taber and Lodge Reference Taber and Lodge2006), and studies showing that slanted media can persuade despite bias awareness (DellaVigna and Kaplan Reference DellaVigna and Kaplan2007; Peisakhin and Rozenas Reference Peisakhin and Rozenas2018). The scope conditions of this study are elaborated in the discussion section.
This study has broader implications for current events, including foreign electoral intervention in democratic societies and the PRC’s growing global outreach. The core finding that the strength and direction of political priors shape how audiences respond to pro-Beijing messaging suggests that as global opinion on the PRC has declined in recent years (Xie and Jin Reference Xie and Jin2022), the effectiveness of PRC influence operations may weaken as well. That said, because preexisting attitudes toward the PRC vary across developed and developing countries, these operations may be more likely to succeed in some regions, such as Latin America and Africa, than in others.Footnote 3
STUDY CONTEXT
Following Japan’s defeat at the end of World War II and its subsequent relinquishment of Taiwan, the Nationalist Party (KMT) briefly governed both mainland China and Taiwan. After its defeat by the Chinese Communist Party in the Chinese Civil War, however, the KMT government retreated to Taiwan in 1949, establishing separate governance structures on the island. Since this separation, Beijing has consistently maintained that Taiwan is an inseparable part of the PRC, viewing reunification as both a historical imperative and a core national interest. Under this background, the PRC challenges Taiwan’s international participation, requires foreign firms to recognize the one-China principle for market entry, and expresses its commitment to preventing any formal declaration of Taiwanese independence, including the potential use of force.
Taiwan’s electoral outcomes therefore hold profound strategic significance for the PRC, transcending typical foreign policy considerations. Beijing perceives Taiwan’s democratic elections as posing both risks and opportunities—risks because pro-independence or PRC-critical candidates might further distance the island from reunification, and opportunities to influence electoral outcomes favorable to mainland interests. In response, Beijing has deployed a diverse array of strategies to sway Taiwan’s elections and public opinion, alternating among military intimidation (Wu et al. Reference Wu, Sun, Wen-Cheng and Huang2023), economic statecraft (Keng, Tseng, and Yu Reference Keng, Tseng and Yu2017), and information warfare (Huang Reference Huang2024).
Taiwan remained under authoritarian rule until the KMT lost the presidency to the Democratic Progressive Party (DPP) in 2000, marking the beginning of Taiwan’s gradual transition to a two-party democracy. The central political divide between PRC-friendly and PRC-skeptical stances forms the backbone of Taiwanese politics, encompassing core questions of national identity, security, and economic development. The pan-blue coalition, led by the KMT, advocates for closer economic and diplomatic engagement with the PRC, emphasizing peaceful coexistence, shared cultural heritage, and economic opportunities presented by the mainland market. In contrast, the pan-green coalition, led by the DPP, champions the preservation of Taiwan’s de facto sovereignty, distinct national identity, and democratic freedoms, viewing increased integration with the PRC as threats to Taiwan’s autonomy and security. This cleavage fundamentally shapes voter preferences and campaign discourse, often overshadowing other domestic policy issues (Achen and Wang Reference Achen and Wang2017).
For most Taiwanese, even many who have no interest in unification, independence remains too risky as long as the PRC continues to use military intimidation and flybys around Taiwan’s air defense identification zone to signal its displeasure. While about two-thirds of the island’s citizens identify as Taiwanese rather than Chinese, most avoid making a definitive choice between unification with the PRC or full independence, opting instead to keep the status quo (Wang et al. Reference Wang, Wu, Chen and Yeh2024). Similarly, partisanship in Taiwan remains fluid. A stable core of strong partisans exists, yet nonpartisans still constitute a large segment of the population. Nationally representative surveys conducted by NCCU’s Election Study Center indicate that even after excluding partisan leaners, 40% of the electorate was nonpartisan before the 2020 general election. Compared with pan-blue and pan-green partisans, nonpartisans tend to hold more moderate views on relations with the PRC (Wang Reference Wang2019), display less political interest, and are more likely to be cross-pressured voters (Achen and Wang Reference Achen and Wang2017, chap. 4).
Taiwan’s 2020 general election was held on January 11, featuring two major presidential candidates and one minor contender. The DPP incumbent, Tsai Ing-wen, had maintained tense relations with Beijing since her initial election in 2016. Her main challenger, Han Kuo-yu of the KMT, had disappeared from politics for nearly two decades before his unexpected victory in the 2018 mayoral election in southern Taiwan. James Soong, a veteran politician, participated as a third-party candidate. Beijing implicitly favored Han because of his conciliatory stance toward the PRC, with reports suggesting PRC efforts to sway voters in his favor (Horton Reference Horton2019). Han stood out as an unconventional candidate, employing populist and anti-establishment rhetoric (Batto Reference Batto2021) and lacking traditional support from party elites (Rigger Reference Rigger2021). As in past elections, the presidential race was dominated by “the China factor”—covering issues like PRC electoral interference, cross-strait relations (i.e., relations between Taiwan and mainland China, separated by the Taiwan Strait), the U.S.–China trade war, and the Hong Kong protests. Ultimately, Tsai secured her second term with 57.1% of the vote, Han received 38.6%, and Soong garnered 4.3%.
Taiwan has one of Asia’s freest media environments, but weak merger laws and economic dependence on the mainland have left its media market vulnerable to Beijing’s influence (Rawnsley and Feng Reference Rawnsley and Feng2014). Although PRC state media are prohibited from broadcasting in Taiwan, Beijing exploits its economic leverage to promote its media agenda and shape public discourse on the island. CT represents the most prominent case following its 2008 acquisition by Want Want holdings’ chairman Tsai Eng-meng, who retains substantial commercial interests in mainland China. Under Tsai’s ownership, CT comprises the China Times newspaper and two television networks, CTV and CTiTV, all affiliated with the PRC-led Belt and Road News Alliance.
Post-acquisition, CT underwent a marked editorial shift toward pro-Beijing positions. Media scholars and former employees report that the organization receives editorial directives from the PRC’s Taiwan Affairs Office (Hille Reference Hille2019). Journalists at the outlet are discouraged from covering politically sensitive topics such as human rights abuses (Hsu Reference Hsu2014). Investigations also reveal that CT receives financial subsidies from the PRC government (Kawase Reference Kawase2019) and publishes content sourced directly from PRC state media (Chang and Chen Reference Chang and Chen2015). Concerns about CT’s role as an instrument of PRC influence have sparked civil resistance (Ebsworth Reference Ebsworth2017), leading to its reputation as the most Beijing-aligned outlet among Taiwan’s major media (Lai, Peisakhin, and Sheen Reference Lai, Peisakhin and Sheen2024).Footnote 4 CT’s transformation exemplifies the PRC’s strategy of cultivating foreign outlets through economic enticements to extend the reach of pro-Beijing narratives to foreign audiences (Wu Reference Wu2020).
PRO-BEIJING MEDIA EFFECTS ON VOTERS
How effective is PRC-backed media in influencing voter behavior and attitudes? Political behavior research on the United States provides a useful starting point for developing hypotheses about CT’s impact. The political communication literature—largely based on studies of U.S. elections—suggests that voter persuasion during highly salient and competitive elections is inherently difficult. Voters tend to resist information that contradicts their political commitments, and preexisting partisan attachments often solidify electoral preferences well before new messages can influence them (Broockman and Kalla Reference Broockman and Kalla2023; Kalla and Broockman Reference Kalla and Broockman2018). Research on slanted media also indicates that audiences can rationally discount source bias (Chiang and Knight Reference Chiang and Knight2011) and become resistant to persuasion when they suspect underlying motives (Rhee, Crabtree, and Horiuchi Reference Rhee, Crabtree and Horiuchi2023; Spirig Reference Spirig2024). Any impact of this pro-Beijing outlet is likely also to be diluted by Taiwan’s pluralistic media landscape, where competing narratives are easily accessible (Guess et al. Reference Guess, Barberá, Munzert and Yang2021). One prediction, then, is that CT’s impact will be minimal, if not negligible.
This minimal-effects prediction rests on the presumption that the political context is dominated by entrenched partisanship—a condition that does not fully characterize Taiwan’s electorate. Theories of belief-based persuasion suggest that the strength of prior beliefs shapes how individuals respond to new messages (DellaVigna and Gentzkow Reference DellaVigna and Gentzkow2010). Electoral persuasion is most effective when voters harbor uncertainty, characteristic of those with weak partisan loyalties (Zaller Reference Zaller1992), or when confronting unfamiliar candidates (Broockman and Kalla Reference Broockman and Kalla2023). Prior studies also show that campaigns are more successful in contexts with larger shares of nonpartisans (Greene Reference Greene2011). Given Taiwan’s substantial nonpartisan population and the pronounced electoral uncertainty observed among PRC-friendly voters in the 2020 race, my first hypothesis is that, on average, exposure to CT shifts voters toward supporting the PRC-favored candidate and toward adopting more positive attitudes toward the PRC (H1).
This reasoning about the strength of prior beliefs also yields my second hypothesis: CT has a stronger influence on less politically attentive voters (H2). Voters discount new messaging relative to their existing stock of politically relevant information (Broockman and Kalla Reference Broockman and Kalla2023; Zaller Reference Zaller1992). Politically attentive voters retain substantial knowledge about candidates and policy issues, so additional information tends to have diminishing marginal effects on their preferences. By contrast, inattentive voters often lack firm preexisting beliefs and the knowledge to resist new messaging, leaving more room for external influence on their preferences. This pattern manifests across political regimes: highly informed citizens in authoritarian regimes show greater resistance to state propaganda (Stockmann and Gallagher Reference Stockmann and Gallagher2011); studies of U.S. elections similarly find that low-information voters demonstrate greater volatility in candidate preferences upon exposure to new information, while high-information voters remain relatively stable (Gelman and King Reference Gelman and King1993).Footnote 5
Beyond the strength of prior beliefs, their direction is also crucial in information processing. I expect CT to have differential effects on PRC-friendly and PRC-skeptical voters, a prediction grounded in motivated reasoning research, which suggests that individuals process politically charged information in biased ways to uphold their beliefs (Kunda Reference Kunda1990). When encountering congruent information, people view it as compelling and accept it with minimal scrutiny (prior attitude effect). By contrast, challenging information prompts people to counterargue and critically evaluate the content (disconfirmation bias), sometimes backfiring to reinforce the very beliefs it seeks to change (Redlawsk Reference Redlawsk2002; Taber and Lodge Reference Taber and Lodge2006). In addition to these cognitive pathways, backfire effects may also arise from psychological reactance—a defensive response in which people adopt opposing views when they perceive that new messaging threatens their autonomy (Brehm et al. Reference Brehm, Stires, Sensenig and Shaban1966).
Work in foreign electoral intervention provides similar insights, showing that voters are more tolerant of foreign influence when it benefits their preferred party than when it benefits the opposition (Tomz and Weeks Reference Tomz and Weeks2020). Such partisan double standards have been documented across political contexts and issues (Brutger, Chaudoin, and Kagan Reference Brutger, Chaudoin and Kagan2023; Bush and Prather Reference Bush and Prather2020). Even though CT faces suspicion as Beijing’s proxy for influencing Taiwan’s domestic politics, it may still receive greater acceptance among PRC-friendly voters than among PRC-skeptics because it advances their preferred outcomes. Building on these frameworks, I hypothesize that exposure to CT has positive effects among PRC-friendly voters but minimal or even backfire effects among PRC-skeptics (H3).Footnote 6
The theoretical predictions in H1–H3 rest on a crucial distinction: the difference between baseline and marginal support. Baseline support refers to the level of political preferences that emerge naturally from voters’ existing predispositions—the support that would appear absent any specific media intervention. Marginal support refers to the additional shift generated by targeted media exposure beyond these baseline tendencies. This distinction maps directly onto the different mechanisms through which CT affects voters with varying predispositions.
Among PRC-friendly voters, CT primarily activates baseline support by crystallizing latent predispositions that already exist but remain unexpressed. The substantial preelection uncertainty among these voters in 2020 offers significant potential for preference activation. In this case, CT mobilizes existing sympathies that constitute these voters’ natural baseline rather than persuading them to adopt fundamentally new preferences. For nonpartisans, CT exposure primarily generates marginal support through persuasion, creating new preferences beyond what their political characteristics would predict. These voters lack strong baseline predispositions in either direction, rendering them susceptible to attitude change through sustained exposure to CT’s one-sided coverage. For PRC-skeptics, I predict that CT will fail to convert them into choosing the PRC-favored candidate because its messaging works against their baseline support and should encounter significant resistance.
This baseline-marginal distinction carries important implications for understanding pro-Beijing media effects. Preference activation among PRC-friendly voters may appear electorally substantial but in fact represents a more limited form of influence than genuine persuasion or conversion (Greene Reference Greene2011). H1–H3 together suggest that CT’s impact operates primarily by mobilizing existing sympathizers and persuading uncommitted voters rather than by converting ideological opponents. Understanding whether CT activates latent supporters, persuades neutrals, or converts skeptics informs a broader assessment of authoritarian-backed media effectiveness in democratic societies.
EXPERIMENTAL DESIGN
During the 2020 Taiwanese general election, I conducted a field experiment that incentivized sustained consumption of CT’s news coverage. The experimental design, inspired by Gerber, Karlan, and Bergan (Reference Gerber, Karlan and Bergan2009) and Chen and Yang (Reference Chen and Yang2019), is illustrated in Figure 1. The study commenced with a baseline survey administered four weeks before the election. Participants—all voting-eligible Taiwanese adults—were recruited through an online panel commissioned by Qualtrics. I used a quota sample based on age, gender, and partisanship, collecting detailed information on individuals’ background characteristics. A total of 2,077 participants completed the baseline survey.
Overview of Experimental Design

Following the baseline survey, participants were assigned to experimental conditions using blocked randomization by partisanship (pan-blue/PRC-friendly, pan-green/PRC-skeptical, and nonpartisan). Within each block, participants were allocated as follows: 50% to the treatment group (access to a website featuring CT’s political news), 20% to the placebo group (access to a website featuring CT’s entertainment news), and 30% to the pure control group (descriptions of these websites are provided below). Participants who were current CT consumers were excluded from treatment assignment but were followed throughout the study as a benchmark for interpreting the results.Footnote 7
Each participant in the treatment and placebo groups received an initial email containing a personalized URL serving as the sole entry point to their assigned website. Participants had access to their assigned websites for the two weeks before the election. To encourage compliance, participants received daily reminders and were informed of a performance-based financial incentive: those who averaged 3 minutes of daily browsing through election day would receive an additional NT$150 (approximately US$5).Footnote 8 After the election, the website was deactivated and the endline survey was administered the following day. In total, 949 participants completed the endline survey (a recontact rate of 45.69%), with no significant differences in attrition rates across experimental conditions (p-value = 0.614). The 949 participants constitute the main sample for this study.
Table 1 presents summary statistics, t-tests for selective attrition, and ANOVA results assessing sample balance across experimental conditions. Overall, participants who completed both survey waves show no significant demographic differences from those who did not. Except for past voting behavior in 2016, background covariates remain balanced across conditions even after accounting for attrition. Section C.2 of the Supplementary Material further confirms the balance of baseline outcome scores across conditions. To evaluate potential attrition bias, I test whether interactions between background covariates and treatment assignment predict attrition. As shown in Section C.3 of the Supplementary Material, there is no evidence that experimental conditions induced differential sample selection based on observable characteristics among endline survey completers.
Summary Statistics, Attrition, and Balance Tests

Note: Column 1 reports the mean and standard deviation (in parentheses) of each characteristic for all participants who completed the baseline survey. Column 2 provides the same statistics for those who completed the endline survey. A t-test is conducted for each characteristic to assess whether baseline and endline participants differ, with p-values reported in column 3. Columns 4 through 7 show means for endline participants who are China Times readers, control group participants, placebo group participants, and treatment group participants, respectively. An ANOVA test is used to determine if the experimental groups differ significantly on each characteristic, with p-values reported in column 8.
Treatment Website
The treatment was a customized news website featuring CT’s real-time political coverage.Footnote 9 Throughout the study period, I updated the website daily, curating all news articles from CT’s front page and its cross-strait news section. News articles were organized chronologically, with each day’s coverage presented on a dedicated webpage. During the two-week incentivized period, the website housed 106 news articles across daily pages, with an average of 5.58 articles per day. Each article appeared in its complete, unaltered form exactly as published on CT’s official website, with original headlines, full texts, hashtags, and source attribution intact. Figure 2a provides an example of a news article displayed on the website.Footnote 10
Screenshots of Treatment Website

The website had a clean, user-friendly interface. When participants accessed their personalized URL, they were directed to a homepage (see Figure 2b for a screenshot from Election Day, the final day of incentivized exposure). Navigation used a calendar-based system with date buttons arranged chronologically across the study period. Selecting a date button took participants to that day’s curated news content. This design allowed participants to access the current day’s news as well as articles from previous dates. The placebo website featured CT’s pure entertainment news and functioned identically. Both websites were designed to be comparable in content length and structure, ensuring that any differences in participants’ responses were unlikely to result from website format.
What characterized CT’s political coverage during the exposure period? Section A.2 of the Supplementary Material documents the treatment news content, including full article texts, headlines, content analysis, and most-viewed articles. Analysis of the 106 news stories reveals that positive coverage centers on Han’s campaign and PRC-related topics, including the Belt and Road Initiative, One Country Two Systems policy, cross-strait relations, Xi Jinping’s New Year address, the China–Japan–South Korea Free Trade Agreement, and the partial restoration of stability in Hong Kong. Conversely, coverage takes a more negative tone when in discussion with President Tsai, her PRC-critical party, the Anti-Infiltration Act (regulating foreign hostile forces’ influence in Taiwan, implicitly targeting the PRC), Hong Kong protesters, and the Iran–U.S. conflict. As expected, the news content exhibited a clear pro-Beijing stance.
Treatment Compliance
I measure treatment compliance using Google Analytics for behavioral tracking. This approach utilizes personalized links assigned to each participant in the website conditions. Every link contained a unique identifier generated during baseline survey administration. By restricting website access to these personalized links, I could identify participants by the links they clicked and distinguish them from other traffic. Google Analytics logged entry timestamps, page navigation patterns, and browsing duration—all tied to participants’ unique IDs—enabling precise matching of browsing behavior to survey responses. This unobtrusive tracking approach required no browser extensions or software installations, though it also limited monitoring to browsing behavior within the experiment.
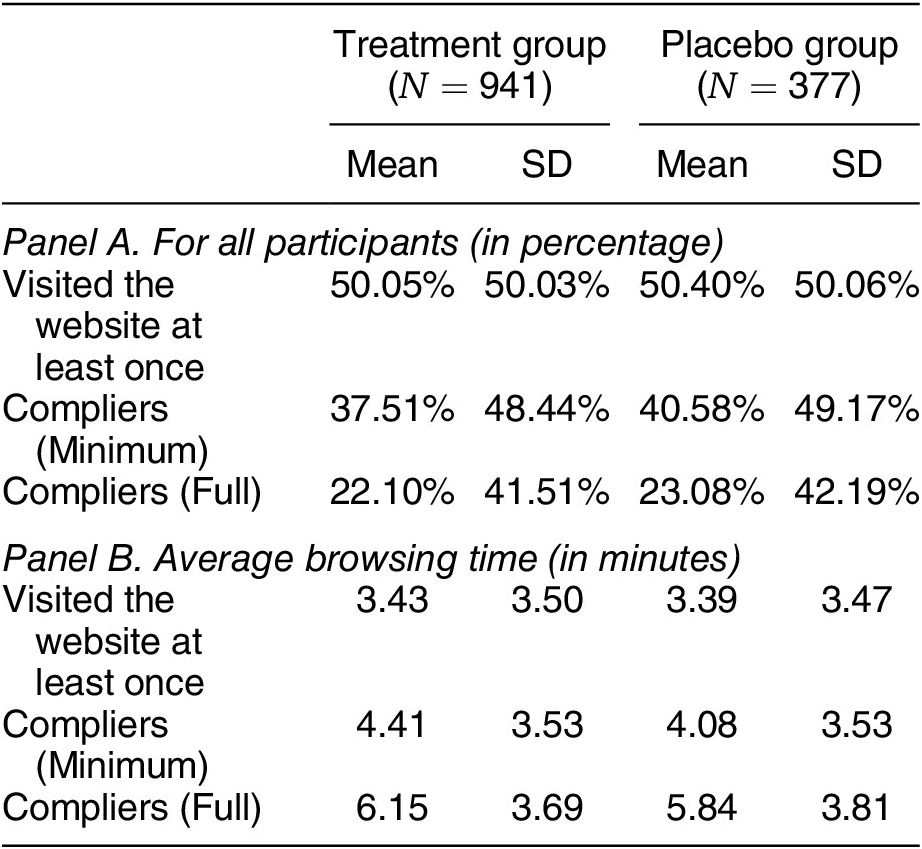
The web tracker shows that 50.05% of participants visited the site following the invitation email. Among these visitors, 93.33% returned to the site, 74.94% averaged at least 1 minute per day on it, and 44.16% averaged at least 3 minutes per day.Footnote 11 Notably, 88.5% of visitors completed the endline survey. Section A.3 of the Supplementary Material provides additional information on browsing behavior, including the distribution of average browsing times and visit patterns over time.
I employ a threshold-based method to define treatment compliance. Compliers are participants who spent an average of at least 3 minutes per day on the site during the incentivized period; noncompliers either did not visit the site or averaged fewer than 3 minutes. This threshold matches my original design, counting only those who met the prescribed browsing requirement as compliers. I also apply a less restrictive threshold of 1 minute in the analysis. For brevity, I refer to the 3-minute threshold as “full compliance” and the 1-minute threshold as “minimum compliance.”Footnote 12 This alternative threshold allows me to assess both sensitivity to varying compliance criteria and dose–response patterns—that is, whether treatment effects strengthen with increased exposure.
Table 2 reports the mean and standard deviation of browsing duration. Among participants who accessed the treatment site during the incentivized period, mean daily engagement was 3.43 minutes—already exceeding the prescribed 3-minute requirement. Engagement increased substantially among treated compliers: average daily browsing time rose to 4.14 minutes under the minimum compliance threshold and to 6.15 minutes under the full threshold. These figures indicate meaningful engagement with the treatment, with actual time spent considerably exceeding the required thresholds.Footnote 13
Browsing Behavior

Note: Panel A presents statistics for all participants in the treatment and placebo groups. Panel B reports the average browsing time of participants visiting assigned site. Under the minimum threshold, compliers are participants whose daily average browsing time is at least 1 minute. Under the full threshold, compliers are those who averaged at least 3 minutes daily.
Section A.4 of the Supplementary Material shows that compliance rates did not differ significantly across PRC-friendly, PRC-skeptical, and nonpartisan participants—a finding consistent with a growing body of research questioning the prevalence of online echo chambers (Garrett Reference Garrett2009; Guess Reference Guess2021; Levy Reference Levy2021) and satisfies the common support assumption necessary for testing effect heterogeneity. The comparable levels of engagement across partisan subgroups also suggest that observed effects are unlikely to be attributable to selective compliance.
Outcome Variables
The primary outcome variables were preregistered and measured in both the baseline and endline surveys. I examine three outcomes to assess CT’s effects on voter behavior and attitudes.
Vote Choices
Participants were asked which candidate they intended to vote for in the baseline survey and which candidate they ultimately voted for in the endline survey. At baseline, this variable was coded as 1 for Han and 0 for all other responses (e.g., Tsai or undecided). The same coding was used for the endline survey. The “Vote for Han” outcome variable is the difference between endline and baseline responses, capturing shifts in electoral support for Han.
Candidate Evaluations
In both waves, participants rated each presidential candidate on a scale from 1 (very unfavorable) to 10 (very favorable). I calculated relative favorability by subtracting Han’s rating from Tsai’s, such that higher values indicate more favorable views of Han. The Candidate Evaluation variable, ranging from –18 to 18, captures the change in relative favorability from baseline to endline, with positive values reflecting increased favorability toward Han.
Opinions about the PRC
Attitudes toward the PRC were measured in both waves with eight items covering general favorability, perceptions of PRC’s economic growth, military threat, and international standing, as well as views on cross-strait trade relations and the Hong Kong protests.Footnote 14 To address multiple comparisons, I constructed a composite index by averaging responses to these eight items (alpha = 0.80 at baseline, 0.81 at endline), with higher values indicating more favorable views of the PRC. The “Pro-PRC Index” captures the change in index scores from baseline to endline, where positive values indicate improved attitudes toward the PRC.
Section K of the Supplementary Material contains the exact wording of these measures; descriptive statistics appear in Section C.1 of the Supplementary Material.
Ethics
This study was approved by the IRB at the University of Texas at Austin (Protocol No. 20191221AA) and follows the APSA’s Principles and Guidance for Human Subjects Research (American Political Science Association 2020). I address four key dimensions emphasized in the Principles here.
Informed Consent
Participants were recruited through Qualtrics, which compensated them for participation. Before the baseline survey, they were told that the study’s purpose was to gauge their opinions on sociopolitical issues and the 2020 election, that participation was voluntary, and that they could withdraw at any time without penalty (see Section D.1 of the Supplementary Material for consent scripts). Participants assigned to website conditions received daily emails with a personalized link to the assigned site and were told they would receive a modest financial bonus if they met the browsing requirement (see experimental design above). This ensured that participants understood the nature of their involvement and the conditions for additional compensation before providing consenting. Crucially, participants retained full autonomy over their treatment uptake and broader media diet throughout the study. They could freely continue accessing their preferred information sources outside the experiment. They could also stop browsing or exit the website at any point.Footnote 15
Absence of Deception
The study involved no deception or fabricated content. Participants were shown genuine news articles from CT, a legal and widely circulated outlet in Taiwan. All treatment content had already been publicly disseminated on CT’s official website and other mainstream platforms. Treatment articles appeared in their original form, with visible source attribution to CT and without alteration, fabrication, or omission of information.
Minimal Risk
The treatment content contained nothing banned or censored under Taiwanese law and resembled what participants might ordinarily encounter in everyday life. The moderate exposure requirement—3 minutes per day for two weeks—also limited the potential for effects lasting beyond typical media consumption.Footnote 16 All survey and web-traffic data were collected anonymously via encrypted platforms (Qualtrics and Google Analytics); no personally identifiable information was recorded. Browsing behavior was linked to survey responses only through numeric IDs, not IP addresses or other identifying data.
Field experiments during elections certainly raise specific ethical concerns because interventions could alter electoral outcomes. Several safeguards were built into the study design. Before launching the study, preelection polling indicated that the 2020 race would not be close, and the subsequent landslide victory for the DPP incumbent validated my ex-ante assessment of minimal societal risk (see Section D.2 of the Supplementary Material). Also, the study’s scale was insufficient to meaningfully affect electoral outcomes. I also find no evidence that the treatment reduced turnout (see Section J of the Supplementary Material), which addresses concerns that exposure to authoritarian-backed media might erode democratic trust and thereby demobilize voters.
Societal Impact
The study advances scholarly and public understanding of whether authoritarian-backed media can sway voters in democracies, an issue of growing policy relevance worldwide. Given the increasing prevalence of—and public concern about—PRC influence operations (United States Department of State 2023), rigorous evidence on the effectiveness of media co-optation by authoritarian regimes is urgently needed. These societal benefits outweigh the minimal risks to participants, especially given both the voluntary nature of participation and the study’s minimal potential to affect the 2020 election outcome
Estimation Procedures
The primary estimands are the intent-to-treat (ITT) and treatment-on-the-treated (TOT) effects. The ITT analysis estimates treatment effects on participants assigned to the treatment website, while the TOT analysis estimates effects for participants who sufficiently engaged with the treatment website (i.e., treatment compliers). For ITT effects, I use ordinary least squares regression with HC2 robust standard errors to estimate the impact of treatment assignment on outcomes, which provides a general measure of treatment effects regardless of compliance. For TOT effects, I use a two-stage least squares approach, using treatment assignment as an instrumental variable for compliance, to estimate treatment effects among participants meeting compliance criteria.
To investigate effect heterogeneity, I estimate treatment effects within specific subgroups defined by participants’ characteristics, such as political attentiveness (H2) and political predispositions (H3). This involves regressing outcome variables on treatment separately for each subgroup.Footnote 17
Three methodological decisions merit mention. First, following my preregistration, I analyze outcomes as change scores rather than endline values. Second, as preregistered, I pool the control and placebo groups to increase statistical power. Section C.4 of the Supplementary Material confirms that the placebo and control groups are indistinguishable across outcomes.Footnote 18 Third, as a robustness check, I report p-values adjusted for multiple testing using both Bonferroni and false discovery rate corrections in Section I.4 of the Supplementary Material.
RESULTS
I begin by presenting the means and distributions of outcomes across experimental conditions. Figure 3 shows that while control and placebo groups display virtually identical outcome scores, the treatment group diverges significantly. For vote choices, the probability of shifting electoral support toward Han between survey waves increases by 7.7 percentage points in the control group and 8.7 percentage points in the placebo group. In contrast, the treatment group shows a considerably larger increase of 20.3 percentage points, roughly doubling the likelihood of shifting support. This pattern extends to candidate evaluations and PRC-related attitudes. Whereas participants in control and placebo groups exhibit no discernible attitudinal shifts at endline, those in the treatment group display significantly more positive evaluations of Han and more favorable attitudes toward the PRC.
Mean Outcome Scores across Experimental Conditions
Note: The figure reports the mean scores for shift in electoral support for Han ( $ N=738 $
), candidate evaluations in favor of Han (
$ N=738 $
), candidate evaluations in favor of Han ( $ N=861 $
), and views on the PRC (
$ N=861 $
), and views on the PRC ( $ N=861 $
) across experimental conditions. Each jittered dot represents one participant; bars show 95% confidence intervals for each group mean.
$ N=861 $
) across experimental conditions. Each jittered dot represents one participant; bars show 95% confidence intervals for each group mean.

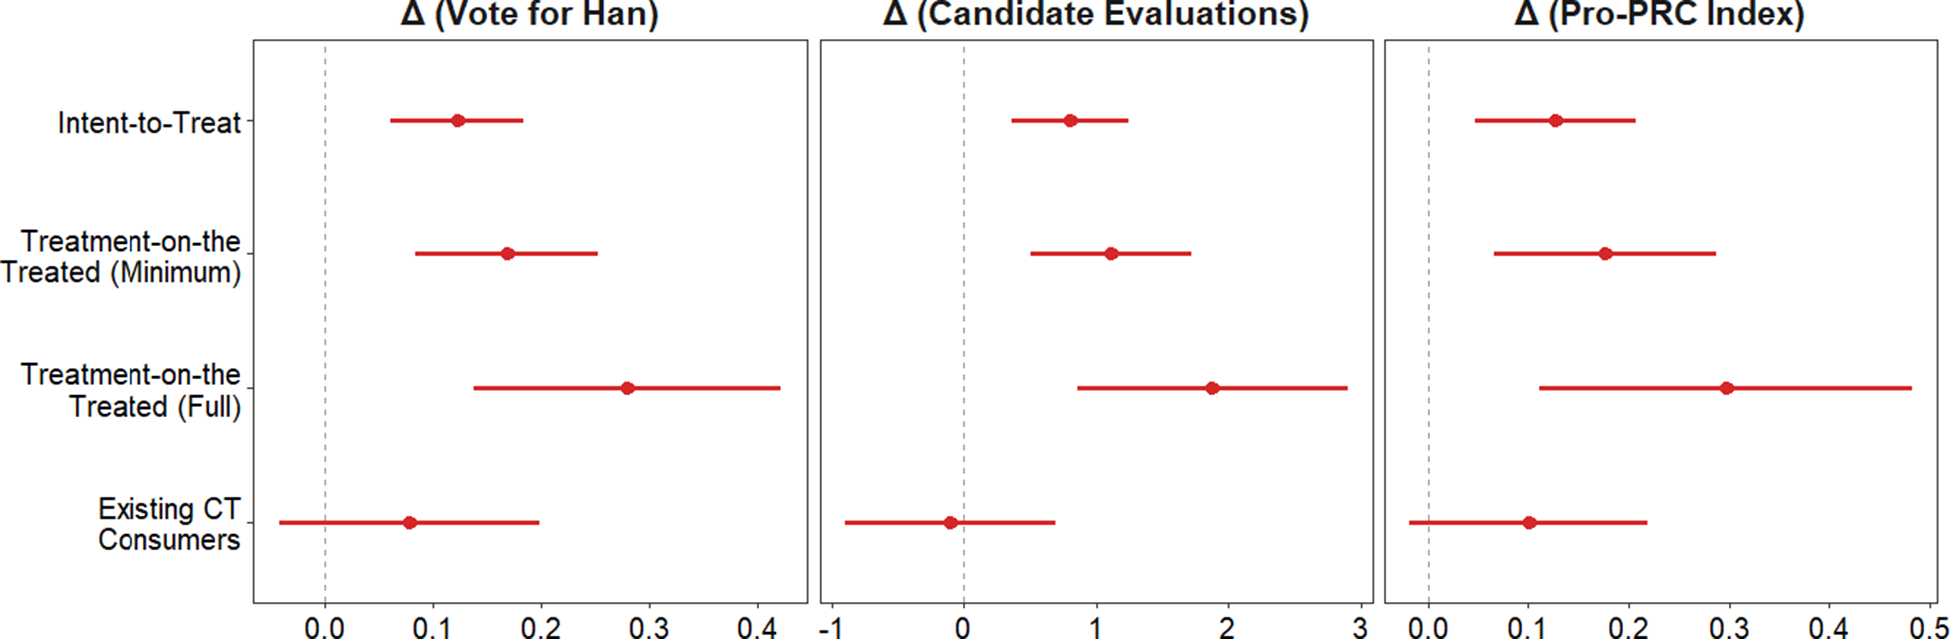
I now turn to the ITT and TOT effects estimated in a regression framework. Figure 4 reports four estimates for each outcome. The first is the ITT effect, representing the average effect of treatment assignment. The next two are TOT effects under different compliance thresholds, capturing the average effect among treated compliers. The final estimate shows mean outcome scores for nonexperimental participants (i.e., CT’s existing consumers). Tabular results can be found in Section E of the Supplementary Material. Replication materials are available in Kao (Reference Kao2026).
Intent-to-Treat and Treatment-on-the-Treated Effects
Note: This figure shows estimates of ITT and TOT effects on vote choices, candidate evaluations, and views on the PRC, with 95% confidence intervals. ITT is the effect on those assigned to the treatment, and TOT is the effect on treated compliers. Existing consumers are nonexperimental participants who self-identified as regular CT viewers, whose estimates are the difference between baseline and endline outcome scores. Tabular results appear in Section E of the Supplementary Material. Bounded treatment effects, covariate-adjusted results, and p-values adjusted for multiple comparisons are in Section I of the Supplementary Material.

Improved Electoral Support for the PRC-Favored Candidate
Treatment group participants show a significantly higher probability of voting for Han on Election Day than control group participants. For Vote for Han (sample mean = 14.5%), the ITT effect is 12.2 percentage points (95% CI = [6.0, 18.3]), representing a 0.28 standard deviation difference between conditions. Findings on candidate evaluations mirror those on vote choice; treatment group participants show greater increases in Han’s relative favorability than control group participants at endline. The ITT effect for Candidate Evaluations (sample mean = 0.057) is 0.81 points on the −18 to +18 scale (95% CI = [0.36, 1.24]), representing a 0.24 standard deviation difference between conditions.
The TOT estimates show more pronounced treatment effects among compliers. Comparing TOT estimates under different thresholds further suggests that greater engagement with the treatment produces stronger effects, which is consistent with a dose–response relationship. Although this pattern requires cautious interpretation due to self-selection (participants chose their engagement levels), it strengthens the plausibility of the observed effects. As a falsification test, I examine effects on electoral support for James Soong, a third-party candidate who received minimal CT coverage. The analysis finds no evidence that treatment sways support for Soong (see Section I.2 of the Supplementary Material). Together, these findings suggest that sustained exposure to CT’s political news significantly affects voter preferences in the 2020 election.
Among existing CT viewers, candidate evaluations do not change between survey waves, but they show increased inclination to vote for Han, though the coefficient appears smaller than the ITT estimate. These nonexperimental results, however, necessitate cautious interpretation.
More Favorable toward the PRC
CT’s effect extends beyond electoral preferences to attitudes toward the PRC. Treatment group participants develop more favorable views of the PRC than control group participants after the exposure period. The ITT effect for Pro-PRC Index (sample mean = 0.09) is 0.127 index points (95% CI = [0.04, 0.20])—a 0.21 standard deviation difference. Differences between TOT and ITT estimates, and across TOT estimates under different thresholds, also suggest a dose–response relationship. CT’s existing consumers similarly show increased approval of the PRC, though the effect is more modest and not statistically significant at conventional levels. This attenuated response among habitual CT viewers may reflect diminishing returns to media exposure among those already holding Beijing-leaning views and saturated by CT’s messaging.
Results reported in Section F of the Supplementary Material for individual items constructing the PRC index reveal that exposure to CT: (i) enhances general attitudes toward the PRC, (ii) diminishes perceptions of the PRC as a threat, (iii) strengthens support for expanded trade with the PRC, and (iv) cultivates skepticism regarding the legitimacy of the Hong Kong Protests. The same exposure does not affect perceptions of the PRC’s international standing, such as views on Xi’s leadership in world affairs or expectations of the PRC surpassing the United States as a global superpower.
Bounded Effects
I have shown that attrition rates do not differ significantly across experimental conditions, but participants who engaged more with the treatment (i.e., compliers) were more likely to complete the endline survey. This pattern could have inflated treatment effects if participants who remained in the study were also more persuadable. Section I.1 of the Supplementary Material reports bounded treatment effects by assuming that attriters were unaffected by the treatment. The bounded estimates remain positive and statistically significant, though smaller in magnitude, as expected.
Effect Heterogeneity
Stronger Effects for Politically Inattentive Voters
To test whether baseline political attentiveness moderates treatment effects (H2), I estimate conditional effects. Political attentiveness was measured in the baseline survey by having participants report how much they followed and cared about this election on a five-point scale (1 = not at all; 5 = very much). I interact this pretreatment covariate with treatment assignment to estimate conditional ITT effects for each outcome. Figure 5 presents the results.
Treatment Effects by Political Attentiveness
Note: ITT effects by individuals’ pre-treatment political attentiveness, measured by how much they followed and cared about the 2020 election, ranging from 1 (not at all) to 5 (very much). The effects are estimated and plotted using the R package interflex. Tabular results are shown in Section E of the Supplementary Material.

Consistent with H2, participants with lower political engagement before the experiment exhibit significantly greater preference shifts in response to treatment, whereas effects attenuate considerably among attentive participants. This pattern holds across alternative measures of political attentiveness, such as interest in election campaigns and consumption of election-related news (see Section K of the Supplementary Material for item wording). The robustness of these results across multiple measures provides compelling evidence that participants with limited repositories of politically relevant information are more susceptible to PRC-backed media influence.
Partisan Effect Heterogeneity
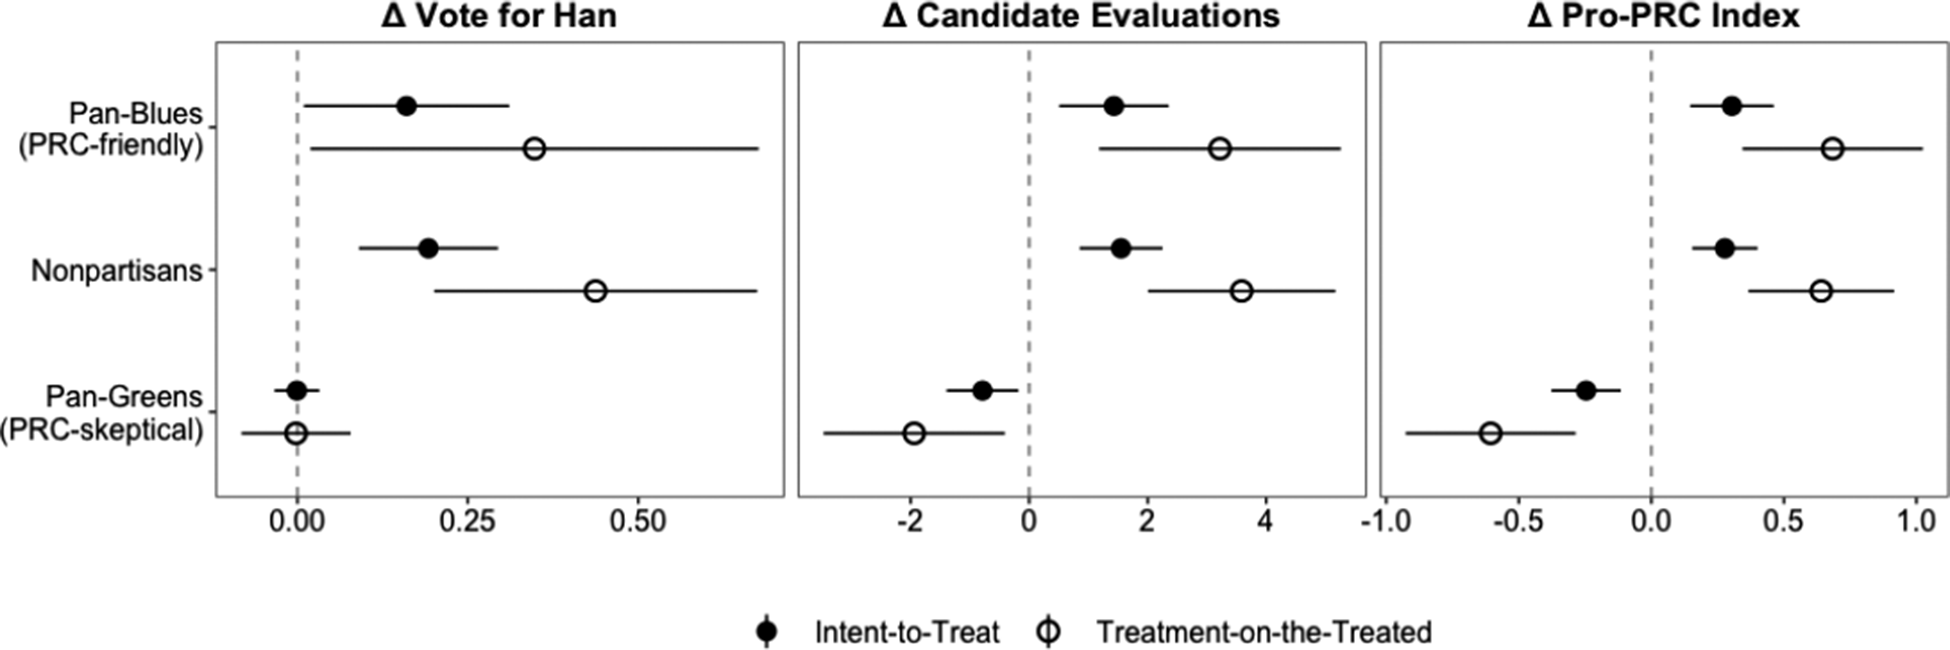
I also examine whether treatment effects vary by political predisposition (H3). Figure 6 presents ITT and TOT estimates for PRC-friendly, PRC-skeptical, and nonpartisan participants. Results show meaningful effect heterogeneity across subgroups. Treatment produces a positive effect among PRC-friendly participants, increasing support for Han and improving attitudes toward the PRC. Similar effects appear among nonpartisan participants, with some evidence that effects are somewhat larger for nonpartisans than for PRC-friendly participants. In contrast, CT fails to convert PRC-skeptical participants to support Han (a precise null). Notably, among PRC-skeptical participants, the evidence suggests backfire effects—treatment reduces favorability toward Han and worsens attitudes toward the PRC. TOT estimates suggest that backlash appears stronger among PRC-skeptical participants who spent more time on the treatment site.
Treatment Effects by Political Predispositions
Note: ITT and TOT effects with 95% confidence intervals for each partisan subgroup, including pan-blue (PRC-friendly), pan-green (PRC-skeptical), and nonpartisan participants. The TOT effect is estimated using the full compliance threshold. Tabular results are shown in Section E of the Supplementary Material.

I conduct exploratory analyses to understand why PRC-friendly and PRC-skeptical participants respond to the same treatment content differently. I examine four potential mechanisms: motivated reasoning, psychological reactance, candidate unconventionality, and selective tolerance of foreign influence. Information processing research indicates that individuals view arguments consistent with priors as stronger and more compelling (prior attitude effect) while subjecting inconsistent arguments to heightened scrutiny (disconfirmation bias). Exposure to identical information may therefore polarize people with opposing priors (Kunda Reference Kunda1990; Taber and Lodge Reference Taber and Lodge2006). Section G.1 of the Supplementary Material provides evidence supporting the prior attitude effect but not disconfirmation bias, along with suggestive evidence that backfire effects among PRC-skeptics may stem from psychological reactance—a defensive response triggered when people perceive that content, such as CT’s slanted news reports, threatens their freedom of thought or action.
On candidate unconventionality, the baseline survey reveals striking electoral uncertainty among PRC-friendly participants in the election, likely resulting from the KMT’s nomination of Han. Despite their strong political priors, PRC-friendly participants show remarkable indecision even one month before the election—undecided at 2.32 times the rate of PRC-skeptical participants. Among participants who voted for the KMT in 2012, a total of 35% remain undecided at baseline, with only 37.7% commit to Han. In contrast, 2012 DPP voters show much greater certainty in the baseline: only 15.8% are undecided and 75.4% already support Tsai.Footnote 19 A more conventional KMT nominee would likely have reduced CT’s influence, particularly on PRC-friendly voters.
Regarding selective tolerance, PRC-friendly voters may tolerate CT despite its suspected role as Beijing’s proxy because its coverage favors their preferred candidate (Tomz and Weeks Reference Tomz and Weeks2020). Conversely, PRC-skeptical voters likely approach CT with heightened skepticism about its motives, rendering them more resistant to its content (Rhee, Crabtree, and Horiuchi Reference Rhee, Crabtree and Horiuchi2023). Endline survey responses support this mechanism: within the treatment group, PRC-friendly participants are much less likely than PRC-skeptical ones to categorize CT as “red media”—a colloquial term in Taiwan for outlets allegedly influenced by Beijing (see Section G.3 of the Supplementary Material).
Magnitude of the Effects
I contextualize effect magnitudes in two ways. I first compute persuasion rate (DellaVigna and Kaplan Reference DellaVigna and Kaplan2007), which measures the percentage of participants who switched to supporting Han after treatment. Under the minimum compliance threshold, the estimated persuasion rate is 15.9%, which generally exceeds several benchmark figures from seminal research on media’s electoral effects in the United States: Fox News exposure induces 11.6% of non-Republican viewers to vote Republican (DellaVigna and Kaplan Reference DellaVigna and Kaplan2007); newspaper endorsements shift 2%–6% of voting intentions toward endorsed candidates (Chiang and Knight Reference Chiang and Knight2011); and reading the Washington Post persuades 20% of readers to support Democratic gubernatorial candidates (Gerber, Karlan, and Bergan Reference Gerber, Karlan and Bergan2009). The estimated rate, however, is considerably lower than rates found in authoritarian regimes. For example, exposure to uncensored New York Times content persuades 40.1% of Chinese students with initially censored views (Chen and Yang Reference Chen and Yang2019), and viewing an opposition TV channel in Russia yields a 66% persuasion rate for opposition party support (Enikolopov, Petrova, and Zhuravskaya Reference Enikolopov, Petrova and Zhuravskaya2011).
The moderate persuasion rate observed in this study likely reflects Taiwan’s political landscape. Taiwan has an open media ecosystem with uncensored Beijing-leaning voices (unlike controlled information environments in authoritarian regimes). At the same time, partisan identities there are more fluid than in developed democracies like the United States. This combination makes media persuasion more likely than in established democracies with entrenched partisan divisions, yet more constrained than in autocracies with restricted information access.
I also offer a back-of-the-envelope estimate of Han’s counterfactual vote share without CT’s official website. Because my experimental design targets non-CT existing consumers, treatment effects approximate CT’s impact on people inadvertently exposed to its content. To estimate the size of this population, I draw on SimilarWeb traffic data from December 2024 to February 2025 (the period for which I have access to these data).Footnote 20 CT’s official website averaged 28.25 million monthly visits during this period, with 14.48% of traffic coming from external referrals (e.g., news portals) and social media (e.g., Facebook)—channels likely to produce incidental exposure. By contrast, 85.52% came from direct URL entries and organic search—more indicative of habitual viewers. Under the assumption of the occurrence of a similar traffic pattern, this translates to an estimated 2.05 million people (28.25 million/2 × 0.1448) who may have incidentally encountered CT news online during the two-week incentivized period. Applying the observed effect on vote choices (f= 15.9, the persuasion rate) to this incidentally exposed group and adjusting for turnout (74.9%) yields an estimated 244,137 additional votes attributable to CT exposure (2.05M × 0.749 × 0.159). Han’s vote share was 38.6%. These estimates suggest that without CT’s website, his share would have been 1.7 percentage points lower—36.9%.Footnote 21
Alternative Explanations
One alternative explanation for the results is that they reflect source cues rather than content. Treatment articles include source attribution, enabling participants to recognize CT as the publisher. This could have prompted preference shifts based on source alone, independent of pro-Beijing news content. To assess this, I use the placebo group, which saw entertainment news with identical source attribution. Outcome differences between treatment and placebo groups would indicate that source alone cannot account for the effects. Results in Section H.1 of the Supplementary Material show that the effects estimated by comparing treatment and placebo groups remain robust.
A second alternative explanation is that treatment may have prompted participants to seek Beijing-leaning news from other sources. If so, the observed effects could stem from broader pro-Beijing media consumption rather than the treatment itself. Although I lack data on participants’ external news consumption, both survey waves measured self-reported media diet. If treated participants had substantially increased their consumption of pro-Beijing news from other outlets, we would expect higher overall news consumption among them. Results in Section H.2 of the Supplementary Material show no significant difference in changes to overall news consumption between treatment and control groups, providing no support for this explanation.Footnote 22
A third alternative is that findings may reflect demand effects—cues that suggest expected behavior to participants. After receiving daily reminders, participants may have inferred the study’s intent and provided CT-favored responses in the endline survey. If demand effects were operating, we would expect uniform shifts aligned with CT’s pro-Beijing stance. However, treatment produces negative effects on attitudes toward Han and the PRC among PRC-skeptical participants. Had the effects been driven by experimenter demand, one would not have observed backfire effects.
A broader concern is that participants may not have truthfully reported their vote choices. I embedded a list experiment in the endline survey to assess whether participants generally concealed their true choices (see Section H.3 of the Supplementary Material for details). Results indicate no evidence of systematic misreporting, alleviating concerns that participants simply provided CT-favored answers at endline. In addition, a subgroup analysis of PRC-friendly participants, those most likely to misreport given the election outcome (Wright Reference Wright1993), also finds no evidence of dishonesty.
DISCUSSION AND CONCLUSION
The PRC has invested heavily in influencing foreign media content and platforms to amplify its preferred narratives globally (United States Department of State 2023). The impact of PRC-backed media on voters in democratic regimes, however, remains poorly understood. This study uses a randomized field experiment during a real-time general election in Taiwan, a focal point of PRC influence efforts, to assess whether and how a leading PRC-backed outlet sways voter preferences. The findings are compelling: repeated exposure to CT’s political coverage significantly increases support for the PRC-favored candidate and improves attitudes toward the PRC—though effects appear primarily among nonpartisan and PRC-friendly voters, not PRC-skeptics.
Two plausible factors may explain CT’s rapid and substantial impact. The first one lies in Taiwan’s electoral dynamics. The 2020 election featured considerable voter uncertainty due to Han’s unconventional KMT candidacy, creating fertile ground for CT’s influence. Baseline survey data show significant electoral indecision, with 39.6% of participants undecided one month before the election. Section G.2 of the Supplementary Material reports that this uncertainty is particularly pronounced among nonpartisans (comprising 40% of the electorate) and PRC-friendly voters. Contemporaneous survey data from the Taiwan Public Opinion Foundation, a nonpartisan research organization, replicates this pattern.Footnote 23 These dynamics create conditions in which sustained exposure to CT news can exert rapid effects when undecided voters actively crystallize their decisions before the election. Note that this hesitancy among PRC-friendly voters is not unique to 2020; similar patterns reoccurred in the 2024 general election.Footnote 24
A second factor involves the cumulative persuasive power of repeated exposure. Unlike studies on persuasion and biased media that rely on single-shot treatment exposure, this study exposes participants to CT content repeatedly over weeks. Political communication research suggests that repeated exposure enhances message retention and influence (Chong and Druckman Reference Chong and Druckman2007). Prior experimental studies using comparable multi-week exposure protocols also find meaningful effects on attitudes and behavior (Bail et al. Reference Bail, Argyle, Brown, Bumpus, Haohan Chen, Hunzaker and Lee2018; Gerber and Green Reference Gerber and Green2012; Panagopoulos and Green Reference Panagopoulos and Green2008; Searles et al. Reference Searles, Darr, Sui, Kalmoe, Pingree and Watson2022). I also discover stronger effects with greater exposure. Admittedly, this dose–response relationship warrants further investigation—ideally randomizing exposure duration to analyze whether stronger effects are causally attributable to higher dosage. Such a design would provide more conclusive evidence on the relationship between exposure intensity and effect size.
This study contributes to the growing literature on authoritarian media operations. Most research on Russian and PRC transnational media initiatives examines overt state-owned platforms and largely identifies limited impact, with Mattingly et al. (Reference Mattingly, Incerti, Changwook, Moreshead, Tanaka and Yamagishi2025) as a notable exception. My findings suggest that covert strategies such as media co-optation may be more effective at swaying foreign citizens than overt approaches. The evidence suggests that Beijing can cultivate foreign outlets not only to disseminate preferred narratives but also to advance political objectives abroad. This approach appears most effective where large populations have fluid political loyalties, as in many emerging democracies, or where citizens view the PRC neutrally or positively, as in several developing countries.
This study also advances understanding of media persuasion. Prevailing theories hold that slanted media have limited impact because voters tend to: (i) avoid sources conflicting with their views, (ii) correct biased content when encountered, and (iii) resist persuasion when doubting the source’s motives. My findings complicate such views. Both PRC-friendly and PRC-skeptical participants in this study engage with CT’s political content at similar rates, suggesting that people do not always avoid opposing viewpoints in the run-up to elections. More importantly, treatment influences average voters despite CT’s obvious bias, questionable PRC ties, and available alternative sources.
At the same time, my findings align with several established theoretical frameworks. CT’s strong effects on nonpartisans accord with belief-based persuasion theories, which posit that political messaging is most effective among people lacking firm partisan attachments or paying less attention to politics. Results also reinforce the notion that persuasion is more successful where undecided or nonpartisan voters are more prevalent. Moreover, because the experimental design labels all treatment articles as from CT, my findings align with research showing that people adjust their views even when aware of bias (e.g., Fisher Reference Fisher2020; Peisakhin and Rozenas Reference Peisakhin and Rozenas2018). This study thus contributes evidence to debates over whether recognizing bias leads people to correct for it.Footnote 25
Several scope conditions bear on interpretation of my findings. First, the experimental sample excludes regular CT consumers, which may limit the findings to individuals outside the outlet’s typical audience. Results may differ for habitual viewers. Although the experiment did not force participants to read CT content, it may have promoted exposure to material they would not otherwise seek. Still, the treatment reflects real-world incidental exposure, such as encountering CT content through social media or news aggregators. Recent research shows that incidental exposure is common in digital news consumption and can shape political learning (Lee and Kim Reference Lee and Kim2017; Müller and Schulz Reference Müller and Schulz2021).
Second, Taiwan’s unique geopolitical relationship with the PRC may shape the observed outcomes. Cross-strait relations dominate Taiwan’s electoral politics, elevating the salience of China as an issue. The electoral impact of pro-Beijing media may be much weaker where PRC-related issues are less central to public debate. Conversely, Taiwan may be a least-likely case for pro-Beijing media influence, given widespread awareness of Beijing’s interference. Such vigilance likely heightens skepticism toward foreign-sponsored outlets. In this view, authoritarian-backed outlets are more effective where citizens are less aware of or concerned about foreign influence operations.
Third, my findings may be particularly relevant in elections with large shares of nonpartisans. Where political preferences are more entrenched, authoritarian-backed media influence is likely reduced. Further research could assess the generalizability of these results across comparable political environments. Fourth, the dynamics of Taiwan’s 2020 election may be an important contextual factor. The KMT’s unconventional nominee generated high voter uncertainty, even among its traditional base. My findings may not extend to elections with more conventional candidates. These scope conditions highlight opportunities for research on authoritarian-backed outlets beyond this study. Future work could examine media co-optation effectiveness across diverse electoral settings and populations.
Limitations of this study should also be noted. Although this study intends to create a naturalistic media consumption experience by giving participants autonomy over their engagement with the intervention, this design inevitably bundles multiple treatment components. Comparing treatment and placebo groups mitigates the concern that daily reminders or source cues drive the results, but does not isolate which specific stories contribute to effects. Future research could disentangle these components to isolate content-specific effects.
This study also lacks granular data on browsing behavior. Although results suggest meaningful engagement, participants likely varied in reading patterns, perhaps examining some articles thoroughly while scanning others, or focusing selectively on personally relevant topics. Future research could explore how varied engagement patterns affect the results.Footnote 26 Relatedly, while this study endeavors to uphold unobtrusiveness by avoiding tracker installation requirements, this design limits insights into external browsing behavior, making it impossible to rule out certain alternative explanations. Finally, this study does not assess the persistence of effects over time. Although the primary focus is on election day behavior, examining the durability of CT’s effects on non-electoral outcomes, such as attitudes toward the PRC, remains an important avenue for future research.
The findings offer critical policy implications by demonstrating that authoritarian regimes can leverage domestic outlets in democracies to sway electoral preferences and public opinion abroad. Particularly concerning is the potential for foreign interventions to amplify polarization in targeted countries, which could undermine social cohesion and democratic stability (Corstange and Marinov Reference Corstange and Marinov2012; Tomz and Weeks Reference Tomz and Weeks2020). The Taiwan National Communication Commission’s decision to terminate CTiTV’s broadcast license in November 2020, 10 months after the election, likely reflects such concerns. Yet my findings highlighting the role of recipient priors in shaping CT’s impact suggest that PRC influence operations may face growing challenges globally as international opinion of the PRC has declined across many countries.
SUPPLEMENTARY MATERIAL
To view supplementary material for this article, please visit https://doi.org/10.1017/S0003055426101476.
DATA AVAILABILITY STATEMENT
Research documentation and data that support the findings of this study are openly available at the American Political Science Review Dataverse: https://doi.org/10.7910/DVN/M5M7SR.
ACKNOWLEDGEMENTS
I am grateful to Bethany Albertson, Ross Buchanan, Dan Chen, Charles Crabtree, David Doherty, Mike Findley, Noel Foster, John Gerring, Kenneth Greene, Ji Yeon Hong, Haifeng Huang, Joshua Kertzer, Tse-min Lin, Xiaobo Lü, Daniel Mattingly, Hans Tung, Austin Wang, Christopher Wlezien, Eric Chen-hua Yu, and Yuner Zhu for their valuable feedback on this study. I am deeply indebted to the Editors and anonymous Reviewers for their insightful comments. I also thank seminar and conference participants at Academia Sinica, the APSA Annual Meeting, Harvard University, Hong Kong University of Science and Technology, National Cheng Kung University, and UT Austin for helpful suggestions. All remaining errors are my own.
FUNDING STATEMENT
This research was supported by the Chiang Ching-Kuo Foundation and by the Global Research Fellowship and the Julian Suez Fellowship at the University of Texas at Austin.
CONFLICT OF INTEREST
The author declares no ethical issues or conflicts of interest in this research.
ETHICAL STANDARDS
The author declares that the human subjects research in this article was reviewed and approved by the University of Texas at Austin and certificate numbers are provided in the text. The author affirms that this article adheres to the principles concerning research with human participants laid out in APSA’s Principles and Guidance on Human Subject Research (2020).







 Open access


Comments
No Comments have been published for this article.