Non-alcoholic fatty liver disease (NAFLD) is an emerging public health problem and affects approximately 30 % of the global adult population(Reference Povsic, Wong and Perry1,Reference Younossi2) . Individuals with NAFLD have an increased risk of progression to non-alcoholic steatohepatitis, cirrhosis and hepatocellular carcinoma(Reference Younossi2,Reference Takahashi and Fukusato3) . Moreover, NAFLD is a major risk factor for CVD, type 2 diabetes and chronic kidney disease(Reference Danford and Lai4). Therefore, it is necessary to identify potentially modifiable factors to curb the increasing prevalence of NAFLD.
Honey is a natural sweet substance produced by honeybees from nectars of flowers, living plant secretions or excretions of plant-sucking insects on the living plants(Reference Alvarez-Suarez, Gasparrini and Forbes-Hernandez5). In China, honey is widely consumed as a food not only due to its unique taste and flavour but also due to a general understanding that it is a healthy food(Reference Zhang, Lu and Tian6). Honey contains polyphenol compounds, minerals, numerous vitamins, antioxidant enzymes and proteins(Reference Alvarez-Suarez, Gasparrini and Forbes-Hernandez5,Reference Ajibola, Chamunorwa and Erlwanger7) . Previous literature has documented that honey intake could protect against the metabolic syndrome by exerting anti-obesity, antidiabetic, hypolipidaemic and hypotensive activities(Reference Ramli, Chin and Zarkasi8). A growing body of evidence also has shown that honey owns antioxidative and anti-inflammatory effects(Reference Badolato, Carullo and Cione9,Reference Al-Waili, Salom and Al-Ghamdi10) , both of which play an important role in the development of NAFLD(Reference Gao and Tsukamoto11,Reference Polimeni, Del Ben and Baratta12) . In addition, several randomised clinical trials suggest that honey intake could ameliorate insulin resistance, thereby preventing NAFLD(Reference Abdulrhman, El-Hefnawy and Aly13,Reference Nazir, Samad and Haroon14) . Moreover, animal studies demonstrated that honey supplementation might reverse the formation of hepatic steatosis(Reference Samat, Kanyan Enchang and Nor Hussein15). Despite these potential health benefits, honey is rich in fructose and glucose(Reference Kamal and Klein16); high fructose intake has been suggested to be a key factor that induces NAFLD(Reference Jensen, Abdelmalek and Sullivan17,Reference Vos and Lavine18) . Therefore, we hypothesised that honey intake might have a dual role in the development of NAFLD.
To our knowledge, studies have not examined the association between consumption frequency of honey and NAFLD in the general population. Therefore, we designed this large-scale study to investigate how the consumption frequency of honey is associated with NAFLD in the Tianjin Chronic Low-grade Systemic Inflammation and Health (TCLSIH) study.
Methods
Study population
The present study is a cross-sectional analysis of baseline data from the TCLSIH dataset, which is a large prospective dynamic cohort study evaluating the association between inflammation and chronic diseases among general Chinese adults living in Tianjin, China. The TCLSIH study design has been described in detail previously(Reference Zhang, Gu and Wang19,Reference Zhang, Fu and Zhang20) . In brief, the study was established in 2007. All participants attended annual comprehensive health examinations. Liver ultrasound has been a part of our study protocol since 2010. Moreover, since May 2013, participants have been administered a questionnaire survey to assess diet and lifestyle factors. The survey response rate is above 93·7 %. The TCLSIH study has been approved by the Institution Review Board of Tianjin Medical University, and all participants provided written informed consent.
In the present study, all participants who underwent abdominal ultrasound between January 2015 (when honey consumption collection information began) and December 2017 were included. During this study period, a total of 24 756 participants were included. We excluded participants with missing dietary data (n 969), participants with other liver diseases (chronic virus hepatitis, operations on the liver, autoimmune liver diseases, cirrhotic or alcoholic fatty liver disease) (n 928) and participants who had CVD (n 744) or cancer (n 136). Finally, 21 979 participants were included in the cross-sectional analysis (Fig. 1). Based on the prevalence of NAFLD in the Chinese population and on the principle of ten outcome events per variable, the sample size was calculated(Reference Vittinghoff and McCulloch21). The sample size of 21 979 is large enough to provide adequate statistical power.
Flow diagram showing the process for the selection of eligible participants.

Diagnosis of non-alcoholic fatty liver disease
Abdominal ultrasound was performed by trained and certified technicians using a TOSHIBA SSA-660A ultrasound machine (Toshiba), with a 2–5 MHz curved array probe. Participants were considered to have fatty liver disease if at least two of the following abnormal findings of abdominal ultrasound existed: liver brightness, deep attenuation and vascular blurring(22). NAFLD was determined as the presence of fatty liver disease without significant alcohol intake (>210 g/week for men and >140 g/week for women) or any other causes (e.g. chronic hepatitis or autoimmune liver diseases)(22). Inter-observer variations for ultrasound NAFLD status (yes or no) were evaluated in 200 participants, and the kappa coefficient was 0·90 (P < 0·0001)(Reference Zhang, Gu and Wang19).
Assessment of dietary intake
Dietary information was collected using a validated 100-item semi-quantitative FFQ. Participants were asked to report their usual consumption frequency over the last month using seven frequency categories for foods ranging from ‘never or hardly ever’ to ‘≥2 times/d’ and eight frequency categories for beverages ranging from ‘almost never drink’ to ‘≥4 cups/d’. The intake of energy and nutrients was calculated using the FFQ data and the 2009 Chinese Food Composition Table(Reference Yang23). The reproducibility and validity of the FFQ were assessed in a random sample of 150 participants by comparing the data from two FFQ collected approximately 3 months apart and four 4-d weighed diet records (covering three non-consecutive weekdays and one weekend day). For the validation study, a random subsample of 150 TCLSIH study participants who had previously completed the first FFQ (FFQ1) were invited to participate. The participants for the validation study were randomly selected from different subgroups (age 20–30, 30–40, 40–50, 50–60, 60–70 and >70 years) of the TCLSIH study participants, and at least ten men and ten women were included in each of these subgroups. Participants were asked to complete four 4-d weighed diet records, approximately 3 months apart. The records began 3 months after completing the FFQ1. The four 4-d diet records documented all foods consumed covering three non-consecutive weekdays and one weekend day and excluded non-typical days (e.g. attending a wedding, banquets or temporary business trip). While they recorded their diet in this manner, we also administered four FFQ (3 months apart, FFQ2–FFQ5) to all consenting participants (n 150). Daily intake of the sixteen (four 4-d) dietary records was averaged and used as the representative weighed diet; FFQ1 was used as the reference to evaluate the FFQ validity. Although the reference period differed between FFQ1 (previous month) and 4-d diet records conducted in each season (representative of habitual intake during the year), we intended to assess whether a single FFQ during the previous month can represent habitual dietary intakes over a longer period (e.g. 1 year or more). This approach is similar to methods performed in a previous Japanese study(Reference Kobayashi, Murakami and Sasaki24). Reproducibility of the FFQ was assessed by comparing FFQ1 and FFQ2, collected approximately 3 months apart. Although it is possible that the process of recording diet might alter awareness of food intake and thus improve accuracy in completing the FFQ(Reference Willett25), it is unlikely that the diet records could have affected the completion of FFQ2. This is because FFQ2 was only completed after the first diet records started. Additionally, correlations between FFQ1 and FFQ5 were similar to correlations between FFQ1 and FFQ2. Spearman correlation coefficients between the FFQ1 and weighed diet records were energy intake = 0·49, nutrients = 0·35–0·54 and honey = 0·69. The energy-adjusted correlation coefficients between the FFQ1 and weighed diet records ranged from 0·39 to 0·72 for nutrients and 0·71 for honey. Spearman’s rank correlation coefficients between the FFQ1 and FFQ2 were total energy = 0·68, food group (fruits, vegetables and beverages) = 0·62–0·79 and honey = 0·75. In this validation study, honey intake was expressed as g/d. For seasonal food intake, such as orange, hawthorn and watermelon, we inquired participants’ intake in the previous month and in the natural mature season. Therefore, despite the FFQ only referring to the last month, long-term dietary intake of the participants could be inferred.
The FFQ included seven predefined frequency categories for honey consumption: almost never, <1 time/week, 1 time/week, 2–3 times/week, 4–6 times/week, 1 time/d and ≥2 times/d. In our study, a standard portion size (represented the 50th percentile of the weighed diet records) of honey was 18 g for men and 15 g for women(Reference Zhang, Kumari and Gu26). Based on the similar prevalence of NAFLD across categories of honey consumption frequency(Reference Baesens27), we categorised the consumption frequency of honey as ≤1time/week, 2–6 times/week and ≥1 times/d. Because most of the variation in intake of any food is explained by the frequency of its use(Reference Willett25), honey consumption frequency (rather than amount) was used as the main exposure variable in this study.
To measure overall diet quality, dietary patterns were derived by factor analysis with principal component based on the original ninety-nine foods/food groups listed in the FFQ (honey was excluded in the calculation). Varimax rotation was used to enhance the interpretability of factors. Three factors were retained according to the Scree plot, eigenvalues >1·0 and interpretability. Factors were named descriptively based on food items with high factor loading as follows: sweet food pattern (factor 1), healthy pattern (factor 2) and animal food pattern (factor 3), similar to our previous findings(Reference Zhang, Fu and Zhang20). A higher factor score represents a higher food intake of that dietary pattern.
Assessment of covariates
Information on age, sex, smoking status, alcohol intake, education level, employment status, household income per month, family history of diseases (CVD, hypertension, hyperlipaemia and diabetes), self-reported history of diseases (hypertension, hyperlipaemia and diabetes) was assessed during annual health examinations through a self-administered questionnaire. Height and weight were measured with participants wearing light clothes and no shoes. BMI was calculated as weight (kg) divided by height squared (m2). Waist circumference was measured using plastic tape at the level of umbilicus in standing position at the end of a gentle expiration. Physical activity was assessed using the short version of the International Physical Activity Questionnaire and was expressed as metabolic equivalents per week(Reference Craig, Marshall and Sjostrom28).
Blood pressure was measured at least two times using a validated semiautomatic oscillometer (A&D TM-2655). The measurement average was calculated to determine the final blood pressure value. Hypertension was defined as systolic blood pressure ≥140 mmHg and/or diastolic blood pressure ≥90 mmHg, or self-reported hypertension(Reference Chobanian, Bakris and Black29). Plasma total cholesterol, TAG, LDL-cholesterol and HDL-cholesterol were measured in fasting blood samples using enzymatic methods. Hyperlipidaemia was defined as total cholesterol ≥ 5·17 mmol/l or TAG ≥ 1·7 mmol/l or LDL-cholesterol ≥ 3·37 mmol/l or taking antilipemic drugs(30). Fasting blood glucose was measured using the glucose oxidase method. Diabetes was defined according to the American Diabetes Association criteria(31).
Statistical analysis
Normal distribution of continuous variables was assessed using quantile–quantile plots. Due to nonnormality, all the continuous variables were naturally log transformed. Baseline characteristics of the participants were presented as geometric means and 95 % CI for continuous variables and as percentages for categorical variables. Continuous variables were compared using ANCOVA, and categorical variables were compared using logistic regression analysis.
Binary logistic regression modes were used to estimate the OR and 95 % CI for the association of honey consumption frequency with NAFLD. We determined potential confounders using a directed acyclic graph (DAG; Fig. 2)(Reference VanderWeele, Hernan and Robins32,Reference Shrier and Platt33) . To select the minimally sufficient adjustment set, we used DAGitty, which is a popular web application for constructing DAG(Reference Textor, Hardt and Knuppel34). Minimal sufficient adjustment sets for estimating the effect of honey on NAFLD included age, sex, BMI, smoking status, alcohol intake, socio-economic status, family history of disease, individual disease history, physical activity, total energy and diet pattern. We fitted three models. Model 1 was adjusted for age, sex and BMI. Model 2 was adjusted for age, sex, BMI, smoking status, alcohol intake, socio-economic status (including education level, employment status and household income per month), family history of disease (CVD, hypertension, hyperlipaemia and diabetes), individual disease history (hypertension, hyperlipaemia and diabetes), physical activity and total energy intake. Model 3 (full model) was additionally adjusted for sweet food pattern score, healthy pattern score and animal food pattern score. Interactions between honey consumption frequency and confounding factors were tested by including cross-product terms in model 3. Moreover, we assessed multicollinearity in the final model using the variance inflation factor.
Direct acyclic graph (DAG) derived from previous literature and expert knowledge. Nodes represent variables and arrows represent causal associations. Honey is exposure, and non-alcoholic fatty liver disease (NAFLD) is outcome. SES, socio-economic status (including education level, employment status and household income per month).

Due to importance of obesity in the development of NAFLD, we performed a subgroup analysis according to BMI (<24·0 or ≥24·0 kg/m2). The cut-point of 24·0 kg/m2 was selected based on definitions of the Chinese Working Group on Obesity(Reference Zhou35). In addition, a sensitivity analysis excluding all participants with significant alcohol intake (>210 g/week for men or >140 g/week for women) was conducted. We also assessed the association between honey consumption frequency and NAFLD based on different categorisations. Furthermore, we performed a sensitivity analysis with energy-adjusted honey intake (g/1000 kcal per d) instead of consumption frequency of honey. To assess the dose–response association between honey intake (g/1000 kcal per d) and NAFLD, we used restricted cubic spline functions with four knots (at the 10th, 50th, 90th and 95th percentiles of the honey intake distribution)(Reference Desquilbet and Mariotti36).
All statistical analyses were performed using SAS software, version 9.4 (SAS Institute Inc.). A two-tailed P value <0·05 was considered to be statistically significant.
Results
Table 1 presents age- and sex-adjusted baseline characteristics of participants according to consumption frequency of honey. Participants who consumed more honey had higher age, were more likely to be women and had lower BMI (P for trend < 0·05). Moreover, they had higher levels of physical activity, total energy intake, dietary pattern scores and alcohol intake (P for trend < 0·05). They were also more likely to have a lower education level and tended to have hypertension, hyperlipidaemia, diabetes and family history of diabetes (P for trend < 0·05).
Age- and sex-adjusted characteristics of the participants according to consumption frequency of honey (n 21 979)
(Least square mean values and 95 % confidence intervals and percentages)

MET, metabolic equivalent; PA, physical activity.
* ANCOVA or logistic regression analysis adjusted for age and sex where appropriate.
† To convert kcal to kJ, multiply by 4·184.
Table 2 displays age- and sex-adjusted baseline characteristics of participants by NAFLD status. Participants with NAFLD had higher age, tended to be men and had higher BMI (P < 0·0001). In addition, they were more physically inactive, had lower total energy intake, were weaker adherence to the healthy dietary pattern and consumed less alcohol (P < 0·01). Participants with NAFLD were more likely to be current smokers, had a lower education level and were less likely to be managers (P < 0·01). Furthermore, they had more comorbidities and more likely to have a family history of hypertension and diabetes (P < 0·0001).
Age- and sex-adjusted characteristics of the participants according to non-alcoholic fatty liver disease (NAFLD) status (n 21 979)
(Least square mean values and 95 % confidence intervals and percentages)

MET, metabolic equivalent; PA, physical activity.
* ANCOVA or logistic regression analysis adjusted for age and sex where appropriate.
† To convert kcal to kJ, multiply by 4·184.
Table 3 shows adjusted OR and 95 % CI for the association of honey consumption frequency with NAFLD. In the age, sex and BMI adjusted model, honey consumption of 2–6 times/week was significantly associated with a lower prevalence of NAFLD (OR 0·80, 95 % CI 0·72, 0·90), while honey consumption of ≥1 times/d was not significantly associated with the prevalence of NAFLD (OR 1·01, 95 % CI 0·88, 1·17). After further adjustment for potential confounders, we observed similar results. In the fully adjusted model, the OR were 0·86 (95 % CI 0·77, 0·97) for 2–6 times/week and 1·10 (95 % CI 0·95, 1·27) for ≥1 times/d, as compared with those consuming honey ≤1 time/week.
Association of honey consumption frequency with non-alcoholic fatty liver disease (NAFLD) in the Tianjin Chronic Low-grade Systemic Inflammation and Health (TCLSIH) study (n 21 979)
(Odds ratios and 95 % confidence intervals)

* Obtained by using logistic regression analysis. Model 1 was adjusted for age, sex and BMI. Model 2 was adjusted for age, sex, BMI, smoking status, alcohol intake, education level, occupation, household income, physical activity, family history of disease (including CVD, hypertension, hyperlipidaemia and diabetes), hypertension, hyperlipidaemia, diabetes and total energy intake. Model 3 was adjusted for the same variables as in model 2 and further for three main dietary pattern scores (honey intake was not included in the calculation).
No significant interactions between consumption frequency of honey and covariates were found (all P for interaction ≥ 0·10). Furthermore, the multicollinearity test showed that all variance inflation factors were <2·0, suggesting that no collinearity was accepted.
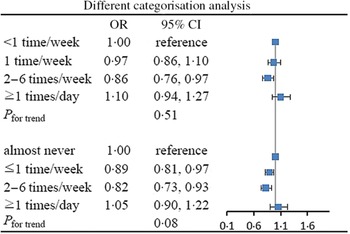
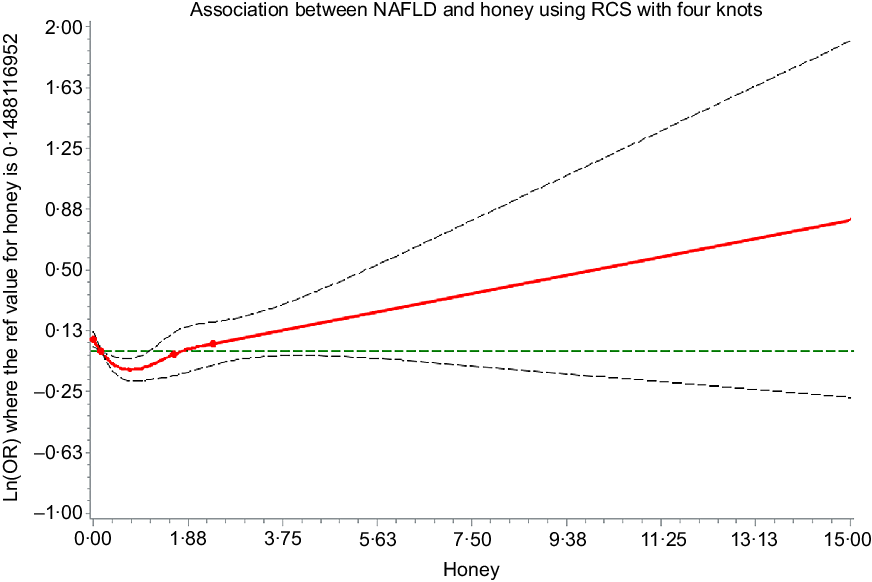
The strength of the associations between consumption frequency of honey and NAFLD was largely consistent across BMI subgroups (Fig. 3). In addition, excluding participants with significant alcohol intake did not substantially modify the observed association (online Supplementary Table S1). In a series of additional analyses based on different categorisations, the results were comparable with those of the main analyses (Fig. 4). The association between energy-adjusted honey intake and NAFLD is shown in online Supplementary Table S2. The shape of the association of honey intake with NAFLD is shown in Fig. 5. In the cubic spline model adjusted for the same covariates in model 3, we found a non-linear association between honey intake and NAFLD (P for non-linearity < 0·001), with an inverse association for light to moderate intake, but no association at heavy intake.
Association of honey consumption frequency with non-alcoholic fatty liver disease (NAFLD) according to BMI (<24·0 or ≥24·0 kg/m2). Adjusted for age, sex, BMI, smoking status, alcohol intake, education level, occupation, household income, physical activity, family history of disease (including CVD, hypertension, hyperlipidaemia and diabetes), hypertension, hyperlipidaemia, diabetes, total energy intake and three main dietary pattern scores (honey intake was not included in the calculation).

Association of honey consumption frequency with non-alcoholic fatty liver disease (NAFLD) in. Adjusted for age, sex, BMI, smoking status, alcohol intake, education level, occupation, household income, physical activity, family history of disease (including CVD, hypertension, hyperlipidaemia and diabetes), hypertension, hyperlipidaemia, diabetes, total energy intake and three main different categorisation analysis dietary pattern scores (honey intake was not included in the calculation).

Multivariable dose–response association between honey intake (g/1000 kcal per d) and non-alcoholic fatty liver disease (NAFLD). Adjusted for age, sex, BMI, smoking status, alcohol intake, education level, occupation, household income, physical activity, family history of disease (including CVD, hypertension, hyperlipidaemia and diabetes), hypertension, hyperlipidaemia, diabetes, total energy intake and three main dietary pattern scores (honey intake was not included in the calculation). The reference value for honey intake (g/1000 kcal per d) was set at the median intake. The four knots were set at the 10th, 50th, 90th and 95th percentiles of the honey intake (g/1000 kcal per d) distribution. ![]() , Estimation;
, Estimation; ![]() , lower confidence limit;
, lower confidence limit; ![]() , upper confidence limit;
, upper confidence limit; ![]() , knots.
, knots.
Discussion
In this large-scale population-based study, we found that light to moderate honey consumption was inversely associated with NAFLD, whereas heavy honey consumption was not statistically significantly associated with NAFLD. To our knowledge, this is the first report that has examined the association of habitual honey consumption frequency and NAFLD.
In the present study, we used a DAG to determine covariate adjustment sets for minimising confounding bias(Reference Shrier and Platt33). The DAG approach can offer systematic representations of causal associations, thereby making robust inferences in a causal framework(Reference Textor, van der Zander and Gilthorpe37). In addition, the DAG approach helps to avoid collider bias and overadjustment bias(Reference Shrier and Platt33,Reference Rohrig, Strobl and Muller38) . After adjusting for confounding factors identified by the DAG (model 3), the results were similar to model 1 and model 2 (Table 3). Moreover, similar associations were observed among lean (BMI < 24·0 kg/m2) and overweight (BMI ≥ 24·0 kg/m2) participants. Therefore, the observed association between honey consumption frequency and NAFLD was not confounded by covariates.
Previous animal studies have reported that honey intake could reverse the formation of hepatic steatosis(Reference Samat, Kanyan Enchang and Nor Hussein15). However, no studies assessed the effects of dietary honey intake on NAFLD in humans. In this study, we observed an inverse association between honey consumption of 2–6 times/week and NAFLD in the general population. This inverse association partially confirms previous findings from animal studies. However, we observed no significant association between honey consumption of ≥1 times/d and NAFLD. Future studies should investigate whether similar results can be found in other populations.
The significant inverse association between light to moderate honey consumption and NAFLD is biologically plausible. First, honey is rich in phenolic acids, flavonoids and phenol contents(Reference Ahmed, Obbed and Wabaidur39,Reference Pyrzynska and Biesaga40) . Studies have shown that phenolic acids and flavonoids could ameliorate NAFLD by activating the adiponectin/AMPK pathway and suppressing the nuclear factor-kappaB pathway(Reference Akhlaghi41,Reference Madushani Herath, Cho and Kim42) . Moreover, cross-sectional studies found that higher phenolic acid and flavonoid consumption was associated with a lower likelihood of NAFLD(Reference Mazidi, Katsiki and Banach43,Reference Salomone, Ivancovsky-Wajcman and Fliss-Isakov44) . Second, animal experiments suggest that honey could inhibit the toll-like receptor 4 pathway via suppression of phosphorylated nuclear factor of kappa light polypeptide gene enhancer in B-cells inhibitor alpha(Reference Gasparrini, Afrin and Forbes-Hernandez45). Emerging evidence has shown that the toll-like receptor 4 signalling pathway is involved in the development and progression of NAFLD(Reference Liu, Zhuang and Bian46). Third, honey contains a number of vitamins, minerals and antioxidant enzymes. Therefore, honey intake might prevent NAFLD by its antioxidant properties(Reference Khan, Anjum and Rahman47). Epidemiological evidence also suggested that daily intake of vitamins and minerals was inversely associated with the prevalence of NAFLD(Reference Ivancovsky-Wajcman, Fliss-Isakov and Salomone48,Reference Tayyem, Al-Dayyat and Rayyan49) .
Interestingly, no significant association between heavy honey consumption, defined as ≥1 times/d, and NAFLD was found. Studies have suggested that fructose promotes liver lipogenesis, which can lower insulin sensitivity and lead to NAFLD(Reference Jensen, Abdelmalek and Sullivan17). Therefore, the possible harmful effect of fructose in honey on NAFLD may have been offset the possible protective effect of honey on NAFLD.
To our knowledge, this is the first observational study that has investigated the association between honey consumption frequency and NAFLD in the general population. The strengths of this study are the large sample size, comprehensive capture of baseline dietary and lifestyle variables and adjusting for a number of confounders identified by the DAG. In addition, honey was widely consumed in our study population(Reference Zhang, Lu and Tian6), which gave us a unique opportunity to examine the independent effect of honey on NAFLD.
The study also has limitations. First, self-reported honey information is subject to measurement errors. However, this misclassification would be expected to bias the estimates towards the null(Reference Willett25). Second, different types or brands of honey were not assessed in this study, and therefore, we may have missed the effect of specific honeys on NAFLD. Third, NAFLD was diagnosed using abdominal ultrasound rather than liver biopsy (the gold standard). However, previous studies showed that ultrasonography had high sensitivity and specificity for NAFLD diagnosis compared with the gold standard(Reference Hernaez, Lazo and Bonekamp50). Moreover, ultrasonography is widely used in large-scale epidemiological studies due to its non-invasiveness and accessibility. Fourth, as with any epidemiological study, we cannot completely rule out the possibility of residual or unmeasured confounding. Finally, because of the cross-sectional nature of this study design, we could not make the causal inference. Prospective cohort studies are therefore necessary to evaluate the longitudinal association between honey consumption and NAFLD.
Conclusion
In conclusion, our data show a U-shaped association between consumption frequency of honey and NAFLD in the general adult population. Future study is needed to replicate our findings and disentangle the underlying mechanisms.
Acknowledgements
The authors gratefully acknowledge all the people who have made this study.
This study was supported by grants from the National Natural Science Foundation of China (nos. 81974521, 91746205, 81673166, and 81372118) and the Tianjin Natural Science Foundation Key Project (no. 19JCZDJC33500).
S. Z. analysed the data and wrote the paper. S. Z., X. W., S. B., Q. Z., L. L., G. M., Z. Y., H. W., Y. G., Y. W., S. S., X. W., M. Z., Q. J. and K. S. conducted the research. K. N. and X. W. designed the research and had primary responsibility for the final content. All authors had access to the study data and reviewed and approved the final manuscript.
The authors declare that there are no conflicts of interest.
Supplementary material
For supplementary materials referred to in this article, please visit https://doi.org/10.1017/S0007114520003190