


1. Introduction
How accurately can glacier outlines be mapped? This question is difficult to answer. Yet it is an important question, as glacier area and length changes need to be precisely assessed to be valuable as an indicator of climate change. A wide range of issues have to be considered to delineate glaciers, for example the interpretation of seasonal and/or perennial snowfields, handling of glaciers covered (partly) by clouds, identification of drainage divides in the accumulation region, the correct delineation of debris-covered glaciers, the determination of the terminus for calving glaciers or those with dead ice, or the interpretation of invisible glacier boundaries in cast shadow. Most of these issues were addressed in a workshop organized by the Global Land Ice Measurements from Space (GLIMS) initiative, and are discussed at length in Reference Racoviteanu, Paul, Raup, Khalsa and ArmstrongRacoviteanu and others (2009). The current study summarizes the results of a round-robin experiment with a focus on comparing glacier outlines digitized manually on satellite images with different resolutions and from automated methods.
To be sure that observed glacier changes are related to real changes rather than caused by imprecise determination of the outline, the accuracy of the outlines must be known (i.e. changes should be larger than the accuracy in order to be significant). Furthermore, the definition of the exact perimeter of a glacier as an entity (that can be represented by a polygon in the vector domain) is non-trivial. Two key points apply: First, the entity definition depends on the purpose. For example, hydrologists prefer to separate an ice cap into its main drainage basins, whereas glaciologists tend to keep it as a single unit (Reference Racoviteanu, Paul, Raup, Khalsa and ArmstrongRacoviteanu and others, 2009). If there is agreement on the use of drainage divides in general, their location can be defined in various ways. Applying hydrologic analysis to a digital elevation model (DEM) of the glacier surface for watershed determination is common practice (e.g. Reference Andreassen, Paul, Kaab and HausbergAndreassen and others, 2008; Reference Schiefer, Menounos and WheateSchiefer and others, 2008; Reference Bolch, Menounos and WheateBolch and others, 2010), but it is mandatory to specify the DEM used, as DEMs can differ in quality (e.g. in low-contrast regions). Another issue is the treatment of tributaries. Neglecting for the moment that tributaries change through time (e.g. they might become disconnected during retreat), the required degree of contact to be counted as being part of a glacier can be controversial. To some extent this also applies to ice above the bergschrund, which should be considered as part of the glacier but is often difficult to identify due to snow cover. Hence, large differences in glacier area can be expected due to a different interpretation of a glacier as an entity by an analyst. And second, glaciers are elements of nature with a large variability of shapes and in strong interaction with their surrounding environment. Both points require that rules be applied for a consistent glacier entity definition. For glaciers observed by remote sensing, such guidelines were developed in the framework of the GLIMS initiative in the form of the GLIMS analysis tutorial (Reference Raup and KhalsaRaup and Khalsa, 2007). For example, according to these guidelines all ice above the bergschrund and all debris-covered ice that is connected to the main glacier should be included as a part of the glacier, whereas seasonal snow, lakes with icebergs at the terminus or dead ice are not part of the glacier. But even if strictly followed, these rules lead to some variability in interpretation of the ‘true’ glacier extent, as the identification of debris-covered glacier parts, seasonal snow, dead ice or ice in cast shadow can be challenging (Reference Racoviteanu, Paul, Raup, Khalsa and ArmstrongRacoviteanu and others, 2009). In this regard, finding a ‘ground-truth’ or reference dataset that can be used to validate glacier outlines is also non-trivial.
It is generally assumed that glacier extents derived from coarser-resolution sensors can be validated by comparing them to results from a higher-resolution sensor (e.g. 30 m Landsat Thematic Mapper (TM) with 1m Ikonos). Though this might be true in a general sense, several constraints have to be considered to avoid invalid comparisons (cf. Reference Svoboda and PaulSvoboda and Paul, 2009):
-
1. the images from both sensors should be acquired around the same date (week) within a year to avoid changes due to different snow conditions;
-
2. at a higher spatial resolution, new details on the surface become visible that require a different interpretation;
-
3. the common higher-resolution sensors (including aerial photography) lack a spectral band in the shortwave infrared (e.g. Landsat TM5), so the base data for the interpretation are different;
-
4. a lower contrast between glacier ice and the surrounding rock in the visible and near infrared (VNIR), as available from high-resolution sensors, can degrade the interpretation substantially (i.e. the perimeter can be virtually invisible); and
-
5. for objects with a shape that is more complex than a simple square (i.e. glaciers), the area also varies with spatial resolution of the image. This has to be considered when glacier sizes derived from high- and lower-resolution sensors are compared (e.g. Reference Paul, Huggel, Kaab, Kellenberger and MaischPaul and others, 2003).
In practice, it is difficult to rule out all the above limitations, and the ‘validation’ with a higher-resolution dataset can easily be considered scientifically unsound. When the above-mentioned differences in interpretation of glacier extent by different analysts are also taken into account, reporting accuracy correctly is indeed challenging. Another important point is the comparison of automatically derived glacier outlines with manually digitized ones. Here two issues must be considered: (A) apart from a few regions without lakes and debris-covered glaciers, the automatically derived glacier outlines are usually also corrected manually (by visual interpretation of the satellite image), and (B) manually digitized glacier outlines differ in each digitization (even when performed by the same person), as the degree of generalization (e.g. spatial averaging over several pixels, number of vertices used for the line, interpretation of subtle differences in colour) varies each time. Hence, manual digitizing gives inconsistent and generalized results that are difficult to reproduce. This is also a point to consider for change assessment (e.g. Reference Hall, Bayr, Schoner, Bindschadler and ChienHall and others, 2003). So what is the way forward to assess the accuracy of glacier outlines?
A possible way to analyse this problem is to perform multiple and independent digitizations of a couple of glaciers within a single satellite scene, and, if available, also on high-resolution data for the same glaciers (e.g. Reference Berthier, Le Bris, Mabileau, Testut and RemyBerthier and others, 2009). If glaciers of different size, degree of debris cover and shadow conditions are selected, several conclusions are possible:
-
a. the multiple digitizations of the high-resolution data provide a mean value for the respective glaciers that can be used as a reference;
-
b. the multiple digitizations of the lower-resolution data provide (i) a measure for the precision of the analysts digitizing (standard deviation of the derived area values), (ii) a mean value for comparison with an automatically derived extent, and (iii) the possibility of determining whether the automatically or the manually derived extent is more accurate (by comparing the difference from (ii) to the standard deviation (STD) of (i));
-
c. identification of regions with large differences in interpretation by overlay of outlines; and
-
d. calculation of (perhaps systematic) omission and commission errors among the different digitizations.
It has to be noted that (iii) in (b) of the list above is a comparison of accuracy (difference from a reference value) with precision (internal variability or random uncertainty). The underlying assumption is that the precision of (i) must be higher than the accuracy from (ii) to perform better. As the above assessments will not be performed and reported routinely with every study related to the determination of glacier area and its changes, in this study we present such a comparison for a couple of selected glaciers from different regions of the world. The general idea behind this comparison experiment with many participants (named ‘round robin’) is based on previous comparisons performed in the framework of GLIMS (GLIMS analysis comparison experiment, GLACE). They revealed large differences in the interpretation of glacier entities in general, and led to the guidelines presented in the GLIMS analysis tutorial (Reference Raup and KhalsaRaup and Khalsa, 2007). In this study, the focus is on the multiple digitizations of mostly well-defined glacier entities for accuracy assessment rather than investigating the above-mentioned methodological issues.
This study is performed within the framework of the European Space Agency (ESA) project Glaciers_cci. The CCI (Climate Change Initiative) projects have a focus on error characterization of operationally derived essential climate variables (ECVs) following the climate-monitoring principles of the Global Climate Observing System (GCOS) (2003). The mapping of the spatial extent of the ECV ‘glaciers and ice caps’ as defined by GCOS (2004) is already in quite a mature state, as well-established, fast, accurate and thus frequently applied algorithms exist. However, accuracy assessment of mapped glacier outlines is still somewhat unspecific in the related studies, mainly due to the limitations discussed above. The results presented here are part of the required product validation for the Glaciers_cci project and belong to a larger round robin that also includes the determination of a ‘best’ glacier-mapping algorithm for a test region in the Himalaya. In this study, 21 glaciers in five satellite images from two regions (Alaska and the European Alps) were digitized one to three times by up to 20 participants (Table 1). As a validation measure, we compare glacier extents derived automatically from Landsat TM scenes, with the results of the round robin and outlines digitized from high-resolution satellite images and aerial photography.
Overview of the input datasets used for the round robin (rr). Set No. 3 is processed by the team at University of Zurich and used for validation (val). The ‘Scene’ column gives the path-row for the related Landsat scene

2. Study Regions and Dataset Descriptions
The two study regions are located in the eastern Chugach Mountains, Alaska, USA, and in various parts of the European Alps (Switzerland, Austria, Italy), as shown in Figure 1 . The major selection criteria for the regions and the selected glaciers were:
-
variability with regard to glacier size and mapping challenges (debris, shadow, snowfields),
-
a feasible number of sites and glaciers to facilitate wide participation,
-
scenes from the end of the ablation period with seasonal snow close to a minimum,
-
availability of high-resolution scenes with good contrast in Google MapsTM,
-
a good temporal coincidence or at least comparable snow conditions of the high- and lower-resolution images, and
-
well-defined glacier entities in all images used for multiple digitization.
Location of the test sites in Alaska (a) and the European Alps (b). The yellow box denotes the location of the test site in the O= tztal Alps. More detailed images are shown in subsequent figures. Images: screenshots from Google MapsTM, © TerraMetrics.

Of course, many other regions fulfil these criteria, and the finally selected regions are only examples.
The test region in Alaska (centre 608430 N, 144890 W) uses a QuickBird scene from 27 August 2003 (Fig. 2) and includes eight glaciers of different sizes with a varying degree of debris cover, shadow and some seasonal snow (mostly off-glacier). For this region, the focus was on comparing outlines derived by different participants (one-time digitization) using high-resolution (2.4 m in this case) satellite data. The test region in the Alps includes one glacier in the Gotthard (centre 46831.50 N, 88280 E) and two glaciers in the Silvretta region (centre 46851/520 N, 10811/120 E) of Switzerland based on aerial photography, and a Landsat TM scene (centre 468500 N, 108250 E) of the O= tztal Alps (Fig. 3) including three glaciers covered by high-resolution Ikonos images. In this case, the TM scene was acquired only 14 days before the Ikonos scene, so a validation of the results obtained with Landsat is possible. Ten glaciers on the Landsat scene were selected for multiple digitizing (three times), and contrast-enhanced red, green, blue (RGB) composites (TM bands 3 2 1 , 4 3 2 and 5 4 3 as RGB, respectively) were provided to the participants for this purpose. The three glaciers depicted on aerial photography were digitized at least once, and the three glaciers selected for validation were not made available to the participants but digitized by the participants from the University of Zurich. For the Landsat TM scene, glacier outlines were also derived automatically.
Overlay of the outlines for the eight glaciers from the test region in Alaska. Background image: screenshot from Google MapsTM, © DigitalGlobe, GeoEye.

Location of the glaciers in the O= tztal Alps that were selected for the multiple digitizations (marked with a black circle) on a Landsat 5 TM band 543 composite. The three glaciers with a white dot in the black circle are selected as reference glaciers for the digitizing with Ikonos.

The screen shots from Google MapsTM are already orthorectified, as they have to match with an underlying DEM. To use them for the digitization of glacier outlines, their upper left corners were iteratively geocoded by changing the coordinates in the tfw (tif world) file until they matched with the respective (also orthorectified) Landsat scene (level 1T product from the United States Geological Survey). The pixel size was derived from the scale bar on each image. Compared to the pixel size of Landsat and at the scale of individual glaciers, we found that the resulting geolocation accuracy was sufficient (i.e. no systematic shifts were observed). The images for the three regions were provided in Geotif format along with a tfw file. The screen shots did not always have the original resolution of the high-resolution datasets and included local artifacts (e.g. from jpg compression). However, this does not impact on the value of the round robin, as all participants used the same datasets and a variety of spatial resolutions and challenging mapping conditions should be investigated in the round robin anyway.
3. Methods
3.1. Instructions for the participants
To guide the digitizations of the participants, detailed instructions were provided in a short document describing the reasons for the round robin, the datasets, how to perform the work and a feedback form. Internal tests revealed that this part of the round robin would take ∼ 4 - 6 hours for one round of digitization. The participants were free in working with their specific software, the magnification applied during digitizing and the level of detail (the number of vertices digitized per polygon). They were also allowed to check for details with Google MapsTM or other sources of high-resolution imagery and no time limit was given. All participants were asked to report meta-information (e.g. time taken, additional sources used) in a feedback form.
The interpretation of the glacier extent as seen on the respective image was the core of the exercise, so no additional advice was provided for that. For the multiple digitizations of the same glaciers by the same analyst, it was not permitted to refer to the previous digitization (using that outline in the background) and we asked the analysts to wait 24 hours for the next digitizing round to not remember the details of the previous digitization and obtain independent interpretations. The participants were free to provide results for only some of the test regions, but most participants provided results for all.
3.2. Analysis of the results
All shapefiles with the glacier outlines were superimposed with the respective images in a GIS software, and glacier area (m2) was extracted for each glacier and participant. For each digitization we determined (1) the total area of all glaciers in a region per participant, (2) the mean size and STD of all digitizations for each glacier and (3) the relative difference of the automatically derived glacier area from the mean of all manual digitizations. This was also done for (4) the total glacier area per participant. Where a second (and third) set of digitizations was provided, the same analysis as described above was performed. Furthermore, overlays of all outlines were created to obtain a visual impression of the digitizations and to identify the most critical regions (i.e. with the largest variability in interpretation). This qualitative comparison is also an important complement to the quantitative comparisons described above, as the same glacier area could result from outlines at very different locations (i.e. wrongly interpreted). Based on these overlays, we decided not to calculate omission and commission errors explicitly, as the variability of the outline locations was more or less random, i.e. without a preference for including or excluding certain glacier parts.
3.3. Glacier mapping with Landsat TM
The glacier outlines from TM were derived with the well-established band-ratio method (e.g. Reference AlbertAlbert, 2002; Reference Paul, Kaab, Maisch, Kellenberger and HaeberliPaul and others, 2002) and have been created for the test region O= tztal Alps in an earlier study (Reference Paul, Frey and Le BrisPaul and others, 2011). Glaciers were classified when the raw digital numbers of band TM3 were 1.8 times higher than in TM5 (TM3/ TM5> 1.8). Apart from one glacier with debris cover in this selection, the outlines were used as is (and not adjusted for the round robin) to have the required independence of the datasets. For the glacier with debris cover, the outline was corrected afterwards to have a comparable value. Of course, this corrected outline is now different from the fully automatically derived extents, and the difference from the fully manually digitized extents stems more from the variability in interpretation rather than from the accuracy of the automated mapping. This has to be considered when comparing the results.
4. Results
4.1. Overlay of outlines
In Figure 2 an overlay of the digitizations from the different analysts is shown for the test region in Alaska using the QuickBird image with the eight selected glaciers numbered. Although bare ice was digitized highly consistently by all participants (Fig. 4a), some of them missed the shadowed parts of glaciers 2 and 3. Bare rock in the glacier forefield was partly included (glaciers 2 and 7) and the debris cover between glaciers 2 and 3 was not detected. The region with rockfall on glacier 5 was interpreted very differently by the participants. Large differences in interpretation also occurred for the debris-covered tongues of glaciers 6 and 8. The resulting maximum differences in glacier length are 500 m for glacier 6 and 600–700 m for glacier 8. As the close-ups of glaciers 5 and 8 in Figure 4 reveal, higher resolution does not really help to achieve a ‘better’ or ‘clearer’ interpretation. In such cases, the location of the outline and the terminus is a subjective issue allowing a wide range of interpretations.
Close-ups showing glacier 5 (a) and the terminus of glacier 8 (b) from test region in Alaska (see Fig. 2). The boundary of the ice can, despite the high spatial resolution, only be roughly estimated. Images: screenshots from Google MapsTM, © DigitalGlobe, GeoEye.

The interpretation of glacier extents on the even higher-resolution aerial photography depicted in Figure 5 confirms the results from the analysis of the QuickBird image described above. For clean ice and with good contrast, all participants digitized the outlines very similarly (i.e. the variability mostly stays within one pixel). When debris covers the surface (Fig. 5b) or the tongue (Fig. 5c), the interpretation is more variable. The outline derived automatically from a TM image acquired in the same year (Fig. 5a) is visually in good agreement for this very small glacier (0.03 km2) apart from two or three TM pixels at the terminus. Apart from a region with rockfall and ice above the bergschrund that were partly excluded, the manually digitized outlines are fairly consistent. This is different for the glacier depicted in Figure 5b, where bare rock in the glacier forefield and above the highest point of the glacier was digitized differently. For the largest glacier in this sample (Fig. 5c) the correct interpretation of the seasonal snow above the accumulation area was not a problem, but the differences in the terminus position are up to 300 m. This is the same value as the retreat of the terminus between 2003 (acquisition date of the TM scene, indicated by the white outline) and 2010 (the year of acquisition of the aerial photography). This implies that a retreat of a glacier tongue over such a distance might not be detected when different analysts provide the outlines for different years.
Overlay of manually digitized glacier extents for the three test glaciers in the Swiss Alps: (a) Vadret Futschol, (b) Vadret d’Urezzas and (c) Geren glacier. One raster cell of the white line is 30 m in length. Images: screenshots from Google MapsTM, ©, Geoimage Austria, Flotron/Perrinjaquet.

In Figure 6 we show the overlay of the digitizations by different analysts for the test region in the Otztal Alps for a selection of six out of ten glaciers (first digitization). In this region the interpretation of the glacier extent is facilitated by the availability of TM bands 5, 4 and 3 (as RGB) composite that shows clean glacier ice and snow in a light-blue to cyan colour and that is not available for high-resolution sensors. On the other hand, pixel size is only 30m and the interpretation of small details might be more difficult. However, apart from the glaciers depicted in Figure 6a and c, where a snowpatch and debris cover cause some larger variability in interpretation, the outlines are very consistent. In general, their location varies only by about 1 TM pixel (i.e. ±15 m), but one outline is often found outside all others. The outline derived automatically from TM (white) is mostly located within the variability of the manual digitizations. A somewhat larger variability in the outline location when two analysts digitize the same glacier was also found by Reference Berthier, Le Bris, Mabileau, Testut and RemyBerthier and others (2009).
Six examples from the multiple digitizations of glaciers (bands 543 as RGB) using the TM scene shown in Figure 3 as performed by different analysts (coloured lines). White outlines refer to the automatically derived extents; one image pixel is 30 m in length.

Most of the participants digitized the glaciers in this test region (Otztal Alps) three times. This allows us to also determine the analysts’ internal variability in interpretation for the same glaciers. The outline variability in the second and third digitization when comparing all analysts’ results has the same characteristics as for the first digitization shown in Figure 6, so we do not show again the related cross-analyst comparison. Instead, we show in Figure 7 for three analysts and four glaciers (Fig. 6a-d) overlays of the multiple digitizations. These overlays reveal that the variability of the digitizing by the same analyst is similar to the multi-analyst variability.
Overlay of manually digitized glacier extents from three analysts (depicted by yellow, white and black lines) and four glaciers (Fig. 6a–d). For each analyst the three digitizations are shown in the same colour; one image pixel is 30 m in length.

Considering the high variability seen in the interpretation of the high-resolution datasets, we decided to also derive the reference size for three glaciers from Ikonos (indicated in Fig. 3) using multiple digitizations. The overlay of the outlines depicted in Figure 8 illustrates the variability in interpretation and indicates that the creation of a reference dataset (that can be used as the ‘truth’) is challenging. Consequently one has to admit that without an appropriate validation dataset the accuracy of other datasets cannot be calculated. However, the mean value of the four digitizations is likely close to the ‘truth’ and was thus taken as a reference value.
Overlay of three manually digitized glacier extents (blue, yellow, red) for the upper Guslarferner, Austrian Alps (cf. Fig. 6b and 7b). The white outline is derived automatically from TM; the green line is manually digitized from TM (randomly selected). Image: screenshot from Google MapsTM, © European Space Imaging.

4.2. Statistical analysis
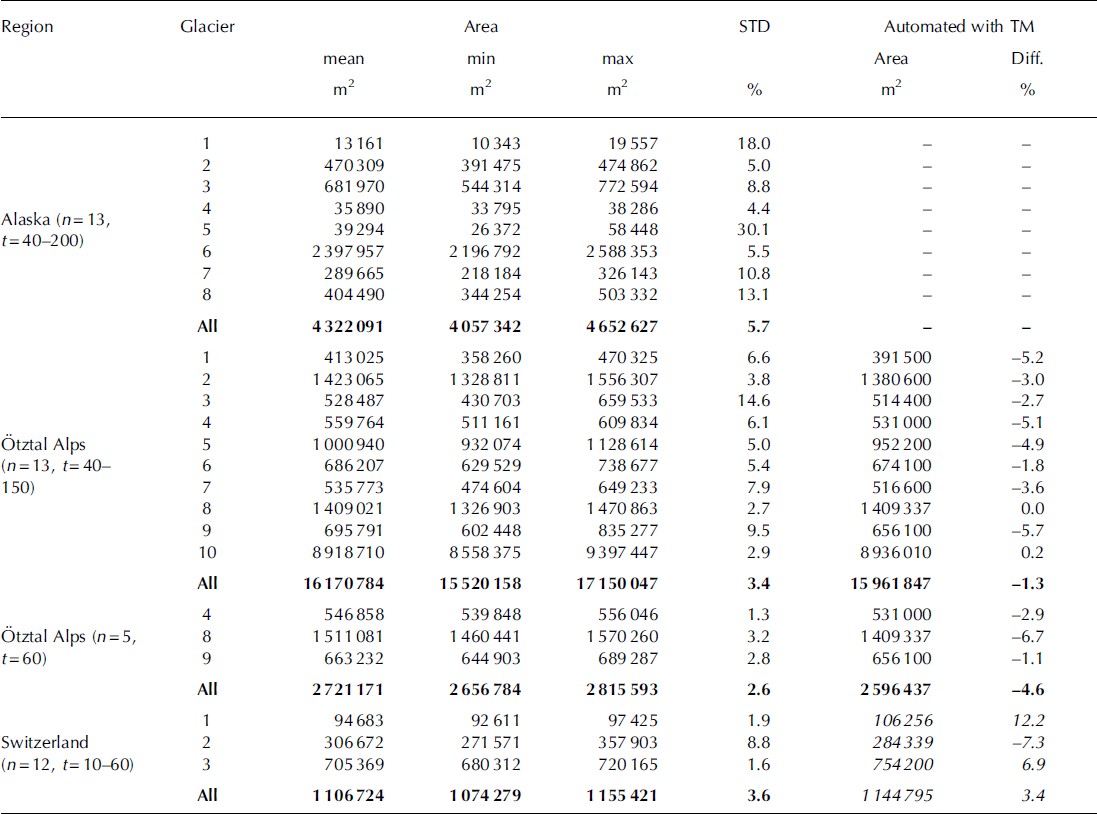
Statistical results for the three test regions are summarized in Table 2 and visualized in Figure 9. For the Alaska test region (QuickBird scene), the mean STD of glacier areas (all glaciers, all analysts) is ∼6%. For glacier 5 (0.06km2) with the difficult interpretation (cf. Figs 2 and 4a) the mean STD is much higher (31%); for the very small glacier 1 (0.01 km2) the STD is 18%, and for the much larger (0.4 km2) but heavily debris-covered glacier 8 it is 13%. The time taken to digitize all eight glaciers varied between 40 and 200 min. For the glaciers digitized on aerial photography, the STD is 1.6–8.8% (mean 3.6%), with the largest value for the partly debris-covered glacier depicted in Figure 5b. The digitization of all three glaciers took 10–30 min.
Comparison of glacier area values as derived for the three test regions by all analysts. For the regions where multiple digitizations were performed (O= tztal Alps), the mean value of the first digitization from each analyst is taken for the comparison. The numbers in italics indicate values that are not used for further analysis, as the dates of the images compared are different. n is sample size, t is time used for the manual digitizing (min), STD is standard deviation and Diff. is difference between the manually and automatically derived area
Glacier size vs standard deviation of the manually digitized area values for seven of the eight glaciers from the test region in Alaska (A), nine of the ten glaciers from the test region in the O= tztal Alps (B) and three glaciers from the test regions in Switzerland (C). The differences of outlines derived automatically from TM to the mean of manual digitizations (O= tztal Alps) are shown as green stars.
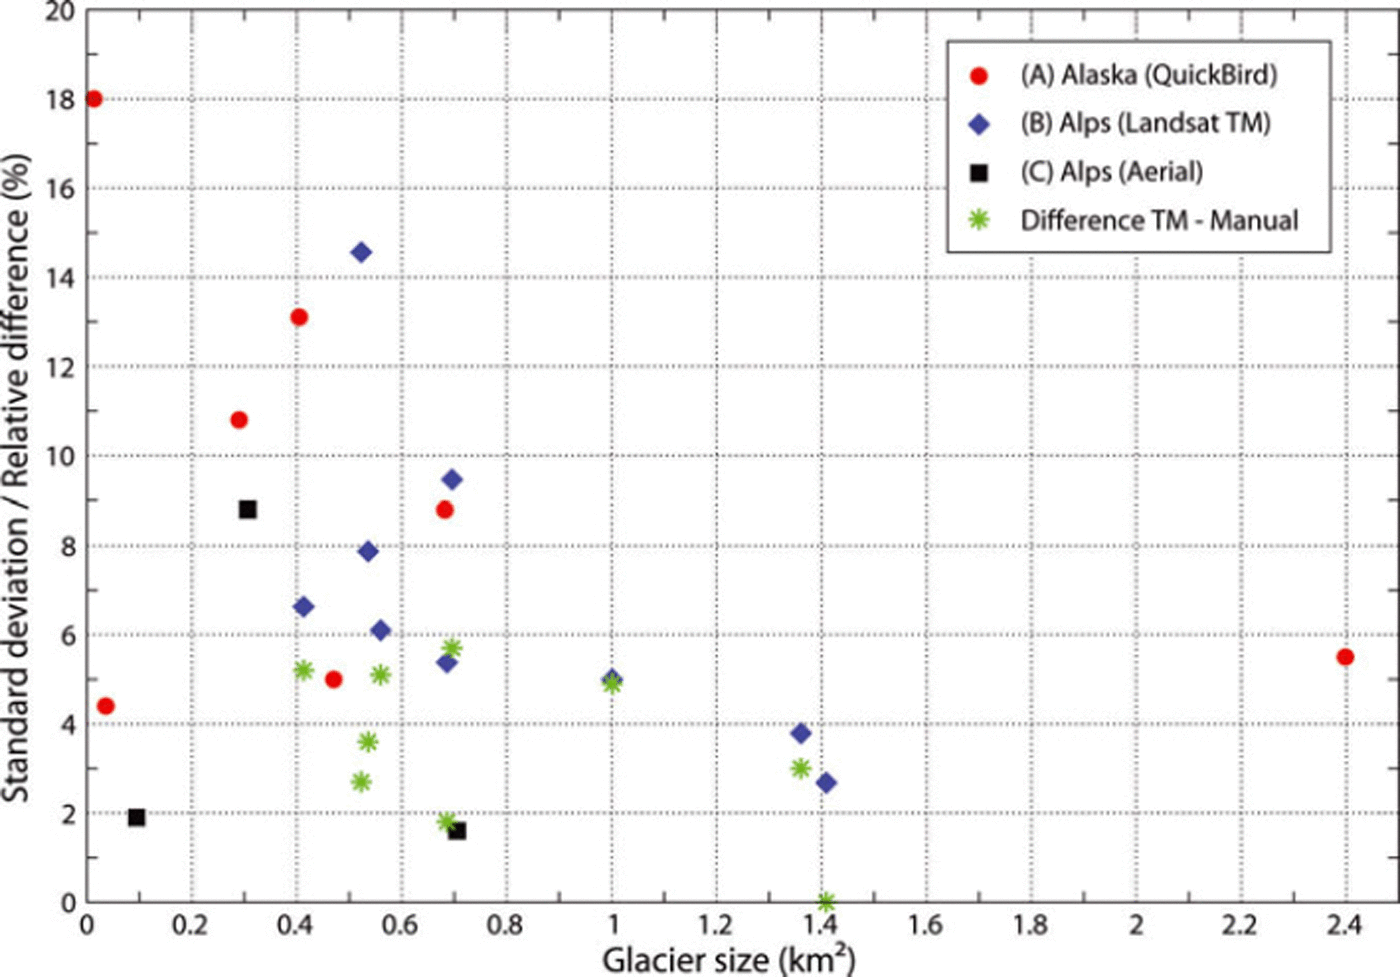
The first digitization on the TM scene had STD of 2.7– 14.6%, with a mean value of 3.5%. The second and third digitizations had a very similar variability and mean. The digitization of all ten glaciers took 10–50 min. The mean difference of the automatically derived outlines and the reference value (from the manual digitizations) is only –1.3% (range 0.2 to –5.7%). However, this value is biased by the good agreement with the largest glacier (No. 10 in Table 2). When that glacier is excluded, the mean difference is –3.1%, very similar to the STD of the manual digitizations. Compared with the reference dataset from Ikonos (Fig. 8), the TM-derived glacier outlines in the O= tztal test region are 4–5% smaller. However, the STD of the multiple digitization of this reference dataset is of the same order of magnitude (up to 3%) so that differences in the interpretation and in the mapping of mixed pixels have about the same effects. Only the tendency to underestimate ‘real’ glacier area by automated mapping with TM is robust. The scatter plot in Figure 9 shows a decreasing STD with increasing glacier size, but the distribution of values can also be summarized differently: it is <5% for glaciers larger than 1 km2; 1-15% (excluding two outliers) for smaller glaciers; and 2-6% difference with the automated mapping. A systematic trend towards larger differences for faster digitizations of outlines was not found.
5. Discussion
The results presented above confirm previous accuracy assessments (e.g. Reference Paul and KaabPaul and Kaab, 2005; Reference Bolch, Kamp, Kaufmann and SulzerBolch and Kamp, 2006; Reference Andreassen, Paul, Kaab and HausbergAndreassen and others, 2008; Reference Paul, Frey and Le BrisPaul and others, 2011) that reported relative area differences of the automatically derived outlines from manually digitized outlines on higher-resolution datasets between 2% and 5%. These values also apply to the glaciers investigated here with sizes of a few km2. The relative area differences tend to be larger for even smaller glaciers and smaller for larger glaciers (Reference Paul, Huggel, Kaab, Kellenberger and MaischPaul and others, 2003), at least when they are mostly debris-free. For debris-covered glaciers the accuracy is more a function of the visibility of the debris cover rather than of glacier size.
The problems of interpreting debris cover on glaciers have also been reported previously (e.g. Reference Paul, Kaab, Maisch, Kellenberger and HaeberliPaul and others, 2002; Reference Racoviteanu, Paul, Raup, Khalsa and ArmstrongRacoviteanu and others, 2009; Reference Bolch, Menounos and WheateBolch and others, 2010). That the location of terminus positions can differ by several hundred metres indicates the magnitude of uncertainty when length changes of glaciers are derived from outlines that have been digitized by different analysts. This also applies to outlines that were digitized from topographic maps and derived by cartographers (e.g. Reference Hall, Bayr, Schoner, Bindschadler and ChienHall and others, 2003; Reference Bhambri and BolchBhambri and Bolch, 2009; Reference Bolch, Menounos and WheateBolch and others, 2010). Hence, length changes derived from glacier outlines of two epochs must either be large, refer to debris-free glaciers or be assessed by the same analyst to be reliable.
In a qualitative sense, the automatically derived glacier outlines have the advantage of being reproducible, not generalized (i.e. they follow exactly the pixel outline) and rapidly determined. For example, ∼2 s per glacier are required for a TM scene with, for example, 600 glaciers and 15-20min processing time (including threshold selection by visual comparison of the derived outlines in shadow regions). Manual digitization takes on average 3 min per glacier using TM and 7-10 min per glacier using the higher-resolution datasets, which is about 100-300 times slower. Of course, the automatically derived outlines need to be edited and this extra work is already included in the full manual digitization. However, depending on the region, only a small percentage of glaciers might require editing, so automated mapping will still be much faster in these regions.
In a quantitative sense, automated mapping is at least as accurate as manual digitization, as the differences from a reference value are very similar to the precision of the manual digitizations (as expressed by their standard deviations). However, glacier area is systematically a few per cent smaller in most cases, hinting at mixed pixels along the glacier perimeter that are omitted in the automated mapping but are considered during manual digitization. Of course, the reference value can also be too large compared to reality, but the comparison with the validation dataset from Ikonos also reveals slightly smaller areas with TM. We thus recommend selecting a threshold for the band ratio as low as possible (i.e. before the number of misclassified individual pixels increases) for the automated techniques to properly include most of the often slightly dirty glacier ice around the perimeter of a glacier, and also carefully checking the boundary of seemingly clean glaciers.
For an improved interpretation of debris-covered glacier parts (beyond what can be achieved from the original image), we recommend checking with potentially available high-resolution remote-sensing data as available in Google EarthTM or similar tools providing access to these data. Even if these images have not been acquired at the same date, they might assist the visual interpretation. Several semiautomated techniques for mapping debris-covered glaciers have been proposed (e.g. Reference Paul, Huggel and KaabPaul and others, 2004; Reference Shukla, Arora and GuptaShukla and others, 2010; Reference Bhambri, Bolch and ChaujarBhambri and others, 2011), but they all require more complex processing, an accurate DEM and final manual editing. Ultimately, coherence images from microwave sensors taken in summer seem to provide the possibility of accurately identifying glacier parts under debris cover (e.g. Reference Atwood, Meyer and ArendtAtwood and others, 2010; Reference Frey, Paul and StrozziFrey and others, 2012; Strozzi and others, 2012). As a more general recommendation we suggest mapping glaciers automatically with one of the well-established methods (e.g. a simple band ratio with a threshold) whenever possible, and restricting manual digitization to the careful correction of errors (e.g. debris cover, shadow).
It is likely not feasible to perform a multiple digitization experiment as illustrated here for each glacier change study using manually or automatically derived glacier outlines from remote-sensing data. However, given the limited availability of reference datasets, the lack of contrast in natural colour images (from high-resolution sensors), and based on the results of this study, we recommend that each study on that topic should select a few (five to ten) differently sized glaciers (with and without debris cover) and digitize them three to five times. The standard deviation of such an assessment provides the analysts’ internal precision that can be used as a measure of accuracy in any analysis related to glacier size, including determination of the significance of measured changes. Considering the one-pixel variability of the outline position for clean ice, a rough estimate of the precision can be calculated by buffering the area by one pixel and calculating the relative change in glacier size.
6. Conclusions
We have presented a comparison of manually and automatically derived glacier outlines using high- (∼1 m) and medium-resolution (30 m) datasets. Results were provided by all co-authors of this study and are seen as a representative assessment of the common challenges in glacier delineation and the accuracy and precision that can be achieved. Our main conclusion is that automated mapping of clean glacier ice is at least as accurate as manual digitization, but glacier sizes tend to be a few per cent smaller than the reference datasets. Automated mapping has the clear advantages of being much faster, not generalized and generating reproducible results, i.e. the same threshold values always generate the same outlines. Manual digitization should thus focus on the correction of automatically derived outlines to cope with the typically problematic issues such as debris cover or ice in shadow. High-resolution data should be used whenever possible to aid in the interpretation of debris-covered areas and other critical regions. However, when using such high-resolution data as a base for a digitization, the precision of the derived glacier area is not necessarily higher (e.g. due to low contrast or difficult interpretation). As a measure of the accuracy of manually corrected glacier outlines in the absence of reference data, we recommend performing the multiple digitizing of a couple of glaciers (different size, with and without debris) and calculating the precision from the standard deviation of the digitizations. This measure is also appropriate to assess the significance of any derived relative changes in glacier size.
Author Contribution Statement
F.P. led the study and the writing of the paper. All co-authors contributed their round-robin results and helped in writing the paper.
Acknowledgements
This study was performed as part of the ESA project Glaciers_cci (4000101778/10/I-AM). This work was also supported by funding from the ice2sea programme of the European Union 7th Framework Programme, grant No. 226375. This is ice2sea contribution No. 093. We thank both anonymous reviewers for helpful comments.



