


Introduction
The use of glufosinate-ammonium (GA) has increased substantially in the United States over the past decade. Between 2010 and 2018, following the introduction of GA-resistant soybean [Glycine max (L.) Merr.] varieties, total use of GA-based products increased from less than 2.3 million kg ai in 2010 to more than 4.5 million kg ai after 2016 (USGS 2018), of which most GA applications have been concentrated in the midwestern and southern regions (Baker and Stone Reference Baker and Stone2015), where soybean and corn (Zea mays L.) production are more prominent. Inconsistent weed control with GA has been frequently reported in recent years, often raising concern whether this variability is solely due to environmental conditions and other factors such as weed size at application, or if it signals the evolution of GA resistance in weed populations.
GA is a nonselective, postemergence herbicide with rapid activity leading to the onset of visible symptoms within hours of application. The primary mode of action of GA is the inhibition of glutamine synthetase (GS, EC 6.3.1.2). The inhibition of GS following GA application leads to ammonia accumulation, followed by a feedback inhibition of photorespiration, which results in the generation of reactive oxygen species, particularly hydrogen peroxide. The resulting oxidative stress triggers lipid peroxidation, which affects membrane integrity and ultimately causes cell death (Takano et al. Reference Takano, Beffa, Preston, Westra and Dayan2019, Reference Takano, Beffa, Preston, Westra and Dayan2020a). Despite its rapid activity, some physicochemical properties of GA can substantially affect its performance. GA is a highly hydrophilic compound and has a low octanol–water partition coefficient (log Kow ≈ −4.5; log P ≈ −5.0), which limits its ability to passively enter lipid membranes and restrict systemic movement (Brown and Farenhorst Reference Brown and Farenhorst2024). Unlike glyphosate, which despite similar hydrophilic properties (log Kow ≈ −3.5; log P ≈ −4.6) is efficiently transported via the phloem through phosphate transporters, GA lacks an efficient transmembrane transporter (Brown and Farenhorst Reference Brown and Farenhorst2024; Okada et al. Reference Okada, Coggan, Anumol, Clarke and Allinson2019; Takano et al. Reference Takano, Beffa, Preston, Westra and Dayan2020b). As a result, GA is primarily translocated through the xylem via the apoplast and driven by transpiration streams (Takano et al. Reference Takano, Beffa, Preston, Westra and Dayan2020b).
Because of limited translocation, thorough foliar coverage is essential for adequate weed control with GA. However, even with adequate coverage, environmental conditions such as light intensity, relative humidity, and temperature can greatly influence the efficacy of GA in the field. Light is essential for hydrogen peroxide production in photosynthetic light reaction centers, which is critical for GA-induced phytotoxicity and GS expression and abundance (Takano and Dayan Reference Takano and Dayan2021). A recent study by Landau et al. (Reference Landau, Bradley, Burns, DeWerff, Dobbels, Essman, Flessner, Gage, Hager and Jhala2025) using random forest models trained on more than 10,000 field trials demonstrated that under low solar radiation conditions, the probability of successful control of waterhemp [Amaranthus tuberculatus (Moq.) Sauer], morningglory species (Ipomoea spp.), and giant foxtail (Setaria faberi Herrm.) was negatively impacted. Relative humidity can affect herbicide absorption, especially shortly before or after GA application (Landau et al. Reference Landau, Bradley, Burns, DeWerff, Dobbels, Essman, Flessner, Gage, Hager and Jhala2025; Ramsey et al. Reference Ramsey, Stephenson and Hall2006). Under elevated relative humidity conditions, the drying time of GA droplets is extended, which increases foliar uptake, and the cuticle is more hydrated, leading to greater absorption of hydrophilic compounds such as GA (Coetzer et al. Reference Coetzer, Al-Khatib and Loughin2001). Temperature is another important factor pertaining to GA’s effect on plant metabolic processes and herbicide translocation. Typically, studies point to an increased basipetal translocation of GA at warmer temperatures, while most of the herbicide tends to be translocated to the tip of the leaves at cooler temperatures (Kumaratilake and Preston Reference Kumaratilake and Preston2005). Current recommendations emphasize applying GA under high temperature and high humidity conditions to maximize efficacy (Lingenfelter Reference Lingenfelter2024; Preston Reference Preston2024; Singh et al. Reference Singh, Sarangi, Stahl, Ikley and Peters2024).
In addition to environmental factors, morphological aspects of different weed species and weed size at the time of application can influence their sensitivity to GA (Steckel et al. Reference Steckel, Wax, Simmons and Phillips1997). The label recommended size for GA to effectively control Amaranthus species is 10 cm or less, with larger plants (>15 cm) requiring higher rates (Anonymous 2024) and sequential applications to achieve desirable control. The type of weed (e.g., broadleaf vs. grass species) also plays a role in GA efficacy (Haarmann et al. Reference Haarmann, Young and Johnson2020; Meyer and Norsworthy Reference Meyer and Norsworthy2020). For instance, eudicot species are generally more susceptible to GA than monocot species due to differences in leaf morphology and cuticle composition (Takano and Dayan Reference Takano and Dayan2020). Furthermore, some weed biotypes may reduce GA efficacy through variation in architectural traits, such as the rate of axillary bud development. These buds, often located near the plant base, may escape herbicide contact and facilitate regrowth after treatment, which is frequently observed following field applications of GA.
To date, resistance to GA has been confirmed in six weed species (Heap Reference Heap2026). Among these, Palmer amaranth (Amaranthus palmeri S. Watson) is the only eudicot species confirmed to have evolved resistance to GA (Jones et al. Reference Jones, Dunne, Cahoon, Jennings, Leon and Everman2024; Noguera et al. Reference Noguera, Porri, Werle, Heiser, Brändle, Lerchl, Murphy, Betz, Gatzmann, Penkert, Tuerk, Meyer and Roma-Burgos2022; Priess et al. Reference Priess, Norsworthy, Godara, Mauromoustakos, Butts, Roberts and Barber2022). In two of the three documented GA-resistant A. palmeri cases, resistance was conferred by overexpression of the GS target gene through an interesting mechanism involving extrachromosomal circular DNA (Carvalho-Moore et al. Reference Carvalho-Moore, Norsworthy, González-Torralva, Hwang, Patel, Barber, Butts and McElroy2022, Reference Carvalho-Moore, Borgato, Cutti, Porri, Meiners, Lerchl, Norsworthy and Patterson2025; Noguera et al. Reference Noguera, Porri, Werle, Heiser, Brändle, Lerchl, Murphy, Betz, Gatzmann, Penkert, Tuerk, Meyer and Roma-Burgos2022, Reference Noguera, Albert, Saski, Birchler, Porri, Meiners, Lerchl and Roma-Burgos2024). While resistance to GA in A. tuberculatus has not yet been confirmed, increasing reports of reduced GA efficacy in Illinois populations warrant investigation. In this study, we evaluated A. tuberculatus populations with reported reduced sensitivity to GA from four Illinois counties using greenhouse and field experiments to investigate potential resistance to GA. In additional greenhouse experiments, we also assessed the response of these populations to herbicides with different sites of action (SOAs). Finally, we examined variation in GS coding sequences and constitutive transcriptome profiles to gain initial insights into potential mechanisms underlying reduced sensitivity to GA in these populations.
Materials and Methods
Plant Materials
Seeds were collected from fields reporting failure to control A. tuberculatus with labeled rates of GA in Carroll (CAR), Kankakee (SDY), McLean (M01), and Franklin (FRA) counties in Illinois between 2022 and 2024 (Figure 1). Two susceptible populations, WUS (Brown County, OH; GRIN ID: PI 698378) and BRC (SIU Belleville Research Center, St Clair County, IL), were included in the transcriptomics study, and only WUS was included in the greenhouse dose–response studies. To reduce heterogeneity of the suspected resistant populations, we crossed individuals from each suspected resistant population that had survived GA at the field recommended rate (654 g ai ha⁻¹; Liberty® 280 SL herbicide, BASF) under greenhouse conditions. For each population, one male and at least three female survivors were placed in an enclosed environment to allow for cross-pollination. Seeds were collected separately from each female plant and screened a second time with GA at the same rate. Seeds derived from females with the most homogeneous survival response in the second screening were pooled in equal proportions to generate uniform resistant populations used in all subsequent greenhouse experiments.
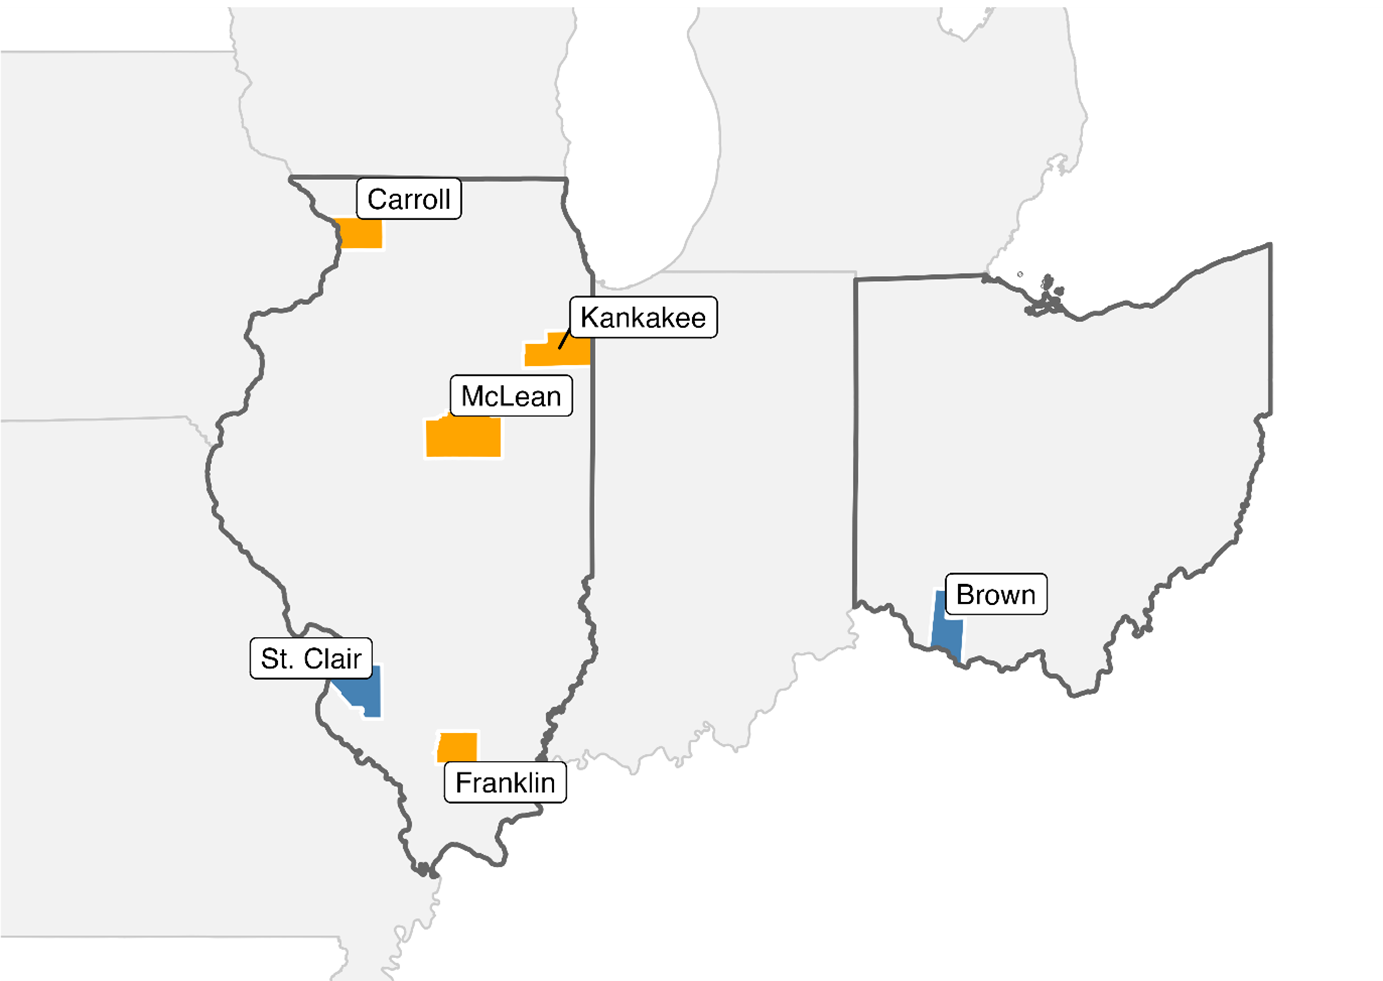
Map showing the geographic distribution of Amaranthus tuberculatus populations used in this study. Suspected resistant populations were collected from Carroll (CAR), Kankakee (SDY), McLean (M01), and Franklin (FRA) counties in Illinois. The susceptible populations BRC and WUS were collected from St Clair County, IL, and Brown County, OH, respectively. Counties where suspected resistant populations originated are shown in orange, and susceptible populations in blue.

Greenhouse Conditions
Greenhouse studies for the CAR, SDY, and M01 populations were conducted at the University of Illinois Plant Care Facility (PCF), while those for the FRA population were carried out at the Southern Illinois University Horticultural Research Center (HRC), with slight variations in greenhouse conditions, soil type, and fertilization regimes between the two sites. For all experiments described herein, greenhouse conditions at the PCF were maintained under a 16-h photoperiod, with supplemental extended-spectrum white LED lighting used to extend daylength. The supplemental lighting provided a photosynthetic photon flux density (PPFD) of 1,000 µmol m⁻2 s⁻¹ and was automatically deactivated when outside solar irradiance exceeded 600 W m⁻². Daytime temperatures ranged from 28 to 30 C and nighttime temperatures from 24 to 26 C. Relative humidity ranged from 30% to 63% during the day and from 38% to 64% during the night. A custom sandy loam potting mix containing 70% sand, 15% silt, 15% clay, and 7% organic matter, with a pH of 6.3, was used for all experiments at the PCF. At the HRC site, greenhouse conditions were maintained under a 16-h photoperiod, with supplemental lighting provided by 1,000-W high-pressure sodium fixtures. PPFD was not recorded at this facility, because light-intensity monitoring was not available. Daytime temperatures ranged from 25 to 40 C and nighttime temperatures from 20 to 27 C. Relative humidity ranged from 37% to 74% during the day and from 60% to 88% during the night. A potting mix containing approximately 75% to 85% peat moss organic matter and 10% to 20% perlite, with a pH range of 4.5 to 6.0, was used for all experiments at the HRC.
Greenhouse Dose–Response Studies
Whole-plant dose–response assays were conducted to evaluate the responses of the suspected resistant populations CAR, SDY, M01, and FRA to GA. The susceptible population WUS was included for comparison in dose–response studies at both locations. Unless otherwise noted, the experimental procedures described herein were consistent across both facilities. Seeds from each population were sown into 164-cm3 containers containing a custom potting mix and maintained in a greenhouse as previously described. The experiments followed a completely randomized design (CRD), with seven replications per treatment, and were repeated once over time. Plants were treated with GA (Liberty® ULTRA herbicide, BASF) at 0, 139, 209, 312, 469, 702, 1,054, and 1,581 g ai ha⁻¹. All treatments included ammonium sulfate (AMS) at 2.5% of the application volume.
For greenhouse-based experiments, herbicide treatments were applied using spray chambers equipped with 80015 EVS nozzles (TeeJet® Technologies, Glendale Heights, IL, USA), calibrated to deliver 187 L ha⁻¹ at 207 kPa. Applications were made when A. tuberculatus plants reached 7.5 to 10 cm in height. All GA treatments were applied between 12:00 and 1:30 PM.
At 21 d after application (DAA), plant survival was recorded as 0 (dead) or 1 (alive). Aboveground biomass was harvested separately for each plant, oven-dried at 40 C for 5 d at PCF and at 60 C for 3 d at HRC, and then weighed.
Field Study
A field dose–response study was conducted at the original collection site of the CAR population in Carroll County, IL. The experiment followed a randomized complete block design with three replications per treatment and was conducted during a single growing season in 2025. Individual plots measured 3 m by 9 m. The field location was planted with corn, and the entire field received a preemergence application of isoxaflutole + flufenacet + thiencarbazone-methyl (511 g ai ha⁻¹; Trivolt™, Bayer CropScience LP, St. Louis, MO, USA) and atrazine (1,120 g ai ha−1; Infantry™, GROWMARK, Inc., Bloomington, IL, USA).
On the day of the GA dose–response application, corn plants in the experimental area were flattened manually, and 10 to 15 A. tuberculatus plants between 7.5 and 12.5 cm in height were randomly selected and marked with a stake in each experimental plot. Treatments applied to the CAR population included 0, 186, 371, 742, 1,484, 2,968, and 5,936 g ha–1 of GA (Liberty® ULTRA herbicide, BASF). All treatments included AMS at 2.5% v/v. Herbicide applications were made using a CO2-pressurized backpack sprayer equipped with TT 110025 TeeJet® nozzles (TeeJet® Technologies) spaced 50 cm apart and calibrated to deliver 187 L ha−1 at 5.6 km h−1 and 248 kPa. At the time of application, air temperature was 31 C, the relative humidity was 71%, and the wind speed was 4.9 m s−1.
To evaluate the response of CAR to GA rates, visual assessments of A. tuberculatus control were made on an individual-plant basis for each tagged plant within plots at 6, 12, and 24 DAA, using a scale from 0% (no control) to 100% (complete control).
Dose–Response Statistical Analyses
To model the responses of A. tuberculatus populations to GA rates, two log-logistic regression models were fit. A three-parameter log-logistic model was used for plant survival, and a four-parameter log-logistic model was used for dry biomass. Both models were fit using the drc package (Ritz et al. Reference Ritz, Baty, Streibig and Gerhard2015) in R v. 4.5.2. The three-and four-parameter log-logistic models were:
three-parameter model (Equation 1):
four-parameter model (Equation 2):
where y is the response variable (survival or dry biomass); x is the herbicide rate; c is the lower asymptote; d is the upper asymptote; e is the effective herbicide rate causing a 50% response, corresponding to LD50 for survival and GR50 for dry biomass; and b is the slope around the inflection point.
Multiple Herbicide SOA Screening
In addition to dose–response assays, greenhouse experiments were conducted to assess the responses of each A. tuberculatus population to herbicides representing different SOA groups. At the PCF site, CAR, SDY, and M01 were screened with 2,4-D, atrazine, fomesafen, and glyphosate. At the HRC site, FRA and BRC populations were screened with 2,4-D, atrazine, fomesafen, glyphosate, lactofen, imazethapyr, and paraquat. Each herbicide was applied separately at 0.5×, 1×, and 3× the field-labeled rate (Supplementary Table S1). Each population and treatment combination had four to six replications, in which a replication consisted of an individual plant grown in a 10 mm by 10 mm by 7 mm (700-cm³) plastic pot. Experiments were arranged in a CRD. Screenings with the FRA population were conducted twice, and CAR, SDY, and M01 were tested in a single experimental run due to limited seed germination and availability. Detailed herbicide information and rates are provided in Supplementary Table S1.
Whole Transcriptome Sequencing
To investigate variation in constitutive gene expression among populations of A. tuberculatus, an RNA sequencing (RNA-seq) study was conducted. Progeny from field-collected seeds of the suspected resistant populations CAR, SDY, FRA, and M01 and the herbicide-susceptible populations WUS and BRC were grown under the previously described greenhouse conditions at the PCF. Tissue samples were collected before GA treatment from a single fully expanded leaf of each plant when plants were 7.5 to 10 cm in height. Leaf samples were frozen immediately in liquid nitrogen and stored at −80 C until RNA extraction. After tissue collection, plants were treated with the labeled rate of GA (654 g ha⁻¹; Liberty® 280 SL herbicide). At 21 DAA, plants were phenotyped for survival and classified as 0 (dead) or 1 (alive). For RNA-seq, only samples from plants in the suspected resistant populations that survived GA treatment and from plants in the susceptible populations (WUS and BRC) that were completely controlled by GA were submitted for sequencing. Four biological replicates were included for each suspected resistant population and each susceptible population.
Total RNA was extracted using a TRIzol-based protocol, and each sample was treated with DNase I to remove genomic DNA contamination (Simms et al. Reference Simms, Cizdziel and Chomczynski1993). Overall RNA quality was checked on a 1% agarose gel, and RNA concentrations were measured using a Qubit v. 4.0 Fluorometer (Thermo Fisher Scientific, Waltham, MA, USA). Libraries were sent to the Roy J. Carver Biotechnology Center, University of Illinois, and sequenced on an Illumina NovaSeq X Plus 10B platform, producing 150-bp paired-end reads. Sequencing data have been deposited in the NCBI Sequence Read Archive (SRA) under BioProject ID PRJNA1348745 (BioSamples SAMN2917128-SAMN2917151).
Sequencing Data Processing and Differential Gene Expression Analysis
Read quality was assessed with FastQC v. 0.12.0 (Babraham Bioinformatics 2019) and summarized using MultiQC v. 1.12 (Ewels et al. Reference Ewels, Magnusson and Lundin2016). Reads were aligned to an available A. tuberculatus reference genome (Raiyemo et al. Reference Raiyemo, Cutti, Patterson, Llaca, Fengler, Montgomery, Morran, Gaines and Tranel2024) using STAR v. 2.7.10b (Dobin et al. Reference Dobin, Davis, Schlesinger, Drenkow, Zaleski, Jha, Batut, Chaisson and Gingeras2013), and transcript quantification was performed with featureCounts v. 2.0.6 (Liao et al. Reference Liao, Smyth and Shi2014) from the Subread package. Raw transcript counts were converted to counts per million (CPM), and transcripts with fewer than 1 CPM in at least two samples per population were considered to have low expression and were removed from further analysis. Differences in sequencing depth between samples were accounted for using the trimmed mean of M-values normalization. Factor analysis on control samples was conducted for normalization of read counts using the unwanted variation (RUV) method using RUVSeq v. 1.36.0 (Risso et al. Reference Risso, Ngai, Speed and Dudoit2014).
Differential gene expression analysis was conducted using edgeR v. 4.0.16 (Robinson et al. Reference Robinson, McCarthy and Smyth2010), applying the quasi-likelihood framework within a generalized linear model. Differences in constitutive gene expression were first evaluated by comparing each suspected resistant A. tuberculatus population against each susceptible population, WUS and BRC, separately. Genes were considered significantly differentially expressed only if they met all three of the following criteria: (1) a false discovery rate (FDR) ≤ 0.05, (2) a minimum |log2 fold change| ≥ 1, and (3) consistent differential expression in comparisons against both susceptible populations.
Functional Annotation of Differentially Expressed Genes (DEGs) and Heat Map Analysis
DEGs that met the significance criteria described (FDR ≤ 0.05, |log2 fold change| ≥ 1, and consistent differential expression in comparisons against susceptible populations) were used for gene ontology (GO) functional enrichment analysis. Protein sequences of A. tuberculatus genes were submitted to eggNOG-mapper v. 2.1.12 (Cantalapiedra et al. Reference Cantalapiedra, Hernández-Plaza, Letunic, Bork and Huerta-Cepas2021) for functional annotation, and GO enrichment was conducted using the R package topGO v. 2.54.0 (Alexa and Rahnenführer Reference Alexa and Rahnenführer2023) with the classic Fisher’s exact test across biological process (BP), cellular component (CC), and molecular function (MF) categories. The gene universe consisted of all annotated genes associated with GO terms, and a node size filter of 10 was applied. P-values were corrected using the Benjamini-Hochberg procedure, and significantly enriched GO terms were recorded for each population.
For heat map visualization, a separate gene set was used to capture broader transcriptomic structure. Specifically, the 500 genes with the highest variance in normalized expression across all samples were selected, normalized counts were log2 transformed, and hierarchical clustering of genes and samples was performed using correlation-based distance metrics in the R package pheatmap v. 1.0.13 (Kolde and Kolde Reference Kolde and Kolde2015).
Identification of Glutamine Synthetase Homologs and Resistance Mutations
To identify mutations that may confer target-site resistance (TSR) to GA in the suspected resistant populations, RNA reads were used to screen for functionally relevant variants within the GS target genes. Genes encoding GS1 and GS2 were first identified by querying homologous GS coding sequences obtained from NCBI against the A. tuberculatus reference genome using BLASTn. Homologous GS genes were subsequently identified in smooth pigweed (Amaranthus hybridus L.) (Raiyemo et al. Reference Raiyemo, Montgomery, Cutti, Abdollahi, Llaca, Fengler, Lopez, Morran, Saski, Nelson, Patterson, Gaines and Tranel2025), Prince-of-Wales feather (Amaranthus hypochondriacus L.) (Lightfoot et al. Reference Lightfoot, Jarvis, Ramaraj, Lee, Jellen and Maughan2017), A. palmeri (Raiyemo et al. Reference Raiyemo, Montgomery, Cutti, Abdollahi, Llaca, Fengler, Lopez, Morran, Saski, Nelson, Patterson, Gaines and Tranel2025), redroot pigweed (Amaranthus retroflexus L.) (Raiyemo et al. Reference Raiyemo, Montgomery, Cutti, Abdollahi, Llaca, Fengler, Lopez, Morran, Saski, Nelson, Patterson, Gaines and Tranel2025), and Joseph’ s-coat (Amaranthus tricolor L.) (Wang et al. Reference Wang, Xu, Wang, Wang, Lei, Jiang, Yang, Yuan, Chen, Zhang and Fan2023). Protein sequences from the six Amaranthus species, together with sequences from quinoa (Chenopodium quinoa Willd.), common sowthistle (Sonchus oleraceus L.), foxtail millet [Setaria italica (L.) P. Beauv.], and rice (Oryza sativa L.), were aligned using MEGA v. 12.1 (Kumar et al. Reference Kumar, Stecher, Suleski, Sanderford, Sharma and Tamura2024). Phylogenetic trees were generated and visualized using Interactive Tree of Life (iTOL) v. 7 (Letunic and Bork Reference Letunic and Bork2024). Protein identifiers for genes obtained from NCBI and used in phylogenetic analysis are listed in Supplementary Table S2.
Variant calling was performed on the aligned reads using BCFtools v. 1.18 (Danecek and McCarthy Reference Danecek and McCarthy2017). Variants were normalized against the reference genome and filtered to retain only biallelic single-nucleotide polymorphisms (SNPs) with quality scores greater than 20. Functional effects of SNPs, including synonymous, missense, and splice-region variants were predicted with BCFtools. Missense variants identified in GS transcript reads were used to generate sample-specific protein sequences for each GS gene. Reference protein sequences were obtained from annotated genome protein FASTA files, and predicted missense substitutions were applied directly to the reference sequences at annotated positions using a custom Python script, resulting in one consensus protein sequence per sample per gene. Gene-specific protein FASTA files were aligned using CLC Sequence Viewer v. 8.0 (Qiagen Digital Insights 2018).
Results and Discussion
Failure to control A. tuberculatus populations with GA has been reported multiple times in recent years across Illinois farms, raising concerns about the potential evolution of resistance. Although escapes at the label recommended rate are often observed, resistance confirmation is challenging due to the significant effect of environmental conditions and weed size on the efficacy of GA, meaning that variable weed control can be expected if the label recommended conditions of temperature, light, humidity, and weed size are not ideal at application. According to the International Survey of Herbicide Resistant Weeds (Heap Reference Heap2005), confirmation of resistance requires the fulfillment of four criteria: (1) the weed population must meet the formal definition of resistance by the Weed Science Society of America (WSSA); (2) there should be differential responses between the suspected resistant and a known susceptible population of the same species across a wide range of herbicide rates; (3) the resistance heritability should be confirmed in the second generation; and (4) the weed species must be correctly identified. Based on these criteria, we conducted a series of field, greenhouse, and laboratory experiments to investigate four independent cases of GA control failure involving A. tuberculatus populations from Illinois fields.
Greenhouse Whole-Plant Dose–Response Assays
Initial greenhouse screenings carried out using progeny from field-collected seeds showed a range of 15% to 35% total survivorship among the suspected resistant populations compared with 5% or lower survivorship in the herbicide-susceptible WUS population (data not shown). A preliminary dose–response study using progeny from field-collected seeds revealed that CAR exhibited an approximately 2-to 4-fold greater survival rate relative to WUS (data not shown). These preliminary observations prompted the development of a second generation of each population by crossing resistant plants, and subsequent dose–response experiments were conducted to confirm resistance is heritable.
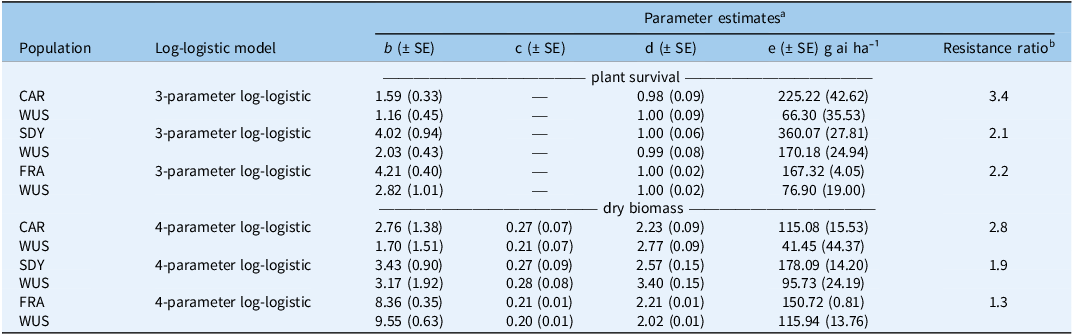
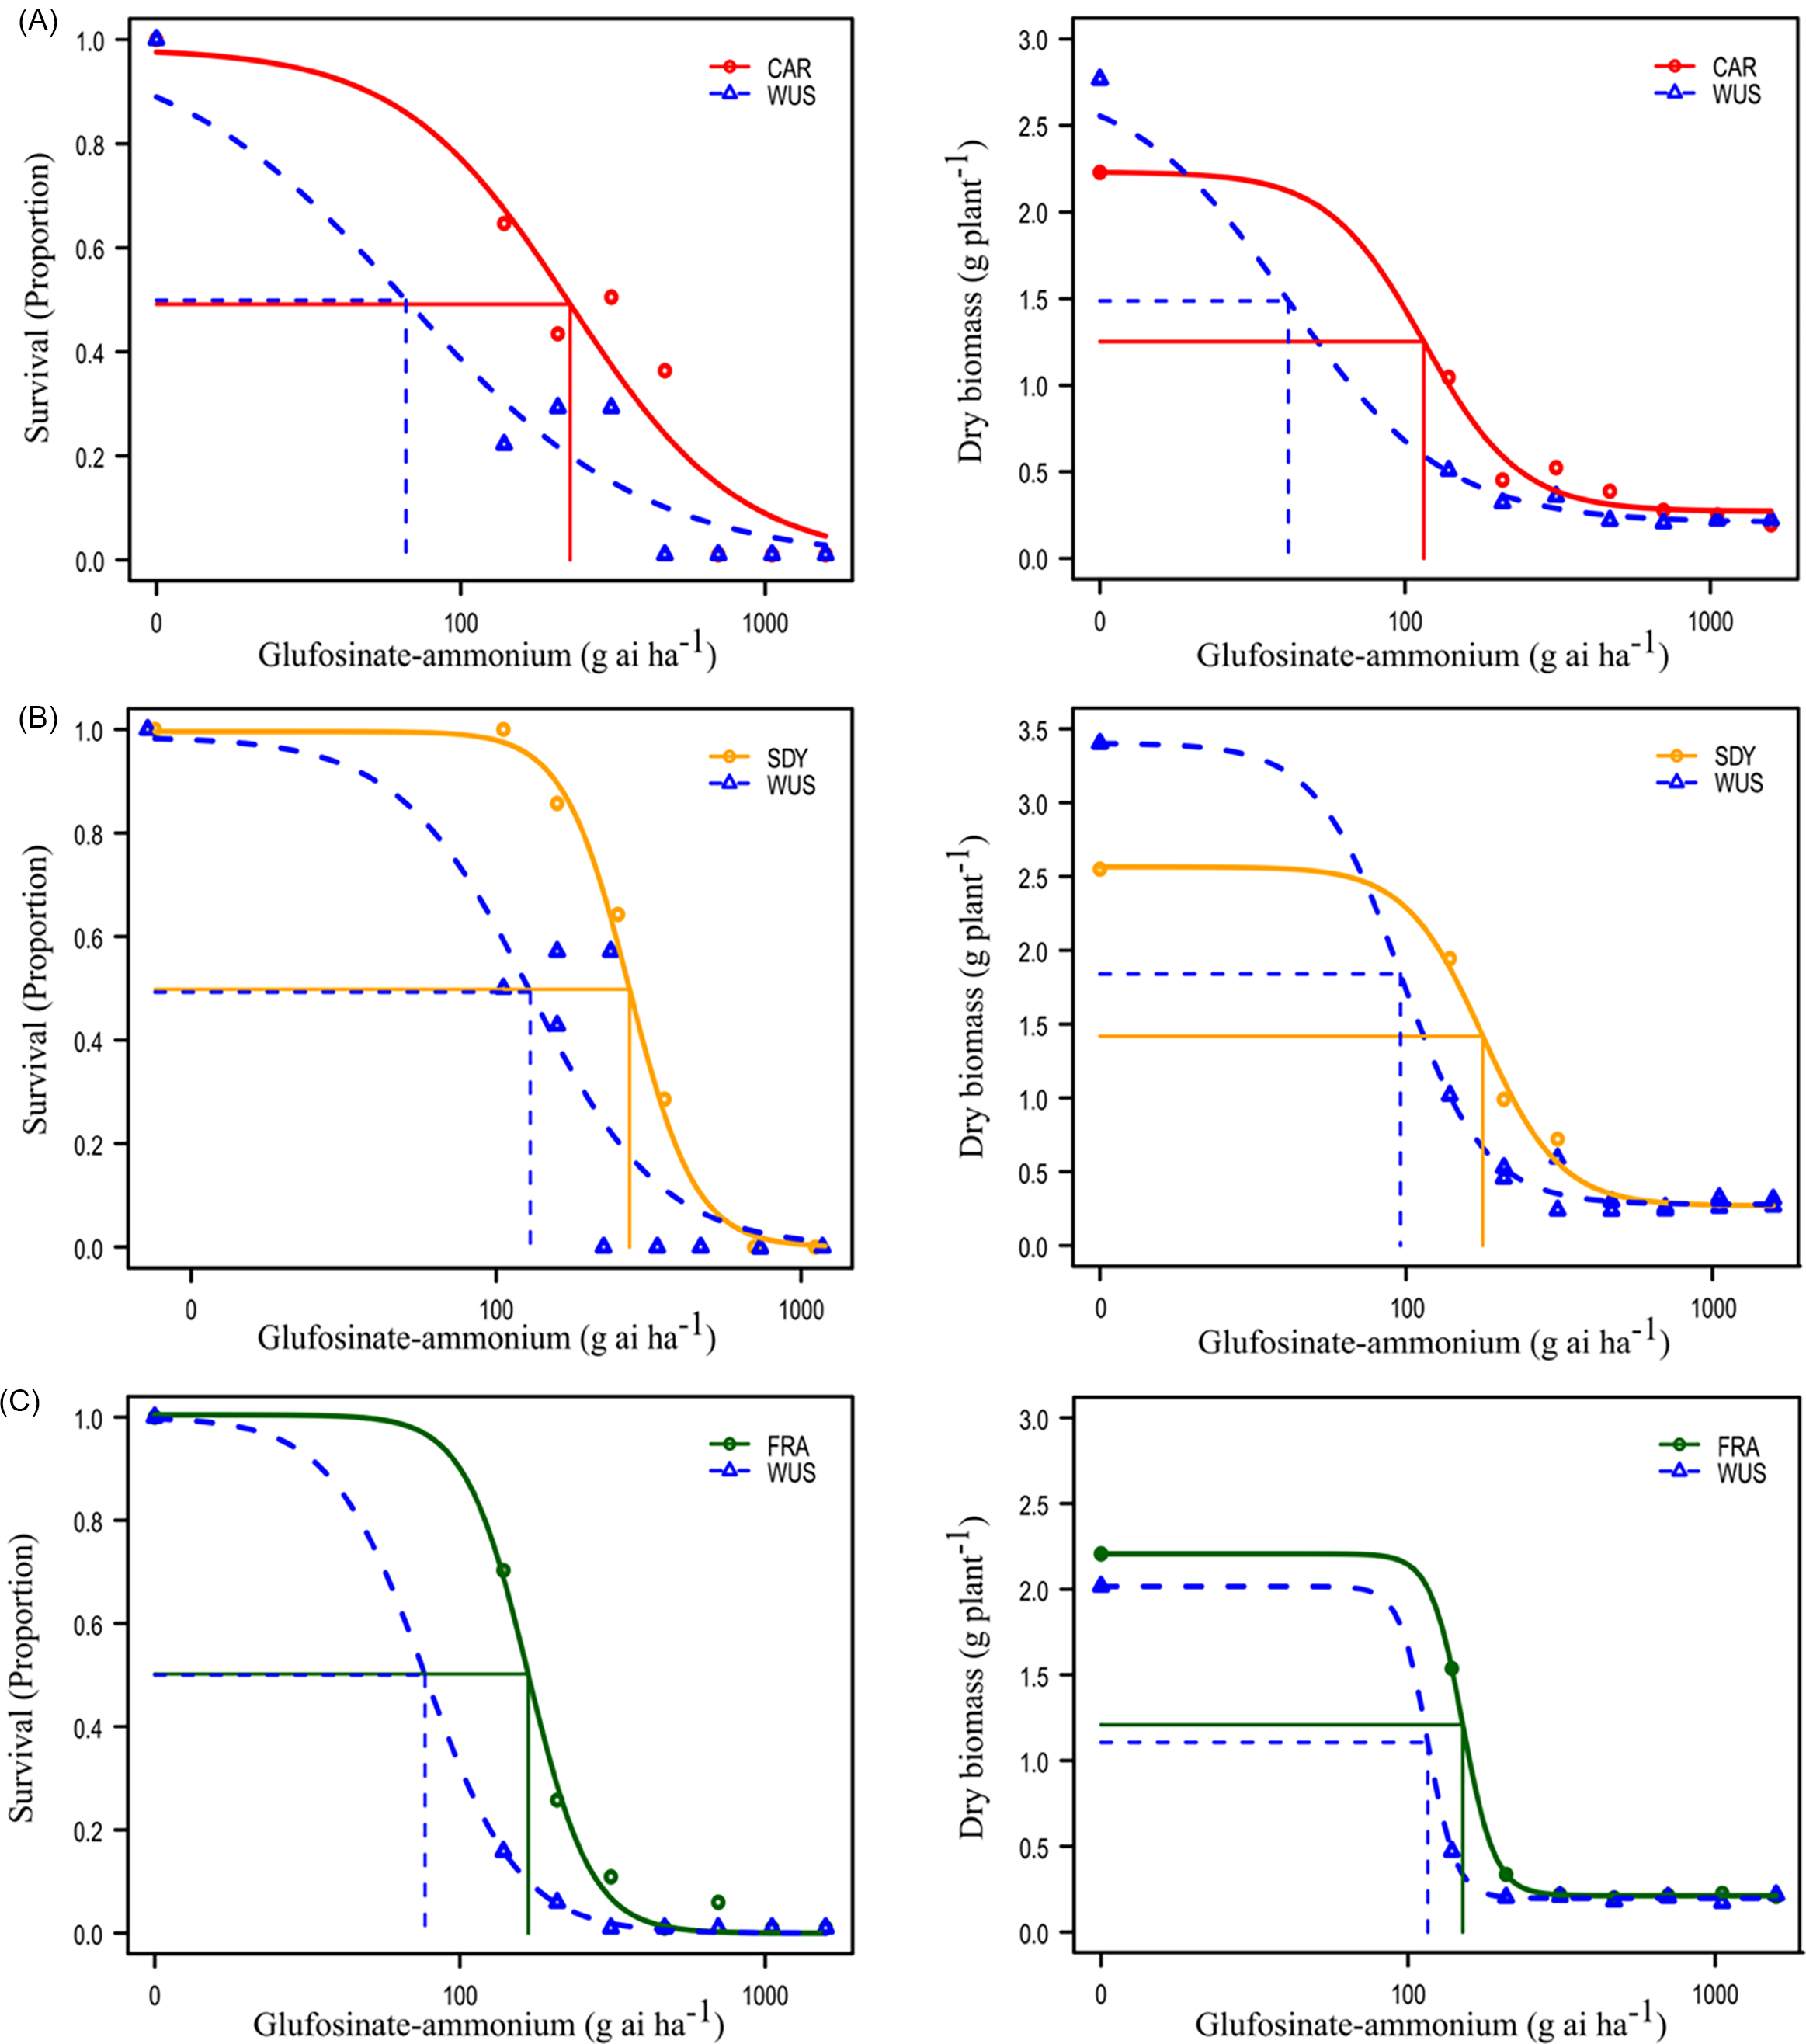
In these assays, susceptible WUS plants were completely controlled at 21 DAA by 371.1 g ha⁻¹ of GA (Table 1; Figure 2). The estimated GA rate required to reduce plant survival by 50% (LD50) in the WUS population ranged from 66.3 to 170.2 g ha⁻¹ of GA across experimental runs, and the rate required to reduce dry biomass of WUS plants by 50% (GR50) ranged from 41.5 to 115.9 g ha⁻¹ (Table 1). Based on plant survival, the estimated LD50 values were 225.2, 360.1, and 167.3 g ha⁻¹ of GA for CAR, SDY, and FRA populations, respectively (Table 1; Figure 2). Estimated GR50 values based on dry biomass were 115.1, 178.1, and 150.7 g ha⁻¹ of GA for CAR, SDY, and FRA populations, respectively. These represent a 3.4-, 2.1-, and 2.2-fold increase in LD50 for CAR, SDY, and FRA, respectively, and a 2.8-, 1.9-, and 1.3-fold increase in GR50, relative to the WUS population. The M01 population did not survive GA rates greater than 138.9 g ha⁻¹ across experimental runs, with only a few plants surviving at higher application rates; thus, a dose–response curve could not be reliably fit for this population. Among the suspected resistant populations evaluated, M01 was the most sensitive to GA in the dose–response assay. Nevertheless, preliminary screening showed that some M01 individuals survived treatment at 654 g ha⁻¹ GA (Supplementary Figure S1). On the basis of this preliminary evidence of survival at a discriminatory rate, M01 was retained for the RNA-seq study, as discussed later.
Parameter estimates from log-logistic regression models describing the responses of suspected resistant (CAR, SDY, and FRA) and susceptible (WUS) Amaranthus tuberculatus populations to glufosinate-ammonium (GA) in a greenhouse-based dose–response study 21 d after application.

a b is the slope around the effective rate, c is the lower asymptote, d is the upper asymptote, and e is the effective rate causing 50% mortality or biomass reduction.
b Resistance ratios were calculated as the ratio of the estimated e value for the suspected resistant population to that of the susceptible population WUS from the fitted log-logistic models.
Glufosinate-ammonium (GA) dose response of Amaranthus tuberculatus populations (A) CAR, (B) SDY, and (C) FRA, based on plant survival (left panels) and dry biomass per plant (right panels), compared with the herbicide-susceptible population (WUS). Vertical and horizontal lines indicate the estimated LD50 and GR50 values.

In the genus Amaranthus, GA resistance has only been documented previously in A. palmeri. In 2022, three A. palmeri populations from Arkansas were confirmed resistant to GA, with resistance ratios ranging from 5.1-to 27.4-fold relative to susceptible populations (Priess et al. Reference Priess, Norsworthy, Godara, Mauromoustakos, Butts, Roberts and Barber2022). In the same year, a GA-resistant A. palmeri population from Missouri was reported with LD50 values indicating a 4.1-fold resistance in the field-collected population and a 6.1-fold resistance reported in the progeny (Noguera et al. Reference Noguera, Porri, Werle, Heiser, Brändle, Lerchl, Murphy, Betz, Gatzmann, Penkert, Tuerk, Meyer and Roma-Burgos2022). More recently, an A. palmeri population from North Carolina exhibited LD50 values ranging from 1.5-to 2.3-fold compared with a susceptible population (Jones et al. Reference Jones, Dunne, Cahoon, Jennings, Leon and Everman2024). Although resistance ratios were lower in our experiments, the observation of reduced sensitivity in progeny derived from field populations compared with susceptible populations confirms that GA resistance is a heritable trait. Because GA resistance in A. palmeri is generally associated with target-site mechanisms that confer higher resistance levels, the comparatively lower resistance observed here may reflect quantitatively inherited non–target site resistance (NTSR). Under continued selection from GA applications, the frequency of resistance alleles could increase across generations, potentially leading to higher levels of phenotypic resistance in these populations.
Field Dose–Response Study
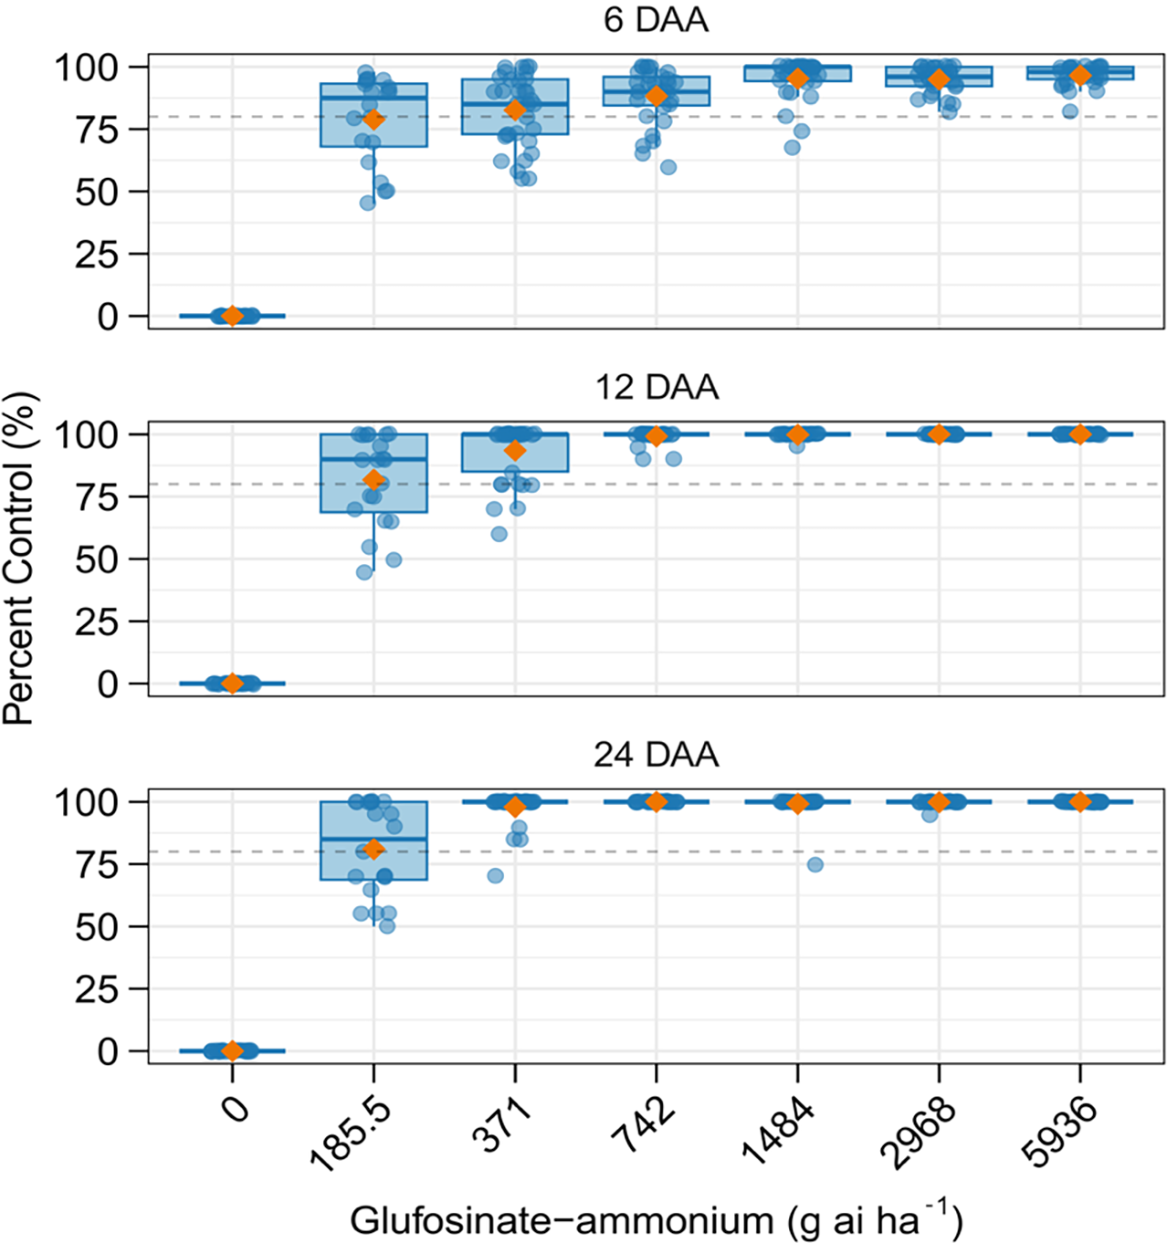
The efficacy of GA in field applications is strongly influenced by prevailing environmental conditions, which are not easily replicated in greenhouse studies. To evaluate the response to GA under field conditions, we performed a field study at the location where the CAR population was originally collected. Results showed that GA provided less than 90% control at 24 DAA when applied at one-half the labeled rate, and up to 20% of plants survived at the labeled rate (371.1 g ha⁻¹; Liberty® ULTRA herbicide) (Figure 3). Complete control was only achieved with GA at twice the labeled rate, consistent with greenhouse dose–response results, with a single escape at four times the labeled rate (Figure 3). Comparable reductions in control (<90%) are typically found with applications on larger Amaranthus spp. plants (>15 cm). In this study, treatments were applied to plants up to 12.5 cm under optimal environmental conditions, including high relative humidity (71%) and temperature (31 C) that are known to enhance GA efficacy. In addition, no shading from crop plants was present at the time of application, allowing for thorough coverage of A. tuberculatus plants. Although survival levels may appear low in a research context, they are sufficient to promote the spread of resistance in the subsequent growing seasons, particularly under continued GA selection pressure.
Box plots showing percent control of the suspected resistant Amaranthus tuberculatus population from Carroll County, IL, in response to increasing rates of glufosinate-ammonium (GA) in a field dose–response study at 6, 12, and 24 d after application (DAA). The vertical dashed line indicates the 80% control threshold. Blue points represent individual plants, and orange triangles denote the mean percentage of control at each herbicide rate.

Multiple Herbicide SOA Screening
To identify alternative management options for the suspected GA-resistant populations, each population was screened with multiple herbicides representing different SOA groups. Glyphosate reduced biomass by ≥70% in the CAR and SDY populations at the 1× rate or higher; however, biomass reduction in the M01 population was <50% at the 1× rate relative to the nontreated control (Supplementary Figure S2). The susceptible control, WUS, exhibited >80% biomass reduction at the 1× rate. Compared with BRC, the FRA population exhibited reduced sensitivity to glyphosate, with plants surviving all three application rates and complete control not achieved at any rate (Supplementary Figure S3). In A. tuberculatus, resistance to glyphosate was first reported in 2005 and is now present in 20 U.S. states (Heap Reference Heap2026). Typically, glyphosate resistance in Amaranthus spp. arises through amplification of the target gene encoding enolpyruvyl shikimate-3-phosphate synthase (EPSPS), and in Illinois, approximately 91% of glyphosate-resistant A. tuberculatus populations exhibit EPSPS gene amplification (Chatham et al. Reference Chatham, Wu, Riggins, Hager, Young, Roskamp and Tranel2015). Reduced glyphosate translocation and the Pro-106-Ser substitution in the EPSPS gene have also been reported in several A. tuberculatus populations, with some populations harboring both TSR and NTSR mechanisms (Murphy et al. Reference Murphy, Larran, Ackley, Loux and Tranel2019; Nandula et al. Reference Nandula, Ray, Ribeiro, Pan and Reddy2013).
For atrazine, CAR and SDY were the least affected, exhibiting relatively high biomass (>65%) compared with nontreated plants, with CAR surviving the 3× rate (Supplementary Figure S2). In contrast, biomass reduction for M01 and WUS exceeded 80% at the 1× rate. For the FRA population, complete control with atrazine was achieved only at the 3× rate (Supplementary Figure S3). Photosystem II (PSII)-inhibiting herbicides were the first SOA group for which A. tuberculatus evolved resistance (Anderson et al. Reference Anderson, Roeth and Martin1996). Resistance to PSII inhibitors can arise through a target-site mutation in the D1 protein, conferring high levels of resistance, or through glutathione S-transferase (GST)-mediated enhanced metabolic detoxification, which typically confers more moderate resistance (Evans et al. Reference Evans, O’Brien, Ma, Hager, Riggins, Lambert and Riechers2017).
CAR, SDY, and WUS exhibited >80% biomass reduction with fomesafen at the 1× rate, whereas M01 showed <65% biomass reduction at the same rate (Supplementary Figure S2). For the FRA population, complete control with the protoporphyrinogen oxidase–inhibiting herbicides fomesafen and lactofen was not achieved at any rate, although biomass was significantly reduced at the 3× rate (Supplementary Figure S3). Similarly, imazethapyr failed to control either FRA or BRC at any rate, consistent with the historically widespread resistance to acetolactate synthase–inhibiting herbicides in Illinois A. tuberculatus populations, given that BRC was originally collected in 2002.
CAR, SDY, and WUS biomass reduction ≥80% was observed at the 1× and 3× rates of 2,4-D, although lower biomass reduction was observed for SDY (70%) and M01 (50%) at the 1× rate (Supplementary Figure S2). For FRA and BRC, complete control was achieved at all application rates of 2,4-D and paraquat (0.5×, 1×, and 3×) (Supplementary Figure S3). Overall, these preliminary results suggest that several of the populations evaluated exhibited reduced sensitivity to herbicides across multiple SOA groups, although responses varied among populations. Management strategies should therefore be tailored to the populations present within individual fields. In this study, 2,4-D provided consistent control across most populations evaluated; however, field studies are needed to confirm these findings.
Transcriptomes of Amaranthus tuberculatus populations
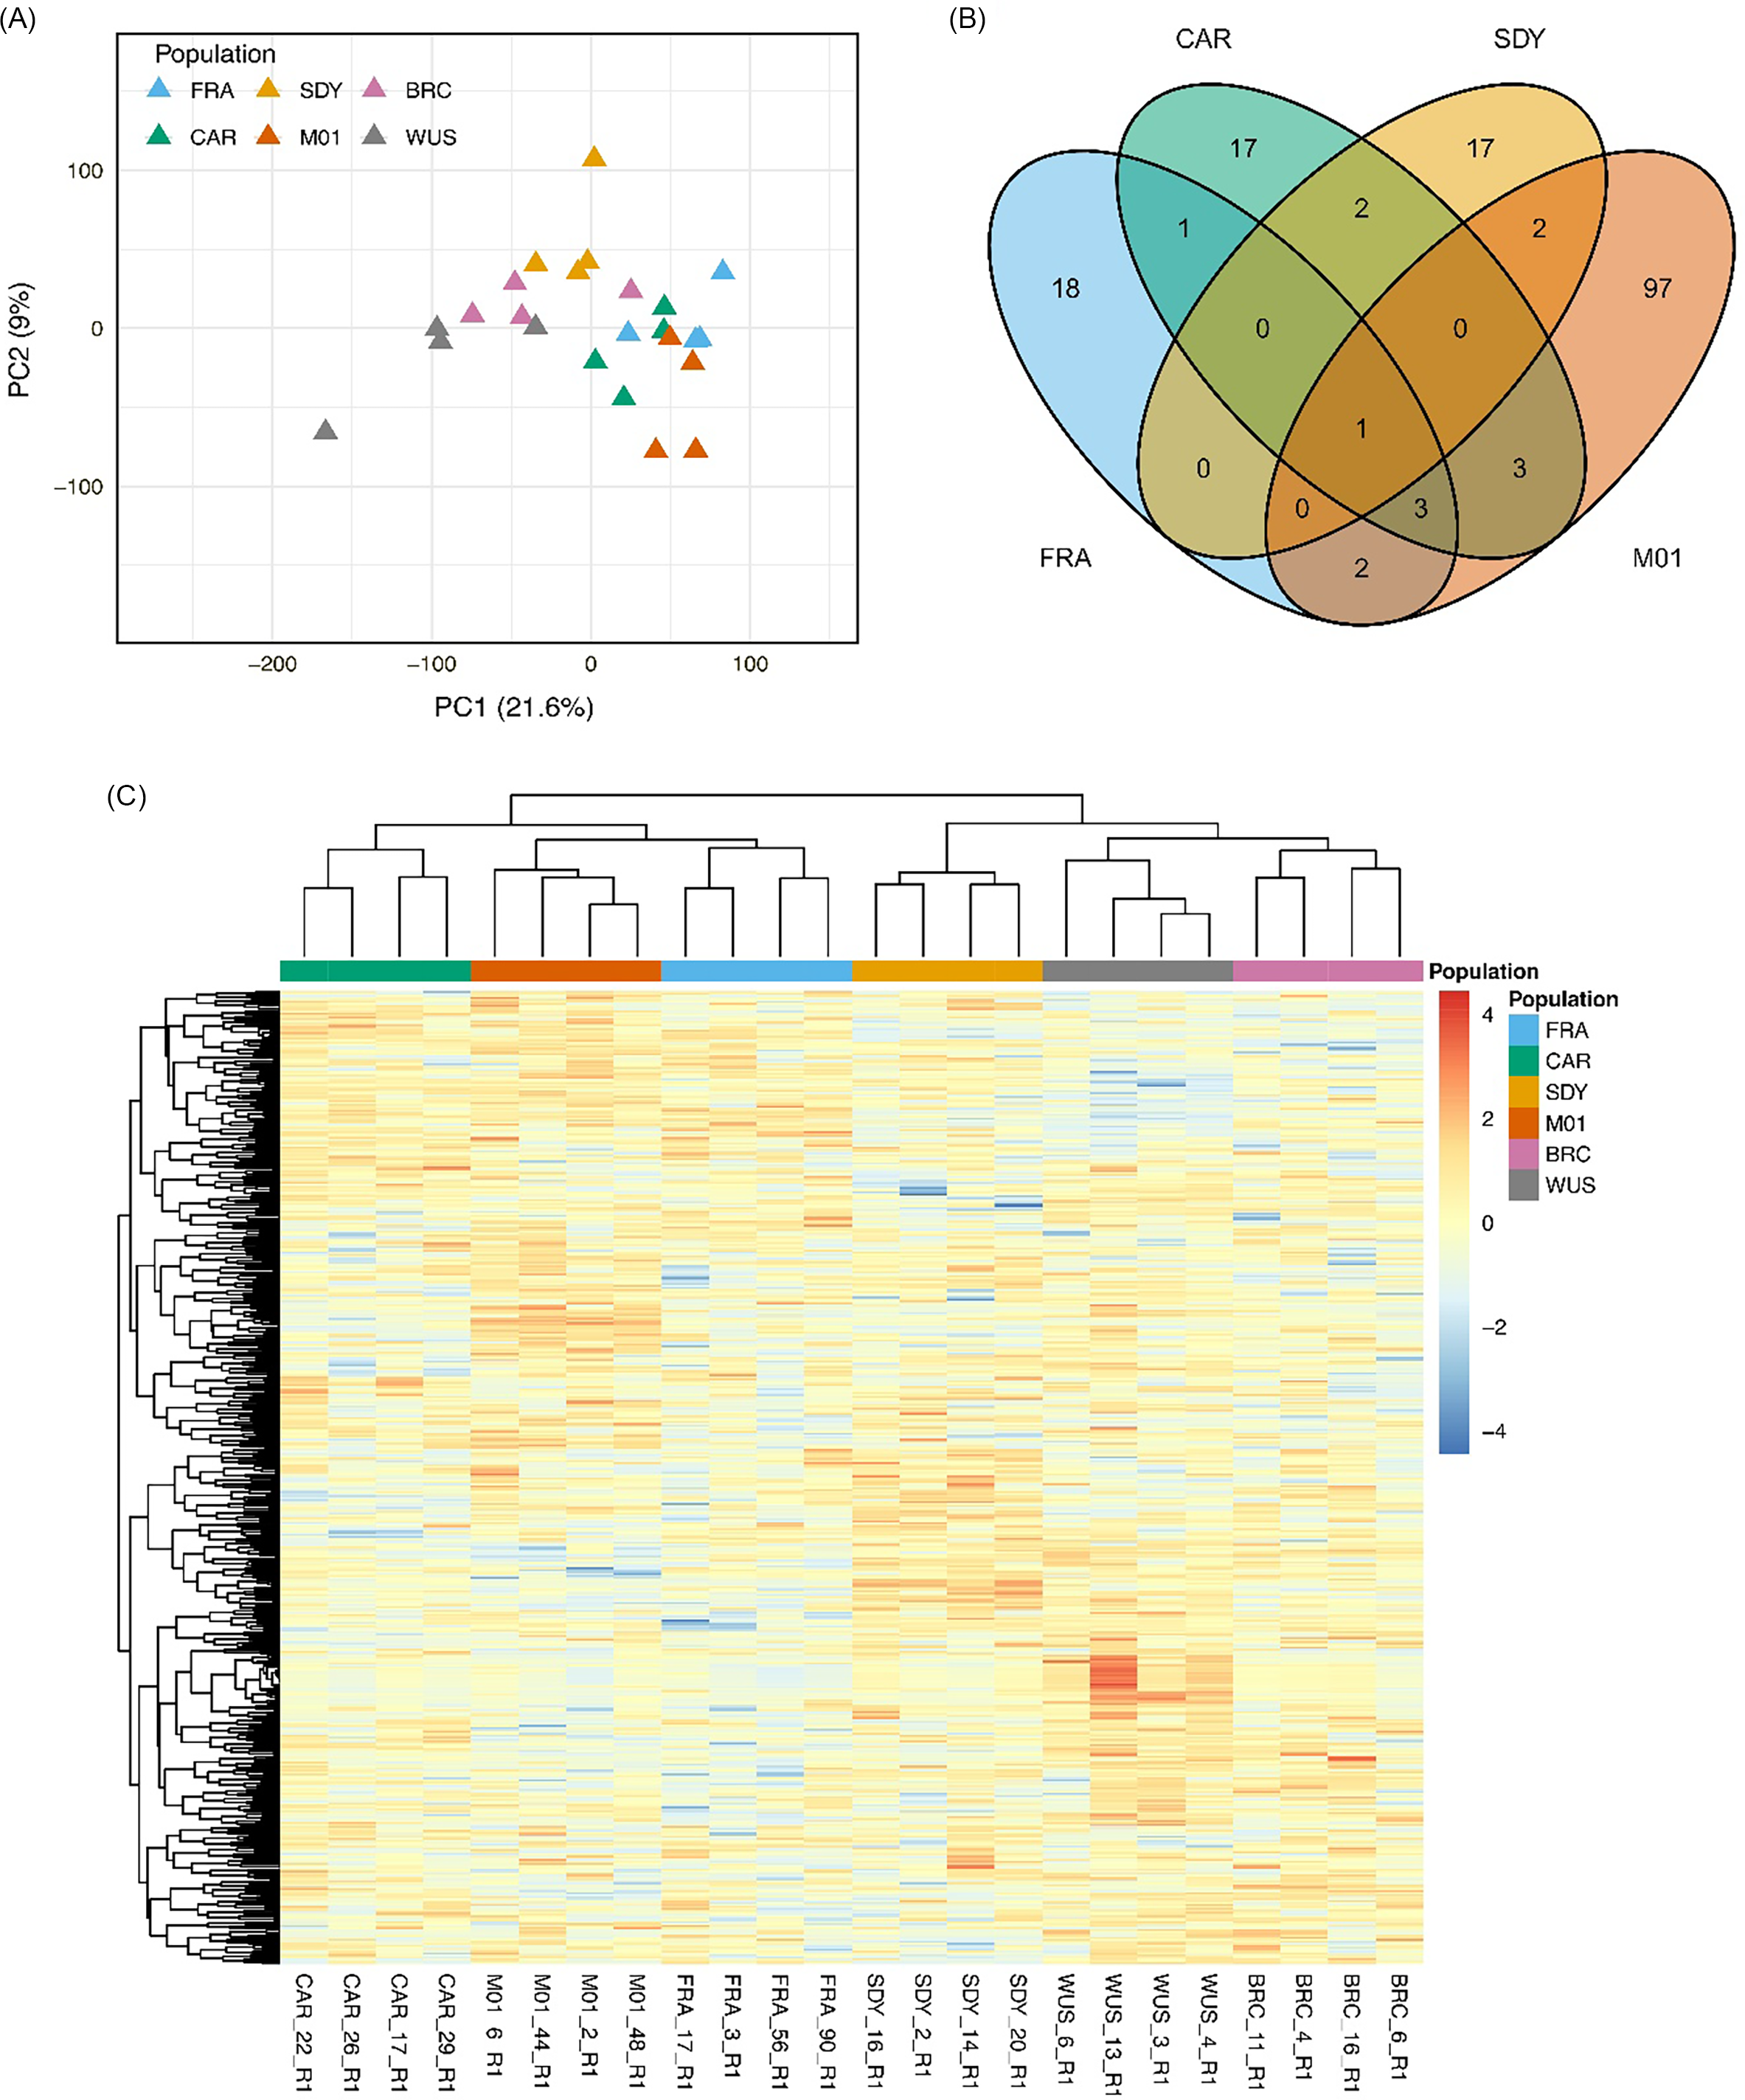
We next examined global transcriptome profiles to explore gene expression patterns potentially associated with resistance. Principal component analysis (PCA) of global transcriptome data showed clear separation of populations along PC1, which explained 21.6% of the total variance (Figure 4A). The susceptible populations (WUS and BRC) clustered together and were separated from the suspected resistant populations (CAR, SDY, FRA, and M01), indicating broad differences in overall gene expression profiles associated with resistance status. PC2 explained an additional 9.0% of the variance and captured further transcriptomic heterogeneity among populations, particularly within the suspected resistant group. Venn diagram analyses revealed that relatively few DEGs were shared among the suspected resistant populations (Figure 4B). Most DEGs were unique to individual populations, with only a small subset overlapping across two or more populations, indicating limited convergence at the individual gene level among the suspected resistant populations. Consistent with the PCA results, the heat map based on the 500 most variable genes across all samples showed that the susceptible populations WUS and BRC formed a distinct cluster despite originating from different states, suggesting that their similarity in expression patterns is unlikely to reflect geographic proximity (Figures 1 and 4C). The suspected resistant populations also showed broader similarity in transcriptomic structure, despite limited overlap in individual DEGs across populations. Together, these results indicate that convergence among suspected resistant populations is more evident at the level of overall expression patterns than at the level of specific shared DEGs. This pattern is consistent with coordinated shifts in broader transcriptomic states that might be associated with resistance, while the particular genes contributing to those shifts remain largely population specific.
Summary of gene expression profiles of suspected resistant Amaranthus tuberculatus populations (CAR, FRA, SDY, M01) and susceptible populations (WUS, BRC). (A) Principal component analysis (PCA) based on global transcriptome profiles. (B) Venn diagrams of shared differentially expressed genes (DEGs) among suspected resistant populations after comparison of each suspected resistant population with both susceptible populations. (C) Heat map of the 500 most variable genes across all samples, with hierarchical clustering based on expression profile similarity.

To explore candidate genes associated with GA resistance, we focused on DEGs consistently identified in comparisons with both WUS and BRC. The analysis revealed 268, 256, 503, and 618 DEGs when CAR, SDY, FRA, and M01 were compared with WUS, and 39, 44, 33, and 155 DEGs when compared with BRC, respectively (Supplementary Tables S3–S10). Restricting the analysis to shared DEGs in comparisons with both susceptible populations yielded 27 (CAR), 22 (SDY), 25 (FRA), and 108 (M01) genes (Figure 4B; Supplementary Table S11). One DEG (AmaTu_RefChr07g124540), annotated as a TolB-like protein, was consistently upregulated and shared across all four suspected resistant populations. Additional BLAST searches suggested similarity to WD40-like β-propeller proteins, a class of proteins commonly involved in mediating protein–protein interactions and associated with processes such as transcriptional regulation, stress responses, histone modification, and chromatin remodeling (Meng et al. Reference Meng, Su, Qu, Lu, Tao, Li, Zhang, Zhang, Liu, Cao and Jin2024; Shoeva et al. Reference Shoeva, Mukhanova, Zakhrabekova and Hansson2023; Suganuma et al. Reference Suganuma, Pattenden and Workman2008; Yuan et al. Reference Yuan, Leng, Zhang, Wang, Han and Wang2019). Additional DEGs shared among CAR, FRA, and M01 included an F-box phloem protein 2 (PP2; AmaTu_RefChr06g107540) that was upregulated in all three populations and a 30S ribosomal protein (AmaTu_RefChr08g132860) that was downregulated in all three.
Beyond these shared DEGs, each population had distinct sets of putative resistance-associated genes. In CAR, these included upregulated genes such as UDP-glycosyltransferases, glutaredoxin C9, 1-aminocyclopropane-1-carboxylate synthase/oxidase, and a WRKY transcription factor, as well as downregulated genes such as 4-hydroxy-tetrahydrodipicolinate synthase, 1-acyl-sn-glycerol-3-phosphate acyltransferase 5, and a MYC transcription factor. In addition to those, genes involved in stress signaling, as well as genes encoding structural proteins, were also identified (Supplementary Tables S3, S4, and S11).
In SDY, genes identified included upregulated genes such as GSTs, 12-oxophytodienoate reductase 3-like, 3-oxo-Delta(4,5)-steroid 5-beta-reductase-like, and a GLK1-like transcription factor, and downregulated genes including a cytochrome P450 (CYP82D47), and a MYC-like transcription factor (Supplementary Tables S5, S6, and S11). In FRA, interesting genes included an upregulated cytochrome P450 (CYP81E8) gene and several upregulated transcription factors (A-3-like, WRKY, and NF-X1-type zinc finger proteins) (Supplementary Tables S7, S8, and S11). Two upregulated cytochrome P450 genes were identified in M01, one also annotated as CYP81E8 but located on a different chromosome than the one identified in FRA, and a CYP71A26. An ABC transporter gene was also upregulated, as well as several other transporter and transcription factor genes that were differentially expressed in this population (Supplementary Tables S9–S11).
Cytochrome P450s, GSTs, and glycosyltransferases are frequently implicated in multigenic, metabolism-based herbicide resistance in weeds, and the presence of these gene families among the DEGs is consistent with such mechanisms in the A. tuberculatus populations in this study (Bobadilla and Tranel Reference Bobadilla and Tranel2024a; Concepcion et al. Reference Concepcion, Kaundun, Morris, Hutchings, Strom, Lygin and Riechers2021; Dimaano and Iwakami Reference Dimaano and Iwakami2021; Evans et al. Reference Evans, O’Brien, Ma, Hager, Riggins, Lambert and Riechers2017). The distinct set of DEGs among populations would suggest that different resistance mechanisms may underlie reduced GA sensitivity. Nevertheless, it should also be noted here that most of these populations appear to be resistant to other herbicide chemistries, as seen earlier with the SOA screening results. This could indicate that some of the identified resistance genes may not be directly linked to GA resistance but rather associated with resistance to other herbicides. For instance, the cytochrome P450 gene CYP81E8 identified in M01 has previously been implicated in resistance to 2,4-D in two A. tuberculatus populations, with phylogenetic evidence suggesting a shared evolutionary origin of the resistant alleles in these populations (Giacomini et al. Reference Giacomini, Patterson, Küpper, Beffa, Gaines and Tranel2020). Therefore, it is possible that some of the identified genes contribute to cross-resistance to GA. This scenario is not uncommon with multiple-resistant weed populations and could also explain why the populations in this study are now gradually evolving resistance to GA (Bobadilla and Tranel Reference Bobadilla and Tranel2024b), but this would have to be confirmed with future studies to confirm accumulation of resistance alleles in these populations.
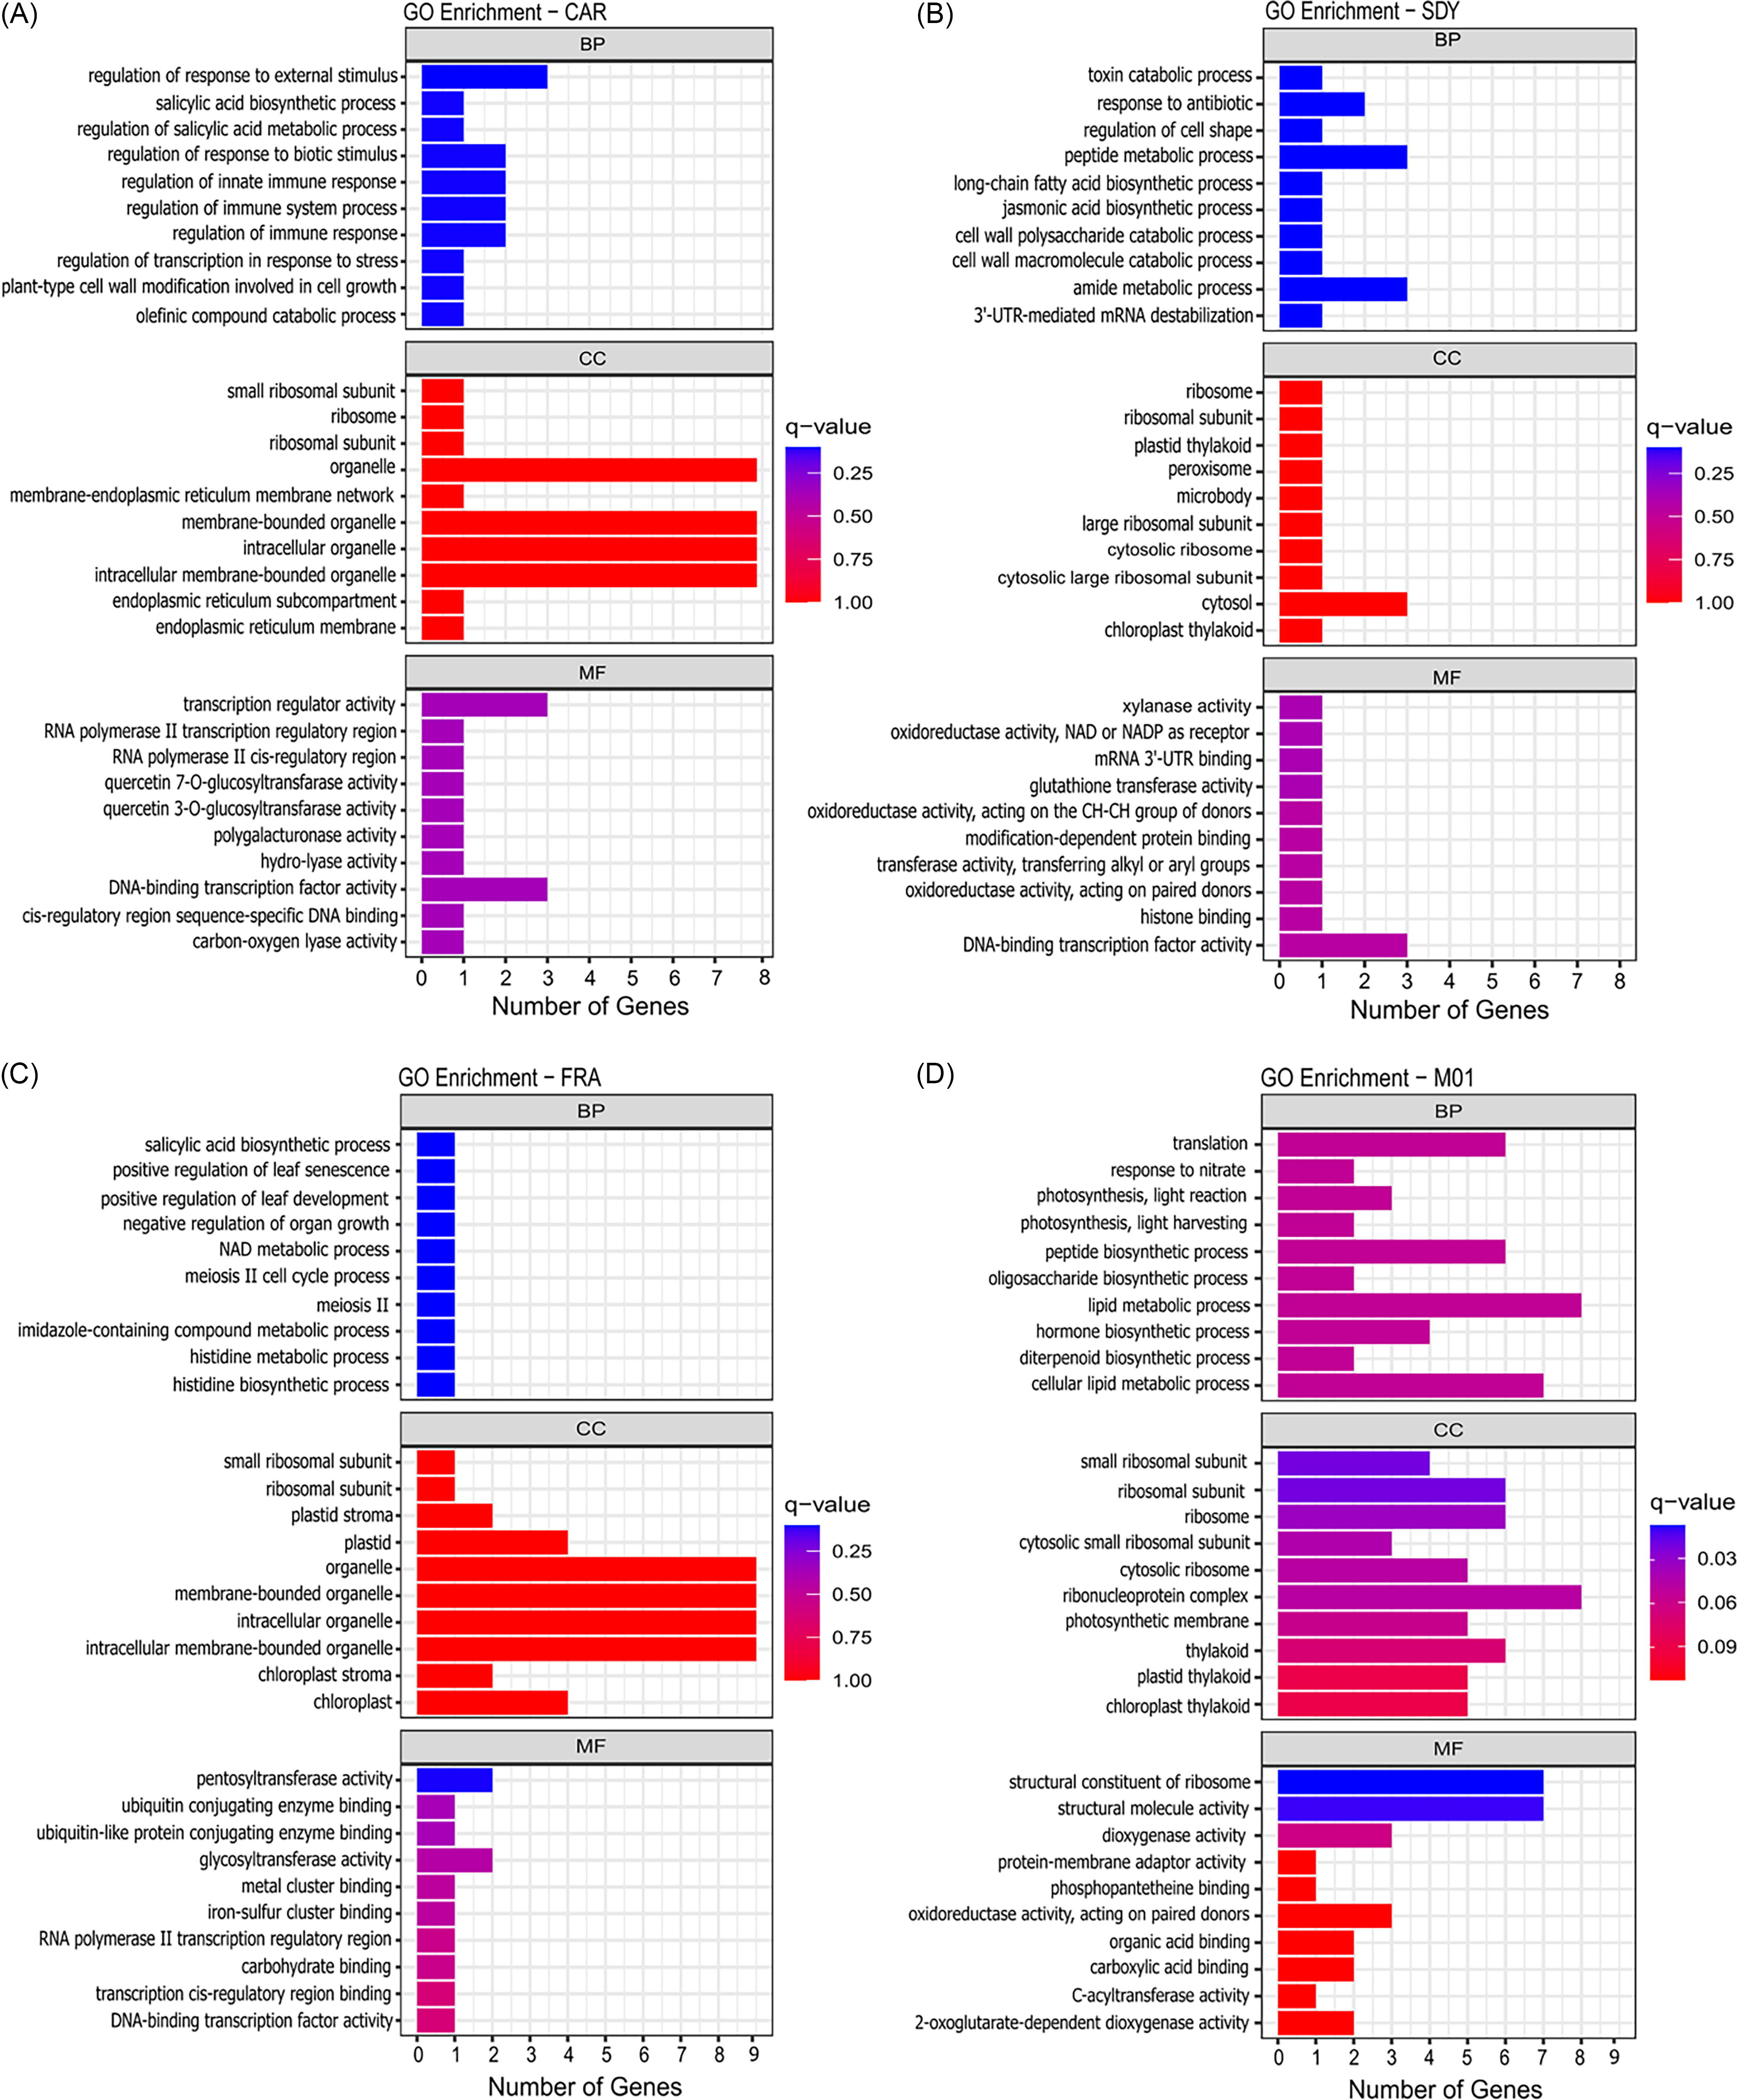
To gain additional insight into the molecular basis of resistance, we performed GO enrichment analysis of the DEGs for each population (Figure 5; Supplementary Tables S12–S15). In the CAR population, DEGs were enriched for stress response, defense regulation, and salicylic acid and abscisic acid metabolism. DEG products were predicted to be located in the cytoplasm, nucleus, ribosomes, and plastids, with functions spanning DNA/RNA binding, transcription regulation, and metabolic modifications. In SDY, genes were significantly associated with regulation of gene expression, including transcription factor activity, RNA binding, and mRNA stability. Genes also showed enrichment for secondary metabolism and stress-response pathways. The gene products were predicted to be located predominantly in the cytosol, ribosomal units, chloroplasts and plastids, and peroxisomes, which could indicate functions in photosynthetic processes and oxidative-related metabolism.
Gene ontology (GO) enrichment analysis of differentially expressed genes (DEGs) in suspected resistant Amaranthus tuberculatus populations, showing enriched biological process (BP), cellular component (CC), and molecular function (MF) terms for CAR (A), SDY (B), FRA (C), and M01 (D). DEGs met the criteria of FDR ≤ 0.05, |log2 fold change| ≥ 1, and consistent differential expression in comparisons with susceptible populations. Bar length indicates the number of genes associated with each GO term, and color intensity represents the q-value.

In FRA, DEGs were enriched for nitrogen and secondary metabolism, stress and defense signaling, and growth regulation, and were predicted to be located in the chloroplasts, plastids, and ribosomes. Functionally, these genes are likely involved in transcription regulation, protein modifications, and other enzymatic activities. In M01, enriched terms pointed to hormone, lipid, peptide, and secondary metabolism of other metabolites. Other enriched terms also indicate activity in translation and ribosomal processes, with most gene products being located in ribosomes and in the chloroplast. Overall, the molecular function of these genes appears to be related to molecule binding, catalytic processes, and molecule transport activities.
Identification of Glutamine Synthetase Homologues
A variable number of GS genes can be found in plant species. In diploid species, the cytosolic GS (GS1) is typically encoded by multiple genes, while the plastidic GS (GS2) is in general encoded by a single nuclear gene (Cánovas et al. Reference Cánovas, Ávila, Cantón, Cañas and de la Torre2007; Valderrama-Martín et al. Reference Valderrama-Martín, Ortigosa, Ávila, Cánovas, Hirel, Cantón and Cañas2022). However, some diploid species such as barrel medic (Medicago truncatula Gaertn.) harbor a second GS2 copy (Seabra et al. Reference Seabra, Vieira, Cullimore and Carvalho2010), and more recent studies also reported the presence of at least two GS2 copies in A. palmeri, with evidence suggesting that they can contribute differentially to GA resistance (Carvalho-Moore et al. Reference Carvalho-Moore, Borgato, Cutti, Porri, Meiners, Lerchl, Norsworthy and Patterson2025; Noguera et al. Reference Noguera, Porri, Werle, Heiser, Brändle, Lerchl, Murphy, Betz, Gatzmann, Penkert, Tuerk, Meyer and Roma-Burgos2022, Reference Noguera, Albert, Saski, Birchler, Porri, Meiners, Lerchl and Roma-Burgos2024). Similarly, in our study, two copies of GS2 were identified in A. tuberculatus (Supplementary Figure S4), and transcriptome data confirmed that both copies are expressed (Supplementary Figure S5). Preliminary transcriptomic evidence indicated that all four GS genes were expressed in A. tuberculatus. Although expression varied only modestly among populations, differences in transcript abundance among GS gene copies within individual samples were more apparent, including between the two GS2 copies (Supplementary Figure S5). To explore the number of GS2 copies in other Amaranthus species, we obtained GS1 and GS2 sequences of multiple species from publicly available genomic resources. Interestingly, the two plastidic GS copies (GS2.1 and GS2.2) were detected in all species except for A. hypochondriacus (Supplementary Figure S4). Given that the A. hypochondriacus assembly remains at the scaffold level, it is possible that additional GS copies exist in its genome but are unresolved in the current genome version. In all Amaranthus species having two GS2 copies, GS2.1 and GS2.2 were positioned on the same chromosome in close physical proximity. These observations suggest that the presence of multiple GS2 copies may be far more common within the Amaranthus genus than previously anticipated.
In previous reports of GA resistance in A. palmeri, overexpression of GS2 was proposed as the primary resistance mechanism (Carvalho-Moore et al. Reference Carvalho-Moore, Norsworthy, González-Torralva, Hwang, Patel, Barber, Butts and McElroy2022; Noguera et al. Reference Noguera, Porri, Werle, Heiser, Brändle, Lerchl, Murphy, Betz, Gatzmann, Penkert, Tuerk, Meyer and Roma-Burgos2022). To assess whether this mechanism contributed to resistance in the populations studied herein, we explored the expression of both GS1 and GS2 copies in resistant and susceptible populations. None of the four populations showed significant differences in expression of any of the GS1 or GS2 copies relative to the susceptible WUS or BRC populations. We further examined the coding sequences of both the GS1 and GS2 copies to identify mutations that could confer GA resistance. A summary of all identified missense variants across the four genes is provided in Supplementary Table S16. In total, 4 missense SNPs were identified in GS2.1, 13 in GS2.2, 3 in GS1.1, and 7 in GS1.2 (Supplementary Figures S6–S9). None of these SNPs occurred within predicted catalytic domains of GS, as recently summarized by Porri et al. (Reference Porri, Sudhakar, Noguera, Betz, Lerchl, Dayan and Norsworthy2025), and therefore they are unlikely to be involved in GA resistance.
Together, our findings provide evidence for the evolution of GA resistance in populations of A. tuberculatus in Illinois. While currently we only have sufficient evidence to confirm resistance in the CAR population, reduced sensitivity and the upregulation of multiple metabolism-related genes in SDY, FRA, and M01 suggest that GA resistance in these populations may increase in prevalence under continued selection pressure. The observed expression of metabolism-related genes also signals multigenic mechanisms with the potential for cross-resistance across herbicide chemistries. Given that all four populations showed high survival rates to multiple herbicide SOA groups, it is likely that some of the identified genes contribute to broader resistance and possibly cross-resistance to GA. This is of particular concern, given that A. tuberculatus populations in Illinois are already known to have evolved resistance to herbicides spanning seven SOA groups. Importantly, our results demonstrated that 2,4-D remains a reliable control option for most populations, while atrazine, glyphosate, lactofen, fomesafen, and imazethapyr provided less A. tuberculatus control. From a management perspective, these findings highlight the need for more proactive, diversified weed control strategies in midwestern fields. Integrating tactics such as narrow row cropping systems, cover crops, and harvest weed seed control is essential for preserving herbicide usefulness and long-term management of A. tuberculatus as resistance continues to evolve.
Supplementary material
To view supplementary material for this article, please visit https://doi.org/10.1017/wsc.2026.10111
Funding
This work was supported by the Illinois Soybean Checkoff Program, the Soy Checkoff, Hatch accession no. 7000961, and by United Soybean Board prime agreement no. 25-210-S-B-2-A, sub-agreement no. 40005185-202.
Competing interests
The authors declare no conflicts of interest.


 Open access