

Introduction
The fresh-water discharge from Greenland is expected to have a strong impact on the North Atlantic thermohaline circulation and sea-level rise, influencing the climate on a global scale. Current theories by Reference Manabe and StoufferManabe and Stouffer (2000), based on coupled ocean–atmosphere modelling simulations, predict that radiative forcing by a realistic amount of greenhouse gases and anthropogenic sulphate will weaken the thermohaline circulation during the first half of the 21st century, in a similar way to the Dansgaard– Oeschger and Heinrich events that occurred during the last glacial period. Precipitation rates are likely to increase in high latitudes, and, together with higher annual mean temperatures, this will lead to increased surface runoff and melting of land and sea ice. The increase in fresh-water forcing will weaken the thermohaline circulation and reduce the northward advection of warm, saline water, cooling the regions around the North Atlantic in particular (Reference Manabe and StoufferManabe and Stouffer, 1999, Reference Manabe and Stouffer2000).
The improved simulations of surface runoff from the melting Greenland ice sheet will provide better estimates and help to improve understanding of the related climate processes, especially in the Northern Hemisphere. In this study, the total mass budget of the ice sheet and the ice-free regions of Greenland is computed from model simulation results using a very high-resolution regional climate model (REMO) and compared with other results from regional and global climate modelling and indirect observations (Reference Bromwich, Cullather, Chen and CsathóBromwich and others, 1998, Reference Bromwich, Chen, Li and Cullather1999; Reference DethloffDethloff and others, 2002; Reference Hanna, Huybrechts and MoteHanna and others, 2002; Reference MoteMote, 2003). The impact of subgrid surface variability is examined by comparing simulations at 0.5˚ and 0.125˚ horizontal resolution, whereas the vertical resolution of the atmospheric model was increased from 20 to 35 layers.
Precipitation and evaporation (or sublimation) determine the snow accumulation, and a simple snow-ice melt model is used to compute the snowmelt. The runoff scheme (Reference Dümenil, Todini and O’KaneDümenil and Todini, 1992) computes surface runoff from excess water over a saturated land surface. The feedback between the melting ice sheet and the atmosphere is considered here, but not the higher-order processes needed to obtain a first-order estimate of the surface runoff. Retention, refreeze and percolation processes are higher-order processes in the snowpack which decrease the surface runoff and will be considered later in a more elaborate scheme adapted from Reference Loth, Graf and OberhuberLoth and others’ (1993) snow model also including the processes affected by blowing snow (Reference Gallée and DuynkerkeGallée and Duynkerke, 1997). The calving and fracturing processes at the edges of the ice sheet, which contribute to the mass loss and the mass budget of the ice sheet, are also not considered yet. The fresh-water flux from Greenland to the ocean is computed using a new routing scheme (Reference SoodSood, 2003) for surface runoff from melting continental glaciers and the ice-free regions into the neighbouring oceans, providing input fluxes for ocean modellers.
Model Description
REMO (Version 5.1) is a three-dimensional hydrostatic primitive equation model with horizontal wind components, surface pressure, temperature, specific humidity and cloud water content as the prognostic variables. It was originally developed at the Max Planck Institute for Meteorology, Hamburg, Germany (Reference Jacob and PodzunJacob and Podzun, 1997), for climate simulations in mid-latitudes. The horizontal discretization is on the Arakawa C-grid, and a terrain-following hybrid vertical coordinate is used. The domain is rotated to the region of interest and embedded in the lateral boundaries of a global model or analyses. The dynamical part of the model is based on the former operational numerical weather prediction model EM (Europa Model) of the German Weather Service (DWD) (Reference MajewskiMajewski, 1991), whereas the physical parameterization of the General Circulation Model ECHAM-4 (Reference RoecknerRoeckner and others, 1996) of the German Climate Computing Centre (DKRZ) modified for higher resolution is used for long-term climate applications. It has meanwhile been applied successfully in high-latitude climate studies (e.g. Reference JürrensJürrens, 1999; Reference Semmler, Jacob, Heinke Schlünzen and PodzunSemmler and others, 2004).
Vertical diffusion and turbulent surface fluxes are calculated from the Monin–Obukhov similarity theory with a 1.5-order closure scheme for transfer coefficients of momentum, heat, moisture and cloud water within and above the planetary boundary layer. The eddy diffusion coefficients are calculated as functions of turbulent kinetic energy. The radiation parameterization is according to Reference Morcrette, Smith and FouquartMorcrette and others (1986), with modifications for additional greenhouse gases, the 14.6 μm band of ozone and various types of aerosols, and the continuum absorption is after Reference Giorgetta and WildGiorgetta and Wild (1995). More details of the model are described elsewhere (Reference RoecknerRoeckner and others, 1996; Reference Jacob and PodzunJacob and Podzun, 1997). The coupling of the atmosphere and the ice sheet is mediated through the lower boundary condition described by the land surface scheme, where the land surface is covered by a permanent ice sheet.
Land Surface Scheme
The five-layer land surface model for soil and ice processes includes the heat transfer using the diffusion equation with zero heat flux at the bottom (10 m) assuming the characteristics of soil and ice respectively. The thickness of soil or ice layers increases gradually with depth, with a top layer of 0.065 m, mid-layers of 0.254, 0.913 and 2.902 m and a bottom layer of 5.7m thickness. Deeper layers not directly affected by the atmospheric processes are not considered. Above a critical snow depth of 0.01 m, an additional heat-diffusion equation with an interface to the atmosphere at the top, and the top soil (or ice) layer at the bottom, is used:
where C
p, Sn is the heat capacity of a maximum of 10cm of snow (less if the total snow layer is thinner than 10cm),
![]() is the temperature of the top layer of snow, F
atm is the resultant surface heat flux from the atmosphere, F
top = (α/hSn)(Ttop− Tatm) is the heat flux to the top soil or the ice layer,
a
is the heat-transfer coefficient (WmK–1), h
Sn is the snow depth, and T
top and T
atm are the top soil (or ice) layer and atmospheric temperatures respectively. Since only the top 10cm of snow is considered in this equation, the temperature in the middle of the snow layer, T
Sn, is obtained by interpolation of the temperature of the top snow layer and the top soil (ice) surface. Melting of the top or the bottom snow layer starts when the temperature at the interface exceeds the melting temperature. The snow density and heat capacity are parameterized as a function of the snow temperature T
Sn, varying from 200 kgm–3 and 0.1 WmK-1 respectively at -10˚C and below to 450 kgm–3 and 0.3 W mK–1 respectively at 0˚C (Reference SemmlerSemmler, 2002). Further modifications, such as densification due to the aging of snow, are not yet considered.
is the temperature of the top layer of snow, F
atm is the resultant surface heat flux from the atmosphere, F
top = (α/hSn)(Ttop− Tatm) is the heat flux to the top soil or the ice layer,
a
is the heat-transfer coefficient (WmK–1), h
Sn is the snow depth, and T
top and T
atm are the top soil (or ice) layer and atmospheric temperatures respectively. Since only the top 10cm of snow is considered in this equation, the temperature in the middle of the snow layer, T
Sn, is obtained by interpolation of the temperature of the top snow layer and the top soil (ice) surface. Melting of the top or the bottom snow layer starts when the temperature at the interface exceeds the melting temperature. The snow density and heat capacity are parameterized as a function of the snow temperature T
Sn, varying from 200 kgm–3 and 0.1 WmK-1 respectively at -10˚C and below to 450 kgm–3 and 0.3 W mK–1 respectively at 0˚C (Reference SemmlerSemmler, 2002). Further modifications, such as densification due to the aging of snow, are not yet considered.
The water-budget equation for soil moisture, interception reservoir (vegetation) and snow is solved. The runoff scheme includes sub-grid-scale variations of field capacity over inhomogeneous terrain (Reference Dümenil, Todini and O’KaneDumenil and Todini, 1992) by integrating the equation for water balance over the whole catchment at a single point, while taking into account the depletion of soil water due to drainage. The total soil water retention capacity of a gridcell is the sum of local sub-grid soil water retention capacities described by a probability distribution function based on catchment characteristics, which are defined by the orographic variance, maximum water retention capacity and the maximum drainage at maximum soil water content of the gridcell. However, no drainage can occur over the ice surface, since it is considered to be impermeable and percolation of meltwater through the ice layers is neglected.
The ice-calving and ice-dynamics processes are not included so far. The sea surface temperature (SST) is externally prescribed to ocean gridcells assimilated from observations. Sea ice is assumed if the SST is below the seawater freezing temperature. The fractional cover of sea ice is recovered by assimilating satellite data on a gridcell (Reference Semmler, Jacob, Heinke Schlünzen and PodzunSemmler and others, 2004).
The multiple path distributed flow (MPDF) method is a multiple flow direction approach (Reference SoodSood, 2003) that calculates gradient flow and catchment area at each gridcell and determines total drainage through each gridcell. A straightforward routing algorithm based on the digital elevation model orography, with flow proportional to gradient towards all lower-lying direct neighbours, is used to construct a normed flow-directional matrix. The surface runoff pattern obtained from simulation results then scales the flow-directional matrix to determine lateral flow. Some dispersion may occur since flow in more than one direction is permitted.
Simulation Set-Up
Horizontal resolutions of 0.125˚ and 0.5˚ with 201 × 289 and 51 × 73 gridcells and vertical resolutions of 35 and 20 levels respectively are used in these simulations, with time-steps of 60 and 300 s. The initial and boundary conditions are taken from the 6 hourly ERA-15 re-analysis processed by the European Centre for Medium-Range Weather Forecasts at T106 resolution. The horizontal coordinates are rotated, with Greenland located at the centre of the domain and the South Pole at 38˚ S, 18˚W. The SSTs are also taken from ERA-15 reanalysis. The initial overestimated snow depth from ERA over the ice-free coastal regions is not suitable for this study since the contribution of snowmelt to the surface runoff is substantial. A more balanced initial snow depth at the beginning of winter was constructed based on typical values from previous studies in the region (personal communication from T. Semmler, 2004) and then allowed to evolve in the model. Over the ice sheet, since no previous comparable studies with the evolution of snow depth are known, the old estimates from ERA-15 re-analysis were used.
The 1992 monthly and annual cycle is investigated in this study. The simulation was initialized on October 1991 to allow the land surface fields to adjust to the atmospheric forcing. The short initialization period is justified since the surface processes are decelerated or inhibited due to predominantly below-freezing temperatures, which reduces the variability and increases the response. The control (CTL) runs are performed using the original model version (5.1) where no melt over the ice sheet can take place, whereas in the modified version, melting (I-MLT) of snow and ice can occur.
Surface Mass Budget
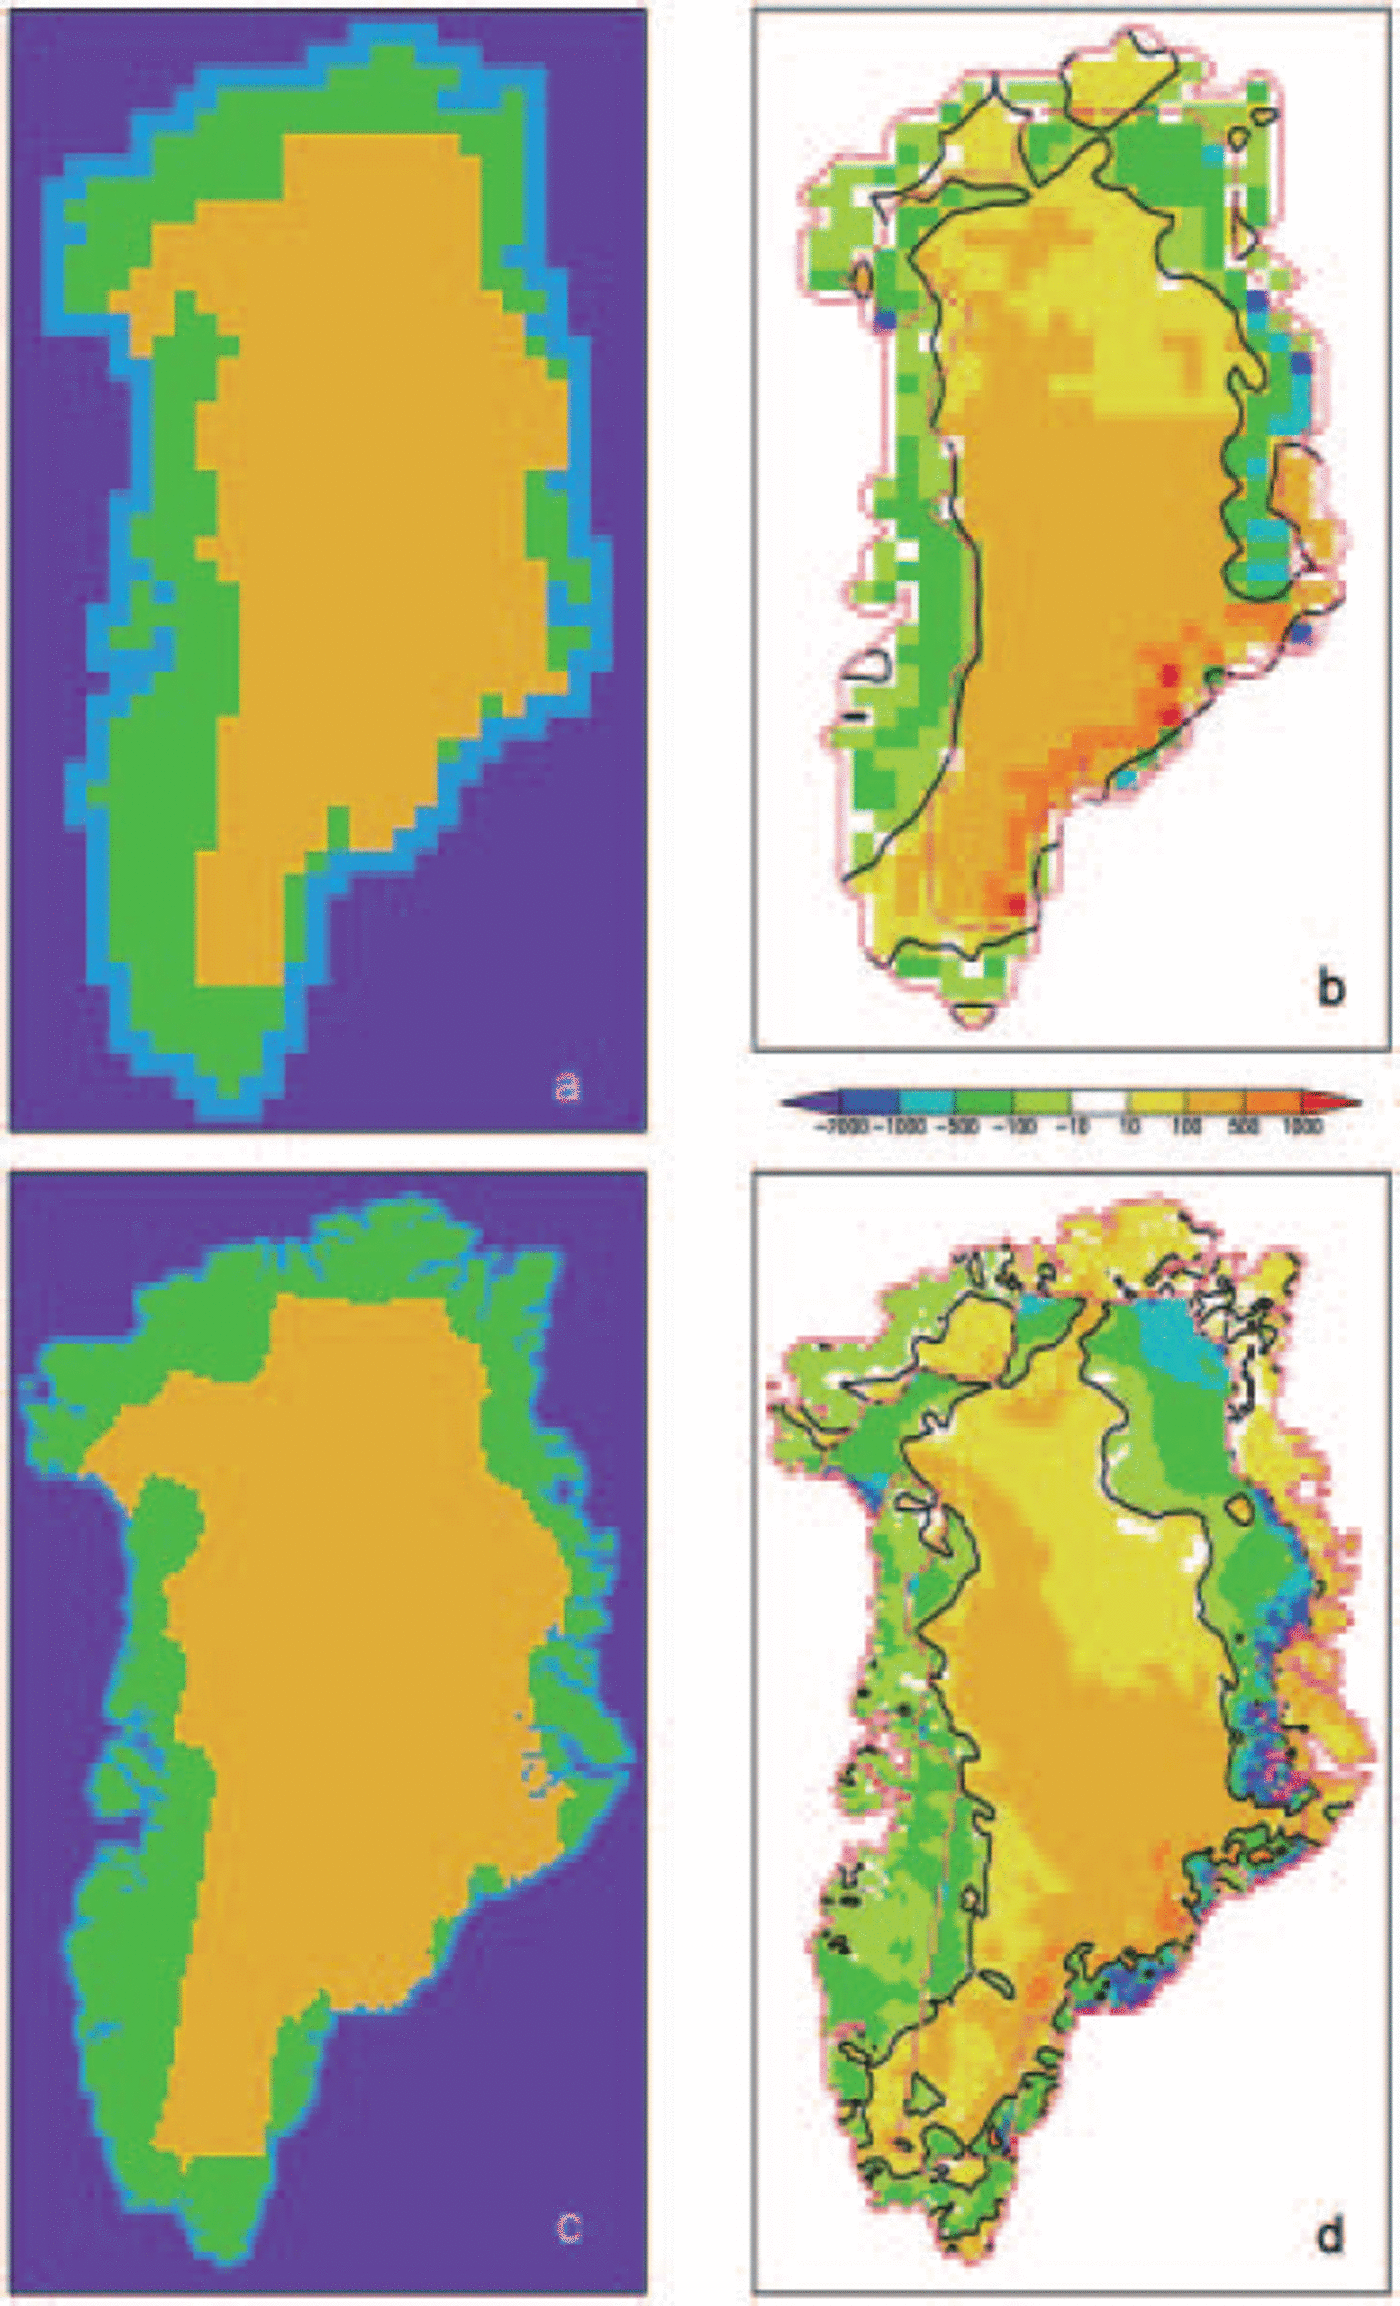
The mass (ice and snow) budget of Greenland, defined here as the difference between accumulation, i.e. precipitation minus evaporation, and surface runoff which consists mainly of snow (or ice) melt, is determined for the 1992 annual cycle using simulation results of the regional climate model REMO. In Figure 1a, the land/ice/sea mask used in this study is shown, where the coastal (blue), oceanic (marine), permanent ice-sheet (yellow) and ice-free regions (green) are depicted. The GTOPO30 orography used here is inaccurate (Reference Box and RinkeBox and Rinke, 2003) compared with others (e.g. Eckholm and Forsberg, 1996) used in related studies. Therefore direct comparison with other studies is not appropriate. For example, only about 65% of Greenland is covered by ice sheet here, compared with 80% in other studies. However, a qualitative comparison shows a very similar pattern where most fields are of the same order of magnitude.
(a, c) Land/ice/sea mask for Greenland at 0.5˚ (a) and 0.125˚ (c) horizontal resolution. (b, d) Annual (1992) mass budget for Greenland at 0.5˚ (b) and 0.125˚ (d) horizontal resolution for I-MLT runs. For clarity, the ice mask (dashed, magenta) and the zero-level contour (solid, black), which separates the annual accumulation and ablation regions, are shown.
The increase in resolution with better orographic representation results in dramatic changes in the total precipitation, reducing it by around 15% over the whole of Greenland. Similar observations were previously made by Reference Ohmura, Wild and BengtssonOhmura and others (1996) for global climate model results at many different resolutions where precipitation decreased with increasing horizontal resolution. About 55% of the total precipitation falls over the ice sheet. For both resolutions, sublimation and evaporation losses are around 20% for the I-MLT case and 15% for the CTL case.
Allowing for snow and ice melt on the ice sheet (I-MLT) alters the surface mass budget of the ice-sheet ablation zone considerably. The runoff is generated over ice-free regions of Greenland in the CTL runs, since no snow or ice melt occurs over the ice sheet. The snowmelt infiltrates into the soil, though over the ice sheet water cannot percolate through the ice layers or be stored in the snowpack. The effect of infiltration into the soil layers is included in the runoff scheme (Reference Dümenil, Todini and O’KaneDümenil and Todini, 1992), though retention of water in the snowpack is not included. Possible contributions to the subsurface flow are also not modelled here. The surface mass budget shows a distinctive regional pattern (Fig. 1b), with large ablation zones in the northeast, southeast and on the west coast which exhibit a low to moderate mass deficit of about 5–50cm w.e., and a small surplus region over the south and central ice sheet. Locally, growth of around 100 cm is registered, though it is very limited in spatial extent.
The total runoff is approximately doubled from 304 km3 a–1 (CTL) to about 753 km3 a–1 (I-MLT) in the high-resolution study and 355 km3 a–1 (CTL) to 685 km3 a–1 (I-MLT) at the lower resolution. There is thus a marked difference in the total mass budget, from –63 km3 a–1 over the melting ice sheet and –71 km3 a–1 over the whole of Greenland (I-MLT) in the high-resolution runs as compared to 139 and 125 km3 a–1 respectively in the low-resolution I-MLT runs. Thus the increase in resolution also has a large impact on the runoff from the ablation zone which is nearly 10% lower for coarse resolution over the whole of Greenland and >25% lower over the ice sheet.
The melting process is very sensitive to orography, since it determines the surface temperature and thus the melt onset. More gridcells have lower elevation at higher resolution where melting may occur in regions where it may not be possible on the spatially averaged lower-resolution orography, thus improving the results even qualitatively. For a better quantative estimate, however, the missing processes such as refreezing and retention affecting the surface water budget must also be included.
The simulated accumulation pattern (Fig. 2a) is consistent with the observed climatic means over Greenland (Reference Ohmura and ReehOhmura and Reeh, 1991), though probably somewhat overestimated at the southeast coast. The south, southeast and east coast show very large annual accumulation of 100–200 cm w.e., with isolated regions of even higher accumulation, in contrast with the north-central region and parts of the northwest coast which accumulate <10cmw.e. a–1, while the remaining regions mostly accumulate <50cm w.e. a–1. Net mass loss is even observed at the edges of the northeastern ice sheet and the west and northwest coast, which may be a result of local orographic features. The annual accumulation pattern is also similar to those previously obtained for other time periods (Reference Bromwich, Cullather, Chen and CsathóBromwich and others, 1998; Reference DethloffDethloff and others, 2002).
(a) Annual (1992) accumulation, P – E (mm w.e.), for Greenland at 0.125˚ horizontal resolution. The dark-yellow to red colours depict high accumulation. (b) Change in annual accumulation between the I-MLT and CTL runs. The ice mask and the zero-level contour are drawn as in Figure 1 .
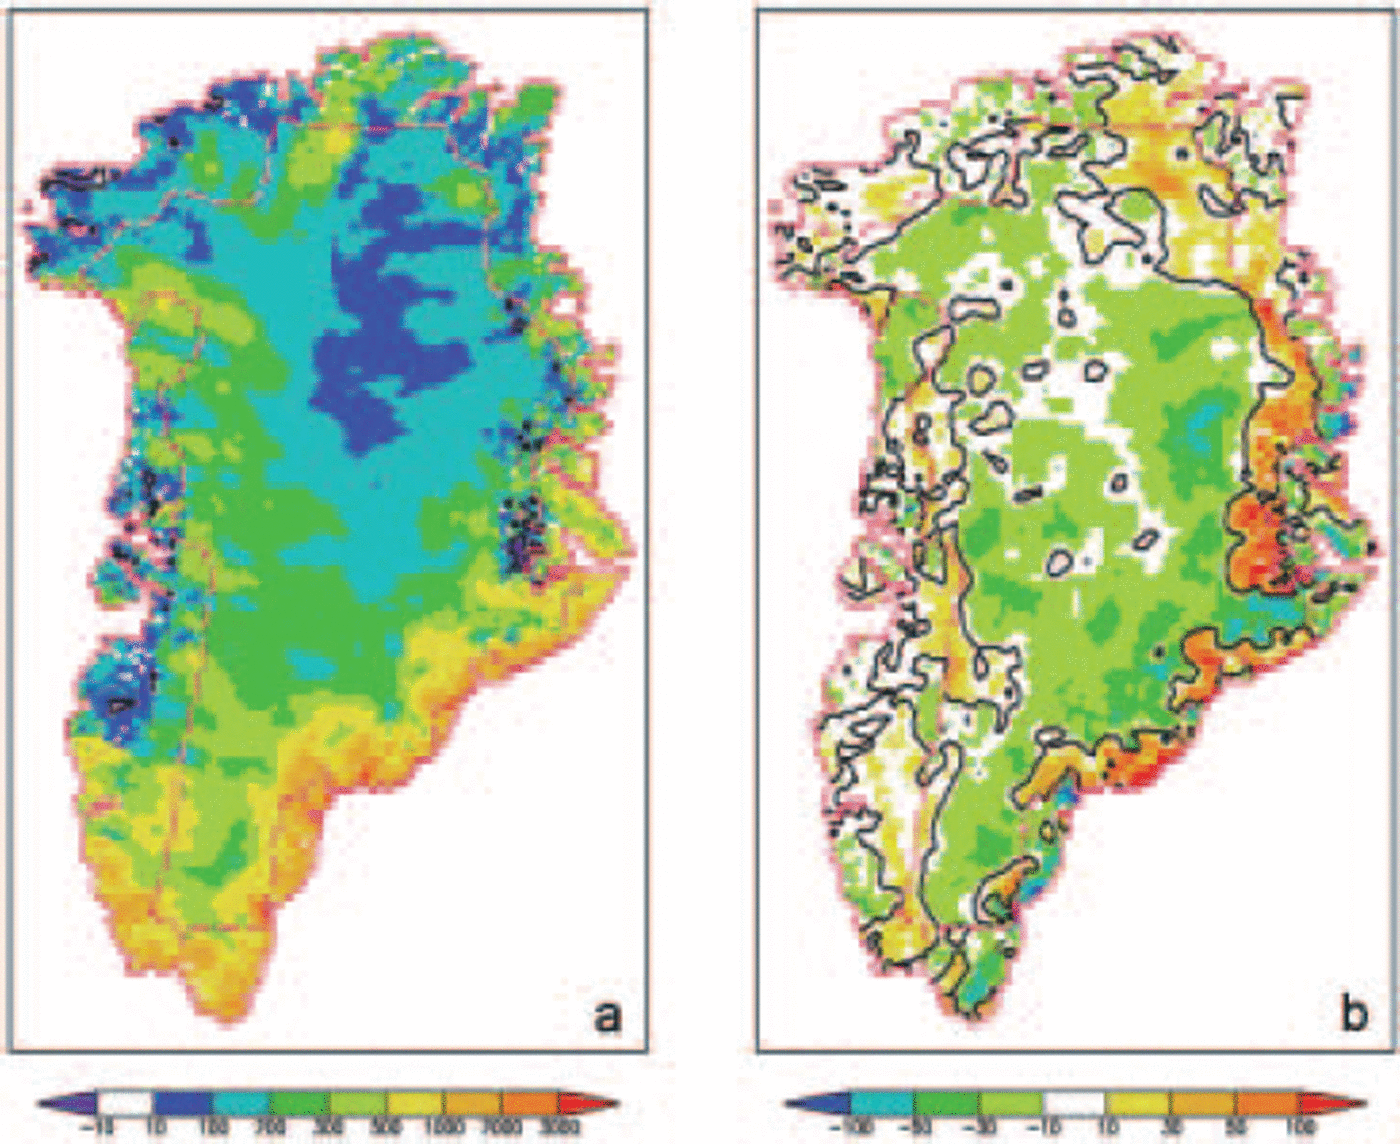
The feedback of the melting ice sheet on the atmosphere is observed in the difference in annual accumulation pattern between the melting ice sheet and the control runs (Fig. 2b). This primarily positive effect in the ablation zone may be due to increased moisture content in the atmosphere column, increasing precipitation and evaporation and sublimation, whereas the negative effect can result from small modifications in the circulation pattern. This indicates that a more realistic coupling between the atmosphere and the melting ice sheet and inclusion of missing processes may be relevant for the distribution of mass budget on a longer climatic timescale.
The annual patterns of P–E and runoff thus reflect the orography and the prevalent climatic conditions. There is a strong meridional pattern of high P– E and runoff in the south and low P–E and runoff in the north. The P–E minimum in the central North Greenland massif reflects orographically induced lee for cyclones crossing the ice cap, where disturbances do not penetrate easily. The regional patterns of accumulation for the two resolutions are similar, but most of the regional features at high resolution, such as local regions of ablation, are absent at low resolution. A more detailed validation and analysis is needed to assess the accuracy of these estimates.
The snowmelt and changes in snow depth lead to different surface and deep-ice temperatures (bottom layer). The annual surface temperature T S over the melting surface (I-MLT), where the melting snow acts as a latent-heat sink, is cooler than over the surface in the CTL run, whereas the temperature within the ice layers is warmer. The melting period is also extended (e.g. it is about 25% longer in July when temperature remains above melting temperature tT S>0 (Table 1)). The surface variations in temperature T S are unable to penetrate efficiently into the deeper ice layers (e.g. T CL) through diffusion alone, due to the modulating effects of phase transitions at the surface. This effect will be examined in more detail in a later study. On the other hand, if the meltwater percolates through the snow surface, heat flux to the deeper layer will become more efficient and penetrate even below the modelled layers. Thus energy flux through the bottom must also be considered.
Surface (T S) and deep-ice (T CL) temperature over the Greenland ice sheet, and annual time period with temperatures above melting point of ice for the I-MLT and CTL cases at 0.125˚ resolution
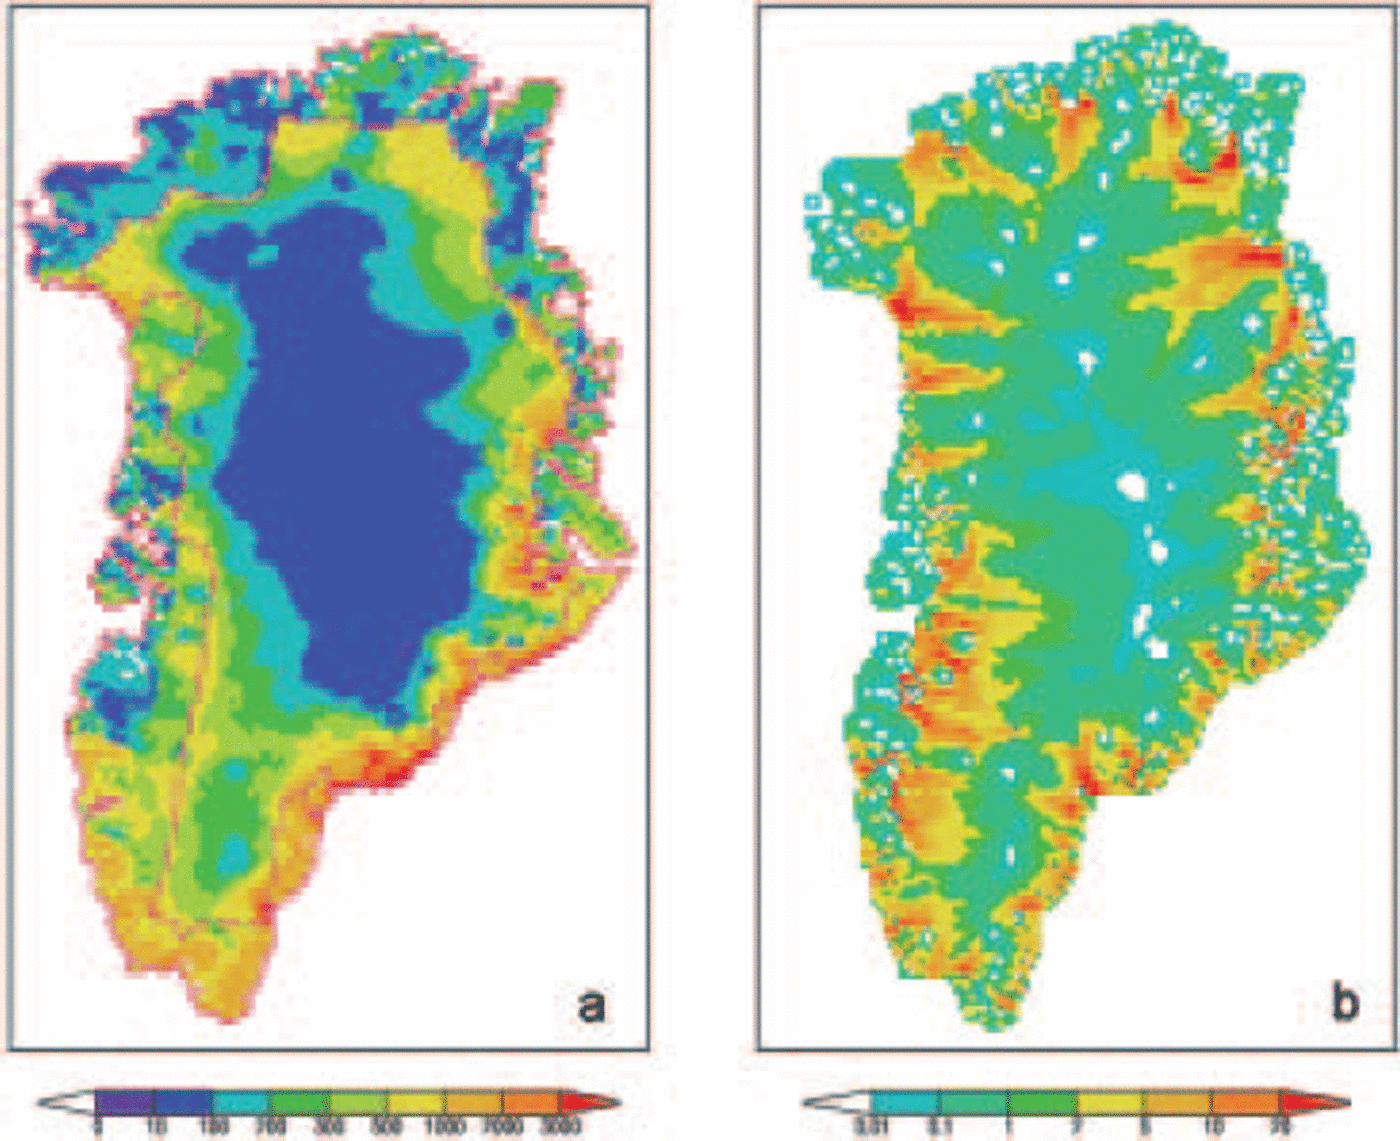
The annual pattern of runoff generated at each gridcell shows a very low surface runoff from the central regions of the ice sheet at very high elevation. The snow/ice melt is the main component of the surface runoff which on rapid refreezing at high elevations will not contribute to the freshwater flux into the ocean (Fig. 3a) directly. The margins of the ice sheet, in contrast, along with the southern coastal regions, generate most of the surface runoff. In Figure 3b, the lateral flow of surface runoff is depicted, where the total annual discharge through each gridcell is shown. Thus, in the central high-elevation region, very low discharge (0–1m w.e. a–1) can occur while refreeze is ignored. The routing scheme applied here is described in detail elsewhere (Reference SoodSood, 2003). The pattern reflects the orography on which it is based, and the ablation zones where it originates. Using the coastal mask (Fig. 1, blue), the spatial and temporal distribution of the total fresh-water flux from Greenland to the ocean can be determined.
(a) The annual (1992) surface runoff (mm w.e.) of the I-MLT run for Greenland at 0.125˚. (b) Lateral flow based on surface runoff (in mw.e.) and orography using the inverse MPDF scheme.
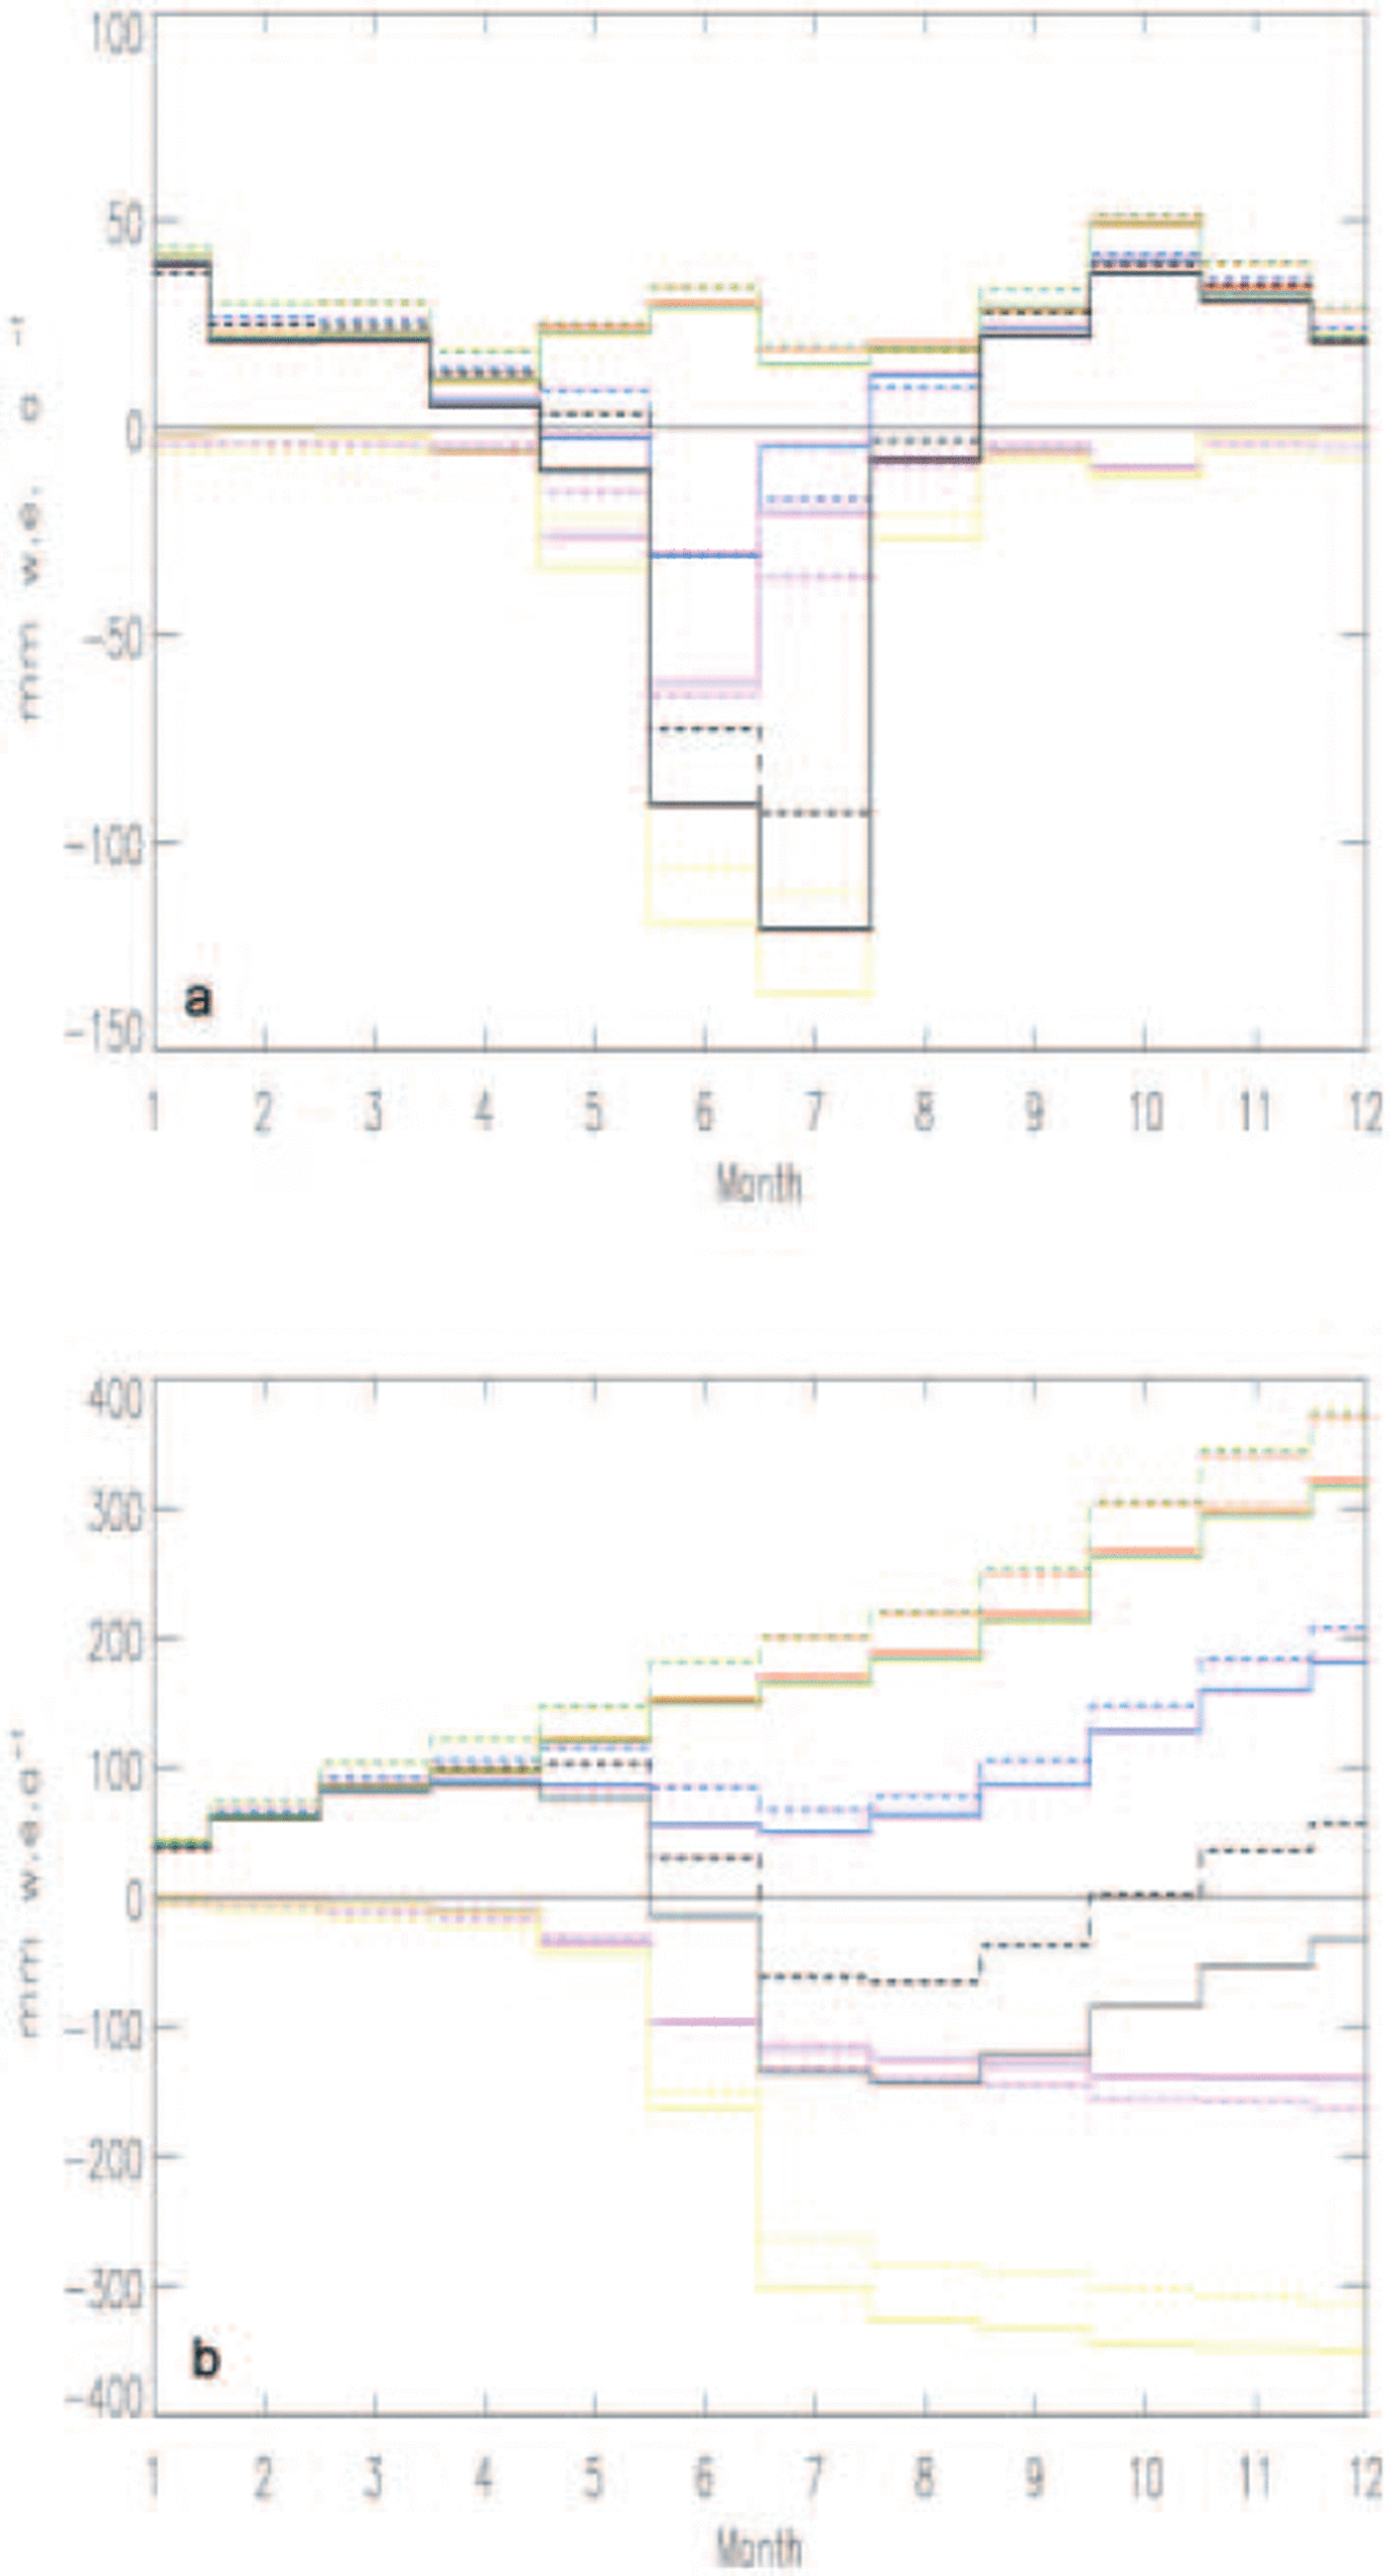
The monthly evolution of annual mass budget is shown in Figure 4a. The accumulation for CTL (red) and I-MLT (green) runs is of the same order of magnitude at 0.125˚ (solid line) and 0.5˚ resolution (dashed line), but the runoff for I-MTL (yellow) and CTL (pink) runs differs by one order of magnitude, giving a very different mass budget for I-MTL (black) and CTL (blue). This difference is due to the melting ice sheet. The melt season is from May to August, though the bulk of runoff is generated in June and July. The annual mass budget (Fig. 4b) for I-MLT is positive for the low-resolution run (dashed black line) and negative for the high-resolution run (solid black line), whereas in the CTL run where the ice sheet does not melt, the mass budget remains positive. Therefore it is important to assess the impact of missing processes and improved orography in order to ascertain even the sign of mass budget on the Greenland ice sheet and the ice-free regions.
(a) Monthly P –E (green/red), runoff (yellow/pink) and mass budget (black/blue) of the I-MLT and CTL runs at 0.5˚ (dashed) and 0.125˚ (dashed–dotted) resolution. (b) Same as in (a), but for cumulative annual cycle.
Discussion
In this study, a simple snow (ice) melt model is applied to determine surface runoff from Greenland. For the melting process, no tuning parameters based on observations were used. The surface characteristics described by the model design (e.g. layer thickness) determine the melting rates. The albedo of the melting surface also has positive feedback on the melting process. However, surface runoff is probably overestimated in this study since a number of important processes such as retention, refreezing and the impact of blowing snow on surface energy and moisture fluxes are not included.
The melting ice sheet considered here is observed to have a measurable feedback on the atmosphere, altering the accumulation pattern. Thus the melting of the ice sheet not only modified the mass budget over the ablation zones but also increased the accumulation in the ablation zone. The energy flux to the deeper layers is also modified. The regional climate modelling can prove to be a useful tool not only to reproduce and interpolate observations but also to help understand the nature of coupling between various components (here atmospheric and glaciological) of a climate system and to determine the sources and magnitude of errors while modelling processes.
The annual precipitation of 413mmw.e. (0.125˚) and 491 mm w.e. (0.5˚) is somewhat higher than the estimate 395 mm w.e. (Reference Bromwich, Chen, Li and CullatherBromwich and others, 1999) in other studies. The annual accumulation on the ice sheet 279 mmw.e. (0.125˚) and 337 mmw.e. (0.5˚) is lower than 333 mmw.e. (Reference Hanna, Huybrechts and MoteHanna and others, 2002) which was computed for a different (larger) mask. The 1992 runoff of 451 km3 (0.125˚) and 331 km3 (0.5˚) does not compare well with the 153 km3 (Reference MoteMote, 2003) derived from passive microwave satellite data and simple empirical modelling. The large snow-depth initialization of around 10 m from ERA reanalysis also leads to an overestimation of melting rates from the ice-sheet boundaries.
Since the surface melt and refreeze processes are very sensitive to the orography, an improved orographic representation is essential. Including the sub-grid-scale effects of surface heterogeneity will improve estimates of the surface energy and moisture fluxes which determine the surface temperature and thus the phase transition onset. The refreeze and percolation processes in the snowpack which regulate surface runoff are not represented in the present snowmelt model and must be included in the next step. Also, during lateral flow of the surface runoff, some retention must be considered due to local sinks. It is also necessary to have a more elaborate snow model which takes into account the turbulent surface fluxes in wind (including blowing-snow sublimation), melt and refreeze processes (Reference Gallée and DuynkerkeGallèe and Duynkerke, 1997).
To obtain a complete picture, the basal water runoff, ice streams and calving rates must also be included. The mass loss of 170–270 km3 through ice-sheet calving is estimated as roughly one-third of the total mass loss from the ice sheet (Reference BiggBigg, 1999). A simple parameterization based on the routing scheme is being constructed to include this freshwater flux. All improvements in initial and boundary conditions and better representation of the essential processes described here will be taken into account to perform longer (40 year) simulations to determine the interannual variability and the present climatic averages of fresh-water fluxes from Greenland.
Acknowledgements
This study was financed as part of the German contribution to the Arctic Climate System Study (ACSYS) project by the Bundesministerium für Bildung und Forschung, Germany. I thank R. Podzun, D. Jacob and T. Semmler for their support with the REMO model, and P. Lemke for providing me with the resources to work on this project and for many valuable suggestions.


