

Background
I am honoured to be the first recipient of the Nutrition Society's Blaxter Award. Unlike Professor Sir Kenneth Lyon Blaxter, after whom the award is named, I was not trained as a nutritionist. Blaxter (1919–1991) was a very distinguished animal and human nutritionist, who served as Head of the Nutrition Department at the Hannah Research Institute, Ayr, from 1948 to 1965, and as the third Director of the Rowett Research Institute, Aberdeen, from 1965 until his retirement in 1982. His achievements in research and in policy were recognised by the award of Fellowship of the Royal Society and of the Institute of Biology, and his Presidency of the Royal Society of Edinburgh and of the Nutrition Society (1974–1977).
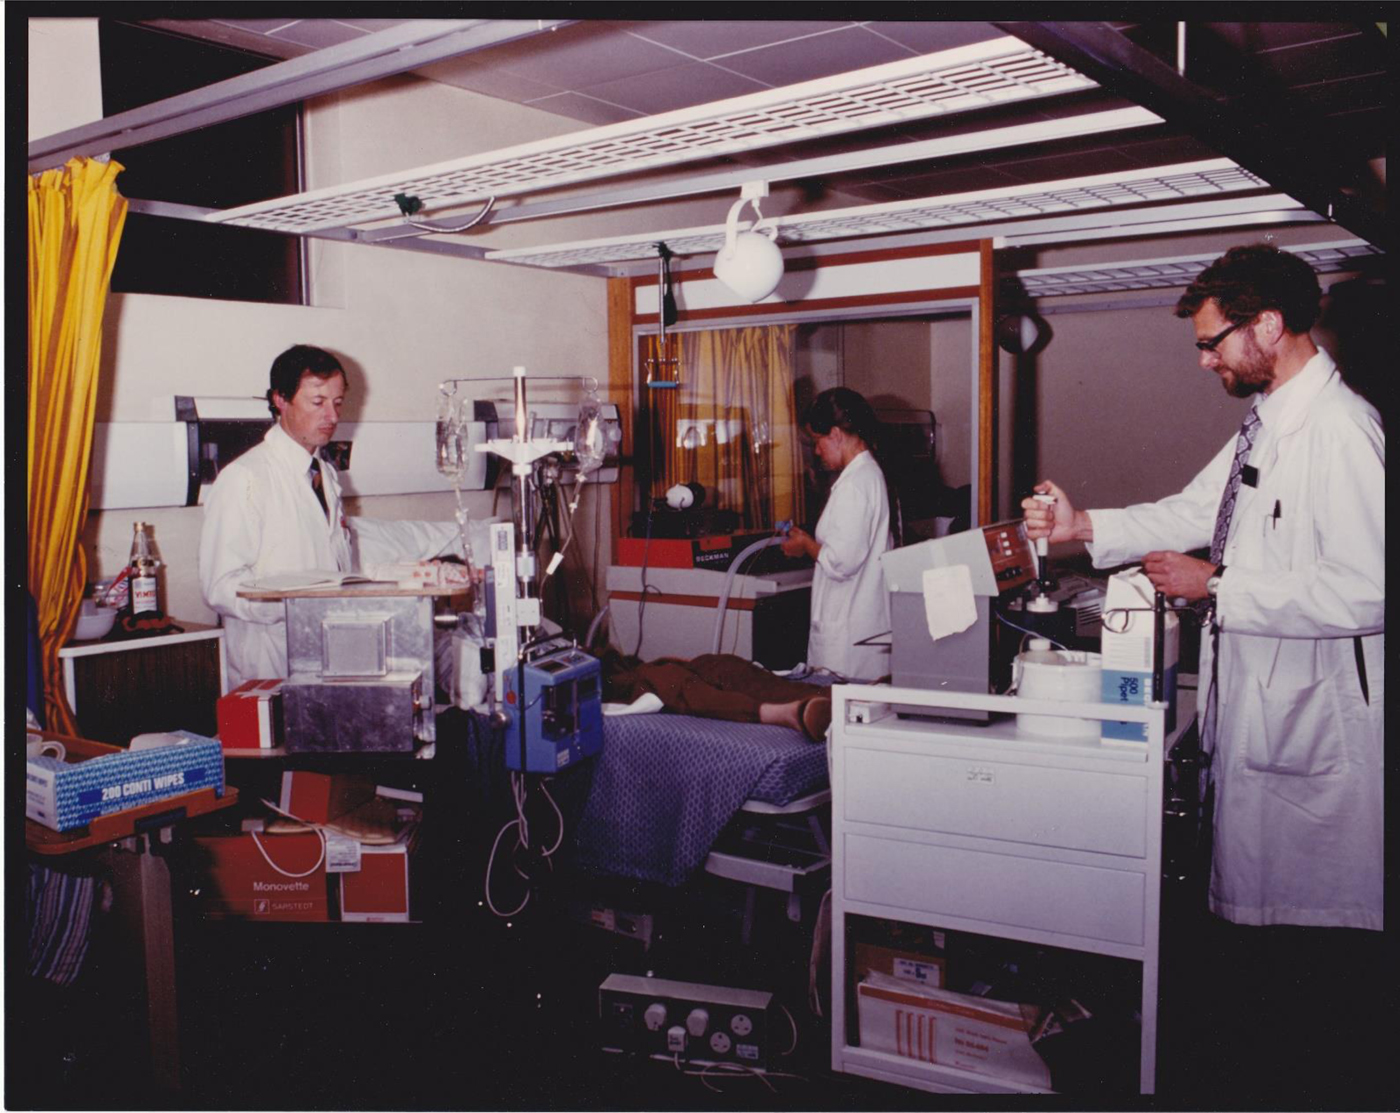
In contrast, I trained in metabolic biochemistry and drifted accidentally into work concerned with nutrition. During the period 1976–1986, I was a member of the Medical Research Council's newly-formed Trauma Unit, conducting research into metabolic disturbances following injury and in critical illness at the University of Manchester, with a clinical base at Hope Hospital in Salford (now Salford Royal Hospital). The patients we were studying all went through a catabolic phase; sometimes, for instance, in severely septic patients, this was prolonged, leading to the loss of considerable lean and fat mass. By good fortune, the then Professor of Surgery, Miles Irving, who had been instrumental in seeing the Medical Research Council Trauma Unit formed in Manchester, had established a specialist in-patient unit for clinical nutrition. In this unit, and in the hospital's Intensive Care Unit, we were able to conduct detailed metabolic studies in these sometimes seriously ill patients (Fig. 1).
(Colour online) A glucose clamp experiment on a patient in the Clinical Nutrition Unit at Hope Hospital, Salford, UK in 1982–1983, conducted as part of the Medical Research Council Trauma Unit's research. Roger White, clinical research fellow, on left; the author on right measuring glucose concentrations.
At that time (the early 1980s), total parenteral nutrition was reasonably well established. In the early days of total parenteral nutrition, nutrition consisted of infusions of glucose and amino acids. It was well understood, however, that provision of energy solely in terms of glucose could lead to severe metabolic disturbances in a catabolic state as the body tried to rid itself of excess glucose. In those in whom the glucose could be readily utilised, however, it led to increases in body weight, but not necessarily lean mass as might have been hoped, but rather by fuelling fat synthesis (Reference King, Almond and Oxby1). By the mid-1980s, however, lipid emulsions for intravenous use had become established, and this made total parenteral nutrition metabolically feasible in most patients.
These observations led me to wonder about sources of fat deposition in healthy human subjects. There was a prevalent belief at the time that the pathway of de novo lipogenesis, synthesis of fat from glucose and/or amino acids, was an important means of laying down fat: carbohydrate was regarded as especially ‘fattening’ because it stimulated insulin release, and insulin is a powerful stimulator of de novo lipogenesis. (Such beliefs seem to recur every 20 years or so.) There was, though, compelling evidence that the fatty acid composition of human adipose tissue (i.e. the proportions of the different fatty acids making up the TAG stores) reflected the fatty acid composition of an individual's diet, suggesting more direct uptake of dietary fatty acids (reviewed by(Reference Hodson, Skeaff and Fielding2)). The pathway for this to occur, involving the enzyme lipoprotein lipase (LPL) in adipose tissue, was well understood, but its importance as a route for fat storage in human subjects was not easy to demonstrate.
On moving to Oxford in 1986, I began to develop methods to study human fat deposition more directly. These studies led into an investigation of the normal physiology of human adipose tissue; from the picture that emerged, of a dynamic tissue responding rapidly to nutrient needs and availability, we began to develop ideas about the importance of adipose tissue to metabolic health. In later studies, when we could extend our methodology to obese people, we developed a model for understanding the metabolic disturbances of obesity that is based on physiology rather than pathophysiology. In the following sections, I will describe these investigations and the results that emerged.
Studying human adipose tissue fat deposition and mobilisation
The regulation of our fat stores is quite remarkable. We all understand that the amount of TAG stored in our adipose tissue reflects the long-term difference between energy intake and energy expenditure. But how the body senses this difference and translates it into the regulation of the movement of fatty acids in and out of adipocytes, was, when we started, and to some extent still is, a mystery.
Much of our fundamental understanding of adipose tissue metabolism came about in the 1960s with the use of an isolated fat depot, the male rat's epididymal fat pad, which could be removed and incubated in the laboratory. In 1964, Rodbell described the use of collagenase to digest the connective tissue holding the cells together, so that isolated adipocytes could be prepared and studied(Reference Rodbell3). However, such preparations lack the structure of intact adipose tissue, which in vivo is perfused with a rich mixture of substrates and hormones, is innervated, and in which the structure of capillaries and cells is integral to the pathway of fat storage via the enzyme LPL. We wanted to study the tissue in vivo, and with the help of local colleagues in the Anatomy Department, realised that it was possible to visualise the tiny veins that drain the subcutaneous anterior abdominal fat (tummy fat). These veins run towards the groin, merging into larger veins into which it was possible to introduce a fine catheter and hence draw blood, which could be compared with arterial blood to look at the changes in concentrations of substrates during their passage through adipose tissue. It was also important to measure blood flow through the tissue, which we did with the radioisotope133Xe(Reference Samra, Frayn and Giddings4).
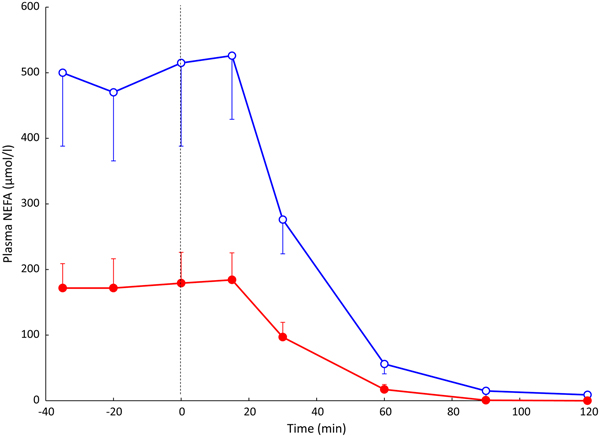
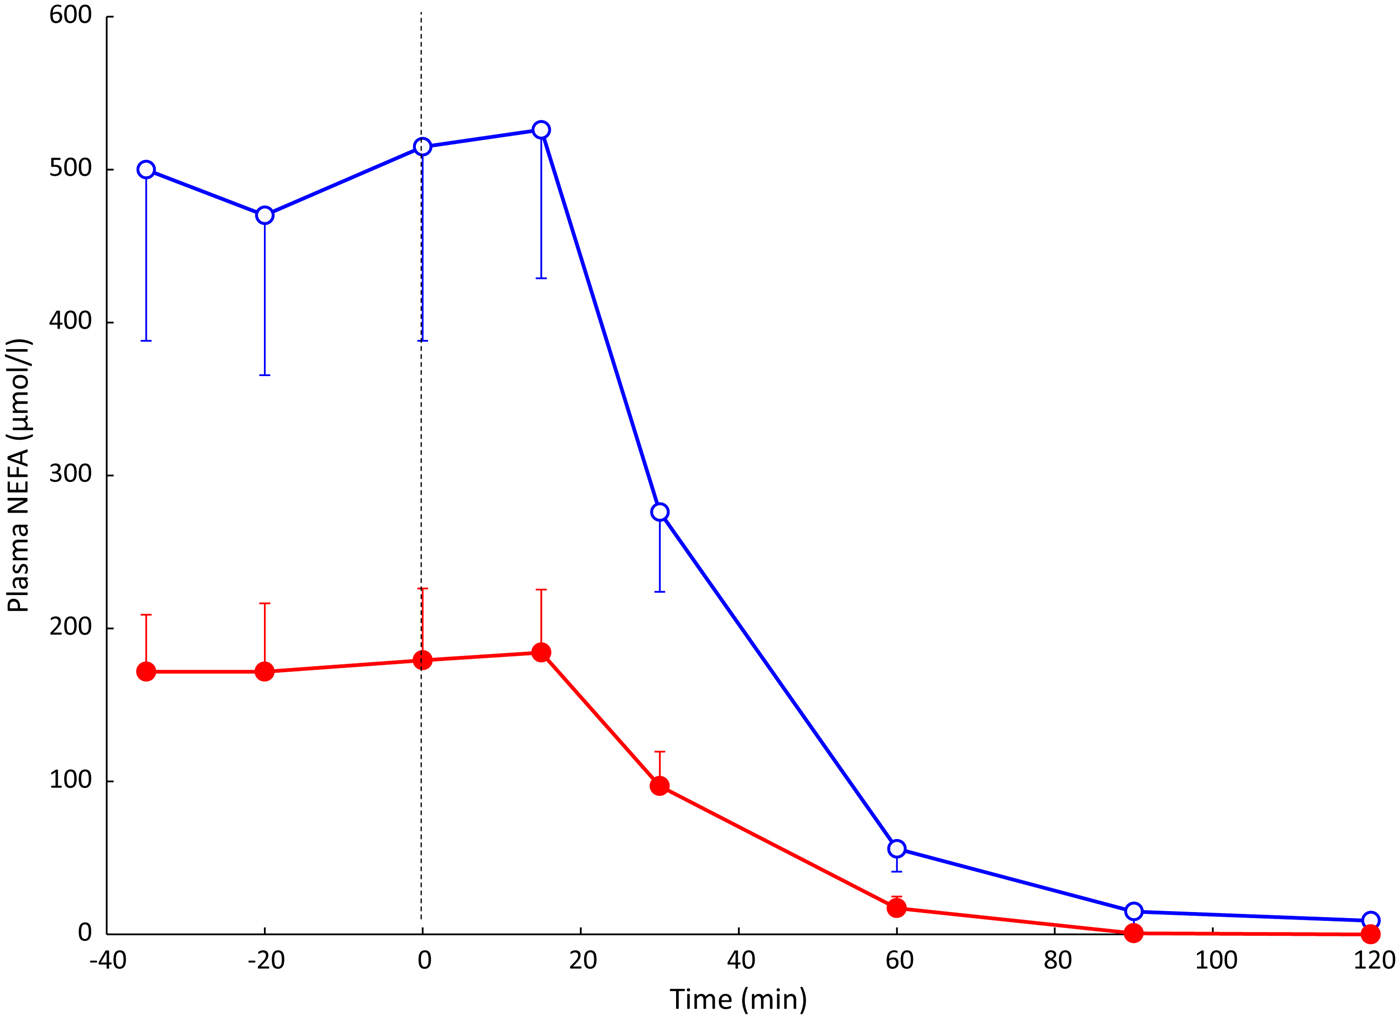
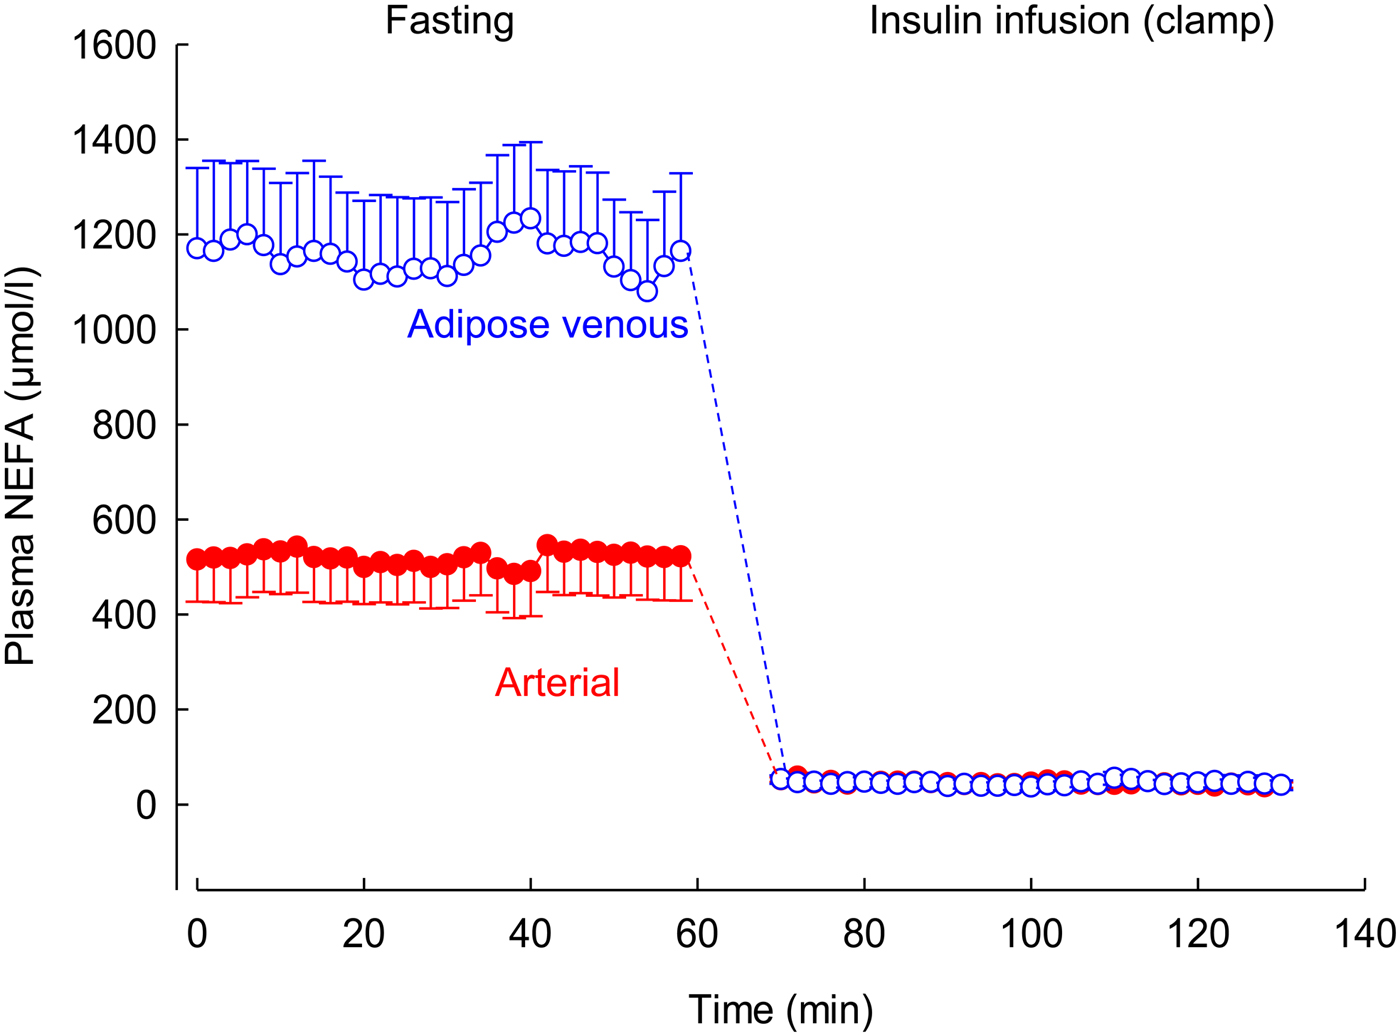
Using this arterio-venous difference technique, we were able to study TAG clearance from the plasma (reflecting the action of LPL), and mobilisation of stored fat in the form of NEFA. An early result from these experiments is shown in Fig. 2. In other studies, we looked at the effects of individual hormones on NEFA release: Fig. 3 shows the remarkable effect of insulin in suppressing fat mobilisation.
(Colour online) Plasma NEFA concentrations in an early experiment measuring arterio-venous differences across the subcutaneous adipose tissue. Solid points, arterial plasma; open points, plasma from vein draining adipose tissue. Samples were taken from eight healthy subjects after overnight fast, and then after drinking 75 g glucose (from the vertical dashed line). Standard error bars are shown in one direction only for clarity. Redrawn from(Reference Frayn, Coppack and Humphreys26). Differences between arterial and adipose tissue venous concentrations were significant up to and including the 60 min point.
(Colour online) Effect of insulin infusion on NEFA release from adipose tissue. Solid points, arterial plasma; open points, plasma from vein draining adipose tissue. Healthy volunteers were studied after an overnight fast with samples drawn for 60 min. Then an insulin infusion was started using a glucose clamp procedure to maintain normal glucose concentrations for a further 60 min. Data are from studies reported in(Reference Karpe, Fielding and Coppack27).
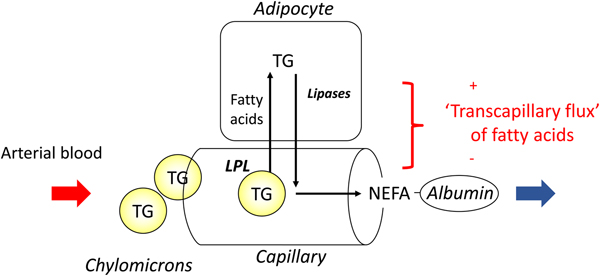
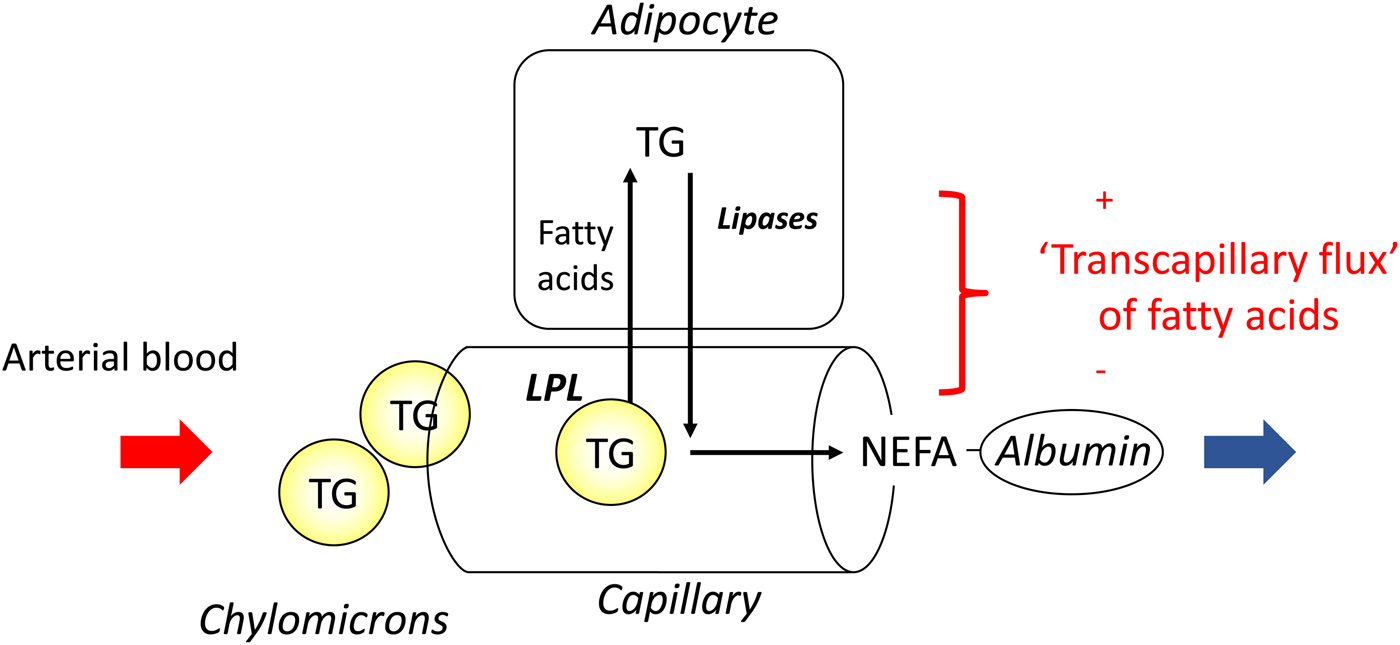
In most experiments, we compared adipose tissue metabolism with that of forearm skeletal muscle, studied in a similar way by measurement of arterio-venous differences. This led to the recognition that adipose tissue is unique in that fatty acids move in and out of the adipocytes according to nutritional state. In the fasting state, there is a net flow of fatty acids, mobilised from stored TAG, out of the adipocytes into the plasma. In the fed state, fat mobilisation is suppressed by insulin, and fatty acids begin to flow into the adipocytes from the action of LPL in capillaries. Over any typical 24-h period, the outward flow of fatty acids must match the inward flow to maintain fat balance. In a situation of positive energy balance (i.e. eating more than energy requirements), then slightly more fat would flow in than would flow out, and vice versa in a situation of negative energy balance (e.g. a day with more exercise than usual). Studies in the 1990s led to an unexpected result. Some students worked with us on experiments in which we gave volunteers a very high-fat meal. We then infused additional insulin. I (naively) thought that these conditions would maximise LPL action in adipose tissue capillaries and that we would see greatly increased ‘overspill’ of fatty acids, that is, the release of fatty acids generated by the action of LPL directly into the plasma NEFA pool. I was completely wrong. Under these conditions ‘overspill’ was virtually abolished. (At first, I thought the students had got the measurements wrong.) However, these experiments showed two important things. First, the uptake of fatty acids by adipocytes does not just depend on what occurs in the capillaries: the additional insulin had switched on the pathway for storing fatty acids in the adipocytes, and drawn more in. Secondly, it showed that we could quite easily measure the flow of fatty acids between capillaries and adipocytes, a measure that we termed transcapillary flux of fatty acids (Fig. 4).
(Colour online) Transcapillary flux of fatty acids in adipose tissue. Fatty acids can flow in either direction between capillaries and adipocytes. In the fasting state, intracellular lipolysis of TAG (TG) stores releases NEFA into the plasma for delivery to other tissues. In the fed state, fatty acids generated by the action of lipoprotein lipase (LPL) in capillaries flow into adipocytes where they are esterified with glycerol for storage as TAG. The net flow of fatty acids between capillaries and adipocytes has been termed transcapillary flux(Reference Frayn, Shadid and Hamlani28). It is positive when the net flow is into adipocytes (fat storage).
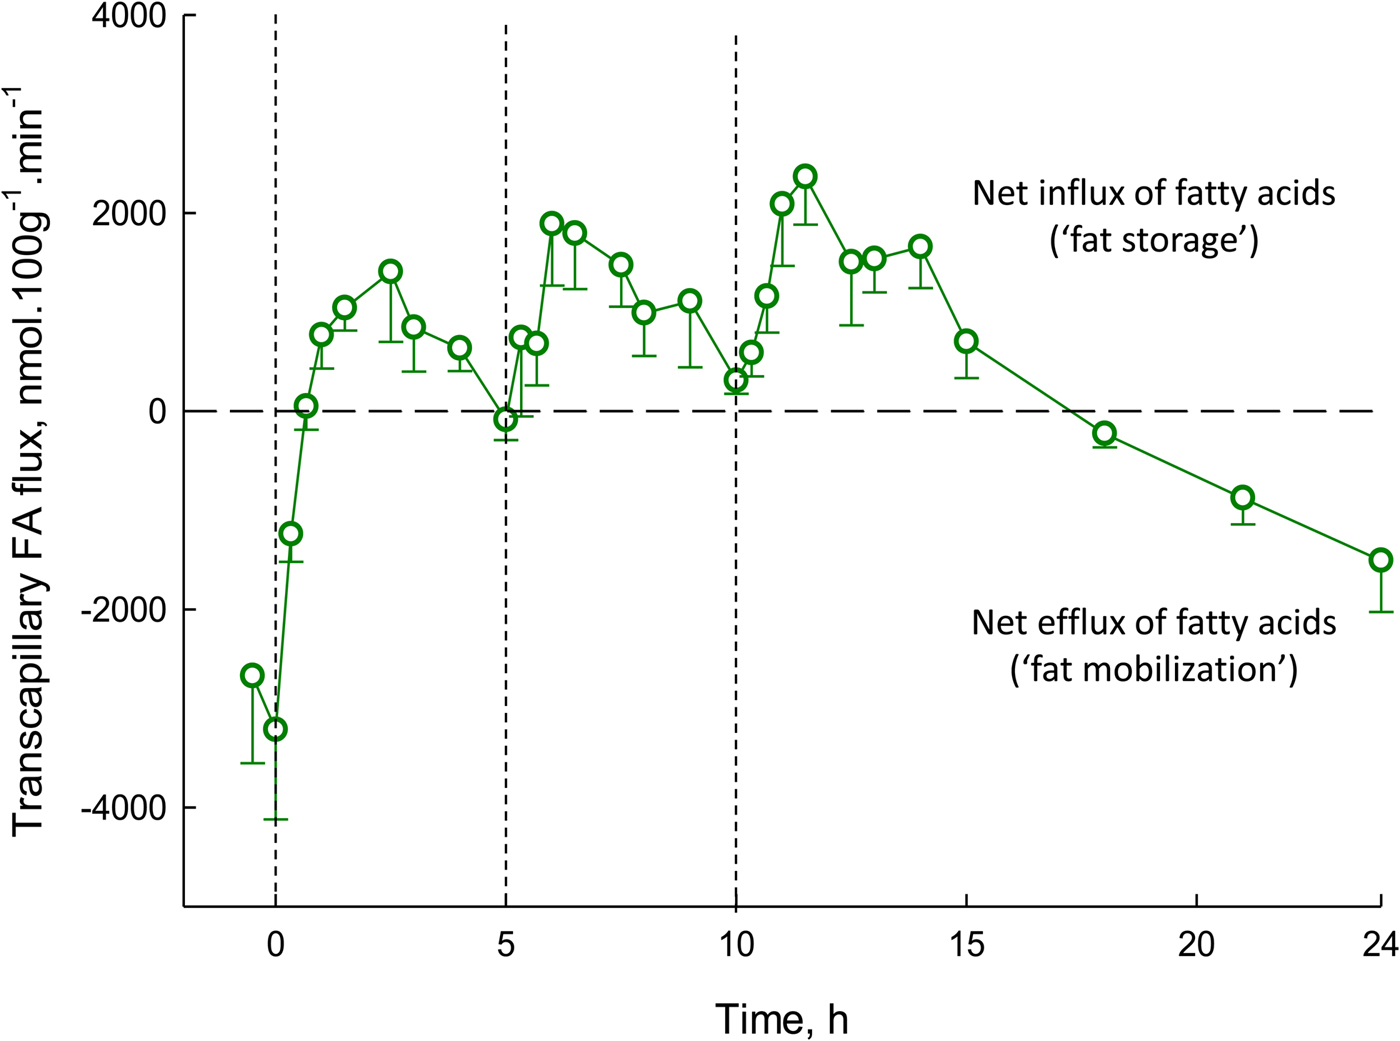
Transcapillary flux of fatty acids is shown over a 24-h period in Fig. 5. It shows some important features. Transcapillary flux is negative (meaning the net flow of fatty acids from adipocytes into capillaries) after overnight fast, exactly as expected, as this represents fat mobilisation. Within 1 h of eating breakfast, this outward flow of fatty acids is abolished, and then there is a net movement of fatty acids into adipocytes for the next 16 h or so, with large peaks following lunch and evening meal. The net fat mobilisation is only seen again in the early hours of the morning. This figure highlights the challenge facing all of us each day: ensuring the positive area under the curve for our own individual graphs of transcapillary flux is no greater than the negative area under the curve. It also shows clearly that most of every 24-h period is spent in a state of fat storage rather than fat mobilisation (16 h v. 8 h in this example).
(Colour online) Transcapillary flux of fatty acids in human adipose tissue over 24 h. Transcapillary flux is defined in Fig. 4. Measurements were made in nine lean, healthy men. Measurements began after an overnight fast. At times shown by dashed lines, meals were provided, equal in macronutrient and energy content. Based on studies reported previously(Reference Ruge, Hodson and Cheeseman29) (see original for fuller experimental details).
The concept of adipose tissue as a ‘buffer’ for fatty acid metabolism
The picture that emerged from these studies was of a very dynamic pattern of metabolism, in which incoming dietary fatty acids were rapidly taken up into adipose tissue, and then fatty acids released again during periods of fasting or energy requirement, e.g. exercise. This suggested an analogy with the role of the liver in glucose metabolism. When dietary glucose is available, liver cells take up glucose and store it as glycogen; they also switch off glycogen breakdown and gluconeogenesis. This is one means by which the body minimises the rise in blood glucose concentration following a meal. We saw that adipose tissue was playing a very similar role in fat metabolism, taking up fatty acids after a meal and then releasing them when required, a concept we called ‘buffering of fatty acids’(Reference Frayn5), a paper cited >600 times. This ‘buffering’ action would protect other tissues such as the liver, skeletal muscle, the pancreatic β-cell and blood vessels from an excess flux of dietary fatty acids in each postprandial period. It is known that fat deposition in these non-adipose tissues (ectopic fat deposition) is tightly linked to metabolic disturbances including insulin resistance. In that sense, dynamic adipose tissue function is a mechanism to maintain metabolic health.
In later studies, to be described later, we looked at conditions in which this dynamic picture of adipose tissue function might be disturbed, especially in obesity.
Day-to-day turnover of the fat stores accompanies longer-term turnover
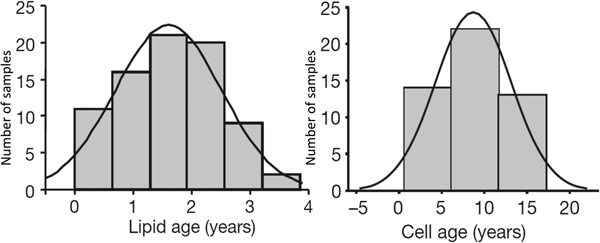
Kirsty Spalding (Karolinska Institute) and Peter Arner (Huddinge Hospital) in Stockholm collaborated to look at the turnover of human adipocytes. They used the fact that atmospheric atomic bomb tests in the early 1960s led to a sharp increase in atmospheric 14CO2 levels. These levels dropped after atmospheric testing was banned in 1963. People alive at the time consumed food that had been enriched with 14CO2, and this labelled (amongst other components) the DNA of their fat cells. By extracting DNA from stored adipose tissue samples and matching labelling with the date of the biopsy, they calculated the turnover of human fat cells, finding a mean lifetime of about 10 years(Reference Spalding, Arner and Westermark6). I joined their collaboration when they extended it to look at the turnover of adipose tissue TAG. We found that the average age of adipose tissue TAG was closer to 1 year(Reference Arner, Bernard and Salehpour7). Thus, the adipose tissue TAG stores are constantly turning over, and the average adipocyte replaces its TAG ten times during its lifetime (Fig. 6).
Distribution of ages of lipids (mainly TAG) and of cells (DNA) in human adipose tissue. The vertical axis represents the number of observations. Measurements made by measurement of 14CO2 incorporation (see text). Combined data from(Reference Spalding, Arner and Westermark6, Reference Arner, Bernard and Salehpour7).

Adverse metabolic effects of obesity
The adverse health consequences of obesity are well known. In a recent meta-analysis of 10·6 million people in five continents followed prospectively for a median of 14 years, all-cause mortality was lowest in the BMI range 20–25 kg/m2. Mortality was higher in people of BMI <20 kg/m2 and increased steadily with increasing BMI above 25 kg/m2. Obesity (BMI 30–35 kg/m2) was associated with a 45% increase in mortality, grade 2 obesity (BMI 35–40 kg/m2) with a 94% increase and BMI <40 kg/m2 with a 176% increase in mortality(8).
Alongside increased all-cause mortality is an increase in mortality from CVD. This is likely to be related to a large extent to concomitant changes in serum lipids, along with changes in glucose metabolism and blood pressure. A meta-analysis of fifty-eight cohorts (220 000 people) in seventeen countries looking specifically at CVD risk showed that for each 1 standard deviation increment (4·6 kg/m2) in BMI above 20 kg/m2, there was a 23% increase in CVD risk. This was largely abolished (7% increase, still highly significant) when other known risk factors were adjusted for (blood pressure, diabetes, total and HDL-cholesterol), showing that the effects of obesity are mediated largely through such variables(Reference Wormser and Kaptoge9).
The adverse effects of obesity on glucose and lipid metabolism seem to be associated with accumulation of TAG in tissues other than adipose tissue; now, as mentioned earlier, usually called ectopic fat deposition. A common view is that these adverse changes originate from alterations in adipose tissue, especially local inflammatory changes, which may result in liberation of pro-inflammatory signals (mainly cytokines, although many other candidates have been proposed) that affect other tissues(Reference Cusi10). However, in trying to figure out the chain of events linking obesity to adverse consequences, and especially CVD risk, it is important to bear in mind an apparent paradox. People who lack normal amounts of adipose tissue, the condition of lipodystrophy or lipoatrophy (which may be genetic or acquired, e.g. in HIV infection), have a metabolic phenotype extremely similar to the obese: insulin resistance, strong tendency to develop type 2 diabetes, adverse changes in serum lipids and hypertension(Reference Garg11). We must seek an explanation for how this harmful metabolic phenotype arises from either too much or too little adipose tissue.
Adipose tissue increases in obesity more than you might think
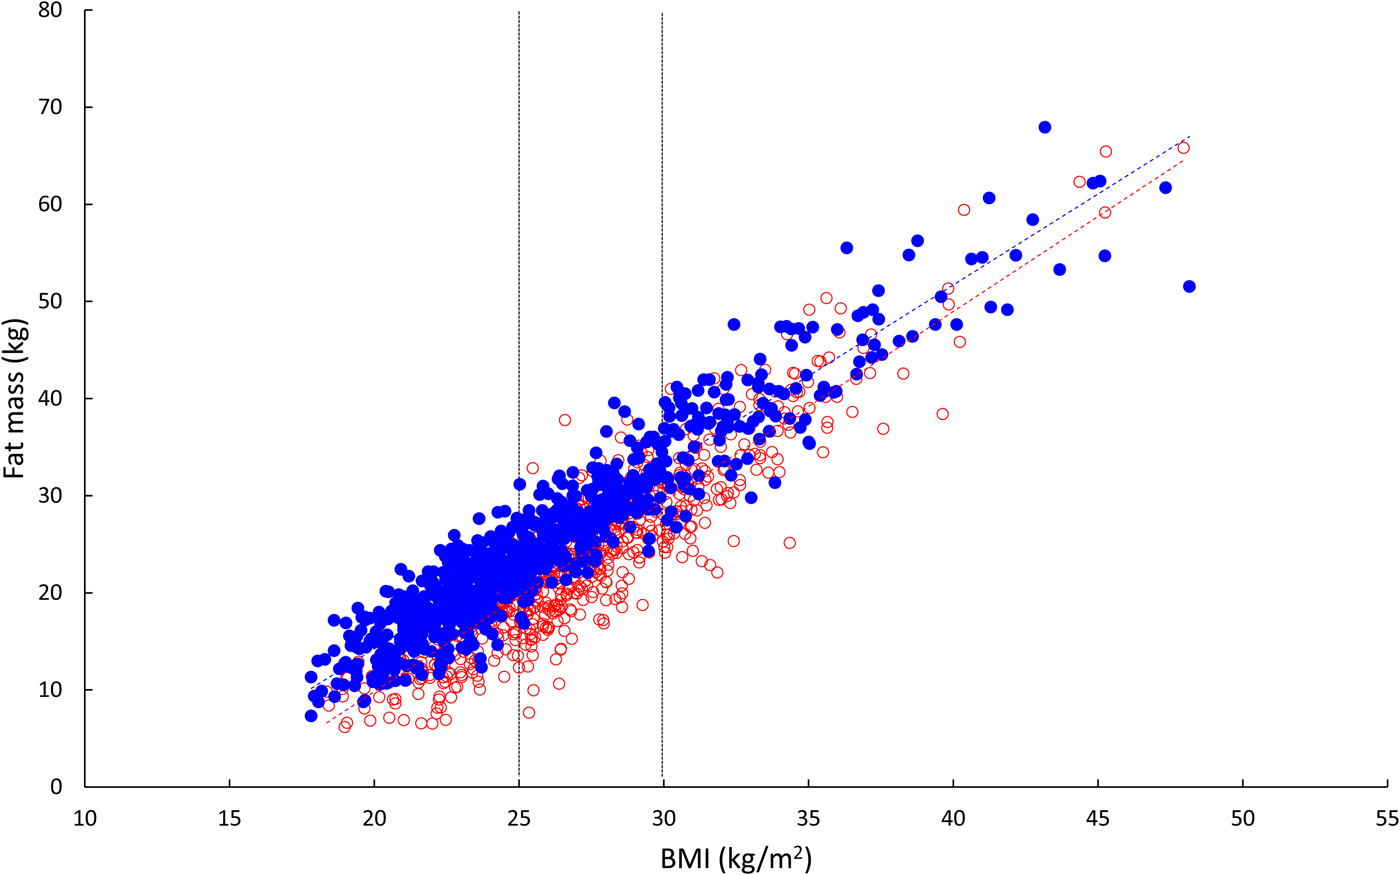
We conducted detailed metabolic studies in a group of men who were metabolically relatively healthy, with normal glucose tolerance. These men had a mean BMI of 31 kg/m2, so were just in the obese category. We compared them with leaner men with a mean BMI of 22 kg/m2. At first, I naively assumed that their fat mass, like their BMI, was different by a factor of about 50% (i.e. 30-ish v. 20-ish). It was not until I took notice of our measurements of body fat content that I realised this is far from the case: the difference in fat mass between the groups is 2·5-fold. Fig. 7 shows the relationship between body fat content (kg) and BMI (kg/m2) in 1500 men and women participating in the Oxford Biobank(Reference Tan, Neville and Liverani12) (data kindly supplied by Fredrik Karpe). Body fat was measured by dual X-ray absorptiometry. There is a strong linear relationship between body fat content and BMI in both men and women (r 2 values 0·89, 0·81, respectively). Table 1 shows body fat content against BMI calculated using the appropriate linear regression line. It can be seen that comparing a man with BMI 30 v. 20 kg/m2, he will have three times the fat mass; this will be (approximately) seven times for a man with BMI 50 v. 20. The ratios for women are not quite so extreme as lean women have more fat than men, but nevertheless, the same trend is evident. In obesity, then, even those only just in the obese category have a considerable excess of adipose tissue.
(Colour online) Relationship between body fat content and BMI in 1500 healthy people. Open red circles, women; solid blue circles, men. Linear regression lines are shown. The vertical lines show cut-offs for overweight (BMI >25 kg/m2) and obesity (BMI >30 kg/m2). Calculations are presented in Table 1. Data from Oxford BioBank kindly provided by Fredrik Karpe.
Relationship between body fat content and BMI

Values are body fat content (kg) calculated for various values of BMI from linear regression using data shown in Fig. 7.
Changes in adipose tissue function in obesity
One of the metabolic products of adipose tissue is NEFA, as described earlier. There has been a considerable literature based on the premise that an expanded adipose tissue mass will correspondingly increase plasma NEFA concentrations, and elevated NEFA concentrations are known to have many adverse effects including induction of insulin resistance. But, as we showed when reviewing this area recently, the evidence does not stack up(Reference Karpe, Dickmann and Frayn13). If we examine a much-cited study of plasma NEFA concentrations in obesity(Reference Opie and Walfish14), it shows average NEFA concentrations rising with increasing obesity. Mean NEFA concentrations after overnight fast were 480 µmol/l v. 810 µmol/l in lean and grossly obese, but the respective fat masses were 4 kg v. 45 kg. Reeds et al. studied a group of massively obese, severely insulin resistant young women(Reference Reeds, Stuart and Perez15). The obese women (mean BMI of 49 v. 22 kg/m2 in lean controls) had six times the fat mass of the lean controls (74 v. 12 kg), yet their plasma NEFA concentrations were virtually identical (obese 380, lean 410 µmol/l). It becomes clear that adipose tissue NEFA release in obesity must be massively suppressed.
This has been recognised for some decades in studies of adipose tissue ex vivo. Adipose tissue from obese people displays a suppression of fat mobilisation when stimulated with catecholamines, and a lower expression of the key enzymes of fat mobilisation, adipose tissue TAG lipase and hormone-sensitive lipase(Reference Langin, Dicker and Tavernier16, Reference Jocken, Langin and Smit17). Some authors have interpreted this as a potential cause of obesity(Reference Langin, Dicker and Tavernier16). I find it far more plausible to suggest that this is a physiological adaptation to avoid excessive NEFA concentrations.
I will briefly draw a parallel with another observation we and others have made in obese people. In lean people, blood flow through adipose tissue, which we measure in most of our studies, increases sharply after a meal(Reference Samra, Frayn and Giddings4, Reference Summers, Samra and Humphreys18). It may increase 3-fold within 30 min of eating. The mechanism is largely adrenergic stimulation, as the increase is mostly blocked by an adrenergic β-blocker(Reference Simonsen, Bülow and Astrup19, Reference Ardilouze, Fielding and Currie20). But adipose tissue blood flow is typically reduced in obese people, and their response to meals is characteristically blunted(Reference Summers, Samra and Humphreys18). Is this pathology or physiology? Cardiac output (l/min) is similar in lean and obese people (Reference Green, O'Connor and Kiely21). Given the accumulation of adipose tissue described earlier, it seems obvious that the down-regulation of adipose tissue blood flow is a physiological adaptation to maintain adequate blood flow to other organs. And if someone with (for instance) a 3-fold greater fat mass were then to experience a 3-fold increase in adipose tissue blood flow after a meal, they would presumably be flat on the floor. Again we can see responses that might be thought of as pathology in terms of a physiological adaptation.
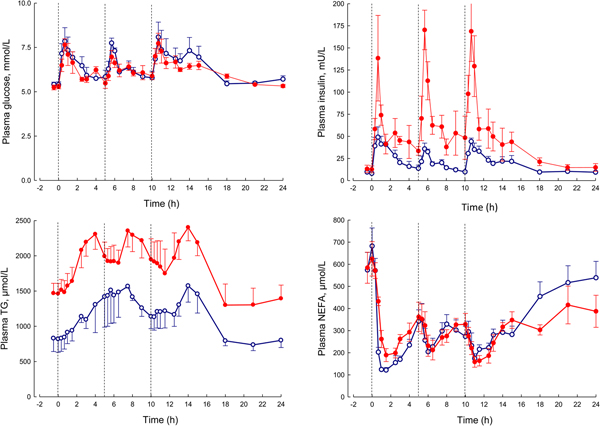
In our laboratory, detailed metabolic studies in the obese group show several expected features (Fig. 8). This group has normal glucose concentrations, but these are achieved at the expense of greatly increased insulin concentrations, a clear demonstration of insulin resistance. Their NEFA concentrations are identical to the lean, but they have consistently elevated plasma TAG concentrations. How can we interpret these findings against the model of adipose tissue function that I have outlined?
(Colour online) Plasma glucose, insulin, TAG and NEFA over 24 h in lean (open circles) and obese men (solid circles). The lean men, and the study design are similar to those reported in Fig. 5. The lean men had a mean BMI of 22 kg/m2, the obese men 31 kg/m2. The vertical dashed lines show times of meals. Based on data presented more fully previously(Reference McQuaid, Hodson and Neville23).
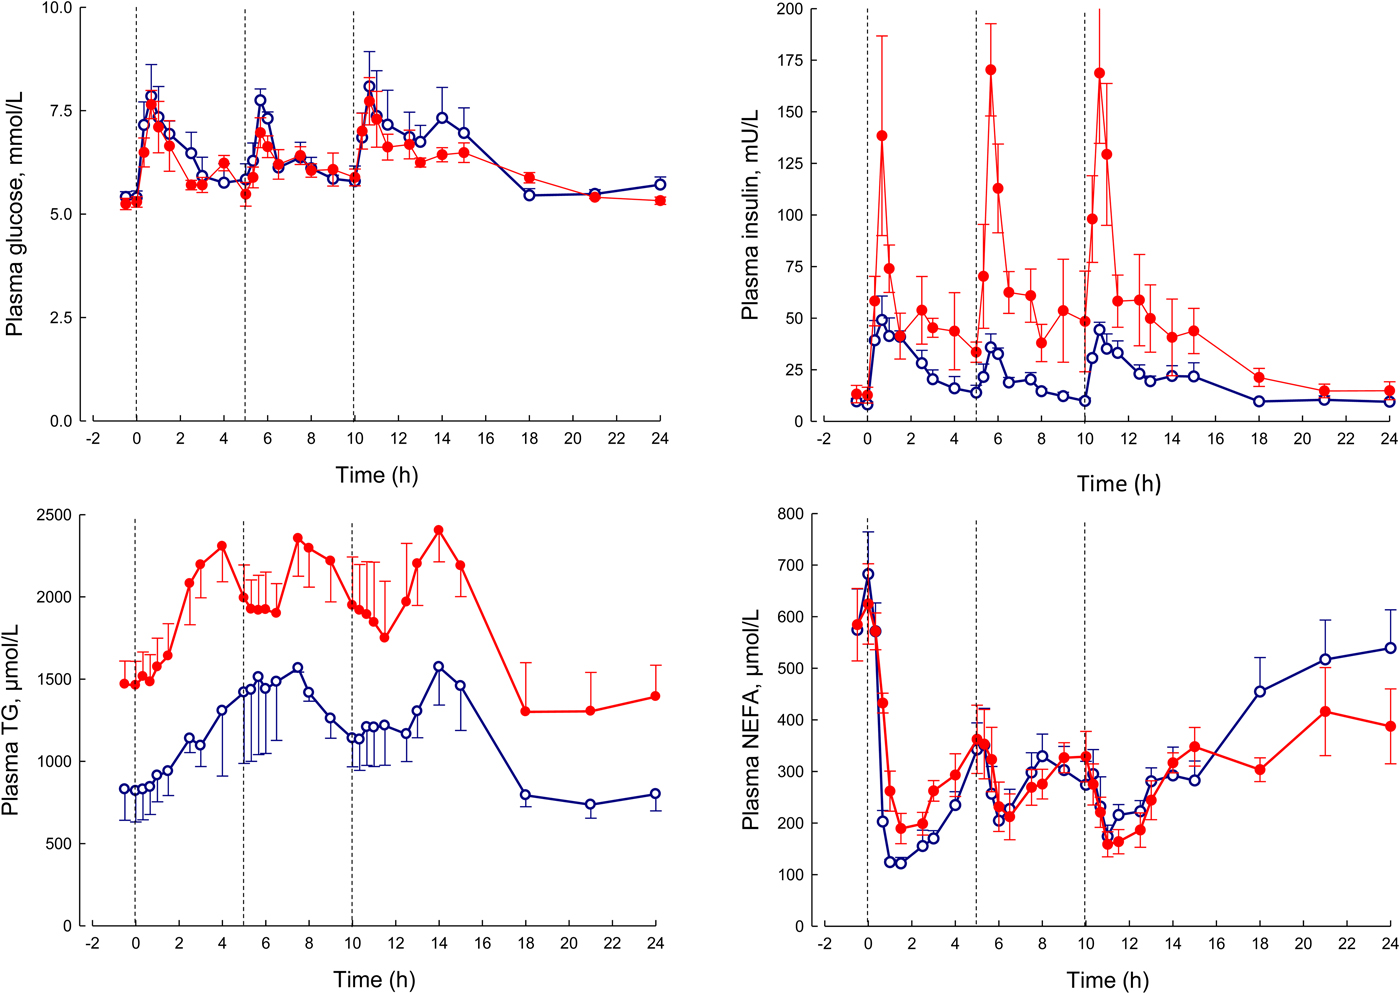
I stressed earlier the close regulation of adipose tissue TAG content. In any one day, the amount of new fat stored must (on average) match the amount of fat mobilised. If one pathway is suppressed, in this case, fat mobilisation, then the other pathway must be equally suppressed. Adipose tissue TAG clearance in the obese group is much reduced compared with the lean, as we found in earlier studies of single meals(Reference Potts, Coppack and Fisher22, Reference McQuaid, Hodson and Neville23). If incoming dietary fat is not rapidly taken up by adipose tissue, then other organs will be exposed to an excess flux of fat in various forms, and this is potentially an explanation for ectopic fat deposition as well as elevated plasma TAG concentrations.
From elevated plasma TAG concentrations, other features of the dyslipidaemia associated with obesity and insulin resistance, including depression of HDL-cholesterol concentrations and formation of small, dense LDL particles, will follow by well-understood mechanisms(Reference Griffin and Fielding24).
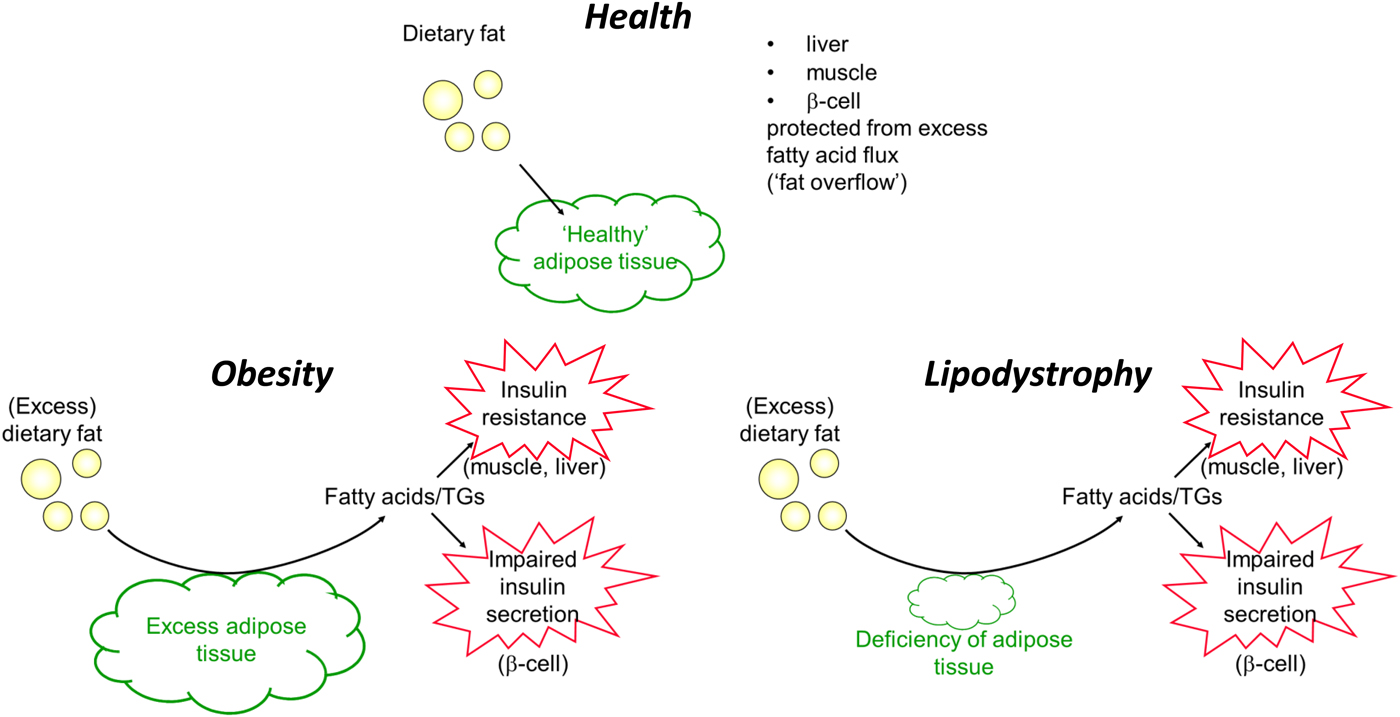
To conclude this section, I will revisit the apparent paradox of lipodystrophy and its metabolic phenotype, so similar to that of obesity. In lipodystrophy, the lack of sufficient adipose tissue will lead to exactly the same process: adipose tissue will be unable to remove sufficient TAG in the postprandial period to spare other organs from excess fatty acid flux. These ideas are summarised in Fig. 9.
(Colour online) Summary of handling of dietary fat in health, obesity (excess adipose tissue) and lipodystrophy (deficiency of adipose tissue). TGs, TAG.
Conclusions
In the view I have presented, adipose tissue fulfils an important metabolic role in day-to-day metabolic management, acting in fat metabolism much as the liver does for carbohydrate: storing excess fatty acids when available, and releasing them when needed. In obesity, this function is disturbed. There have been many explanations for this, mostly in recent years focussing on the inflammation observed in adipose tissue in obesity. I make a different case: that because of marked expansion of adipose tissue mass, there is an appropriate, physiological adaptation to prevent excessive concentrations of NEFA which would have damaging metabolic effects. However, because of the tight regulation of adipocyte fat balance, suppression of NEFA release is accompanied by suppression of TAG clearance, leading to fat deposition in other tissues and many of the adverse metabolic consequences observed in obesity.
Acknowledgements
I have worked with many people in Oxford and elsewhere during the course of the studies on which the present paper is based. Indeed the 24-h studies on which much of the thinking developed here were based and brought to fruition by my colleague Fredrik Karpe, as were some of the other experiments I have cited. I am grateful to all these colleagues and collaborators, too numerous to list here, although the support of Barbara Fielding, Leanne Hodson, Sandy Humphreys and Fredrik Karpe has been particularly valuable. I thank Fredrik Karpe for allowing me to use data from the Oxford Biobank cohort, and Jasper Miller for supplying them. The contents of the present paper are novel although they build upon ideas that were first put in writing in this journal more than a decade ago(Reference Frayn25).
Financial Support
Funding for these studies over many years has come from many sources. Major funders include Wellcome Trust, Biotechnology and Biological Sciences Research Council, European Commission and British Heart Foundation.
Conflict of Interest
None.
Authorship
The author had sole responsibility for all aspects of preparation of this paper.