
The onset of extensive glaciation in the latest Pliocene in the Northern Hemisphere marked a fundamental change in the suite of geomorphic processes acting on land surfaces. On the segment of the North Atlantic passive margin in Scotland, landscapes had evolved during the Mesozoic and earlier Cenozoic through the interplay of tectonics, rock properties and surface processes operating under warm to temperate humid climates. Denudation involved prolonged and pervasive chemical weathering acting on a diverse rock substrate (Godard Reference Godard1965; Hall Reference Hall, Connell, Ehlers, Gibbard and Rose1991), with formation of thick saprolites (Hall Reference Hall1986). The removal of weathering products was by solution and slope processes, with fluvial transport of the detritus of weathering towards sediment sinks on the North Atlantic shelf (Stoker et al. Reference Stoker2010) and in the North Sea basin (Japsen Reference Japsen1997; Hall & Bishop Reference Hall and Bishop2002).
During the Pleistocene (ca.2.6–0.01 Ma), renewal of the saprolite layer slowed due to episodic glacier ice cover, lower average temperatures in ice-free intervals, the development of permafrost and increasing exposure of quick-drying rock surfaces. Chemical weathering rates remained high, however, as frost weathering and glacial comminution generated small rock fragments of high surface area that were then exposed to soil water (Raymo & Ruddiman Reference Raymo and Ruddiman1992). Periglacial slope processes were likely highly effective in mountain areas in moving existing and newly produced regolith towards river channels (Bartsch et al. Reference Bartsch, Gude and Gurney2009), as in Scotland during the Lateglacial and Holocene periods (Ballantyne & Harris Reference Ballantyne and Harris1994). Episodic ice sheet development was locally preservative in its impact on landscapes, where cold-based, non-erosive ice covers effectively sealed off the land surface from weathering and erosion for long periods (Sugden Reference Sugden1968; Hall & Sugden Reference Hall and Sugden1987). Elsewhere, glacial erosion had a transformative effect on scenery, stripping away old weathering mantles (Clark & Pollard Reference Clark and Pollard1998) and quarrying and abrading newly exposed fresh rock surfaces (Krabbendam & Bradwell Reference Krabbendam and Bradwell2011). In the mountains, channelling of ice flow along existing and new valleys led to efficient vertical glacial erosion and the deep incision of valleys and cirques (Sugden Reference Sugden1968; Hall & Kleman Reference Hall and Kleman2014).
Recent work in Scotland has been focused on the study of Late Pleistocene (128–12 ka) environments, landforms and sediments (Ballantyne & Small Reference Ballantyne and Small2019; Merrit et al. 2019; Smith et al. Reference Smith, Barlow, Bradley, Firth, Hall, Jordan and Long2019). Events in the Early (2.588–0.774 Ma) and Middle (774–128 ka) Pleistocene have received much less attention despite the far longer time periods involved. Yet these critical intervals bridge the deep time of the Palaeogene and Neogene and the near-present of the last glacial cycle. This paper aims to provide the first synoptic review of changing environments, developing landforms and terrestrial stratigraphy during the Early and Middle Pleistocene in Scotland. The tectonic and climatic framework for relief development, erosion and sedimentation is explored using evidence from climate proxies, the offshore sedimentary record and ice sheet models. The variable impact of glacial erosion across Scotland is examined using its landscapes and landforms and linked to former glacier basal thermal regimes. Non-glacial processes were also important in shaping the land surface, especially during the Early Pleistocene, through the action of chemical weathering, pedogenesis, frost riving and solifluction operating over rock substrates of diverse lithology and structure. Sediments of Early to Middle Pleistocene ages are not widely preserved on land in Scotland but those which exist represent an important archive of environmental changes before the last glacial cycle and the extent, flow paths and dynamics of Middle Pleistocene ice sheets.
1. Pleistocene tectonic and climate history
Episodic Cenozoic uplift of Scotland commenced in the middle Palaeocene and continued into the Neogene (Le Coeur Reference Le Coeur1999; Praeg et al, Reference Sissons2005; Gregersen & Johannessen Reference Gregersen and Johannessen2007; Stoker et al. Reference Stoker2010). The latest uplift began at ∼4 Ma, prior to the onset of extensive glaciation, and may have extended into the Pleistocene (Stoker et al. Reference Stoker2010). In the English Peak District, uplift has been estimated at 300 m since 12 Ma (Pound & Riding Reference Pound and Riding2015) or ∼3 Ma (Westaway Reference Westaway2009). Evidence from caves of valley incision and from raised beaches suggests uplift of the Alston Block in northern England at rates of 0.2 mm/yr over the last 0.8 Ma (Westaway Reference Westaway2016). Subsidence continued in the North Sea basin through the Plio-Pleistocene (Cameron et al. Reference Cameron, Stoker and Long1987; Westaway Reference Westaway2016), with the top surface of Pliocene lignite-bearing deltaic sediments found in borehole 81/19 in the outer Moray Firth) now lying at a depth of 180 m (Andrews et al. Reference Andrews, Long, Richards, Thomson, Brown, Chesher and McCormac1990). Pleistocene uplift of the land area of Scotland was probably limited, as an extensive peripheral planation surface of likely Pliocene age is now found at 80–120 m a.s.l. in Lewis, NW Scotland, Caithness and Buchan (Godard Reference Godard1965). Remnants of deep gruss weathering indicate prolonged subaerial exposure and a position above sea level during weathering. In The Minch and the Sea of the Hebrides, the peripheral planation surface is dislocated, with up to 150 m of displacement along the Minch and Camasunary–Skerryvore Faults and uplift of up to 200 m for the Rum horst (Le Coeur Reference Le Coeur1988), but with submergence of platforms W of the Outer Hebrides. Marine deposits and shore platforms are absent from elevations >45 m in Scotland (Smith et al. Reference Smith, Barlow, Bradley, Firth, Hall, Jordan and Long2019), although flint gravels in eastern Buchan at up to 140 m a.s.l. have been interpreted as beach deposits (Bridgland et al. Reference Bridgland, Saville and Sinclair1997). Neotectonic activity, including Lateglacial reactivation of existing faults in response to postglacial isostatic rebound is now widely documented around the Inner Hebrides (Firth & Stewart Reference Firth and Stewart2000; Smith et al. Reference Smith, Stewart, Harrison and Firth2009; Stoker & Bradwell Reference Stoker and Bradwell2009).
Global climate cooled through the Cenozoic Era. The first ice sheets appeared in Greenland at 38 Ma (Eldrett et al. Reference Eldrett, Harding, Wilson, Butler and Roberts2007), but it was not until ∼2.7 Ma that large ice sheets developed at mid-latitudes in the Northern Hemisphere (Bailey et al. Reference Bailey, Hole, Foster, Wilson, Storey, Trueman and Raymo2013). In the Early Pleistocene, global climate forcing was driven by 41 ka orbital cycles, but during the Middle Pleistocene Transition (MPT) at 1.2–0.7 Ma (Head & Gibbard Reference Head and Gibbard2005), there was a shift towards forcing driven by 100 ka cyclicity (Clark et al. Reference Clark, Archer, Pollard, Blum, Rial, Brovkin, Mix, Pisias and Roy2006). As James Croll (Reference Croll1875) foresaw nearly 150 years ago, a global consequence was to produce longer and more intense cold periods, which changed both the timing and extent of glaciation (Lee et al. Reference Lee, Woods and Moorlock2015).
The δ180 record for North Atlantic marine sediments constrains the first-order timing and intensity of environmental change in Scotland through the Pleistocene. This approach follows earlier work in Scotland (Clapperton Reference Clapperton and Gordon1997) and northern Fennoscandia (Kleman et al. 2008; Hall et al. Reference Hall, Ebert and Hättestrand2013a). We take δ180 values for known Late Pleistocene glacial events in Scotland and assume that similar events occurred in the past when δ180 values were similar (Fig. 1). This comparison is simplistic, because the global ocean temperature fluctuations recorded by benthic foraminifera can provide only a general picture of ice sheet extent and volume at the regional scale (Clark et al. Reference Clark, Dyke, Shakun, Carlson, Clark, Wohlfarth, Mitrovica, Hostetler and McCabe2009). Nonetheless, this method suggests that the build-up of ice caps in Scotland started at ∼2.72 Ma, with ice sheets covering most of Scotland for brief periods (mainly <10 ka) from 2.5 Ma onwards. The Early Pleistocene period was otherwise dominated by two climate types (Fig. 1): (i) an interglacial or interstadial type, when warm or cool temperate conditions prevailed and glaciers were absent; and (ii) a stadial type, when ice caps developed at higher elevations and periglacial conditions, with periods of permafrost (Vandenberghe Reference Vandenberghe, Paepe and Melnikov2001), prevailed for long periods at lower, peripheral locations. The Early Pleistocene vegetation records of East Anglia indicate warmer interglacial conditions than at present in England, with establishment of temperate mixed coniferous/deciduous forest that included Tsuga (hemlock) and Pterocarya (wingnut) (West Reference West1962). Comparison with MIS 5 temperature gradients in NW Europe (Sejrup & Larsen Reference Sejrup and Larsen1991) suggests the widespread growth at low elevations in Scotland of deciduous woodland in warm stages of the Early Pleistocene.

Figure 1 The δ18O record for benthic foraminifera from marine core DSDP 607 (Ruddiman et al. Reference Ruddiman, Raymo, Martinson, Clement and Backman1989) interpreted as a proxy for glacier extent in Scotland. The cut-off value of >3.7 ‰ δ18O indicates when conditions were equivalent to the Younger Dryas event (Small & Fabel Reference Small and Fabel2016), when mountain ice caps, valley and corrie glaciers formed in Scotland (Clapperton Reference Clapperton and Gordon1997). The cut off value of >4.2 ‰ δ18O is that at 37.5 ka in DSDP 607, a time when the last ice sheet started to build up in Scotland (Hubbard et al. Reference Hubbard, Bradwell, Golledge, Hall, Patton, Sugden, Cooper and Stoker2009). Abbreviations: IG = interglacial; IS = interstadial; MIC = mountain ice cap; MIS = marine isotope stage; MPT = Mid-Pleistocene Transition. Marine isotope stages marked are equivalent to the following British and NW European stages: MIS 16 (676–621 ka; Happisburgh–Donian); MIS 12 (478–424 Ma; Anglian–Elsterian); MIS 6 (186–130 ka) (Wolstonian–Saalian); MIS 2 (29–14 ka; Late Devensian–Late Weichselian).
The MPT is not readily apparent in the DSDP 607 record (Fig. 1), but the intensity and duration of the cooling events after 0.7 Ma is striking, implying up to ten subsequent phases of ice sheet development in the British Isles. Last (MIS 3-2) ice sheet models indicate a maximum ice surface elevation of 1.5-2 km (Kuchar et al. Reference Kuchar, Milne, Hubbard, Patton, Bradley, Shennan and Edwards2012). Ice sheets of equivalent or greater thickness probably developed in the culminations of the MIS 16, 12 and 8 to 6 cold stages (Fig. 1). Although the dating and extent of some Middle Pleistocene glaciations in eastern England remain controversial (White et al. Reference White, Bridgland, Westaway and Straw2017), glacial deposits in East Anglia (Lee et al. Reference Lee, Woods and Moorlock2015) and in the North Sea (Bendixen et al. Reference Bendixen, Lamb, Huuse, Boldreel, Jensen and Clausen2017) have been correlated with each of these cold stages. Flow of ice from Scotland is recorded by indicator heavy minerals and erratic clasts in Middle Pleistocene tills in East Anglia (Lee et al. Reference Lee, Woods and Moorlock2012).
At the onset of Northern Hemisphere glaciation, mountains ∼1 km-high existed in those parts of Scotland that hold high summits today. Hence, it is likely that the first extensive glaciation of northern Fennoscandia at 2.7 Ma (Flesche Kleiven et al. Reference Flesche Kleiven, Jansen, Fronval and Smith2002) was accompanied by the growth of mountain glaciers in Scotland. Ice-rafted Carboniferous debris records multiple phases of glaciation in Ireland between 2.6 Ma and 1.7 Ma (Thierens et al. Reference Thierens, Pirlet, Colin, Latruwe, Vanhaecke, Lee, Stuut, Titschack, Huvenne and Dorschel2011). Iceberg scours are reported from the floor of the northern North Sea through the Early and Middle Pleistocene (Dowdeswell & Ottesen Reference Dowdeswell and Ottesen2013), requiring marine termination of the Fennoscandian Ice Sheet (FIS) on several occasions. Thick glacimarine sediments accumulated in the northern North Sea, sourced mainly from Fennoscandia, between 2 Ma and 1.2 Ma, but there is no firm evidence for advance of the Fennoscandian or British ice sheets into the central part of the basin in this period (Reinardy et al. Reference Reinardy, Hjelstuen, Sejrup, Augedal and Jørstad2017) and fluvial sedimentation continued E of Shetland (Ottesen et al. Reference Ottesen, Dowdeswell and Bugge2014). Subsequent glaciation by an early Shetland ice cap is recorded by N–S-oriented mega-scale glacial lineations (MSGLs) seen in seismic surveys close to the Fladen Ground and dated to 1.1–1.0 Ma (Buckley Reference Buckley2017).
In the west central North Sea, the Early Pleistocene Aberdeen Ground Formation is truncated by an extensive erosional unconformity, the Upper Regional Unconformity (URU), formed at ∼1.2 Ma (Reinardy et al. Reference Reinardy, Hjelstuen, Sejrup, Augedal and Jørstad2017), that is widely regarded as predominantly of glacial origin (Larsen et al. Reference Larsen, Sejrup, Janocko, Landvik, Stalsberg and Steinsund2000; Bradwell et al. Reference Bradwell, Stoker, Golledge, Wilson, Merrit, Long, Everest, Hestvik, Stevenson, Hubbard, Finlayson and Mathers2008b; Graham et al. Reference Graham, Lonergan and Stoker2010, Reference Graham, Stoker, Lonergan, Bradwell, Stewart, Ehlers, Gibbard and Hughes2011). Increasing sediment influx from the west above the URU indicates the growing importance through the MPT of glaciers in Scotland as sediment conveyors to the North Sea. Several sets of MSGLs attributed to subglacial streamlining of sediment have been reported from the Middle to Late Pleistocene sequence, for example, in the Witch Ground Basin between 58° and 59°N (Graham et al. Reference Graham, Lonergan and Stoker2007, Reference Graham, Lonergan and Stoker2010; Stewart et al. Reference Stewart, Lonergan and Hampson2013). In addition, seven generations of tunnel valleys, thought to have been formed mainly by subglacial meltwater flow, have also been observed above the URU in the central North Sea (Stewart & Lonergan Reference Stewart and Lonergan2011). These glacial landforms provide strong evidence supporting inferences from the isotope record (Fig. 1) for multiple advances of grounded ice sheets from Scotland into the North Sea basin since 0.774 Ma.
Patterns of ice flow derived from the transport of glacial erratics by the last ice sheet have long indicated coalescence from discrete ice centres (Fig. 2) (Geikie Reference Geikie1901). Major centres for ice build-up included the high mountains of Galloway, the western Grampians, the NW Highlands and the Cairngorms, with minor ice domes over the Skye Cuillin and Mull (Sissons Reference Sissons1967). Other large, locally warm-based ice masses, including low-elevation cirque glaciers (Barr et al. Reference Barr, Ely, Spagnolo, Clark, Evans, Pellicer, Pellitero and Rea2017), formed over the mainly low ground of the Outer Hebrides (von Weymarn Reference von Weymarn1979), Orkney (Ballantyne et al. Reference Ballantyne, Hall, Phillips, Binnie and Kubik2007) and Shetland (Flinn Reference Flinn1978b), indicating high snow accumulation rates along the North Atlantic seaboard. These growth points are also evident in models of the last British–Irish Ice Sheet (BIIS) (Boulton & Hagdorn Reference Boulton and Hagdorn2006; Hubbard et al. Reference Hubbard, Bradwell, Golledge, Hall, Patton, Sugden, Cooper and Stoker2009). Topographic lows developed on Palaeozoic and Mesozoic sedimentary basins exerted a strong influence over the location and orientation of major ice streams draining the last BIIS in the Sea of the Hebrides, The Minch, the Moray Firth and the Forth. That these topographic and climatic controls also influenced the dynamics of earlier ice sheets is indicated by the geometry and provenance of sediment stacks along the edge of the North Atlantic shelf (Stoker Reference Stoker1997) and in the North Sea basin (Stoker & Bent Reference Stoker and Bent1985). The topographic low centred on the Fladen Ground (Fig. 2) received ice lobes from the eastern BIIS and the western edge of the FIS (Sejrup et al. Reference Sejrup, Aarseth, Ellingsen, Lovlie, Reither, Bent, Brigham-Grette, Jansen, Larsen and Stoker1987). The Norwegian Channel ice stream became a recurrent feature after 1.1 Ma (Sejrup et al. Reference Sejrup, Larsen, Haflidason, Berstad, Hjelstuen, Jonsdottir, King, Landvik, Longva, Nygård, Ottesen, Raunholm, Rise and Stalsberg2003), directing ice flow towards the N and perhaps thereafter reducing the westward extent of Scandinavian ice in the central North Sea (Batchelor et al. Reference Batchelor, Ottesen and Dowdeswell2017). During glacial maxima in the Middle Pleistocene, the BIIS and FIS were probably confluent across a shifting, broad zone in the North Sea (Bendixen et al. Reference Bendixen, Lamb, Huuse, Boldreel, Jensen and Clausen2017) (Fig. 2).

Figure 2 Main features of the Pleistocene glaciation of Scotland. Major and minor centres of ice sheet growth are shaded in blue. Note the belt of ribbon lakes in the western Highlands and the associated basins of the inner sea lochs of the west coast that define a zone of glacial over-deepening beneath former mountain ice caps. Abbreviations: FG = Fladen Ground.
Periglacial environments in the present interglacial have remained confined to high elevations in Scotland (Ballantyne & Harris Reference Ballantyne and Harris1994). In the cold stages of the Pleistocene, however, periglacial conditions, including permafrost extended down to sea level across large parts of NW Europe beyond glacial limits (Renssen & Vandenberghe Reference Renssen and Vandenberghe2003). The cumulative duration of these phases was long, especially in the Early Pleistocene, when the total duration may have approached 1 Myr (Fig. 1). Frost-churning of soils first appears in MIS 22 (0.82 Ma: Beestonian) in East Anglia and indicators of cold climates, including ice wedge casts, reappear throughout the Middle Pleistocene stratigraphy (Rose et al. Reference Rose, Boardman, Kemp, Whiteman, Richards, Arnett and Ellis1985). In Buchan, the record of permafrost, frost weathering and mass wasting extends back into the Middle Pleistocene (Connell & Hall Reference Connell, Hall and Boardman1987). Largely through the work of Colin Ballantyne and his collaborators, the periglacial landforms and materials of the Late Pleistocene and Holocene have been mapped, analysed and dated in Scotland to a level of detail that is unmatched in any other similar-sized terrain in the world (Ballantyne Reference Ballantyne and Small2019). This dataset provides the starting point for assessment of the impacts of periglacial processes in earlier periods.
2. Morphological evidence of Pleistocene glacial and non-glacial erosion
Scotland, despite its modest land area, carries remarkably varied landforms and landscapes that provide evidence of the cumulative impact of the glacial and non-glacial processes that operated on land surfaces through the Pleistocene. At the onset of Pleistocene glaciation, a diversity of fluvial landscapes existed in Scotland, developed in response to episodic Neogene uplift. In the Outer Hebrides and Assynt, an extensive peripheral planation surface backed by mountains was drained by rivers flowing to The Minch and the Sea of the Hebrides (Le Coeur Reference Le Coeur1999). The main watershed lay close to its present position in Northern Scotland (Fig. 3), but later shifted eastward in places after glacial breaching (Godard Reference Godard1965; Jarman Reference Jarman2007). From Glen Affric southwards towards the central lowlands, the watershed zone was highly dissected, with deep valleys set between narrow ridges (Godard Reference Godard1965). Further E in the Northern and Grampian Highlands, extensive plateaux, carrying fragments of elevated planation surfaces, were set between broad straths and basins (Godard Reference Godard1965; Hall & Bishop Reference Hall and Bishop2002; Jarman Reference Jarman, Merritt, Auton and Phillips2017). Peripheral planation surfaces extended across Caithness, Buchan and, probably, the Forth lowlands. The central lowlands held considerable relief due to differential weathering and erosion of Palaeozoic igneous and sedimentary rocks (Sissons Reference Sissons1976). The Neogene geomorphology of the Southern Uplands has not been examined closely but, in its gross form, comprised broad uplands drained, as now, by rivers flowing towards the North Sea, North Channel and Solway Firth (Sissons Reference Sissons1960). In all areas, sets of major landforms – hill masses and isolated hills, scarps, basins and valleys – had developed through the Neogene on a diverse geology in response to differential weathering and erosion acting under humid climates (Hall Reference Hall1991).

Figure 3 Non-glacial landforms and regolith in the northern Scottish Highlands. Submerged platforms in western Scotland after Le Coeur (Reference Le Coeur1988). Other non-glacial landforms from Godard (Reference Godard1965) and Hall (Reference Hall1991). Plateau surfaces with no or weak development of glacial erosion forms mapped from NEXTMap™ imagery. Blockfield distribution in the NW and W Highlands from Ballantyne and others (see text for references). Saprolites and tors from field mapping and literature reports. Coastal rock features from Smith et al. (Reference Smith, Barlow, Bradley, Firth, Hall, Jordan and Long2019).
The forms of glacial erosion are cut into the smooth slopes of this older relief (Fig. 4). Valley heads became settings for corrie glaciers, and river valleys provided ready conduits for glacier flow (Glasser Reference Glasser1995) (Fig. 5). Valley deepening, coupled with increasing valley connectivity, may have led to the adaptation of the topography towards more efficient evacuation of ice flow and to a reduction in valley incision rates through the Pleistocene (Kaplan et al. Reference Kaplan, Hein, Hubbard and Lax2009). In lowland areas with crystalline bedrock, smooth, low-relief surfaces were stripped of regolith, roughened and, in places, streamlined by glacial erosion (Krabbendam & Bradwell Reference Krabbendam and Bradwell2011, Reference Krabbendam and Bradwell2014). Computational experiments have suggested that low-relief plateaux on glaciated passive margins of the Northern Hemisphere were formed exclusively by glacial erosion (Egholm et al. Reference Egholm, Jansen, Brædstrup, Pedersen, Andersen, Ugelvig, Larsen and Knudsen2017). In Scotland, however, as in Scandinavia (Etzelmuller et al. Reference Etzelmuller, Romstad and Fjellanger2007; Ebert et al. Reference Ebert, Hättestrand, Hall and Alm2011), such plateaux are most extensive in eastern areas and lack bedforms indicative of efficient glacial erosion (Fig. 3) whereas, towards the W, plateaux become increasingly fragmented and glacially roughened. Morphological transition and transformation are consistent with Pleistocene glacial modification and dissection of pre-existing landsurfaces.
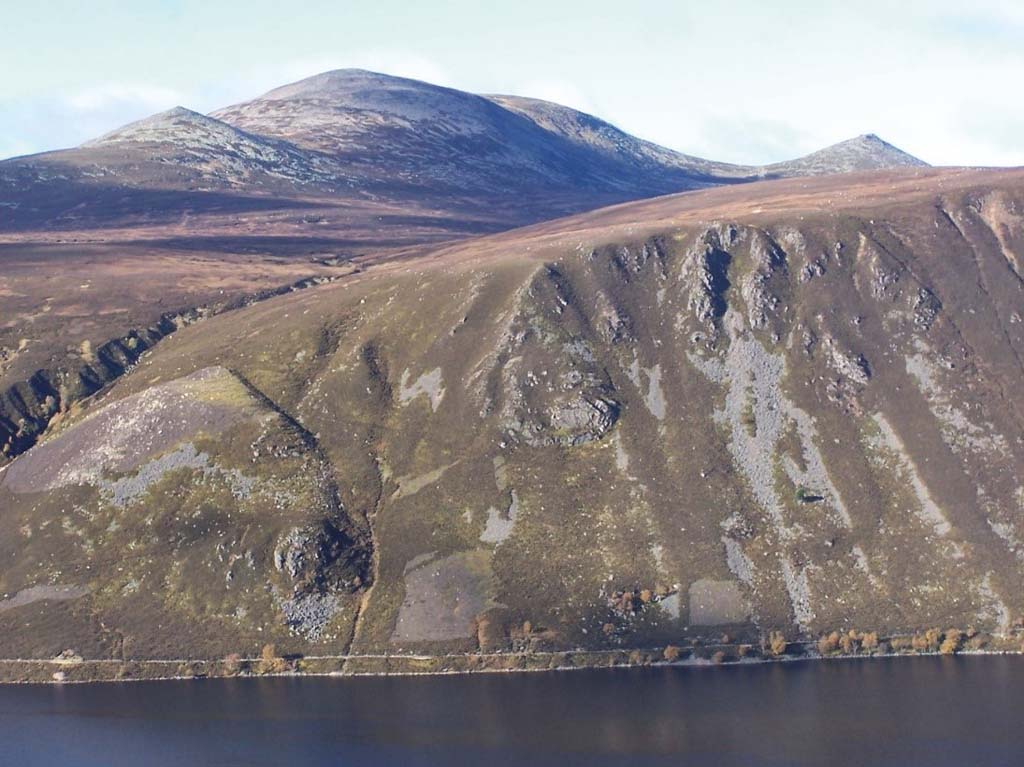
Figure 4 Landscape of selective linear glacial erosion at Lochnagar in the eastern Grampians. The glacial trough now occupied by Loch Muick is cut into the Mounth plateau, a fragment of an extensive planation surface now at 800 m a.s.l. A 200–300 m high scarp rises to the domed granite summits of Lochnagar.

Figure 5 Mountain scenery in the SW Grampians shaped by multiple episodes of fluvial, glacial, periglacial and paraglacial activity. Late Caledonian Etive igneous complex rocks dominate the area shown, with the fault-guided course of Glen Etive in the foreground. The forested hills in the middle ground probably represent remnants of the precursor valley floor of a broad strath, now standing at 310–390 m a.s.l. The glacial trough occupied by Loch Etive descends to 145 m below sea level in rock basins (Audsley et al. Reference Audsley, Arosio and Howe2016). The high summits show glacially roughened rock surfaces and were overwhelmed by warm-based glacier ice beneath the last and earlier ice sheets. During the Loch Lomond Stadial (12.9–11.7 ka), an outlet glacier drained from Rannoch Moor through Glen Etive. Extensive talus accumulations occur at the foot of slopes.
3. Glacial erosion
3.1. Erosion patterns
The variable impact of glacial erosion across Scotland was identified by Linton (Reference Linton, Miller and Watson1959). Comparisons of maps of non-glacial (Fig. 3) and glacial (Fig. 6) landforms and regolith for the northern Scottish Highlands reveal inverse correlations that can be linked to model results for former glacier basal thermal regimes (Fig. 7). Saprolites, tors and pre-Devensian tills are concentrated in NE Scotland and in the eastern parts of the Northern Highlands; areas which lack roughened or streamlined terrain typical where glacial erosion has been effective. Conversely, these non-glacial features are virtually absent from across the Lewisian lowlands of the Outer Hebrides, apart from N Lewis (Hall Reference Hall, Gilbertson, Kent and Grattan1996), and also from the NW Highlands, with its distinctive cnoc-and-lochain terrains. Similar observations led to the recognition of zones of glacial erosion at regional (Linton Reference Linton1963; Clayton Reference Clayton, Brown and Waters1974; Haynes Reference Haynes and Clapperton1983) and sub-regional (Gordon Reference Gordon1979; Hall Reference Hall1986; Hall & Sugden Reference Hall and Sugden1987) scales across Scotland.

Figure 6 Glacial landscapes and landforms in the northern Scottish Highlands. Glacially eroded depressions from Sutherland & Gordon (Reference Sutherland, Gordon, Gordon and Sutherland1993). Corries from Barr et al. (Reference Barr, Ely, Spagnolo, Clark, Evans, Pellicer, Pellitero and Rea2017). Glacial streamlining and roughening mapped from NEXTMap™ imagery.

Figure 7 Cumulative time that the bed for the last (MIS 3-2) British–Irish Ice Sheet was at pressure melting point (PMP), expressed as a percentage of the total simulation time in experiment E102b2 (Hubbard et al. Reference Hubbard, Bradwell, Golledge, Hall, Patton, Sugden, Cooper and Stoker2009). Persistent frozen basal conditions are indicated by black shading (% PMP<2.5 %). Assuming that similar basal temperatures developed beneath Early and Middle Pleistocene ice sheets, comparison with Figures 3 and 6 indicates close correlations between: (i) distributions of areas with persistent cold-based ice and non-glacial landforms; and (ii) areas of more frequent warm-based conditions and landscapes of glacial roughening and streamlining.
The contrasting modes of mountain ice cap and full ice sheet glaciation interpreted from the oxygen isotope record from marine core DSDP 607 (Fig. 1) are also important for understanding patterns of glacial erosion and deposition across Scotland. Because of differences in ice extent, the zones of erosion and deposition beneath mountain ice caps and full ice sheets may not coincide, particularly in areas E of the main ice divide. Glacial landform distribution in western Scotland provides evidence for prolonged erosion by mountain ice caps. Alpine glacial topography is restricted to small areas on Skye and in Lochaber (Haynes Reference Haynes and Clapperton1983). Glacial over-deepened rock basins are distributed mainly in 15–30 km-wide zones on both sides of the main watershed throughout its length (Fig. 2). The basins include radial troughs around Rannoch Moor that were excavated by ice flowing from a large ice dome over the SW Grampian mountains (Linton Reference Linton and Embleton1972). An axial ice-shed zone of low erosion exists along the watershed of the Northern Highlands, bounded by areally scoured landscapes and over-deepened valleys to W and E (Gordon Reference Gordon1979) (Fig. 6). Belts of thick glacial deposits occur around the inner Moray Firth and in the lower Clyde basin that include, at depth, pre-MIS 3 tills (see section 6.2). Landform and sediment distribution appears to conform to the erosional and depositional zones of former mountain ice caps that developed through the Middle and Late Pleistocene. Mountain ice-cap extent may have been strongly influenced by calving at marine limits in the inner Moray Firth, the Forth and Clyde lowlands and within the Inner Hebrides (Sissons Reference Sissons1981).
Areas of ice-roughened and ice-streamlined bedrock also occur far outside the mountain ice cap limits reached during the Loch Lomond Stadial. Ice roughening extends across much of the Outer Hebrides and beyond the present coastline of the Northern Highlands in Sutherland and Easter Ross (Fig. 6). The onset zones for former ice streams in western Scotland also lie mainly outside Loch Lomond Stadial limits and extend across large areas of the sea bed in The Minch and the Sea of the Hebrides (Bradwell et al. Reference Bradwell, Stoker and Krabbendam2008a). Ice streams excavated deep basins in the Mesozoic rocks of The Minch (Sissons Reference Sissons1967) and in the inner Moray Firth (Sutherland & Gordon Reference Sutherland, Gordon, Gordon and Sutherland1993). Streamlined terrains in the Tweed (Everest et al. Reference Everest, Bradwell and Golledge2007) and Forth valleys (Golledge & Stoker Reference Golledge and Stoker2006) and around the Firth of Clyde (Finlayson et al. Reference Finlayson, Merritt, Browne, Merritt, McMillan and Whitbread2010, Reference Finlayson, Fabel, Bradwell and Sugden2014) also continue across adjacent areas of the present sea bed. The main ice sheet depocentres were on the North Atlantic shelf and in the North Sea basin (Holmes Reference Holmes and Gordon1997). Glacial erosion and deposition in areas peripheral to the main ice centres must relate to large ice sheets. Bimodal patterns of glacial erosion and deposition linked to mountain ice cap and ice sheet glaciation have been recognised across Fennoscandia (Kleman et al. 2008) but the smaller, highly dynamic glaciers and ice sheets that formerly covered the more complex topography of Scotland have received less attention (Haynes Reference Haynes1977).
Glacial dissection of mountain areas is strongly developed in the western Highlands (Linton Reference Linton1949; Haynes Reference Haynes1977; Jarman Reference Jarman2007). An absence of inherited cosmogenic nuclides from low elevation sites requires removal of >2.5 m of rock in the last glacial cycle (Fame et al. Reference Fame, Owen, Spotila, Dortch and Caffee2018). In Assynt, rates of valley deepening were rapid, estimated at 2 m/ka during periods of glaciation since 280 ka (Hebdon et al. Reference Hebdon, Atkinson, Lawson and Young1998). The density and interconnectivity of glacial valleys drops towards eastern areas (Haynes Reference Haynes1977) (Fig. 6). Progressive glacial modification of valley systems is evident moving E–W across the central Grampians. Little-modified fluvial valley networks remain in the Tarf basin, but valleys become deeply incised in the Forest of Atholl, with the first stages of glacial breaching of watersheds, and pass westwards at Drumochter into highly dissected mountains with interconnected valley systems and deep glacial breaches and cols (Hall & Jarman Reference Hall, Jarman, Lukas, Merritt and Mitchell2004). Valley-in-valley forms are common in Scotland, products of linear glacial excavation of trenches within broad straths (Hall Reference Hall1991) (Fig. 5). Where glacial valleys are developed from fluvial precursors, as in the Cairngorms (Sugden Reference Sugden1968; Hall & Gillespie Reference Hall and Gillespie2016) and across much of the southern Highland boundary (Linton Reference Linton1940), the timescales for glacial modification likely span the Pleistocene (Fredin et al. Reference Fredin, Bergstrøm, Eilertsen, Hansen, Longva, Nesje and Sveian2013). Large meltwater channels may have been re-occupied in successive glaciations, especially where meltwater flow was constrained by topography in cols, for example the many Nye channels in the eastern Grampians (Clapperton & Sugden Reference Clapperton, Sugden, Gray and Lowe1977), or against hill flanks, for example in the Ochils (Russell Reference Russell1995) and Lammermuirs (Sissons Reference Sissons1961). The presence of pre- MIS 5 and younger deposits in channel floors in Moray, Buchan and Caithness (see section 6) indicates at least localised reoccupation.
Glacial modification of landscapes had a marked vertical component. A morphological gradation, from ice-scoured valley floors to roughened valley flanks and smooth plateaux, is a conspicuous feature of many valley cross profiles in the central and eastern Scottish Highlands. Along the western seaboard, blockfields that predate the last glaciation (Hopkinson & Ballantyne Reference Hopkinson and Ballantyne2014) and which mark zones of very limited glacial erosion are confined to the highest summits (Ballantyne et al. Reference Ballantyne, McCarroll, Nesje and Dahl1997, Reference Ballantyne, McCarroll, Nesje, Dahl and Stone1998). Many blockfields are associated with fragments of older, rounded montane topography, dissected by valleys and ‘cookie-cut' by corries. Only in a few areas, such as Knoydart, does ice-roughening extend to summits and here blockfields are almost absent (Ballantyne Reference Ballantyne2000) (Fig. 3). Blockfields drop in altitude towards eastern Sutherland and Caithness (Ballantyne & Hall Reference Ballantyne and Hall2008; Phillips et al. Reference Phillips and Merritt2008). Blockfields have not been mapped systematically in the eastern Grampians, but tors drop from elevations of 1200–600 m in the Cairngorms to 400 m at the Cabrach, 40 km to the NE (Blyth Reference Blyth1969), and to 100 m in Buchan (Hall Reference Hall2005). When compared to the distribution and height of low-relief upland surfaces lacking in glacial erosion forms (Fig. 3), it is clear that the upper limit of effective glacial erosion also declines from W to E across much of the Highlands. This gradient is similar in trend to that seen in models of basal temperature for the last ice sheet (Fig. 7).
3.2. Erosion depths
Depths of cumulative glacial erosion can be estimated by using non-glacial landforms and land surfaces as reference points and surfaces for erosion. Glacial forms, mainly cnoc-and-lochain terrain, rock basins, valleys and corries, are cut into pre-glacial land surfaces and so, along with any glacial lowering of hilltops and interfluves, represent total glacial erosion through the Pleistocene (Hall et al. Reference Hall, Gillespie, Thomas and Ebert2013b). Minor non-glacial forms and weathering mantles – such as many tors (Hall & Sugden Reference Hall, Sugden and Andre2007) and blockfields (Ballantyne Reference Ballantyne2010b) and some shallow saprolites (Wright Reference Wright1997) – are of Early to Middle Pleistocene age and indicate little or no glacial erosion through later glacial cycles. Non-glacial and glacially roughened slopes have been themselves lowered by weathering and erosion through the Pleistocene (Phillips et al. Reference Phillips, Hall, Mottram, Fifield and Sugden2006; Hopkinson & Ballantyne Reference Hopkinson and Ballantyne2014; Andersen et al. Reference Andersen, Egholm, Knudsen, Linge, Jansen, Pedersen, Nielsen, Tikhomirov, Olsen and Fabel2018).
Increasing glacial erosion depths are evident moving W across the Grampians. In eastern Buchan, where Tertiary gravel deposits survive on ridge tops (Hall et al. Reference Hall, Gilg, Fallick and Merritt2015a), erosion is locally of the order of metres. In the type landscape of selective linear erosion in the Cairngorms (Sugden Reference Sugden1968), glacial erosion of plateau surfaces was negligible (Hall & Glasser Reference Hall and Glasser2003), although non-glacial denudation of bare rock surfaces operated at 2.8–12.0 m/Ma (Phillips et al. Reference Phillips, Hall, Mottram, Fifield and Sugden2006). Most erosion resulted from glacial deepening of valleys by a maximum of 200–350 metres (Sugden Reference Sugden1968; Hall & Gillespie Reference Hall, Binnie, Sugden, Dunai and Wood2016). Estimated average Pleistocene erosion depths across the Dee catchment are estimated at 30–60 m, with a substantial contribution from the removal of saprock and saprolite (Glasser & Hall Reference Glasser and Hall1997). In the western Grampians, inheritance of 10Be cosmogenic nuclides is highest on ridge tops and declines or is absent at lower elevations. Modelled erosion rates decline eastwards from 40 to 20 m/Ma (Fame et al. Reference Fame, Owen, Spotila, Dortch and Caffee2018).
Glacially streamlined terrain found along parts of the Great Glen, in much of Caithness and in patches along the lower Dee valley towards Aberdeen (Fig. 6) merges laterally with non-streamlined terrain with similar ridge-top elevations, suggesting that erosion has been restricted mainly to the excavation of valleys and depressions. Similarly, in terrain on the Lewisian basement gneiss of the western seaboard, it has long been thought that glacial erosion has been largely restricted to the removal of regolith (Godard Reference Godard1961), with deep erosion of basement only in basins and valleys (Krabbendam & Bradwell Reference Krabbendam and Bradwell2014). On the Ross of Mull (Fig. 8), the cnoc-and-lochain terrain has been interpreted as a glacially stripped and roughened tor field developed on an erosion platform of Pliocene age (Le Coeur Reference Le Coeur1988). Depths of erosion above cnoc summits, however, remain poorly constrained in both streamlined and roughened terrains. The recognition of mega-grooves 0.1–6 km long, 10–100 m wide and 5–15 m deep on the streamlined bed of a former ice stream in Assynt (Bradwell et al. Reference Bradwell, Stoker and Krabbendam2008a) and the floors of The Minch (Bradwell et al. Reference Bradwell, Stoker and Larter2007) and the Sea of the Hebrides (Dove et al. Reference Dove, Arosio, Finlayson, Bradwell and Howe2015) demonstrate that, in zones of fast ice flow, glacial erosion of hard crystalline rock was, at least locally, highly efficient.

Figure 8 Cnoc-and-lochain terrain developed in Caledonian granite, Fionnphort, Ross of Mull: 1 = Cnoc developed in massive granite; 2 = Rock basin excavated in fractured granite; 3 = Major fracture transverse to ice-flow; 4 = Granite monoliths, with >10 m vertical fracture spacing, acting as resistant, stoss-side bastions.
Deep glacial erosion is manifest elsewhere. In the mountains of the western Highlands, glacial erosion has been highly effective, excavating basins and fjords below sea level and dissecting and lowering pre-existing watersheds (Sissons Reference Sissons1967). Glacially polished surfaces above 500 m in Glen Shiel and Glen Nevis show little or no cosmogenic 10Be inheritance, indicating ≥2.5 m of erosion in the last glacial cycle (Fame et al. Reference Fame, Owen, Spotila, Dortch and Caffee2018). Ice tends to flow towards and stream along pre-existing fluvial valley systems, a confluent flow pattern leading to highly effective linear erosion (Sugden Reference Sugden1968; Nesje & Whillans Reference Nesje and Whillans1994), the main component of the glacial buzz-saw (Hall & Kleman Reference Hall and Kleman2014). Transfluent ice flow in the western Highlands led to breaching of watersheds and to cutting of new valleys (Haynes Reference Haynes1977). Rock basins reach depths of 200–300 m below sea level in lochs Ness and Morar (Sissons Reference Sissons1967), and basins in the Sound of Raasay and Loch Linnhe are of even greater depths (Sissons Reference Sissons1976). In the upper Forth valley, sharp contrasts exist in depths of glacial erosion. Resistant lava plateaux and tapered interfluves developed in softer rocks but somewhat sheltered from glacial erosion in lee locations stand ∼100 metres above the drift-filled floors of the Forth and Teith valleys (Linton Reference Linton1962; Fig. 9). Glacially excavated trenches and rock basins extend below these valley floors to depths below sea level of 100 m E of Stirling and 170 m at Bo'ness (Sissons Reference Sissons1969; Francis et al. Reference Francis, Forsyth, Read and Armstrong1970). Borehole records also show rockhead at 100 m below the Devon valley to the E (Soons Reference Soons1959) In W Fife, the thick Late Carboniferous dolerite sill between the M90 motorway and the Lomond Hills now forms a fragmented scarp that has been breached and lowered by ice flow. Many crag and tail forms in the glacially streamlined terrain of the Central Lowlands are largely erosional features, with crags formed in volcanic plugs and tails formed in sedimentary rock (Burke Reference Burke1969; Sissons Reference Sissons1971; Evans & Hansom Reference Evans and Hansom1996). The difference in elevation of beds on the stoss and lee sides provides a minimum depth of glacial erosion around the crags of 25–100 m (Geikie Reference Geikie1887).
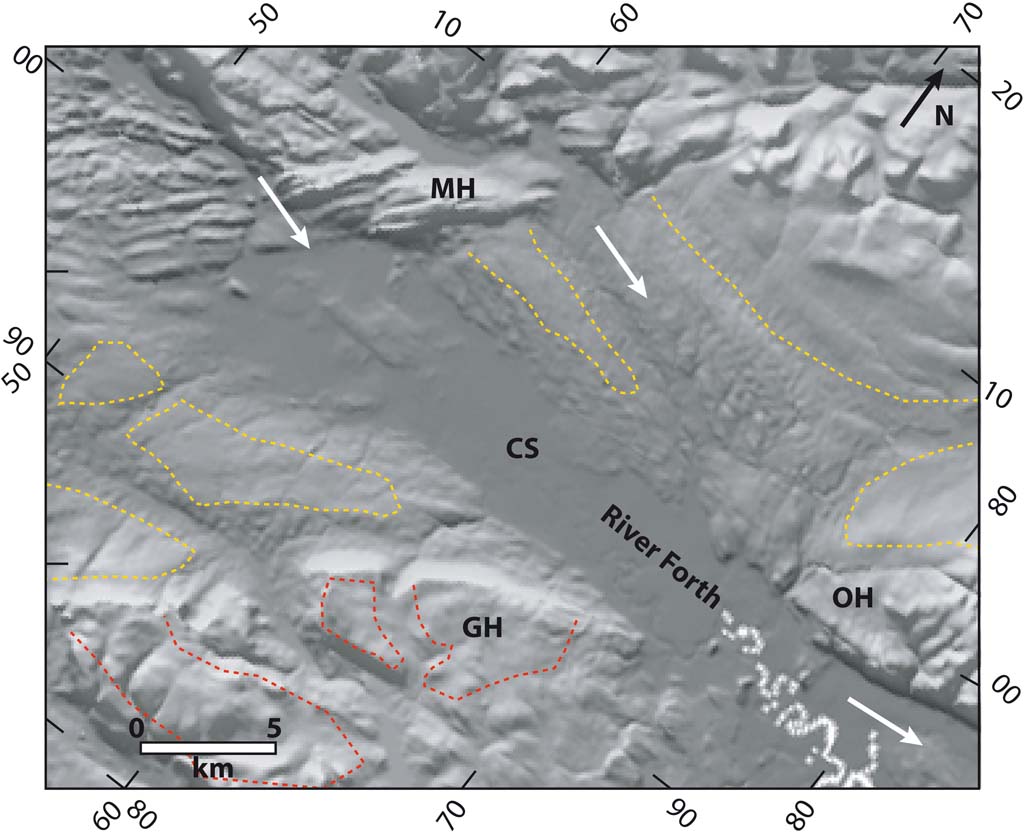
Figure 9 Uneven impact of glacial erosion in the upper Forth valley. Smooth, tapered interfluves (Linton Reference Linton1962) and benches are developed in sandstones of mainly Devonian age (brown dashed lines). Carboniferous lava plateaux, marked by red dashed lines, have been lowered, roughened and weakly streamlined by glacial erosion. The intervening valleys have been over-deepened and thick sediments infill rock basins below the Carse of Stirling (CS) that reach depths of >100 m (Sissons Reference Sissons1967). Abbreviations: GH = Gargunnock Hills. MH = Menteith Hills. OH = Ochil Hills. General direction of ice flow indicated by arrows.
Little attention has been given to the substantial thicknesses of weak Carboniferous to Neogene sedimentary rocks likely removed by glacial erosion from the basins and shelves surrounding Scotland. Major unconformities truncating Early and Middle Pleistocene sediments are mapped in the North Sea (Cameron et al. Reference Cameron, Stoker and Long1987) and on the North Atlantic shelf (Stoker et al. Reference Stoker, Hitchen and Graham1993). Progressively older Cenozoic to Palaeozoic rocks sequences are also truncated to landward (Andrews et al. Reference Andrews, Long, Richards, Thomson, Brown, Chesher and McCormac1990). The mass balance of rock removal and its transfer to the shelf by glacial processes has not been fully quantified, but preliminary investigations suggest that lowering of extensive areas of shelf by glacial erosion was required to produce the large volumes of Pleistocene sediment (Clayton Reference Clayton1996; Glasser & Hall Reference Glasser and Hall1997). Such scalping of inner shelves by glacial erosion and during episodes of low sea level is apparent in the Upper Regional Unconformity off western Norway (Rise et al. Reference Rise, Ottesen, Berg and Lundin2005). Mass transfer from Scotland may have been sufficient to induce isostatic rebound of the land area in response to Pleistocene erosion (Hall & Bishop Reference Hall, Gordon, Whittington, Duller and Heijnis2002) and tilting towards North Sea depocentres (Løseth et al. Reference Løseth, Raulline and Nygård2013) but also awaits further quantification.
3.3. Corries
Corries, or cirques, are striking components of Scottish mountain scenery. Many corries were occupied by small glaciers during the Loch Lomond Stadial, but the small volumes of debris found in end moraines indicate that erosion of the corrie basins has extended over a much longer period (Sissons Reference Sissons1976). Corrie dimensions are moderate, with headwalls generally ranging in height from 150 m to 450 m and with width and length rarely exceeding 1 km (Gordon Reference Gordon1977). Such dimensions, when averaged over Pleistocene time, indicate quite slow erosion, but this is potentially misleading because cirque erosion rates were highly variable through the Pleistocene (Crest et al. Reference Crest, Delmas, Braucher, Gunnell and Calvet2017); and, also, many corries may have been occupied by independent glaciers for only short periods before being overwhelmed by ice sheet advance (Richardson & Holmund Reference Richardson and Holmund1996). Corries with glacially-rounded upper slopes are common in the SW Grampians (Sissons Reference Sissons1976), close to a major centre of ice sheet accumulation. Here, and perhaps elsewhere, the main phases of corrie erosion may have occurred during the many stadial periods of the Early Pleistocene, with long periods of burial beneath the ice sheets of the Middle and Late Pleistocene and more limited erosion in the short intervening phases of mountain glaciation. Some support for this hypothesis is provided by model results, with an apparently short duration of warm-based conditions at high elevations across Scotland beneath the last ice sheet (Fig. 7). The frequency of rock-slope failures and failure scarps within corries in NW Scotland suggests that cirque enlargement during successive glacial-interglacial cycles involved deepening by glacial erosion, headwall retreat by rock-slope failure and removal of RSF debris during subsequent glaciation (Ballantyne Reference Ballantyne, Wilson, Gheorghiu and Rodés2013; Cave & Ballantyne Reference Cave and Ballantyne2016).
Corrie distribution in Scotland is a function of climate, topography and time. Corrie floor elevations are low along the western seaboard but rise across the main Highland watershed towards the eastern Grampians. Snowfall from moisture-bearing North Atlantic air masses fed the corrie glaciers, with precipitation decreasing markedly with distance from the present shoreline (Barr et al. Reference Barr, Ely, Spagnolo, Clark, Evans, Pellicer, Pellitero and Rea2017). Corries are typical of high mountain scenery in Scotland, indicating the effect of decreasing air temperature with altitude. Most corries face NE and N, the sector of least direct solar radiation and hence least ablation (Sissons Reference Sissons1967). Topographic controls on corrie distribution exist at the regional and local scales (Gordon Reference Gordon1977). Corries are largely absent from Caithness, eastern Sutherland, Moray and the central and eastern Southern Uplands because few hills stood above 700 m a.s.l. before glaciation. East of the main watershed in northern Scotland, corries are developed mainly in valley heads on the northern flanks of glens draining to the Moray Firth (Fig. 6). Corrie floor altitudes vary in elevation by 350 m and 400 m in parts of the Grampian Highlands and Cairngorms (Sissons Reference Sissons1976). This broad range reflects local geological and topographical controls (Gordon Reference Gordon1977) but corries with floors at different altitudes may also have been occupied at different times, a reminder that several generations of corries may exist within individual mountain groups (Godard Reference Godard1965; Sugden Reference Sugden1969; Rudberg Reference Rudberg1994).
3.4. Controls on glacial erosion
Complex interactions between geological, topographic, climatic and glaciological factors influenced patterns of ice flow and depths of glacial erosion across Scotland.
• Ice streams developed on sticky, rigid beds only where lubricated by meltwater (Krabbendam & Bradwell Reference Krabbendam and Bradwell2013). On soft beds, with slippery, fine-grained sedimentary rocks or deformable unconsolidated basal substrates (Boulton & Jones Reference Boulton and Jones1979; Golledge & Stoker Reference Golledge and Stoker2006), basal sliding was facilitated, leading to draw-down of ice towards the Mesozoic basins of the Moray Firth, Minch and Forth Approaches. Thin-skinned glacitectonics triggered by high pore-water pressures contributed to erosion through the thrusting and transport of glacial rafts of rock and sediment (Phillips & Merritt Reference Phillips and Merritt2008; Phillips et al. Reference Phillips, Everest and Reeves2013). Such processes are highly effective along the margins of ice streams (Patterson Reference Patterson1998) and help to account for the high frequency of glacial rafts found along the shores of the inner Moray Firth (Merritt et al. Reference Merritt, Auton, Connell, Hall and Peacock2003) and the Firths of Clyde (Merritt et al. Reference Merritt, Akhurst, Wilkinson, Riding, Phillips, Smith, Finlayson and Dean2014) and Forth (Kendall & Bailey Reference Kendall and Bailey1908).
• The pre-glacial topography of the western Highlands was already at high elevation and fluvially dissected at the start of the Pleistocene and so provided gradients at the beds of alpine glaciers and ice sheets that were steeper than on the plateaux and lowlands more typical of the topography of eastern areas. Broad straths and lowland corridors established before the Pleistocene also guided ice flow towards major ice streams (Fig. 2).
• Climatic gradients and shadow effects across Scotland were consistently steeper during the cold stages of the Pleistocene (Golledge & Hubbard Reference Golledge and Hubbard2005) reflecting reduced North Atlantic circulation and atmospheric moisture flux. As per today though, precipitation and temperatures remained higher over the western highlands (Barr et al. Reference Barr, Ely, Spagnolo, Clark, Evans, Pellicer, Pellitero and Rea2017), leading to higher rates of snow accumulation, warmer englacial and subglacial temperatures and enhanced ice flow (Boulton & Hagdorn Reference Boulton and Hagdorn2006; Hubbard et al. Reference Hubbard, Bradwell, Golledge, Hall, Patton, Sugden, Cooper and Stoker2009; Patton et al. Reference Patton, Hubbard, Andreassen, Winsborrow and Stroeven2016).
• Steeper relief, higher accumulation rates and enhanced englacial and subglacial temperatures sustained fast-flowing, wet-based marine outlet glaciers which were active over longer periods in the west. In the east, slower, cold-based glaciers and ice caps generally persisted, with relatively short-lived, or no, phases of fast flow (Hubbard et al. Reference Hubbard, Bradwell, Golledge, Hall, Patton, Sugden, Cooper and Stoker2009; Fig. 7). Vertical contrasts in glacial erosion in glaciated uplands reflect greater ice thickness and flow velocity at low points in the landscapes (Glasser Reference Glasser1995) and the fundamental importance of englacial thermal boundaries in providing sharp upper limits to effective glacial erosion (Sugden Reference Sugden1968; Hall & Glasser Reference Hall and Glasser2003; Fabel et al. Reference Fabel, Ballantyne and Xu2012).
Ice extent and dynamics varied in space and time as ice fronts advanced and retreated (Haynes Reference Haynes and Clapperton1983) and as basal thermal conditions changed (Gordon Reference Gordon1979). Simulations for the last ice sheet indicate the importance of long binge and short (10–30 % relative duration) purge cycles. Under climatic cooling, periods of ice sheet inception and thickening were predominantly characterised by extensive, protective cold-based glaciers (Hubbard et al. Reference Hubbard, Bradwell, Golledge, Hall, Patton, Sugden, Cooper and Stoker2009). During purges driven by climatic amelioration, warm-based ice became extensive, with ice streams propagating from the shelf edge towards fast-flow onset zones on the present land area (Boulton & Hagdorn Reference Boulton and Hagdorn2006; Hubbard et al. Reference Hubbard, Bradwell, Golledge, Hall, Patton, Sugden, Cooper and Stoker2009). Fast flow driven by basal sliding promoted short episodes of rapid glacial erosion (Näslund et al. Reference Näslund, Rodhe, Fastook and Holmlund2003; Hubbard et al. Reference Hubbard, Bradwell, Golledge, Hall, Patton, Sugden, Cooper and Stoker2009; Kucher et al. Reference Kuchar, Milne, Hubbard, Patton, Bradley, Shennan and Edwards2012), implying that roughened and streamlined rock landscapes are mainly products of relatively brief phases of erosion when ice streams and outlet glaciers were active, leading to rapid interior drawdown, dynamic thinning and ice mass wastage (i.e., Kucher et al. Reference Kuchar, Milne, Hubbard, Patton, Bradley, Shennan and Edwards2012). The total duration of Pleistocene ice sheet cover was limited (∼500 ka in build-up centres; Fig. 1) and was further reduced at increasing distances from the main ice accumulation centres (Hubbard et al. Reference Hubbard, Bradwell, Golledge, Hall, Patton, Sugden, Cooper and Stoker2009). Hence, whilst rates of glacial erosion may be high, the rather brief duration over which efficient glacial erosion operated through the Pleistocene reduced its impact on the landscape.
Scotland's maritime location and its 0.8–1.4 km-high mountains create near-optimal conditions for the rapid development of mountain ice caps in response to moderate (3–6·5°C) falls in summer temperatures (Payne & Sugden Reference Payne and Sugden1990; Golledge et al. Reference Golledge, Hubbard and Sugden2008). The δ180 isotope record (Fig. 1) suggests that during the Early Pleistocene, the dominant mode of glaciation was by mountain ice caps. During the Middle and Late Pleistocene, however, mountain ice caps existed mainly during the slow build-up to full ice sheet cover. One model for mountain ice cap and alpine glacier growth in Scotland is provided by the Loch Lomond Stadial, when conditions of rapid temperature fall, steep precipitation gradients to north and east and persistent sea ice brought rapid build-up of ice caps in western Scotland (Hubbard Reference Hubbard1999; Golledge et al. Reference Golledge, Hubbard and Bradwell2010). Markedly different configurations may have developed under conditions with more gradual temperature fluctuations, such as in the period of increasing ice volume at 38–32 ka, when an extensive ice cap is reconstructed over the Cairngorm mountains in mathematical simulations (Hubbard et al. Reference Hubbard, Bradwell, Golledge, Hall, Patton, Sugden, Cooper and Stoker2009). Full ice sheet growth required greater temperature falls (>6·5°C) (Payne & Sugden Reference Payne and Sugden1990) of longer duration (3–10 ka) (Hubbard et al. Reference Hubbard, Bradwell, Golledge, Hall, Patton, Sugden, Cooper and Stoker2009) (Fig. 1).
Large ice sheets developed over Scotland from ∼1.2 Ma onwards and extended onto the North Atlantic shelf (Fig. 2). As there is no reliable evidence for the existence of nunataks above the last ice sheet at its maximum (Fabel et al. Reference Fabel, Ballantyne and Xu2012), and models of the last ice sheet indicate ice surface elevation above 1.5 km (Kuchar et al. Reference Kuchar, Milne, Hubbard, Patton, Bradley, Shennan and Edwards2012), then it is likely that earlier ice sheets of equivalent or greater extent also covered all of the Scottish mainland, including its highest summits. Streamlining of bedrock (Bradwell et al. Reference Bradwell, Stoker and Krabbendam2008a) and excavation of glacial valleys (Graf Reference Graf1970) contributed to the progressive adaptation of topography and the glacier bed towards more efficient ice flow through the Pleistocene. Middle Pleistocene ice sheets terminated near to the North Atlantic shelf edge (Stoker et al. Reference Stoker, Hitchen and Graham1993) or against or near to the western edge of the FIS in the North Sea (Fig. 2). This apparent overstep of Early Pleistocene ice limits, also seen in the southern British Isles (Lee et al. Reference Lee, Woods and Moorlock2015), implies that the British–Irish Ice Sheet, unlike the Laurentide Ice Sheet (Balco & Rovey Reference Balco and Rovey2010), did not approach or reach its maximum limits in the earliest Pleistocene. The position of the British Isles below 60°N, where insolation intensity is less sensitive to changes in Earth's obliquity, may have prevented the build-up of large ice sheets under the 40 ka cycles of the Early Pleistocene (Huybers & Tziperman Reference Huybers and Tziperman2008).
The varied glacial landscapes of Scotland can be seen as products of average conditions with two end members. Landscapes of little or no glacial erosion occur where cold-based conditions were established repeatedly and for long periods beneath successive ice sheets and ice caps through the Pleistocene (Fig. 7). Landscapes of deep and extensive glacial erosion are found where streams of fast, warm-based ice flow developed during successive glacial cycles. Most of the landscapes of Scotland, however, fall between these two extremes, with ice sheet models indicating long periods of cold-based ice cover and only brief phases of fast ice flow (Fig. 7). The morphological impact of glacial erosion on these intermediate landscapes was weak (Fig. 10).

Figure 10 View N up Helmsdale towards Griam Mor and Griam Beag in Sutherland, isolated hill masses developed on Devonian conglomerate. Extensive low-relief surfaces have been only weakly dissected by fluvial and glacial erosion during the Pleistocene.
4. Weathering and non-glacial erosion
Through the Pleistocene, non-glacial processes operated whenever and wherever slopes were free of glacier ice and above sea level. The cumulative time over which these processes operated was long, over 1 Myr in the Early Pleistocene (Fig. 1), and greatest in areas peripheral to the main areas of ice sheet build-up. The duration of the post-glacial period has been short (15–20 kyr), but significant geomorphic change has occurred in this interval (Ballantyne Reference Ballantyne2002), offering insights into the main impacts in earlier ice-free periods. In the mountains, rock walls that were steepened during glaciation became degraded and locally collapsed (Jarman Reference Jarman2006), particularly in the Lateglacial paraglacial phase (Ballantyne et al. Reference Ballantyne, Wilson, Gheorghiu and Rodés2013), generating large volumes of rock debris. Glacial and slope deposits have been reworked by mass movement and stream transport to accumulate on valley floors (Fig. 5). In the lowlands, streams and rivers have eroded glacial and glacifluvial landforms and the sediment released, in part, has been built into large river terraces. Soil formation has extended to depths of up to 2 m in loose parent materials (Bain et al. Reference Bain, Mellor, Robertson-Rintoul and Buckland1993) but scarcely begun on rock and boulder surfaces (Kirkbride Reference Kirkbride2006; Kirkbride & Bell Reference Kirkbride and Bell2010). Viewed against the background of multiple glacial-interglacial cycles in the Pleistocene, the main impact of processes operating through the present interglacial can be seen as producing and transporting debris and regolith. After earlier interglacials, debris of similar origin would have been entrained at the glacier bed as glaciers advanced.
Glacial steepening of rock slopes, debris production and evacuation operated across multiple glacial cycles. Only in zones of negligible glacial erosion in peripheral lowlands and on high plateaux is extensive evidence apparent of the processes of weathering and non-glacial erosion that operated before the last glacial cycle. The rock coasts of Scotland, however, preserve in many places till-covered rock platforms and cliffs (Fig. 3) that predate at least the last ice sheet. Buried features of rock coasts represent a largely overlooked record of marine erosion and sea level change earlier in the Pleistocene (Smith et al. Reference Smith, Barlow, Bradley, Firth, Hall, Jordan and Long2019).
4.1. Chemical weathering before and during the Pleistocene
The record of chemical weathering at and beneath the landsurface in Scotland is long and complex. Whilst the dating of saprolites that lack stratigraphic context is challenging (Hall Reference Hall, Dawson, Jones, Small and Soulsby1993a), most weathering profiles and soils appear to have developed in the near-surface during the Neogene and Pleistocene. A clay-rich, kaolinitic and base-poor saprolite type is found in E Buchan as part of a Palaeogene landscape that includes the Buchan Gravels Formation (Hall Reference Hall1985; Hall et al. Reference Hall, Gilg, Fallick and Merritt2015a). Similar geochemically evolved saprolites found elsewhere in Scotland are probably either exhumed from beneath sedimentary cover (Humphries Reference Humphries1961; Parnell et al. Reference Parnell, Baron and Boyce2000) or hydrothermal in origin, the latter including kaolins on Shetland (May & Phemister Reference May and Phemister1968) and at Pittodrie, Bennachie (Hall Reference Hall, Gordon and Sutherland1993d; Hall et al. Reference Hall, Gilg, Fallick and Merritt2015a). Elsewhere, only gruss-type weathering profiles are found, with high sand and low fines contents and retention of weathering-susceptible primary minerals such as Ca-feldspar and biotite (Hall Reference Hall1985). Gruss localities are concentrated in NE Scotland, the Caithness–Sutherland border and NW Lewis, but are almost certainly more widespread than shown in Figure 3 because large parts of Highland Scotland have not yet been surveyed for weathering remnants. The mineralogy of North Sea sediments (Dypvik Reference Dypvik1983; Nielsen et al. Reference Nielsen, Rasmussen and Thyberg2015) indicates that the gruss weathering type started to develop from the Late Miocene onwards in response to climate cooling. Deep gruss profiles (Fig. 11), which can extend to depths of many tens of metres (Hall et al. Reference Hall, Mellor and Wilson1989b), probably developed mainly in the Pliocene period (5.333–2.588 Ma). Shallow weathering profiles, with depths of a few metres, almost certainly continued to develop in temperate interglacial and cool interstadials during the Early Pleistocene (Hall et al. Reference Hall, Mellor and Wilson1989b). We may suppose this because the total duration of such ice-free intervals was long (Fig. 1), rates of gruss development can be fast (Dethier & Lazarus Reference Dethier and Lazarus2006) and grussification of clasts is typical in pre-MIS 5 weathered till units in Scotland (Connell et al. Reference Connell, Edwards and Hall1982; Bloodworth Reference Bloodworth, Auton, Firth and Merritt1990) and northern England (Boardman Reference Boardman and Boardman1985). Where Middle to Late Pleistocene till units incorporate and overlie weathered rock, the period of weathering must predate deposition of the tills (Connell et al. Reference Connell, Edwards and Hall1982; Gordon Reference Gordon, Gordon and Sutherland1993a; Hall Reference Hall, Gordon and Sutherland1993b) (Fig. 11). On rocks with high susceptibility to granular disintegration or oxidation, near-surface weathering may be entirely of post-glacial origin. For example, the rapid breakdown of some quartz dolerites on exposure to air (Orr Reference Orr1979) may account partly for the extensive development of onion-skin weathering in Carboniferous sills and dykes in the Midland Valley (Henderson Reference Henderson1893; Walker Reference Walker1935).

Figure 11 Gruss pocket at Cairngall Quarry, Mintlaw, Buchan, developed in medium-grained biotite granite below a thin till cover. Gruss weathering profiles in this area reach known depths of >60 m (Hall Reference Hall1985).
Prior to glaciation, deep weathering covers were widespread, but weathering penetrated most deeply in fractured, sheared and geochemically-susceptible rocks beneath basin and valley floors, whilst adjacent hills were developed in resistant and largely fresh rock types such as quartzite, acid granites and slate (Godard Reference Godard1962; Hall Reference Hall1986). One effect of glacial and non-glacial erosion was to progressively thin and finally remove gruss from wide areas through the Pleistocene (Clark & Pollard Reference Clark and Pollard1998; Krabbendam & Bradwell Reference Krabbendam and Bradwell2014; Hall et al. Reference Hall, Sarala and Ebert2015b). Particularly in western areas of high glacial erosion, the very limited survival of gruss means that tills of the last, Late Devensian glaciation are composed of clasts and matrix material released by the breakage and comminution of fresh rock debris. In contrast, in eastern areas where saprolite pockets remain, the tills may incorporate large amounts of former saprolite and soil materials (Wilson et al. Reference Wilson, Bain and Duthie1984).
4.2. Mountain-top detritus
Mountain-top detritus (MTD) refers to frost-riven regolith of diverse character found on Scottish hills (Ballantyne Reference Ballantyne, McCarroll, Nesje, Dahl and Stone1998). The character of MTD is closely controlled by rock type and fracturing and by the time available for its formation. Three main types of MTD have been recognised (Ballantyne Reference Ballantyne1984): (i) openwork blockfields; (ii) clast-rich, sandy diamictons; and (iii) clast-rich, silty and fine sand diamictons. Blockfields are typical of rocks with widely spaced fractures, such as quartzite and granite; sandy diamictons are developed mainly on sandstones and psammites; and silty diamictons are common on greywackes and mica schists. MTD generally forms only shallow regolith, reaching depths of 0.1–1.6 m, with surface concentrations of larger clasts and more matrix fines at depth. Clast angularity, local derivation and vertical sorting indicate an origin by frost riving and frost heaving, processes that have operated effectively at high elevations since the last deglaciation and probably earlier also (Ballantyne & Harris Reference Ballantyne and Harris1994).
On many Scottish mountain summits, there is evidence that MTD predates the last ice sheet. Where glacial erosion by the last ice sheet has left bare bedrock surfaces, MTD occurs only on densely-fractured rocks (Fig. 12). MTD has not reformed on more massive rock types, indicating that it is slow to develop on these rocks (Fabel et al. Reference Fabel, Ballantyne and Xu2012). Where glacial erosion has been ineffective in removing regolith, MTD may contain assemblages of clay minerals, including gibbsite and kaolinite, that are distinct from those found on the same rock types on lower slopes (Ballantyne Reference Ballantyne1994a). Many hill summits in the British Isles and Ireland show a distinct upslope limit to MTD (Fig. 3). Earlier interpretations of this limit as a glacial trimline at the upper limit of the last ice sheet (Ballantyne Reference Ballantyne, McCarroll, Nesje and Dahl1997) have given way in recent years to a recognition that the limit marks an englacial boundary between warm- and cold-based ice within the last ice sheet (Fabel et al. Reference Fabel, Ballantyne and Xu2012; McCarroll Reference McCarroll2016). Detailed mapping has shown that the elevation of this trimline drops away from the main watershed towards the Outer Hebrides and to the inner Moray Firth (Ballantyne Reference Ballantyne2010a).

Figure 12 Mountain top detritus on the Red Cuillin, Skye. Fine- to medium-grained granite is broken into a thin cover of MTD with many small, angular clasts in a granular sand matrix. The summit was probably over-topped by the last ice sheet but exposed as a nunatak in the Loch Lomond Stadial (Small et al. Reference Small, Rinterknecht, Austin, Fabel and Miguens-Rodriguez2012). Estimated erosion rates of 30–40 mm/ka are based on 10Be cosmogenic inventories (Fame et al. Reference Fame, Owen, Spotila, Dortch and Caffee2018).
The age of the MTD found above trimlines on mountain plateaux is poorly constrained. MTD may have thickened in the post-glacial period, but the main phase of its formation generally predates the last ice sheet (Hopkinson & Ballantyne Reference Hopkinson and Ballantyne2014). Development of MTD requires that summits and plateaux are free of permanent snow and glacier ice and exposed to frost action and weathering. Hence, blockfields may have formed or thickened during MIS 5-3 or during earlier interstadial and interglacial phases of the Early and Middle Pleistocene. On relict, non-glacial plateau surfaces in northern Scandinavia, 10Be and 26Al inventories are consistent with formation of the present MTD layer through the Middle and Late Pleistocene (Goodfellow et al. Reference Goodfellow, Stroeven, Fabel, Fredin, Derron, Bintanja and Caffee2014a). In western Norway, cosmogenic nuclides indicate low erosion rates (4–6 m/Ma) (Andersen et al. Reference Andersen, Egholm, Knudsen, Linge, Jansen, Pedersen, Nielsen, Tikhomirov, Olsen and Fabel2018). The residence times of regolith on the Cairngorm plateaux are short, with maximum erosion rates for exposed rock surfaces ranging from 2.8 to 12.0 m/Ma, and tor emergence rates after stripping of regolith at 11–35 m/Ma (Phillips et al. Reference Phillips, Hall, Mottram, Fifield and Sugden2006). There is also evidence, however, of low Middle to Late Pleistocene erosion rates. Cosmogenic exposure ages indicate that weathering pits deeper than 5–10 cm predate the last glacial cycle (Hall & Phillips Reference Hall and Phillips2006b). Weathering pits up to 20 cm deep occur on large tabular blocks set within MTD. Blockfields that have been disrupted locally by ice flow and pass downslope into stripped, joint-bounded granite bedrock surfaces display weathering pits up to 12 cm deep. The weathering pits indicate formation and stripping of MTD in the Cairngorms in or before MIS 6. Evidence of a longer weathering history for plateau surfaces is also given by pockets of thick gruss-type saprolite of likely Pliocene to Early Pleistocene age found on high ground in the central and eastern Grampians (Hall & Mellor Reference Hall and Mellor1988; Phillips et al. Reference Phillips, Hall, Mottram, Fifield and Sugden2006; Hall Reference Hall, Sugden and Andre2007). However, for thin blankets of MTD to be maintained at even low erosion rates, formation of new detritus from frost weathering of bedrock is required over 100 ka timescales (Marquette et al. Reference Marquette, Gray, Gosse, Courchesne, Stockli, Macpherson and Finkel2004). Ballantyne (Reference Ballantyne2010b) has proposed a dynamic model of long-term blockfield evolution in which Neogene regolith cover was gradually removed by subaerial surface lowering during ice-free periods and progressively replaced by the products of frost-wedging under periglacial conditions, with most existing MTD formed entirely within the last 135 ka (Hopkinson & Ballantyne Reference Hopkinson and Ballantyne2014). Where MTD is older, the uppermost trimlines mapped on Scottish mountains may predate the last ice sheet, a suggestion consistent with the more restricted extent of the last ice sheet compared to earlier ice sheets on the North Atlantic shelf (Ballantyne et al. Reference Ballantyne, Fabel, Gheorghiu, Rodés, Shanks and Xu2017)
4.3. Tors
Tors are small rock knobs produced by long-term differential weathering and erosion. At lower latitudes than Scotland, tors may be exhumed from thick saprolites, but almost all Scottish tors sit on hill and ridge tops and have no close association with deep weathering. Rock compartments with low fracture spacing have emerged as tors through the repeated formation and stripping of thin regolith similar in properties to that which exists on surrounding slopes today (Hall & Sugden Reference Hall, Sugden and Andre2007). This debris mantle, in areas such as the Cairngorms, is of complex origin, with elements that derive from hydrothermal alteration (Hall & Gillespie Reference Hall and Gillespie2016), multiple phases of chemical weathering (Hall & Mellor Reference Hall and Mellor1988), granular disintegration due to stress release (Phillips et al. Reference Phillips, Hall, Mottram, Fifield and Sugden2006) and frost weathering (Ballantyne Reference Ballantyne1994b). Studies in other humid, unglaciated granite terrains indicate rates of regolith formation of >5 m/Ma (Bierman Reference Bierman1994; Duxbury et al. Reference Duxbury, Bierman, Portenga, Pavich, Southworth and Freeman2015), comparable to known rates of MTD production. Such rates, when combined with evidence of significant Holocene chemical weathering in the Cairngorms (Soulsby et al. Reference Soulsby, Chen, Ferrier, Helliwell, Jenkins and Harriman1998) and Late Devensian frost weathering and mass movement (Ballantyne Reference Ballantyne1994b), suggest that much of the 0–2 m of regolith found around tors today has formed mainly in the Late Pleistocene. Thin regolith may be largely renewed in ice-free intervals during each interglacial- glacial cycle.
In areas of Pleistocene glaciation, tors are absent from zones of areal scouring but may be present in landscapes of alpine glaciation (Small et al. Reference Small, Anderson, Repka and Finkel1997), selective linear erosion (Sugden Reference Sugden1968; Sugden & Watts Reference Sugden and Watts1977) and in areas of little or no erosion (André Reference André2004). Tor landscapes in Scotland (Fig. 3) also include isolated hill masses around which the last British ice sheet streamed at the Last Glacial Maximum, for example the hills of South Uist (Ballantyne & Hallam Reference Ballantyne and Hallam2001), northern Arran (Godard Reference Godard1969) (Fig. 13) and Ben Loyal in Sutherland (Godard Reference Godard1965). Like blockfields, the existence of tors was formerly attributed to these areas standing as nunataks above the last ice sheet (Godard Reference Godard1965). The existence of glacial erratics and glacially displaced tor blocks, however, leaves no doubt that these and other summits were ice-covered. It appears that the tors have survived beneath protective covers provided by cold-based glaciers (Sugden Reference Sugden1968). Where no sliding of ice takes place across the glacier bed, then delicate features including tors and regolith may be preserved (Rapp Reference Rapp, McCann and Ford1996). Evidence of localised glacial transport from the tor site is provided by displaced tor blocks and boulder trains (Hall & Phillips Reference Hall and Phillips2006a). Displaced tor blocks may reach sizes of 100 m3 (Fig. 14) and show the distinctive weathered surfaces typical of Cairngorm tor summits (Hall & Phillips Reference Hall and Phillips2006b). In the Cairngorms, such criteria can be used to trace the movement of former tor blocks, allowing distances and directions of transport to be identified. Tors formed of smaller blocks may be partly or wholly demolished to form boulder trains (Hall & Phillips Reference Hall and Phillips2006a).

Figure 13 Tors developed in the Northern Arran Granite emplaced at ∼60 Ma (Dickin et al. Reference Dickin, Moorbath and Welke1981). Note the truncation of inclined, sub-parallel joints by the glacial slopes of Glen Sannox, the exposures of thin granular regolith and the weathering pits on granite surfaces.
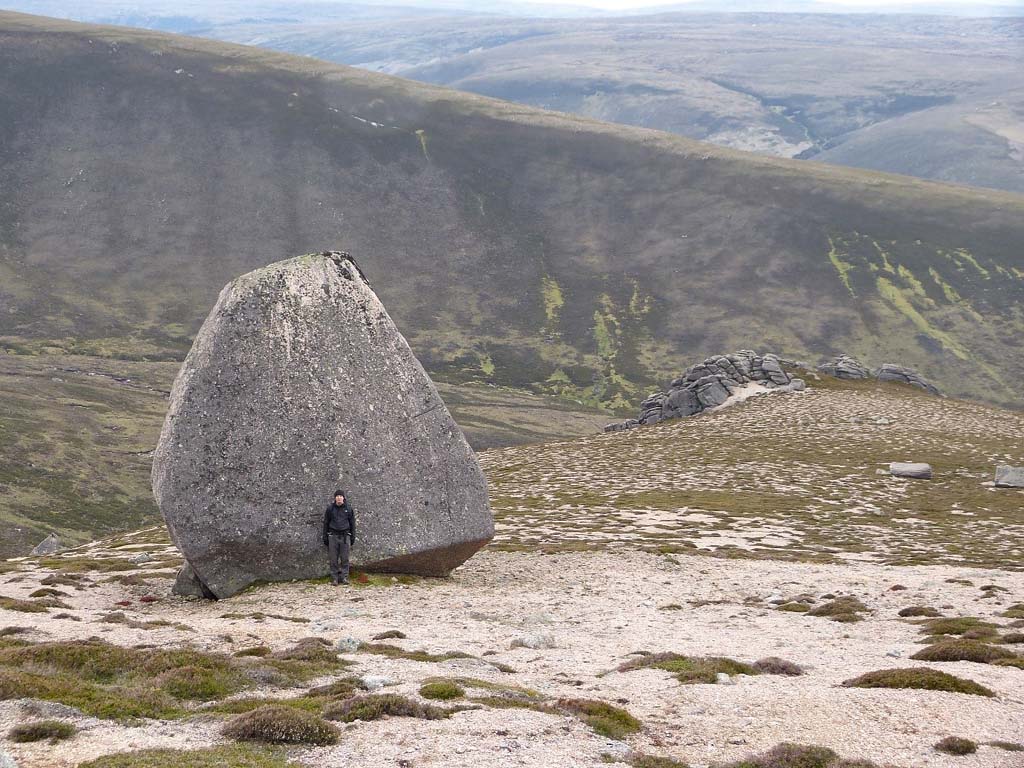
Figure 14 Glacially-transported tor block, eastern Ben Avon in the eastern Cairngorms. The tor in the background has lost superstructure to glacial entrainment. Extensive spreads of sandy MTD, with small blocks, are developed on the Cairngorm Granite.
Tors in glaciated regions have been referred to as pre-glacial landforms (e.g., Sugden Reference Sugden1968). The term is used in two senses – pre-Pleistocene or pre-glaciation, the latter where the tor predates one or more phases of glaciation. The advent of cosmogenic isotope analysis has allowed constraints to be placed on the exposure ages and erosion rates for rock surfaces on tors. Cosmogenic isotope data confirm that Cairngorm and Caithness tors are older than the last interglacial (Phillips et al. Reference Phillips, Hall, Mottram, Fifield and Sugden2006; Ballantyne & Hall Reference Ballantyne and Hall2008). The oldest Cairngorm tor surface at Clach na Gnùis has a minimum exposure and burial age of 675 ka (Phillips et al. Reference Phillips, Hall, Mottram, Fifield and Sugden2006). This tor summit carries weathering pits 1 m deep and is unmodified by glacial erosion, yet the accumulated nuclide inventory on its top indicates that this tor is not a pre-Pleistocene landform. Existing tors in the Cairngorms are dynamic landforms which have attained their present forms through the Middle Pleistocene.
Where tors or even tor roots survive in formerly glaciated areas, then the total glacial erosion since tor emergence has been confined to modification or removal of the protuberance, without significant lowering of surrounding surfaces. In glaciated tor fields, such as the Cairngorms (Gordon Reference Gordon, Gordon and Sutherland1993b), this means that glacial erosion has been only a few metres (Hall & Phillips Reference Hall and Phillips2006a). On spurs that merge down slope into larger roche moutonnée forms, the survival of tor roots identifies a zone of very limited glacial erosion on the upper part of the spur (Sugden et al. Reference Sugden, Glasser and Clapperton1992). Tors are therefore useful indicators of terrain that has experienced minimal glacial erosion. In such terrain, known erosion rates indicate that the contribution of erosion from non-glacial processes exceeds that from glacial processes through the Pleistocene. In the Cairngorms, at least three separate phases of glacial modification of tors are recognised on the basis of exposure ages (Phillips et al. Reference Phillips, Hall, Mottram, Fifield and Sugden2006). On these and other granite hills in Scotland, the granite surfaces of tor plinths carry weathering pits >10 cm deep, formed during or before the last interglacial, requiring that tor removal by glacial processes occurred in MIS 6 or earlier (Hall & Phillips Reference Hall and Phillips2006b).
4.4. Exfoliation or sheet joints in granite terrain
Exfoliation or sheet joints are joint sets with orientations subparallel to the present or former ground surface that occur at depths of 1–100 m in granite intrusions (Ziegler et al. Reference Ziegler, Loew and Moore2013). Exfoliation or sheeting develops where high maximum principal compressive stresses up to a few tens of MPa exist at shallow depths, oriented subparallel to the ground surface, and exceed the least surface-normal principal stress, a product of overburden thickness including topographic effects (Holzhausen Reference Holzhausen1989). Extension and opening of exfoliation joints in the near-surface is a response to topographic curvature (Martel Reference Martel2017). Exfoliation joints guide weathering and erosion and have been identified in Scotland as an important control on the morphology of non-glacial forms, including domes (Hall et al. Reference Hall, Gillespie, Thomas and Ebert2013b), tors (Goodfellow et al. Reference Goodfellow, Skelton, Martel, Stroeven, Jansson and Hättestrand2014b) and blockfields (Hall & Glasser Reference Hall and Glasser2003), and glacial forms, including valleys (Glasser Reference Glasser1997), cirques (Haynes Reference Haynes1968) and roches moutonnées (Gordon Reference Gordon1981; Sugden et al. Reference Sugden, Glasser and Clapperton1992). In areas where Pleistocene glacial erosion has led to changes in topography, distinct sets of exfoliation joints can be related to palaeo-topography (Ziegler et al. Reference Ziegler, Loew and Moore2013). In the Cairngorms, at least two generations of sheet joints are recognised oriented sub-parallel to the slopes of plateaux and to glacial valleys and cirques (Glasser Reference Glasser1997). Here and in other granite terrains in Scotland (Godard Reference Godard1969) (Fig. 13), sub-horizontal joint sets are also present that are not related to present slopes and so may relate to pre-glacial relief development.
5. Early Pleistocene terrestrial stratigraphy
Early Pleistocene sediments are preserved in formerly glaciated regions only where the first glaciations were the most extensive (e.g., Tasmania (Augustinus & Macphail Reference Augustinus and Macphail1997), Midwest USA (Balco et al. Reference Balco, Rovey and Stone2005a) and Patagonia (Rabassa et al. Reference Rabassa, Coronato and Salemme2005), or in deep sediment traps or basins (Anne et al. Reference Anne, Naki, Susan, Fritz, Peter, Andreas, Joachim, Meinert and Christian2017). In the British Isles, the most extensive Pleistocene glaciations occurred during the Middle and Late Pleistocene (Bridgland et al. Reference Bridgland, Howard, White, White and Westaway2015; Lee et al. Reference Lee, Phillips, Rose and Vaughan-Hirsch2017) and removed older sediment and regolith through glacial erosion and transfer to the Atlantic shelf and slope and to the North Sea Basin (Sejrup et al. Reference Sejrup, Hjelstuen, Torbjorn Dahlgren, Haflidason, Kuijpers, Nygard, Praeg, Stoker and Vorren2005). In Scotland, no Early Pleistocene glacial sediments have been identified onshore, except perhaps for deeply buried channel-fill sands at the mouth of the River Spey (Merritt et al. Reference Merritt, Auton, Connell, Hall and Peacock2003). In a few locations, however, sediments or fossils of likely Early Pleistocene age have been reworked into Late Pleistocene glacigenic sequences. In eastern Buchan, the Kippet Hills Sand and Gravel Formation includes shells reworked from the Early Pleistocene Aberdeen Ground Formation offshore (Cambridge Reference Cambridge1982; Gordon Reference Gordon, Gordon and Sutherland1993c; Merritt et al. Reference Merritt, Auton, Connell, Hall and Peacock2003). The coeval Hatton Till Formation also incorporates Early Pleistocene shell fragments and dinoflagellate cysts derived from the same source (Merritt et al. Reference Merritt, Auton, Connell, Hall and Peacock2003). At Leavad, in western Caithness, masses of laminated dark green shelly clay of possible Miocene to Early Pleistocene age, presumably derived from the inner Moray Firth, occur as rafts within a buried Late Pleistocene glacigenic sequence (Crampton & Carruthers Reference Crampton and Carruthers1914; Gordon Reference Gordon, Gordon and Sutherland1993d). Apart from the Kippet Hills and Hatton Formations, published amino acid ratios for marine shells collected from tills in Caithness, Orkney and Buchan indicate reworking only of Middle and Late Pleistocene material (Bowen & Sykes Reference Bowen and Sykes1988; Bowen Reference Bowen, Ehlers, Gibbard and Rose1991). An Early Pleistocene age has been proposed for the Buchan Gravels Formation (Flett & Read Reference Flett and Read1921; Kesel & Gemmell Reference Kesel and Gemmell1981) at Windy Hills (Gordon & Sutherland Reference Gordon, Sutherland, Gordon and Sutherland1993) and Moss of Cruden (Hall Reference Hall, Gordon and Sutherland1993c), but stable oxygen and hydrogen isotopes for kaolinised clasts from the gravels indicate post-depositional weathering at high average temperatures attained in Scotland only during the Eocene or mid-Miocene (Hall et al. Reference Hall, Gilg, Fallick and Merritt2015a).
6. Middle Pleistocene terrestrial stratigraphy
The Middle Pleistocene terrestrial glacial stratigraphy of Scotland, as currently understood, does not replicate the complexity of the offshore record (Stewart et al. Reference Stewart2019). The oldest known till units found onshore in Scotland, at Kirkhill and Leys Quarries in Buchan, NE Scotland, are regarded as deposited by an ice sheet during MIS 8 (between 245 ka and 303 ka) (Merritt et al. Reference Merritt, Auton, Connell, Hall and Peacock2003). Buried till beds elsewhere in Scotland (Fig. 15) are usually attributed to MIS 6 glaciation, at the latest (see below). There are several possible reasons for the apparently sparse preservation of old till units, the most likely being that successive ice sheets tend to erode or rework older deposits. Thus, the latest MIS 3-2 ice sheet (>26–13 ka) is likely to have destroyed most pre-existing glacial, interglacial and interstadial sediment sequences. Yet the widespread survival of pre-glacial weathered rock in zones of limited glacial erosion in Scotland (Fig. 3) suggests that similarly fragile pre-Late Devensian glacial deposits should also have survived locally, at least in these zones. This is the case in central Buchan, which shows the juxtaposition of Neogene–Early Pleistocene deep weathering and MIS 8-4 sediment sequences with MIS 3 glacial and non-glacial sediments (Hall & Sugden Reference Hall and Sugden1987). Preservation of older deposits is particularly likely where deep valleys are orientated transverse to ice sheet flow that acted first as sediment traps and later as secure repositories for glacial sediments. Such locations are found to the E of Inverness (Fletcher et al. Reference Fletcher, Auton, Highton, Merritt, Robertson and Rawlin1996), and in Easter Ross (Peach et al. Reference Peach, Gunn, Clough, Hinxman, Crampton, Anderson and Flett1912) and the Forth valley (Francis et al. Reference Francis, Forsyth, Read and Armstrong1970; Sissons & Rhind Reference Sissons and Rhind1970) (Fig. 15). Another potentially favourable location is where advancing ice fronts moved along the main straths sending ice lobes into closed tributary valleys, ponding lakes and disgorging sediment, before bypassing these locations as ice thickened and topographic control over ice flow weakened. Examples of this type of accommodation space are seen in the central Grampians, where thick glacilacustrine sediments have been overridden by later ice movements and disturbed by glacitectonics (Smith et al. Reference Smith, Merritt, Leslie, Krabbendam and Stephenson2011; Hall et al. Reference Hall and Gillespie2016). The possibility also exists that old tills are simply overlooked through incorrect attribution to younger phases of glaciation. In the virtual absence of dating constraints, the recognition of old tills usually rests on a position low in a stratigraphic sequence or beneath interglacial or interstadial sediments/soils or on the advanced weathering of till clasts. In situations where the upper part of a sediment pile is eroded during a glacial phase and soils and organic deposits are lost, then the till layers in the remaining lower part may be indistinguishable from till units of the last glaciation, particularly where ice flow has followed a similar path.

Figure 15 Sites with MIS 5 and older sediments in Scotland: 1 = Fugla Ness (Hall et al. Reference Hall, Gordon, Whittington, Duller and Heijnis2002); 2 = Sel Ayre (Hall et al. Reference Hall, Gordon, Whittington, Duller and Heijnis2002); 3 = NW Lewis (Sutherland & Walker Reference Sutherland and Walker1984); 4 = Inchnadamph (Lawson & Atkinson Reference Lawson, Atkinson and Lawson1995); 5 = Caithness (Hall & Riding Reference Hall and Riding2016); 6 = Dalcharn (Walker et al. Reference Walker, Merritt, Auton, Coope, Field, Heijnis and Taylor1992); 7 = Allt Odhar (Walker et al. Reference Walker, Merritt, Auton, Coope, Field, Heijnis and Taylor1992); 8 = Teindland (Hall et al. Reference Hall and Jarvis1995); 9 = Kirkhill (Connell et al. Reference Connell, Edwards and Hall1982); 10 = Camp Fauld (Whittington et al. Reference Whittington, Hall and Jarvis1993); 11 = Toddlehills (Gemmell et al. Reference Gemmell, Murray and Connell2007) and Savock Quarry (Connell Reference Connell2015); 12 = Pitlurg (Hall & Jarvis Reference Hall, Jarvis, Gordon and Sutherland1995); 13 = Nigg Bay (Gordon Reference Gordon, Gordon and Sutherland1993e); 14 = Inverbervie (Auton et al. Reference Auton, Gordon, Merritt and Walker2000); 15 = Pattack (Merritt et al. Reference Merritt, Auton, Boston, Everest, Merritt, Boston, Lukas and Merritt2013); 16 = Balglass (Brown et al. Reference Brown, Rose, Coope and Lowe2006); 17 = Lower Clyde (Rolfe Reference Rolfe1966; Finlayson et al. Reference Finlayson, Merritt, Browne, Merritt, McMillan and Whitbread2010); 18 = Ayrshire (Jardine et al. Reference Jardine, Dickson, Haughton, Harkness, Bowen and Sykes1988; Finlayson et al. Reference Finlayson, Merritt, Browne, Merritt, McMillan and Whitbread2010).
6.1. The Kirkhill sequence
The Pleistocene sequence in the Kirkhill area (Hall & Jarvis Reference Hall, Jarvis, Gordon and Sutherland1993) is unique in the British Isles terrestrial record in providing a detailed record of at least three complex stadial–interstadial–interglacial cycles (Fig. 16).
• In the oldest cycle believed to date to MIS 8 (245–303 ka, Merritt et al. Reference Merritt, Auton, Connell, Hall and Peacock2003), glaciation and the deposition of till was possibly succeeded by a phase of weathering, prior to erosion of the till surface, perhaps by the meltwater that deposited the overlying glacifluvial and glacideltaic gravels and sands. After deglaciation of the site, periglacial conditions were established, with frost shattering of bedrock and solifluction and later deposition of fluvial gravels. Following a phase of erosion, a podzolic soil formed under humid temperate conditions on the gravel surface.
• The second cycle commenced with a climatic deterioration marked by development of arctic soil features and the onset of gelifluction. This was followed by glaciation of the site, with deposition of till. Subsequently, a further soil developed on this till surface and its pedogenic characteristics imply a return to interglacial conditions. This cycle is assigned to MIS 6 – MIS 5e (see below).
• The youngest cycle (Devensian) opened with deposition of a sequence of periglacial deposits, the subsequent development of permafrost, marked by ice-wedge casts, and the eventual deposition of three further till units. Subsequent deglaciation involved minor glacifluvial deposition and was accompanied, or succeeded, by a phase, or phases, of periglacial activity until soil formation began at the start of the Holocene interglacial.

Figure 16 Kirkhill and Leys schematic Middle to Late Pleistocene stratigraphy (after Merritt et al. Reference Merritt, Auton, Connell, Hall and Peacock2003). British Geological Survey © UKRI 2018.
The oldest event known in the Kirkhill/Leys area is the cutting of a linear depression into weathered basic igneous rock at Leys Quarry. The Leys Till Formation, containing quartzite erratics glacially transported from the W, was laid down on its floor. The till contains grussified basic igneous clasts and appears to have been weathered after deposition (although local incorporation of previously weathered bedrock and subsequent limited glacial transport also occurred). The overlying Denend Gravel Formation comprises 3–5 m of coarse, felsite-dominated, pebble to boulder gravel, with interstratified sand units. The Denend Gravel was deposited by meltwater moving towards the W and SW, part of a valley sandur extending from an ice margin lying relatively close to, and E of, Leys. At Leys Quarry, high-angle, glacideltaic foresets are preserved, indicating the ponding of a glacial lake in the Ugie valley (Fig. 17) at this time. It appears that ice blocked the valley E of Leys, though it is unclear if this was ice flowing from the Moray Firth and curving S, or ice having flowed N up the western North Sea margin. The set of channels at Kirkhill Quarry in which these gravels and younger sediments accumulated may have been cut by meltwater flow at this time or earlier. Post-depositional disturbance of the gravels is widespread, with folding, faulting and development of wedge structures as the result of melt-out of glacier ice blocks originally buried within the gravels (Hall & Connell Reference Hall and Connell1986).

Figure 17 SW face of Leys Quarry in the 1990s showing high-angle, glacideltaic foreset gravels of the ?MIS 8 Denend Gravel Formation. Flow of water was towards the W and SW. Note extensive Fe and Mn staining and local cementation of the sediments. Excavations below this gravel unit exposed the Leys Till resting on bedrock.
At Kirkhill, an angular felsite rubble up to 2 m thick rests on channel floors. Clasts in the rubble show a well-developed downslope fabric, indicating transport by avalanche or gelifluction. Silt cappings indicate incipient pedogenesis (Connell & Romans Reference Connell, Romans and Hall1984). This Kirkton Gelifluctate Bed is, in turn, overlain by the Pitscow Sand and Gravel Formation, with up to 4 m of mainly horizontally stratified sands, with gravel lags marking former channel floors. This unit is interpreted as a periglacial fluvial or proglacial glacifluvial deposit. Cross-stratification points to transport from the E. Syn-depositional ice-wedge casts indicate deposition of the basal beds under permafrost conditions. The declining numbers of angular clasts in the upper Pitscow beds at Kirkhill, together with the absence of ice-wedge casts and other periglacial features, may indicate the subsequent amelioration of climate.
The first cycle ended with an important phase of pedogenesis, with formation of the Kirkhill Palaeosol Bed on the eroded upper surface of the Pitscow Sand and Gravel (Fig. 18). A conspicuous bleached horizon, up to 19 cm thick with bleached and softened felsite clasts, was found throughout Kirkhill Quarry, and in the NE face of Leys Quarry. This represents the former Ea horizon of a podzolic soil, with a lower mottled Bs horizon locally enriched in organic carbon and free iron as a result of pedogenic translocation. An iron pan is also found towards the base of the profile (Connell et al. Reference Connell, Edwards and Hall1982). Micromorphological analysis of the palaeosol has also revealed structures typical of soils of arctic environments (Connell & Romans Reference Connell, Hall, Romans and Hall1984). Superimposition of periglacial soil features on an earlier interglacial soil horizon seems to have produced a composite soil horizon. At both Kirkhill and Leys, Fe and Mn staining associated with localised cementation occurs extensively to depths of several metres in underlying gravels and sands (Fig. 18). These indicators of former waterlogging or fluctuating groundwater levels contrast sharply with the leached horizon represented by the podzol, though the timing and number of redox cycles involved in Fe and Mn mobilisation is uncertain. At Kirkhill, the truncated Kirkhill Palaeosol Bed is overlain by thin, poorly stratified and weakly organic sands, the Swineden Sand Bed. These sands probably represent slope-wash deposits and are penetrated by a series of frost-cracks (Connell et al. Reference Connell, Hall, Romans and Hall1984). Beneath the sands lies a 1–5 cm-thick bed of black to brown, weakly laminated organic mud that drapes the truncated palaeosol in the E face. The organic mud contains pollen of Poaceae, together with a marked arboreal component of mainly Pinus and Alnus, together with charcoal. The overlying sands show a reduction in arboreal pollen and an increase in grasses and Calluna, possibly reflecting the establishment of an open, treeless environment (Connell et al. Reference Connell, Edwards and Hall1982). Sampling of an equivalent organic sequence in the W face at Kirkhill suggests that two components exist in the pollen spectra (Lowe Reference Lowe1984). Open, grassland types represent pollen contemporaneous with sedimentation of the sands. Recycled pollen, with a significant arboreal component, is perhaps derived from older soil horizons at the site. The stratigraphical position of the palaeosol indicates that it developed during a pre-Ipswichian interglacial, probably MIS 7 (245–186 ka; Merritt et al. Reference Merritt, Auton, Connell, Hall and Peacock2003).

Figure 18 South Face 1 of Kirkhill Quarry in the late 1970s: 1 = floor of meltwater channel cut in a felsite dyke; 2 = Pitscow Sand and Gravel Formation; 3 = Kirkhill Palaeosol Bed; 4 = Camphill Gelifluctate Bed; 5 = Rottenhill Till; 6 = Corsend Gelifluctate Bed; 7 = Hythie Till.
The start of the second cycle is seen at Kirkhill Quarry, where up to 2.5 m of periglacial mass movement deposits, named the Camphill Gelifluctate Bed, are developed above the organic Swineden Sand Bed. The bed includes features indicating multiple phases of periglacial activity, including episodes of gelifluction, cryoturbation and development of an ice-wedge polygonal network. A luminescence date of 142±19 ka BP (Duller et al. Reference Duller, Wintle and Hall1995), if correct, falls within MIS 6. The West Leys Sand and Gravel Formation rests in shallow channels scoured into this periglacial land surface. These thin, probably glacifluvial gravels and sands show planar cross-beds, indicating water flow from the NW, and probably represent outwash or subglacial meltwater deposits. The overlying Rottenhill Till Formation overlies with a weak unconformity these earlier deposits (Fig. 19). Its clast lithology (including boulders of Strichen granite) and fabric indicate deposition by ice moving from the NW. Whilst only three sites are known where the Rotten Hill till is found, all show NW–SE ice flow. It is possible that this flow direction was being “steered” by ice in the Moray Firth impinging on Buchan, much as it did during both early and late stages of the Middle–Late Devensian glaciation (Merritt et al. Reference Merritt, Connell and Hall2017). After deglaciation, the Fernieslack Palaeosol Bed developed on the surface of the underlying Rottenhill Till Formation. This second major phase of soil development is marked by grussification of basic igneous and granite clasts, soil horizon development and clay mineral weathering and translocation. Soil characteristics are typical of the B- and C-horizons of gleyed brown earths developed on similar parent materials in eastern Scotland during the Holocene (Connell & Romans Reference Connell, Romans and Hall1984) and are in contrast to the podzolic soil (Kirkhill Paleosol Bed) which developed on the more acidic, free draining, parent materials available at the site during the MIS 7 interglacial. Support for this interpretation of the Fernieslack Palaeosol is provided by the presence of Alnus, with Betula and coryloid grains from a single sample in the profile (Connell et al. Reference Connell, Edwards and Hall1982). On the simplest interpretation, and in the light of the stratigraphically lower luminescence date, the Fernieslack Soil probably formed during the Ipswichian Interglacial (MIS 5e).

Figure 19 Kirkhill Quarry North Face in the 1980s: 1 = podzolic Kirkhill Palaeosol Bed; 2 = unconformable, sub-horizontal, base of the brown Rottenhill Till (within which the Fernieslacks Palaeosol Bed developed); 3 = the black Corse Diamicton (incorporating glacitectonically deformed pale coloured sand) overlying the Rottenhill Till; 4 = Hythie Till. The section is approximately 15 m high.
The latest (Devensian) cycle began with cryoturbation and gelifluction, followed by incipient pedogenesis and ice-wedge growth recorded by successive units within the Corsend Gelifluctate Bed. Advance of glacier ice occurred whilst ground ice persisted (Connell et al. Reference Connell, Hall, Romans and Hall1984). The Corse Diamicton Formation was first exposed at Kirkhill as a large mass of dark grey clay diamicton consisting largely of reworked Late Jurassic/Early Cretaceous mudstone. The overlying Hythie Till Formation has a clast lithology dominated by psammite and pelitic schist, with basic igneous rocks and felsite. A clast of rhomb porphyry typical of those found in the Oslo Graben was recovered from this unit and a second clast was recovered from talus below the NE face at Leys. The stratigraphic position of Scandinavian erratics in Buchan, and their presence in tills of inland origin, indicate that transport of these rock types into the inner Moray Firth probably occurred before MIS 5 (Hall & Connell Reference Hall, Connell, Ehlers, Gibbard and Rose1991), perhaps in the Anglian/Elsterian (MIS 12) (Merritt et al. Reference Merritt, Auton, Connell, Hall and Peacock2003). The dominance of quartzitic and basic igneous rocks in the Hythie Till Formation indicates a western provenance. The unit can be correlated on the basis of stratigraphy and lithology with tills along the valleys of the North and South Ugie Water, which also have strong W–E fabrics (Hall & Connell Reference Hall, Connell, Ehlers, Gibbard and Rose1991). The succeeding East Leys Till Formation is a very dark grey, mud-rich diamicton. Clast lithologies are dominated by gneissose quartzite and psammite, with chalk, pelites and reddish brown (possibly Devonian) sandstone. Striated shell fragments appear below a near-surface Holocene weathering horizon and include specimens of Macoma sp. and Astarte sp. The matrix contains reworked Late Jurassic/Early Cretaceous dinoflagellate cysts, Mesozoic and Tertiary pollen, and Quaternary foraminifera. Together these organic remains indicate derivation of the matrix from Mesozoic mudstone, Palaeogene sediments and Quaternary glacimarine and marine muds in the Moray Firth basin. Southward transport by ice from the Moray Firth is supported by the presence of chalk clasts and by the transport of dark gneissose rocks comparable to the Inzie Head Gneiss of the Fraserburgh area. The East Leys Till represents the final phase of glacial deposition recorded at the site and is succeeded by thin glacifluvial sands and gravels. At Leys, there is evidence of a late phase of permafrost conditions from involutions with stone pillars, near-surface concentrations of frost-heaved clasts, erected and frost-cracked pebbles and associated development of ice-wedge casts (Hall & Connell Reference Hall and Connell1986).
The Kirkhill/Leys sequence provides wider insights into the sequence of environmental change in Scotland because of its peripheral position in the lowlands of Buchan. In the last glaciation, ice flow into this area came via three pathways: the inner Moray Firth, the western North Sea and the eastern Grampians. In the two early cycles of the Kirkhill sequence, only the Denend Gravel appears to relate to ice blocking the North Sea coast in a manner similar to the ponding of Glacial Lake Ugie in the Late Devensian (Merritt et al. Reference Merritt, Connell and Hall2017). The earlier Leys Till and the later Rottenhill Till were deposited by eastern Grampian ice moving eastward toward the North Sea, a pattern of ice flow similar to that for the Hythie Till around the maximum of the Late Devensian. Each of these tills sits with only weak unconformity on older deposits indicating that, in the last three glacial cycles, eastern Grampian ice was effectively non-erosive in this area. The consequent layer cake stratigraphy includes evidence for two pre-Holocene interglacial phases, in which significant weathering and soil development took place. Cold conditions were established in Buchan in at least two separate phases before the last interglacial, with ice wedges marking intervals with permafrost development (Fig. 16). With the three younger units also formed under periglacial conditions, it is clear that periglacial processes operated repeatedly in the lowlands of eastern Scotland through the Middle and Late Pleistocene (Connell & Hall Reference Connell, Hall and Boardman1987). The Devensian sediments in the Kirkhill and Leys area are thin, with older sediments taking up most of the accommodation space within the once 10–15 m-deep channels at these sites. Monitoring of gas pipeline trenches in the 1980s showed that Devensian glacial deposits are also thin across much of central Buchan yet still provide evidence of multiple events from attenuated stratigraphic units (Merritt et al. Reference Merritt, Auton, Connell, Hall and Peacock2003).
6.2. Deposits elsewhere in Scotland that predate MIS 5
At a few, widely scattered sites across Scotland, organic deposits or weathering horizons dated or attributed to MIS 5 are underlain by older sediments (Fig. 15). Till units found low in stratigraphic sections have also been assigned to MIS 6 (Saalian) or older glaciations. On the plain of Caithness, old glacial deposits sit in lows within glacially streamlined terrain, indicating that bedrock erosion largely predates the last glacial cycle (Hall & Riding Reference Hall and Riding2016).
On Shetland, at Fugla Ness, a till lies below a peat layer that probably formed in the last interglacial. This till has a strong NW–SE fabric (Hall et al. Reference Hall, Gordon, Whittington, Duller and Heijnis2002), a similar direction to movement of ice within the Shetland ice cap during the last glaciation (Hall Reference Hall2013). In Caithness, tills deposited by ice moving out of the inner Moray Firth and the Northern Highlands occur below multiple sequences referred to the Late Devensian glaciation (Gordon Reference Gordon, Gordon and Sutherland1993d; Hall & Riding Reference Hall and Riding2016). Amino acid racemisation ratios for marine shells now incorporated in Late Devensian tills in Caithness and Orkney suggest that the oldest included shells date from MIS 7 and 9, respectively (Bowen & Sykes Reference Bowen and Sykes1988). These ages imply reworking of shells from former marine or glacimarine sediments in the inner Moray Firth that included beds of MIS 6 age or older (Hall & Riding Reference Hall and Riding2016).
On northern Lewis, a raised shore platform is found at 6–12 m O.D. (von Weymarn Reference von Weymarn1979; Gordon Reference Gordon, Gordon and Sutherland1993f). Weathered till occurs in pockets on its surface and contains erratic clasts of Torridonian sandstone and Cambrian quartzite, indicating ice movement from the Scottish Mainland (Peacock Reference Peacock1984) during MIS 6 or earlier. This rock platform and one at a similar elevation on Barra and Vatersay (Selby Reference Selby1987) are overlain by beach gravels that probably date from MIS 5 high sea levels (Hall Reference Hall, Gilbertson, Kent and Grattan1996). In Assynt, a cave at Creag nan Uamh has yielded Uranium-series disequilibrium ages for speleothems of 122+/−12 ka, 143+13/−16 ka, 181+24/−18 ka and 192+53/−39 ka, indicating the establishment of ice-free conditions during the last interglacial and MIS 6 (Lawson Reference Lawson, Gordon and Sutherland1993).
East of Inverness, organic deposits and palaeosol/weathering horizons of MIS 5 age have been described from Allt Odhar and Dalcharn. The weathered, sandstone-rich Dearg Till Formation at Dalcharn is older than the Devensian as it underlies an interglacial palaeosol and deeply weathered Craig an Daimh Gravel (Walker et al. Reference Walker, Merritt, Auton, Coope, Field, Heijnis and Taylor1992; Merritt & Auton Reference Merritt, Auton, Merritt, Auton and Phillips2017). The Moy Peat Bed and underlying gravel at the Allt Odhar site also overlie an older sandstone-rich diamict, the Suidheig Till Formation. Another weathered, sandstone-rich diamict, the Cassie Till Formation, occurs nearby at the base of the sequence at Clava. These older tills are presently exposed within several valleys draining towards the River Nairn (Fletcher et al. Reference Fletcher, Auton, Highton, Merritt, Robertson and Rawlin1996) (Fig. 20). In lower Strath Spey, the podzolic Teindland Palaeosol, probably of last interglacial age, is underlain by beds of sand, gravel and till (Fig. 21). Erratic clasts in the Red Burn Till below the palaeosol indicate ice movement from the NW (Hall et al. Reference Hall, Whittington, Duller and Jarvis1995). Each of these underlying tills probably relates to MIS 6 glaciation, as does weathered till found near Portsoy (Gordon Reference Gordon, Gordon and Sutherland1993a; Peacock & Merritt Reference Peacock and Merritt2000). These sequences hold an important record of Middle and Late Pleistocene environmental change preserved along the southern margin of ice streams moving towards and out of the inner Moray Firth (Merritt et al. Reference Merritt, Auton, Connell, Hall and Peacock2003).

Figure 20 Longitudinal profile of the Allt Carn a'Ghranndaich valley upstream from Clava, E of Inverness, showing multiple, buried and locally weathered Middle Pleistocene till and gravel units (after Fletcher et al. Reference Fletcher, Auton, Highton, Merritt, Robertson and Rawlin1996). British Geological Survey © UKRI 2018.

Figure 21 Teindland Quarry in 2000: 1 = Teindland Lower Sand; 2 = Teindland Buried Soil (MIS 5e); 3 = Teindland Upper Sand; 4 = truncated and glacitectonically sheared units beneath overlying Teindland Till.
In the central Grampians, glacilacustrine sediments have been overridden by later ice movements and glacitectonically disturbed (Merritt Reference Merritt, Lukas, Merritt and Mitchell2004; Smith et al. Reference Smith, Merritt, Leslie, Krabbendam and Stephenson2011). These deposits locally rest on the Pattack Till Formation, typically a pale to moderate yellowish brown diamict that includes boulders of grey porphyritic granodiorite sourced from the SW (McMillan et al. Reference McMillan, Hamblin and Merritt2011). When compared to the longer sequences found in the Inverness area, where intervening interglacial and interstadial deposits have been located, the colour, iron staining and weathered condition of many clasts in the Pattack Till suggest that it has been exposed to full interglacial conditions and is pre-Devensian in age. The unit is overlain locally by heavily iron-stained, gravelly deposits that were probably laid down as moraines and ice-proximal fans during retreat of the penultimate ice sheet. This area is transitional between terrains of selective linear glacial erosion, with survival of deep weathering on plateaux (Hall & Mellor Reference Hall and Mellor1988), and more extensively ice-moulded topography where fast-ice flow was directed along the main straths (Smith et al. Reference Smith, Merritt, Leslie, Krabbendam and Stephenson2011). The preservation of pre-MIS 5 glacigenic sediments in Glen Pattack on the margin of a zone of ice streaming suggests that older sediments may occur in similar situations elsewhere in the Spey catchment.
The most widespread occurrences of Middle Pleistocene glacial deposits occur in Buchan (Hall & Connell Reference Hall, Connell, Ehlers, Gibbard and Rose1991). Deeply buried tills are recorded in numerous boreholes in the Ellon (Merritt Reference Merritt1981) and Peterhead (McMillan & Aitken Reference McMillan and Aitken1981) areas. Around Kirkhill, the distinctive Fernieslack Palaeosol and the Rottenhill Till (see above) have been traced over a wide area (Hall et al. Reference Hall, Mellor and Wilson1989a). At two sites W of Peterhead, Toddlehills and Savock, complex glacigenic sequences are preserved (Gemmell et al. Reference Gemmell, Murray and Connell2007; Connell Reference Connell2015). Both sites lie adjacent to the S–N-trending Aldie–Laeca and Dens channel systems (Merritt et al. Reference Merritt, Auton, Connell, Hall and Peacock2003, map 7; Fig. 13) that were covered by eastward advancing ice early during the late Middle–Late Devensian glaciation (Merritt et al. Reference Merritt, Connell and Hall2017). Correlatives of the Rottenhill Till Formation (dated to MIS 6 at the Kirkhill/Leys sites) have been recorded at both sites (Figs 22, 23) and are overlain by fluvial sands at Toddlehills with a mean OSL age of 85 ka (Gemmell et al. Reference Gemmell, Murray and Connell2007), again consistent with deposition of the till during MIS 6. Later, coastal ice advancing northward skirted the area but delivered meltwater northward through the channels into Glacial Lake Ugie. The sequences at Toddlehills escaped erosion at that time as it was on the western flank of the West Dens channel.

Figure 22 Toddlehills Quarry in 2006, N face. Section is ca.6 m high. Weathered bedrock (1) is overlain by a till unit (2), correlated with the MIS 6 Rottenhill Till Formation at Kirkhill. OSL dated (mean 85 ka) sands are obscured by made ground in mid-section (3). Late Devensian Hythie Till Formation can be seen higher in the section beneath vegetated made ground (4).

Figure 23 Savock Quarry in 2014. Section is ca.5 m high: 1 = Middle Pleistocene sand and gravel channel fill; 2 = brown, possibly weathered till correlated with the MIS 6 Rottenhill Till Formation at Toddlehills, Leys and Kirkhill; 3 = upper clast-rich till correlated with the MIS 3-2 Hythie Till.
Highly mottled, red mud was exposed in a temporary pit [NGR NK 033409] on the north slope of the Moss of Cruden in 1984. A sample from its less weathered base contained palynomorphs typical of the Kimmeridge Clay and also Quaternary forms (L. A. Riley pers. comm. 1984), indicating an early phase of glacial transport from the Moray Firth. North of Ellon (Fig. 15), the Pitlurg Till was deposited by ice moving S along the present North Sea coast from the Moray Firth. The age of this unit is uncertain, but amino acid ratios from included shells indicate that the till cannot be older than MIS 6. The Bellscamphie Till is the oldest unit identified in the Ellon area. It was deposited by ice moving from the NW or W, probably prior to MIS 5 (Hall & Jarvis Reference Hall and Jarvis1995). In western Buchan, the Crossbrae Farm Peat bed of probable MIS 5a or 5c age overlies the Crossbrae Till, likely to be of MIS 6 age (Whittington et al. Reference Whittington, Connell, Coope, Edwards, Hall, Hulme and Jarvis1998).
Further south, old tills may be present at Aberdeen (Hall & Connell Reference Hall, Connell, Ehlers, Gibbard and Rose1991), a grey till probably derived from the south (Bremner Reference Bremner1934) and a weathered brown till derived from the west (Synge Reference Synge1956, Reference Synge1963). Most of these tills likely date from MIS 6 and indicate a similar interplay of ice masses in Buchan, as occurred in the last glaciation. At Nigg Bay, immediately south of Aberdeen city, a complex glacigenic sequence is exposed in the southern cliffs (Gordon Reference Gordon, Gordon and Sutherland1993e). The upper two tills are believed to date to ice advances during the Late Devensian. At the base of the exposed sequence, gravels and sands (the Ness Sand and Gravel Member) have recently provided an OSL age estimate of ∼63 ka (Gemmell et al. Reference Gemmell, Murray and Connell2007), suggesting they relate to outwash deposition during an MIS 4 glaciation. Onshore and offshore borehole data indicate that a palaeo-valley form exists immediately N of the cliff section that has been eroded down to −30 m O.D. (Merritt at al. Reference Merritt, Auton, Connell, Hall and Peacock2003, fig. 46). It is unclear if this palaeo-channel represents a former course of the River Dee cut during lowered sea level events or has been partially excavated by subglacial processes. It is also unclear if this older valley preserves sediments that pre-date MIS 4. At Ellon, N of Aberdeen, borehole evidence also indicates a rock-cut channel of the River Ythan descending to at least -20 m O.D. (Merritt Reference Merritt1981) and, again, it is possible that this deep channel preserves pre-Devensian sediments.
South of Stonehaven, near Inverbervie, the Benholm Clay Formation is another old glacigenic sediment, laid down before peat formation in MIS 5 (Fig. 24) (Auton et al. Reference Auton, Gordon, Merritt and Walker2000). The Benholm Clay includes striated and polished marine shell fragments, Carboniferous, Early and Late Cretaceous and Palaeogene microfossils, and clasts of limestone, coal, chalk and flint derived from offshore in the North Sea basin (Auton et al. Reference Auton, Gordon, Merritt and Walker2000). It was laid down by ice that moved onshore during a post-Anglian and pre-Devensian glacial episode. Amino acid (D/L) ratios of ca.0.34 have been obtained from fragments of the marine mollusc Arctica islandica, which indicate that they are of MIS 9 age, or older (Auton et al. Reference Auton, Gordon, Merritt and Walker2000). The clay was possibly derived from overridden sediments at the base of the Coal Pit Formation, or might represent the onshore feather edge of a till occurring in the Fisher Formation, generally considered to be of Saalian (MIS 6–10) age (Gatliff et al. Reference Gatliff, Richards, Smith, Graham, McCormac, Smith, Long, Cameron, Evans, Stevenson, Bulat and Ritchie1994).

Figure 24 Sheared lens of the Burn of Benholm Peat Bed within olive grey shelly clay and diamicton (Benholm Clay Formation) at Burn of Benholm. The shelly deposits are overlain by red-brown diamicton of the Late Devensian Mill of Forest Till Formation.
In the lower Clyde and the upper Forth lowlands, the Geological Memoirs refer to borehole records that show thicknesses of Pleistocene sediment that locally exceed 100 m (Clough et al. Reference Clough, Hinxman, Wilson, Crampton, Wright, Bailey, Anderson, Carruthers and Grabham1925; Francis et al. Reference Francis, Forsyth, Read and Armstrong1970; Paterson et al. Reference Paterson, Hall, Stephenson and Forsyth1990; Forsyth et al. Reference Forsyth, Hall and McMillan1996; Hall et al. Reference Hall and Mellor1998). Only the upper part of these sediment accumulations is of Late Devensian age (Browne & McMillan Reference Browne and McMillan1989). Tills of likely MIS 4 age, the Ballieston Till Formation in the Clyde basin, and the Littlestone Till Formation in Ayrshire, occur widely (Finlayson et al. Reference Finlayson, Merritt, Browne, Merritt, McMillan and Whitbread2010), but the stratigraphy and age of older sediments below these tills remain poorly known (Sutherland Reference Sutherland and Walker1984).
6.3. Significance of the Middle Pleistocene terrestrial stratigraphic record
The Pleistocene stratigraphical record in Scotland includes glacigenic deposits and periglacial features that represent cold stages back at least to MIS 8, together with terrestrial sediments with a floral, faunal or pedological record of interstadial and interglacial conditions. Whilst Middle Pleistocene sediments are sparse or absent across wide areas of Scotland and are poorly dated generally, the stratigraphic record is important for the direct information it can provide on the pattern and sequence of environmental change on the land area. The increasingly detailed and nuanced interpretations of palaeoenvironmental proxies for the modern, post-glacial and late glacial periods in Scotland can be applied also to the fragmentary evidence of earlier periods. Periglacial sediments also provide a wealth of data on palaeo-temperatures and palaeo-precipitation (Ballantyne & Harris Reference Ballantyne and Harris1994) and constrain former ice extent and thickness (Fabel et al. Reference Fabel, Ballantyne and Xu2012). Marine sediments and landforms from MIS 5 and perhaps earlier periods indicate former sea levels and wave environments (Smith et al. Reference Smith, Barlow, Bradley, Firth, Hall, Jordan and Long2019).
Glacial deposits older than MIS 5 allow constraints to be placed on former ice extent, dynamics and flow paths that can be compared with those of the last glacial cycle. The basal sediments of the Kirkhill sequence represent an interglacial-cold interstadial- stadial cycle that probably predates MIS 7. The sequence includes glacial and glacifluvial deposits that derive both from inland and from the North Sea coast. Patterns of ice flow in eastern Buchan were similar to those in later phases in MIS 6 and MISs 3-2 (Merritt et al. Reference Merritt, Connell and Hall2017). In MIS 6, ice in northern Shetland was moving towards the NW, as in the Shetland ice cap in MIS 3-2 (Hall Reference Hall2013). Cnoc-and-lochain terrain had already formed on the Lewisian gneisses (Chapelhowe Reference Chapelhowe1965). In Caithness, till units record movements of inland and Moray Firth ice. The tills sit in bedrock depressions that are part of the streamlined bedrock terrain of the plain of Caithness and indicate that streamlining of bedrock was present before MIS 5 (Hall Reference Hall2013). In NW Lewis, the presence of Torridonian and Cambrian clasts in a weathered till indicate the operation of the Minch Ice Stream in MIS 6. Carry of these and other erratics further S may indicate that the mainland ice sheet crossed parts of the Outer Hebrides in MIS 6 (Flinn Reference Flinn1978a). Across Moray and into lower Strath Spey, till fabrics and erratics for likely MIS 6 tills indicate similar pattern of ice flow as for MIS 3-2 (Merritt et al. Reference Merritt, Connell, Hall, Peacock, Merritt, Connell and Bridgland2000) In Buchan, MIS 6 tills appear to have all been derived from inland. Extensive W–E flow is indicated that is consistent with granitic, schistose, basic igneous and red sandstone clast assemblages found in a Saalian till in the Fladen area derived from NE Scotland (Sejrup et al. Reference Sejrup, Aarseth, Ellingsen, Lovlie, Reither, Bent, Brigham-Grette, Jansen, Larsen and Stoker1987). Combined evidence from blockfields and tors and glacial sediments indicates that the configuration, thermal regime and ice flow during MIS 6 were broadly comparable to those of the last ice sheet.
7. Conclusions and next steps
The Early and Middle Pleistocene periods in Scotland have received little previous specific attention despite a combined duration that far exceeds that of the last glacial cycle. Yet the 25 years since the publication of the Quaternary of Scotland Geological Conservation Review (GCR) volume (Gordon & Sutherland Reference Gordon and Sutherland1993b) have seen substantial advances in understanding the changing environments, developing landforms and terrestrial stratigraphy for this period in Scotland and on other glaciated passive margins.
The topography of Scotland retains landscapes (mountain blocks and peripheral lowlands) and large landforms (hills, basins and straths) that are of Neogene and older origin. This antecedent topography was modified and, in places, transformed by Pleistocene glacial and non-glacial processes. Glaciers were the dominant agents, made manifest by the frequency and size of glacial valleys and corries and by the extent of glacially dissected, roughened and streamlined terrain. Large areas of terrain, mainly in eastern areas and at higher elevations, lack well-developed glacial bedforms and were regarded previously as relict, pre-Pleistocene surfaces. Initial results from cosmogenic isotope inventories indicate, however, widespread non-glacial erosion on these surfaces through the Pleistocene. Mountain-top detritus and small landforms, such as tors, are dynamic features, maintained through the Middle and Late Pleistocene by weathering and erosion. Two research challenges are apparent: (i) to better constrain the landforms and tectonic, weathering and denudation history of Neogene landscapes; and (ii) to identify the spatial and temporal variability of erosion rates between and within zones of glacial erosion through the Pleistocene.
The Early Pleistocene was dominated by alternating 40 ka cycles of stadial conditions, with ice caps in the mountains and permafrost development to low elevations, and interstadial/interglacial conditions, without large glaciers and with cool to temperate conditions in the Scottish Lowlands. After 1.2 Ma, a transition to 100 ka cycles led to advances of large ice sheets into the North Sea and onto the North Atlantic shelf. The sedimentary record from the shelves around Scotland is now yielding increasingly detailed information about the timing and extent of ice sheets before the last glacial cycle (Stewart et al. Reference Stewart2019). Glacial deposits and landforms in the North Sea and East Anglia can be correlated with ice advances in most of the main cold stages of the Middle Pleistocene, but only the latest four to five Middle to Late Pleistocene advances are yet apparent from the terrestrial stratigraphic record in Scotland.
The British–Irish Ice Sheet was highly dynamic due to a position on the North Atlantic margin, with high snowfall and air temperatures close to freezing point. Extension on to shallow shelves around Scotland made successive ice sheets vulnerable to rapid retreat under rising sea levels (Clark et al. Reference Clark, Hughes, Greenwood, Jordan and Sejrup2012). Two modes of ice sheet behaviour, with development of mountain ice caps and full ice sheets, are apparent in ice sheet models (Golledge et al. Reference Golledge, Hubbard and Sugden2008; Hubbard et al. Reference Hubbard, Bradwell, Golledge, Hall, Patton, Sugden, Cooper and Stoker2009) but should be explored for a wider range of climate scenarios to match the likely range of conditions earlier in the Pleistocene. The distributions of glacially roughened and streamlined terrain, over-deepened valleys and thick tills are consistent with bimodal ice extent and dynamics.
The impact of glaciers in modifying the pre-glacial topography of Scotland varied in space and time. Glacier basal thermal regimes, influenced strongly by W–E climatic gradients and also by varied substrates and topography, exerted a fundamental control over erosion patterns. Beneath mountain ice caps in western Scotland, warm-based, fast ice flow discharged via narrow and steep-sided glens with high-gradient floors and led to valley over-deepening and to advanced dissection of relief. Similar conditions may have prevailed under these and other ice sheet source areas during short phases of ice drawdown. During the slow build-up of ice sheets, however, the ice remained mainly cold-based and non-erosive. In the eastern lowlands, of which Buchan is the type area, and at higher elevations, glacier ice remained cold-based throughout multiple glacial cycles, allowing the preservation of delicate non-glacial landforms and materials. In extensive intermediate terrain, the impact of glacial erosion was limited by the short duration of warm-based conditions. Next steps involve further mapping and dating of the complex mosaics of Early and Middle Pleistocene landforms and landscapes found across Scotland. Recent advances in reconstructing the pattern of the last deglaciation across Scotland have demonstrated the potential of digital elevation models for comprehensive mapping of glacial bedforms (Hughes et al. Reference Hughes, Clark and Jordan2010, Reference Hughes, Clark and Jordan2014), an approach that can be extended to include older glacial landscapes and landforms. Zones of glacial erosion also can be reassessed using LIDAR and other remote sensing data to map landforms, relief and terrain roughness (Grohmann et al. Reference Grohmann, Smith and Riccomini2011; Krabbendam & Bradwell Reference Krabbendam and Bradwell2013) and to link morphometry to rock type, fracturing (Krabbendam & Bradwell Reference Krabbendam and Bradwell2011) and glacial sediment distribution. Recognition of reference surfaces or landforms with little or no glacial erosion allows estimation of glacial erosion depths in neighbouring terrain using space-time transformations (Ebert et al. Reference Ebert, Hall, Kleman and Andersson2015). Depths of erosion can be converted to long-term average rates of erosion using the duration of non-glacial and glacial conditions indicated by regional temperature proxies (Hall et al. Reference Hall, Ebert and Hättestrand2013a). Estimates of rock removal from different zones of glacial erosion across Scotland through the Pleistocene provide opportunities for calculating source to sink budgets using sediment volumes offshore for locations such as the Sula Sgeir Fan, where source and sink are well-defined (Stoker & Bradwell Reference Stoker and Bradwell2005) and for examining the potential contribution of Pleistocene erosion to isostasy and uplift (Nielsen et al. Reference Nielsen, Gallagher, Leighton, Balling, Svenningsen, Jacobsen, Thomsen, Nielsen, Heilmann-Clausen and Egholm2009).
There is great potential to use cosmogenic nuclides to explore long-term erosion rates for both glacial and non-glacial landforms found within different zones of glacial erosion (Stroeven et al. Reference Stroeven, Fabel, Harbor, Hättestrand and Kleman2002). 10Be and 26Al cosmogenic nuclide inventories inherited from exposure before MIS 3-2 glaciation are widely reported from glacially eroded bedrock surfaces in Fennoscandia (Stroeven et al. Reference Stroeven, Hättestrand, Kleman, Heyman, Fabel, Fredin, Goodfellow, Harbor, Jansen and Olsen2016) and known to be present in Scotland (Stone et al. Reference Stone, Ballantyne and Fifield1998; Stone & Ballantyne Reference Stone and Ballantyne2006; Phillips et al. Reference Phillips and Merritt2008; Fame et al. Reference Fame, Owen, Spotila, Dortch and Caffee2018). This approach offers the prospect of testing the widespread assumption that rock landforms, such as roches moutonnées (Hall Reference Hall2013), streamlined ridges (Salt & Evans Reference Salt and Evans2004; Bradwell et al. Reference Bradwell, Stoker and Krabbendam2008a) and large meltwater channels (Greenwood et al. Reference Greenwood, Clark and Hughes2007) are mainly products of erosion beneath the last ice sheet. Long-term average rates of erosion also may be derived from studies of muogenic nuclide inventories at depths below ∼2.5 m in bedrock (Briner et al. Reference Briner, Goehring, Mangerud and Svendsen2016) and from inherited 10Be and 26Al in deeply buried tills (Ebert et al. Reference Ebert, Willenbring, Norton, Hall and Hättestrand2012; Fame et al. Reference Fame, Owen, Spotila, Dortch and Caffee2018).
Much further work is needed to link non-glacial landforms to rock properties and processes (Hopkinson & Ballantyne Reference Hopkinson and Ballantyne2014). The rates at which non-glacial processes operated over the Early and Middle Pleistocene in Scotland are also poorly known. More attention can be given to the subsurface where reactions between minerals and oxidising and reducing groundwater in saprolites and fracture zones have produced indicator secondary minerals. Emerging techniques that allow dating of minerals formed above and below the redox front allow the residence times of the minerals and the depth of post-formational erosion to be estimated. For example, age estimates can be derived from meteoric 10Be inventories in saprolites (Ebert et al. Reference Ebert, Willenbring, Norton, Hall and Hättestrand2012; Duxbury et al. Reference Duxbury, Bierman, Portenga, Pavich, Southworth and Freeman2015), K–Ar dating of authigenic illite soil clays (Fredin et al. Reference Fredin, Viola, Zwingmann, Sørlie, Brönner, Lie, Grandal, Müller, Margreth and Vogt2017) and Mn oxides (Dill et al. Reference Dill, Hansen, Keck and Weber2010b) and high-resolution mass spectrometry of U phosphates and silicates (Dill et al. Reference Dill, Gerdes and Weber2010a). In zones of low glacial erosion, cosmogenic nuclide inventories from depth profiles in quarries and tor interiors (Bierman & Caffee Reference Bierman and Caffee2002), on quartz veins in MTD (Portenga et al. Reference Portenga, Bierman, Rizzo and Rood2013) and on dissected, till-covered shore platforms (Saillard et al. Reference Saillard, Hall, Audin, Farber, Hérail, Martinod, Regard, Finkel and Bondoux2009) also have potential for establishing erosion rates across a variety of geomorphological settings.
The search for new Middle Pleistocene sedimentary records on land in Scotland has slowed in recent decades, but stratotype sequences, such as at Kirkhill, Dalcharn and in the Assynt caves, illustrate the potential value of these environmental archives. Pitting and drilling surveys are needed where complex sequences of Pleistocene sediments, including organic materials, are known to occur in the near-surface and at depth (Sutherland Reference Sutherland and Walker1984). Continuing efforts are needed to link offshore and terrestrial sedimentary records by improved stratigraphic control and dating, provenance studies (Busfield et al. Reference Busfield, Lee, Riding, Zalasiewicz and Lee2015), palynology (Lee et al. Reference Lee, Rose, Riding, Moorlock and Hamblin2002; Mudie & McCarthy Reference Mudie and McCarthy2006) and new amino acid analyses of marine molluscs (Reinardy et al. Reference Reinardy, Hjelstuen, Sejrup, Augedal and Jørstad2017). In dating, a major challenge ahead lies in extending the timeframe of the BRITICE Glacial Mapping Project beyond the last MIS 3-2 glaciation (Clark et al. Reference Clark, Ely, Greenwood, Hughes, Meehan, Barr, Bateman, Bradwell, Doole, Evans, Jordan, Monteys, Pellicer and Sheehy2018) to examine earlier events. A major difficulty lies, however, in the limited constraints on the ages of sediments beyond the range of radiocarbon dating. Tephrochronology is increasingly important in dating post-glacial sediments (Lowe Reference Lowe2016) but checks for the presence of tephra in older sediments are not routine. For glacigenic sediment sequences, there is a pressing need to revisit and extend earlier luminescence dating of sandy sediments intercalated with tills (Duller et al. Reference Duller, Wintle and Hall1995; Gemmell et al. Reference Gemmell, Murray and Connell2007). This would require clear objectives and the need to experiment with potentially new luminescence techniques to provide robust chronologies in order to match, for example, those available for the Middle and Late Pleistocene sequences in northern Germany (Roskosch et al. Reference Roskosch, Winsemann, Polom, Brandes, Tsukamoto, Weitkamp, Bartholomäus, Henningsen and Frechen2014) and Finland (Pitkäranta Reference Pitkäranta2009). Deeply buried old tills and palaeosols can also be dated using multiple cosmogenic nuclides (Balco et al. Reference Balco, Stone and Mason2005b, Reference Balco, Stone and Jenningsc). The complex relationships that exist between the deposition of multiple till units and ice flow phases can be further examined by detailed analysis of till mineralogy and clast content (McMartin & McClenaghan Reference McMartin and McClenaghan2001). Where transport distances for till constituents are short, glacial erosion is likely to be limited in depth (Salonen Reference Salonen1986) or restricted in its duration.
Improved control over the ages of sediments, soils and saprolites and on long-term rates of weathering and erosion, combined with information on palaeoenvironments, ice extent and sea level, will allow future testing and calibration of new mathematical models of Early and Middle Pleistocene ice dynamics, isostasy, sea-level change, permafrost and non-glacial process impacts. A shift of focus away from the chronology and pattern of the last glaciation in Scotland is overdue. Emerging dating techniques applied to a wider range of materials and landforms have potential to greatly improve our understanding of weathering, erosion and landscape development over 0.1–10 Ma timescales in Scotland.
8. Acknowledgements
This review has benefitted from the helpful criticism of David Sugden and one anonymous referee and the careful attention of the volume Editor, John Gordon. JWM publishes with the permission of the Executive Director of the British Geological Survey, Natural Environment Research Council (NERC). AMH is grateful to The Carnegie Trust for the Universities of Scotland for research support. AH gratefully acknowledges a Research Professorship from the Research Council of Norway through its Centres of Excellence funding scheme grant No. 223259.


