Iodine deficiency severely impaired public health in China during the last century. To eliminate the hazard of iodine deficiency, universal salt iodisation has been implemented since 1995, and iodine deficiency disorders (IDD) have been successfully controlled during the past 22 years( Reference Zimmermann and Andersson 1 , Reference Mao, Ding and Lou 2 ). The prevalence of IDD in 8- to 10-year-old children has sharply decreased from 20·4 % in 1995 to 2·4 % in 2011( Reference Liu, Su and Shen 3 ). However, findings from recent studies( Reference Zimmermann, Ito and Hess 4 ) have linked high iodine exposure with adverse effects and disorders due to excess iodine intake( Reference Carvalho, Meirelles and Oliveira 5 ). Therefore, it is urgently necessary to establish reasonable and reliable dietary reference intakes (DRI) for the Chinese population. DRI is a collective term which includes a set of reference values. In China, DRI consist of estimated average requirement (EAR), recommended nutrient intake (RNI) or adequate intake and tolerable upper intake level. In 2013, the China Nutrition Science Congress (CNSC) adjusted and modified DRI for Chinese population, which are mostly calculated indirectly by referencing the studies from other countries. EAR and RNI (RNI in China is equivalent to the RDA in the USA) of iodine for adult in the new edition are 85 and 120 μg/d, respectively( Reference Congress 6 ). However, we have observed that Chinese adults have a lower tolerance to iodine than American adults( Reference Sang, Wang and Yao 7 ), suggesting that those recommendations should be revised based on data from Chinese residents.
Iodine mainly comes from diet and water, and it is largely excreted through urine and faeces( Reference Longvah, Toteja and Upadhyay 8 ). Theoretically, the atmosphere also contains measurable amounts of iodine, which can be absorbed by human via respiration, and people can also excrete iodine by respiration( Reference Vought, London and Brown 9 ).
Balance studies are classical method to determine the iodine requirement( Reference Costa, Bacci and Campagnoli 10 , Reference Harrison 11 ). However, only few studies on iodine balance have been carried out largely because of logistical and ethical challenges of ensuring complete sample collection and carefully controlling iodine intakes( Reference Dworkin, Jacquez and Beierwaltes 12 ). Some negative balances have been reported in previous iodine balance studies by foreign researchers, which are mostly conducted in the metabolic ward or in patients with normal thyroid function( Reference Dworkin, Jacquez and Beierwaltes 12 – Reference Dold, Zimmermann and Baumgartner 16 ). However, in China, there is a dearth of data on the iodine balance. Moreover, it is difficult to control the intake of iodine from diet. The iodine content greatly varies in different foods. As a result, it is hard to analyse the data of balance studies in the past( Reference Vought, London and Lutwak 17 ). To optimise the balance study, more information should be extracted from data by appropriate analytical methods.
In the present study, we carried out an iodine balance experiment based on the theory of balance study( Reference Dworkin, Jacquez and Beierwaltes 12 , Reference Vought and London 15 ). To explore the recommended iodine intake for adult females, data of dietary iodine intake and iodine excretion were collected. The zero iodine balance was calculated based on the daily iodine intake and excretion. EAR and RNI were explored according to the theory of balance experiment. This study was a pivotal report on the iodine balance experiment of Chinese females. Our findings provided the basic evidence for the optimisation of RNI of iodine in China and also offered crucial reference for other countries and organisations.
Subjects and design
Subjects
In the present study, non-pregnant and non-lactating female volunteers were recruited from the students of Tianjin Medical University, and those with thyroid disorders or who used drugs for thyroid diseases were excluded. A total of thirty-seven participants provided morning spot urine sample and fasting blood samples for screening. Those with an abnormal (i.e. outside the pre-established reference ranges, see Table 1) urinary iodine concentration (UIC) and thyroid hormone level or auto-antibody-positive were excluded from the study. According to the inclusion and exclusion criteria (Table 1), twenty-five volunteers were eventually included, and all of them had no medication history of iodine in the past 2 weeks.
Inclusion and exclusion criteria for screening volunteers
UIC, urinary iodine concentration; UCr, urinary creatinine; FT3, free triiodothyronine; FT4, free thyroxine; TSH, thyrotropin; Tg, thyroglobulin; TGAb, thyroglobulin antibody; TPOAb, thyroid peroxidase antibody.
* Nine of twelve volunteers were not qualified for more than one indicator.
The purpose and procedure of the balance experiment was carefully explained to all the volunteers. Participants were required not to eat kelp, seaweed and other foods with high iodine content and were provided with the restrictive diet in the experiment. Subjects were free to engage in normal activities( Reference Jahreis, Hausmann and Kiessling 18 ). All procedures were approved by the Ethics Committee of Tianjin Medical University according to the Code of Ethics of the World Medical Association (Declaration of Helsinki). Written informed consent was obtained from each participant. This information on the research has been registered on ClinicalTrials.gov (ID: NCT03279315).
Experimental design
The experiment was conducted in November and December of 2014, for a total duration of 1 month. Allowing for the possibility of negative iodine balance( Reference Dworkin, Jacquez and Beierwaltes 12 , Reference Harrison, Harden and Alexander 14 ) in the first 3 weeks, the diet which included non-iodised salt was provided, while the diet with iodised salt was offered in the 4th week. The total daily iodine intake consisted of dietary iodine intake (D), water iodine intake (W) and iodine from breathing (B1), while iodine could be excreted out of human body by urine (U), faeces (F), sweat (S) and breathing (B2). The 24 h iodine intake and 24 h iodine excretion were determined in each individual participant, and the iodine balance was calculated accordingly. The samples were collected in three continuous days of every 7-d. The 3-d include two working days and one weekend day. The sampling started from 08.00 hours of the day to 08.00 hours the next day.
Dietary iodine intake (μg/d)
Before the study, the iodine content of all commercially available foods with a regular consumption was determined with As–Ce catalytic spectrophotometry, and data are shown in Table 2. Based on these results, a 4 d nutritionally and energetically adequate diet containing about 100 µg/d was devised that was satisfactory to public taste. A typical day is shown (Table 3). These meal plans involved adjustment of the iodine-rich foods, principally milk and eggs, to achieve the planned intake levels, but kelp and seaweed were prohibited. Diets contained different levels of iodine in different periods (weeks 1–3 v. week 4), and it was necessary to supplement the diets with iodised salt at the higher levels of intake (above 300 μg/d)( Reference Vought and London 15 ). All salt and condiments were purchased from a supermarket by our investigators, while other raw materials were obtained by restaurant staff.
Iodine content of foods consumed by healthy Chinese adultsFootnote *

* The iodine content of foods was detected with As–Ce catalytic spectrophotometry. Every food was measured in triplicate. The data shown in this table are the mean of the parallel samples.
Typical daily meal planFootnote *
* The total energy was 2300 kcal (9623 kJ). The total iodine content of meal plan was calculated according to China Food Composition (edition 2, Beijing Medical University Press, 2009). The energy proportion of protein, fat and carbohydrate, referred to the 2013 Reference Intake of Dietary Nutrients for Chinese Residents, were 10–12, 20–30 and 55–65 %, respectively.
Everyone was issued a unified tableware to maintain consistent dietary pattern as another six lunch boxes were used as six duplicates. All volunteers were maintained on the prescribed 4-d diet cycle prepared by the university kitchen with duplicate portions retained for 4 weeks( Reference Lightowler and Davies 19 ). In the first 3 weeks, volunteers were supplied with diet cooked with non-iodised salt. The diet cooked with iodised salt was provided in the 4th week. No table salt was supplied in the dining hall. Subjects were requested to provide the duplicate samples and not allowed to add salt at the table if they ate out. During the study, leftovers of each participant and the six duplicate diets per meal were weighed, homogenised, lyophilised and preserved in the freezer at –20°C until further analyses( Reference Sang, Wang and Yao 7 ).
Water iodine intake (μg/d)
Before the balance study, iodine-free plastic cups with tick marks were distributed to each volunteer. All the volunteers were requested to drink water using the plastic cups and record the volume during the experiment, while beer and other drinks were prohibited. Given that volunteers spent most of their time in the campus during the experimental period, drinking water samples were collected in three cafeterias and water rooms, which were the main sources of drinking water in Tianjin Medical University. The water samples were collected and processed at least every 7 d, and occasionally several water samples were obtained during a 7-d period. All the samples were collected using 50 ml iodine-free plastic pipe and then preserved in the freezer at −20°C before further analyses.
Breathing iodine intake (μg/d)
Previous studies have demonstrated that hospital room atmosphere contains significant amounts of iodine( Reference Vought, London and Brown 9 ). However, an iodine balance study by Vought & London( Reference Vought and London 15 ) has noted that no significant amount of iodine is trapped (i.e. the amount of trapped iodine does not exceed 0.1 μg/m3). In a previous study, we measured atmospheric iodine concentration three times over the course of the study period using an air atomiser and cascade sampling cutter( Reference Yunyi, Jun and Ping 20 ). Following collection, pyrohydrolysis was employed to digest the samples and further determinations were carried out. We next estimated the vital capacity at the calm state and the 1-d inspiratory capacity for each participant. Subsequently, we used these measurements to determine the breathing iodine intake (B1).
Total iodine intake (μg/d)
The pathway of iodine intake in human body mainly includes above-mentioned three aspects: diet (D), drinking water (W) and breathing (B1). Therefore, the total iodine intake (TI) was calculated as follows: TI=D+W+B1.
Urinary iodine excretion (μg/d)
Participants were provided with a wide-necked jug and a 2·5 litre leak-proof container (both were acid-washed and rinsed before use), and they were advised not to wash the jug between urine collections and to ensure that the container lid was well sealed. Total iodine excretion (TE) in a 24 h urine collection is a good method to avoid the effects of diurnal variation and satisfy the needs of the balance study( Reference Dold, Zimmermann and Baumgartner 16 , Reference Jahreis, Hausmann and Kiessling 18 ). On 3 d of each week (two working days and one weekend day), 24 h specimens of urine were collected from 08.00 hours in the first day to 08.00 hours in the next day, and the urine volume was measured once the 24 h collection was completed. Subsamples of 24 h urine specimens (approximately 5 ml of each) were sealed and stored at –20°C in the freezer upon arrival at our laboratory. Total 24 h iodine excretion was calculated for each subject by multiplying UIC (μg/l) by total urine volume (litre).
Faecal iodine excretion (μg/d)
Similar to urine sample collection, complete collections of faeces were carried out under strict nursing supervision( Reference Vought and London 15 ) on three consecutive days (two working days and one weekend day) of each week. For stool collection, the subjects were provided with a plastic bedpan, in the hollow part of which an iodine-free plastic bag was placed, and each stool was collected into a different bag( Reference Malamos, Koutras and Marketos 21 ). Soon after the completion of a 1-d collection, the stools were weighed, homogenised as described in earlier reports( Reference Vought, London and Lutwak 17 ) and then frozen at –20°C within 12 h after collection. An aliquot was taken for analysis, and the 3-d average iodine content was determined within 1 week. The faecal iodine excretion was directly calculated by multiplying the 3-d stool weight times the average iodine content.
Sweat iodine loss (μg/d)
The experiment was conducted in winter. The room temperature was controlled at 22±2°C. The sensible perspiration (from activity, exercise and heat) was considered minimal. Insensible evaporation was considered the main route of sweat iodine excretion and was estimated from the pre-existing data. The daily insensible evaporation from skin of healthy adults was calculated based on Lamke’s study( Reference Lamke, Nilsson and Reithner 22 ): the water loss by skin (ml/d)=body surface area (BSA, m2)×500 (ml/d)/1·75 (m2). In this study, volunteers’ BSA was calculated by Zhao’s formula( Reference Zhao, Liu and Yao 23 ): BSA (m2)=0·00586×height (cm)+0·0126×weight (kg)−0·0461. According to Mao’s study, the sweat iodine concentration of health adults is about 37 μg/l( Reference Mao, Ko and Chen 24 ). Therefore, the sweat iodine loss (S) was calculated as follows: S (μg/d)=water loss by skin (ml/d)×0·037 (μg/ml).
Breathing iodine excretion (μg/d)
Exhaled gas was collected by a U-shaped iodine-free glass tube, which was specially connected with a cascade sampling cutter. Volunteers were requested to breathe for 1 h at a normal respiratory rate. Each glass tube was connected with a rubber tube at the other end. Volunteers should place the rubber tube into the mouth, always breathe in through nose and breathe out through mouth. Air subjected to alkaline fusing and dissolution using a fusion mixture( Reference Yunyi, Jun and Ping 20 ). The concentration was measured according to the detection of water iodine. During the experiment, three tests were carried out, and the average value was taken as B2.
Total iodine excretion (μg/d)
Iodine is mainly excreted from human body through the urine, faeces and exhaled breath. Therefore, the TE was calculated as follows: TE=U+F+S+B2.
Iodine balance value (μg/d)
Iodine equilibrium state of the human body can be expressed by the iodine balance (IB) value, which is equal to the TI minus the TE: IB=TI–TE.
Laboratory analysis
Chemical analyses of food, excreta and serum for iodine and other chemical compounds were carried out at the Central Laboratory of Preventive Medicine in Tianjin Medical University using nationally standardised and validated methods.
The contents of dietary iodine and faecal iodine( 25 ) were determined using As–Ce catalytic spectrophotometry( Reference Mao, Ding and Lou 2 , Reference Dold, Baumgartner and Zeder 26 , Reference Mao, Zhu and Mo 27 ). Specimens were blindly measured in duplicate. Drinking water iodine( 28 ) was also determined with the As–Ce catalytic spectrophotometry( Reference Mao, Ding and Lou 2 , Reference Mao, Zhu and Mo 27 ). Urinary samples were analysed using a revised method as suggested by Yan( Reference Yaping, Yuqin and Liejun 29 ) for determination of urinary iodine with low usage amount of arsenic trioxide and using As(III)-Ce4+ catalytic spectrophotometry using ammonium persulphate digestion. For breathing iodine intake and excretion, after the pyrohydrolysis was applied to sample digestion, further determination of iodine was conducted by As–Ce catalytic spectrophotometry( Reference Mao, Ding and Lou 2 , Reference Yunyi, Jun and Ping 20 , Reference Mao, Zhu and Mo 27 ). Urinary creatinine (UCr) was measured by a national spectrophotometric standard method( Reference Chen, Wu and Lin 30 ). The national standard method (As–Ce catalytic spectrophotometry) was used for measurements of dietary iodine, faecal iodine, drinking water iodine, UIC and breathing iodine with quality control. Two levels of certified reference materials (CRM) – lyophilised human urine (lot no. GBW09108h and GBW09110k; National Reference Laboratory, Beijing) – with mean certified iodine concentrations of 88 (95 % central interval 79, 97) lg/l and 212 (95 % central interval 202, 222) lg/l were run with each batch of samples (applied as the CRM for urine, water and breathing iodine samples). The standardised reference material for diet iodine detection was purchased from National Institute of Standards and Technology (SRM 1548a for typical diet and faeces, SRM 3530 for iodised table salt). The total within- and between-assay CV (n 6) in our laboratory were 1·5–3·9 and 2·8–5·5 % (for urine and water samples), 1·9–5·1 and 4·0–6·2 % (for food and faecal samples), 4·5–5·1 and 3·7–6·2 % (for breathing iodine), respectively. Based on the analyses of the relevant CRM, the analytical recovery from urine and water was 92·6–107·0 %, from food and faecal was 91·0–109·4 % and from breathing iodine samples was 87·5–97·5 %. The CV for UCr concentration was 0·2–3·2 %.
Serum concentrations of the thyroid hormones FT4, FT3, thyrotropin (TSH) and thyroglobulin (Tg) were measured in all participants with an automated chemiluminescent immunoassay (model: ADVIA Centaur, Bayer Healthcare, Siemens) using diagnostic kits from Bayer Health Care, Siemens. Accuracy was assessed by analysing CRM of each batch. Three concentrations of CRM (Siemens) for FT3, FT4 and TSH were run with each batch of samples with certified concentrations of 3·68 (95 % CI 2·95, 4·42), 9·68 (95 % CI 7·74, 11·6) and 14·2 (95 % CI 11·4, 17·1) pmol/l for FT3; 11·2 (95 % CI 9·00, 13·5), 23·2 (95 % CI 18·6, 27·9) and 55·6 (95 % CI 44·5, 66·7) pmol/l for FT4 and 0·556 (95 % CI 0·445, 0·667), 5·93 (95 % CI 4·74, 7·12) and 38·7 (95 % CI 31·0, 46·5) mIU/l for TSH. The within- and between-assay CV (n 20) of middle-level CRM in our laboratory were 2·7 and 4·7 % for TSH, 3·2 and 5·5 % for FT4, 2·4 and 4·2 % for FT3 and 3·2 and 4·5 % for Tg, respectively. The sensitivities for each assay were as follows: 0·01 mIU/l for TSH, 1·3 pmol/l for FT4, 0·3 pmol/l for FT3 and 0·05 ng/ml for Tg.
Serum concentrations of the thyroid peroxidase antibodies (TPOAb) and thyroglobulin antibodies (TGAb) were measured by RIA with kits from the Beijing North Institution. The TPOAb and TGAb assays were run with the standard reference materials that were produced by Tianjin Nine Tripods Medical & Biological Co., Ltd. Two levels of standard reference materials with reference concentrations of 28·3 and 64·9 and 59·4 and 66·8 % for TGAb and TPOAb were run with each batch of samples, the total inter-assay CV was 8·5 % and the intra-assay CV was 14·3 % for TGAb. The inter-assay CV was 7·6 %, the intra-assay CV was 13·2 % for TPOAb and the results of the analyses of standard reference materials were 23·6 and 63·7 % for TGAb and 56·8 and 66·4 % for TPOAb, respectively.
Statistical analysis
Referred to Dworkin’s research( Reference Dworkin, Jacquez and Beierwaltes 12 ), the average iodine balance is –10·0 (sd 5·7) μg/d. The statistical power (1–β error probability) is set at 0·8, α error probability at 0·05, effect size at 1·4, the power calculation revealed a minimum sample size of 191 samples (using a cross-over research design). In this study, the differences among three groups were analysed by one-way ANOVA with expected mean difference at 20 % and standard deviation at 50 %. The sample size was based on Dworkin’s research( Reference Dworkin, Jacquez and Beierwaltes 12 ), which suggested that the iodine balance experiment should include more than 129 samples to ensure the stability and reliability of the results. Our proposed sample size should double at least than Dworkin suggested to control the individual variation to provide more power data when considering multiple comparisons. In this study, twenty-five volunteers were observed 3 d/week for 4 weeks over a month to collect 300 eligible samples.
Normally distributed data were expressed as the means and standard deviations. Non-normally distributed data were expressed as the median (M), with 25th and 75th percentiles (P25, P75). Two-sided analysis was performed with the SPSS (version 17.0). Differences in normally distributed data were analysed by independent samples t tests, and non-normally distributed data were analysed by the Kruskal–Wallis test or Wilcoxon rank-sum test. The differences among the first 3 weeks (i.e. the first period) were analysed with repeated-measures ANOVA for normally distributed indexes and evaluated with Kruskal–Wallis test for non-normally distributed indexes. Bonferroni correction was used to adjust multiple comparisons if there were significant differences between different weeks.
Analysis of the correlation between two continuous variables was conducted using Pearson correlation when both variables were normally distributed or Spearman correlation when variables did not conform to bivariate normal distribution. A χ 2 test was conducted to compare the difference in distribution proportion.
Because of the characteristics and complexity of the balance experiment design and calculations used to estimate turnover, the RNI for iodine is set using a CV of 20 % of the EAR, rather than 10 % CV based on the variation in BMR. The RNI is defined as equal to the EAR plus twice the CV to cover the needs of 97–98% of the individuals in the group (therefore, for iodine the RNI is 140% of the EAR)( 31 ).
Results
Screening results of subjects
A total of twenty-five volunteers were enroled in this iodine balance experiment. The information about age, height and weight was collected. The baseline data of median of UIC, serum FT3 concentrations, FT4 concentrations, TSH concentrations and Tg concentrations are shown in Table 4.
Screening results of the volunteers (n 25) (Mean values and standard deviations; medians and interquartile ranges (IQR))
MUIC, median of urinary iodine concentration; FT3, free triiodothyronine; FT4, free thyroxine; Tg, thyroglobulin; TSH, thyrotropin; Tg, thyroglobulin.
Intake of iodine in volunteers
Table 5 summarises the values of iodine intake, iodine excretion and iodine balance in the first period (the 1st to 3rd week). A total of 299 dietary samples were collected in this study, and 224 samples were gathered in the first period, while one sample was lost.
Summary of iodine intake, excretion and iodine balance study in the first periodFootnote *
* Full names of the abbreviations: dietary iodine intake (D), water iodine intake (W), iodine from breathing (B1), total iodine intake (TI), iodine excreted by urine (U), iodine excreted by faeces (F), iodine excreted by sweat (S), iodine excreted by breathing (B2), total iodine excretion (TE), iodine balance value (IB). n 25×3 (25 participants sampled 3 times per week).
† One dietary sample was missed, and the number of dietary samples was 74.
‡ Values are mean±sd, adjusted for multiple comparisons and analysed using a repeated-measures ANOVA in the first period, Bonferroni correction was used to adjust for multiple comparisons.
§ Significantly different from 1st week, P<0·05.
|| Significantly different from 2nd week, P<0·05.
¶ Values are median (interquartile range (IQR)), adjusted for multiple comparisons and analysed using a Kruskal–Wallis test in the first period, Bonferroni correction was used to adjust for multiple comparisons.
Significant differences in the dietary iodine intake (D) were found among the first 3 weeks. Though D in the 2nd week was significantly higher than that of the 1st (P=0·028) and 3rd weeks (P=0·005), the TI was approximately at the recommended level during the experimental period. D was sharply increased when the diet was supplemented with iodised salt in the 4th week, which was significantly higher than that of the first period (F=159·237, P<0·001). Similar changing patterns of TI were observed. The iodised salt considerably contributed to the daily TI, accounting for approximately 62·7 % ((467–174)/467) of the total intake in week 4. Tables 5 and 6 illustrate the distribution of dietary iodine intake.
Distribution of iodine intake and iodine excretion, and the proportion for each component in each periodFootnote *

* Full names of the abbreviations: dietary iodine intake (D), water iodine intake (W), iodine from breathing (B1), total iodine intake (TI), iodine excreted by urine (U), iodine excreted by faeces (F), iodine excreted by sweat (S), iodine excreted by breathing (B2), total iodine excretion (TE), iodine balance value (IB). n 25×3 (25 participants sampled 3 times per week).
† Values are mean±sd, analysed by t test.
‡ Values are median (interquartile range (IQR)), analysed by using the Wilcoxon rank sum test.
§ Values are median (interquartile range (IQR)), adjusted for multiple comparisons and analysed by using a Kruskal–Wallis test in the first period, Bonferroni correction was used to adjust for multiple comparisons.
‖ Significantly different from the first period, P<0·05.
The W was stable during the experiment. No statistical difference was observed in W among the first 3 weeks v. week 4, even though different table salts were provided between the two periods.
Excretion of iodine in volunteers
Our data showed that the UIC did not synchronously fluctuate along with iodine intake, but it was still correlated with iodine intake (Spearman r 0·648, P<0·001). The UIC in the first phase was 97·2 μg/l (quartiles: 81·6, 117·8 μg/l), while it was 216·4 μg/l (quartiles: 181·0, 259·9 μg/l) in the second phase. No significant difference in U (μg/d) was observed between the 2nd week and 3rd week (P=0·853). However, in the 1st week, it was higher than that in the 2nd week (P<0·001) and 3rd week (P<0·001). As expected, greater changes in U were observed in the second period compared with the first period (χ 2 =168·382, P<0·001). The urine volume had no significant difference among different weeks (F=1·783, P=0·151) and also had no obvious difference between two periods (t=1·390, P=0·166).
F was also associated with the TI (r 0·366, P<0·001). No significant differences were observed in F among the first 3 weeks (P>0·05). A significant increase in F was observed when the diet was supplemented with iodised salt. It was obviously higher than that of the first period (χ 2=10·396, P=0·015).
In addition, S was calculated based on the BSA of volunteers. According to the previous research, the average sweat iodine loss of volunteers was 16·1 (sd 1·2) μg/d.
Significant differences were found in TE. It was higher in the 1st week than that in the 2nd week (149·4 v. 118·6 μg/d, P<0·001) and 3rd week (149·4 v. 124·7 μg/d, P=0·002), while no statistical difference was found between the 2nd and 3rd week (P=0·442). Table 6 reveals that TE in the second period was significantly higher than that in the first period (F=150·918, P<0·001).
Iodine balance in volunteers
In 300 samples, 92·3 % of them were in positive balance, while twenty-three samples presented negative balance. Five, three, seven and eight cases with negative balance were found in the 1st, 2nd, 3rd and 4th weeks, respectively.
The scatter diagram indicated a linear relationship between TE and TI. Fig. 1 reveals that the equation of the least squares line was TE=0·3432×TI+72·6 μg/d, and the slope was 0·3432. It represented the fraction of iodine intake excreted per d, which was significantly different from zero (P<0·0001). The intercept, 72·6, of the regression with the ordinate (TE) would represent any excretion of iodine independent of intake, which was also different from zero (P<0·001). The correlation coefficients were high (r 0·7350, P<0·001), emphasising the close relationship between iodine intake and excretion.
Regression of daily iodine excretion on dietary intake. Each point gives the total excretion for 1 d, on which both iodine intake and iodine excretion were measured. Equation for the dotted line: y=x. Data included 299 samples from twenty-five women.
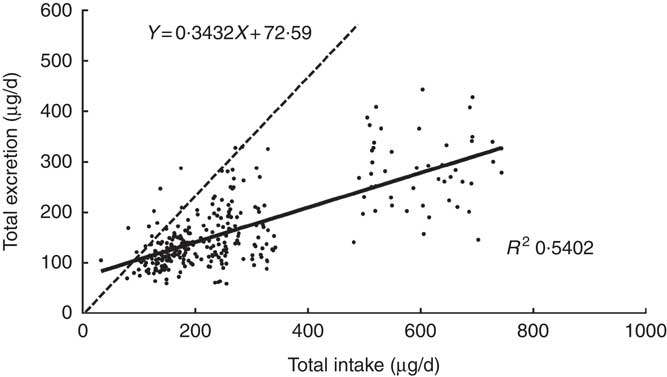
The dotted line was a regression through the origin with a slope of 1 shown in Fig. 1, representing the ideal case if iodine intake was exactly equal to iodine excretion on a day-to-day basis. The intersection point of the solid and dotted lines represents the iodine intake under the zero balance condition of iodine (such as iodine intake was equal to iodine excretion), which was 110·5 μg/d.
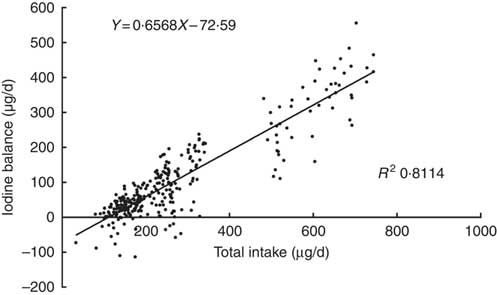
A plot of the daily balance against the daily intake suggested that these two might be correlated, and the differences in intake might explain these apparent differences in balance. Fig. 2 shows the relationship between TI and IB, and the regression lines were fitted to the observations with the least squares technique( Reference Dworkin, Jacquez and Beierwaltes 12 ). The equation was as follows: IB=0·6568×TI–72·6 μg/d. The intercept, –72·6, and the slope, 0·6568, both were significantly different from zero (P<0·001). The correlation coefficient (r 0·911, P<0·001) indicated that the iodine balance was almost entirely dependent on the TI.
Scattergram between daily iodine balance and daily iodine intake. Each point gives the balance for 1 d, on which both 24 h iodine intake and 24 h iodine excretion were measured. Data included 299 samples from twenty-five women.
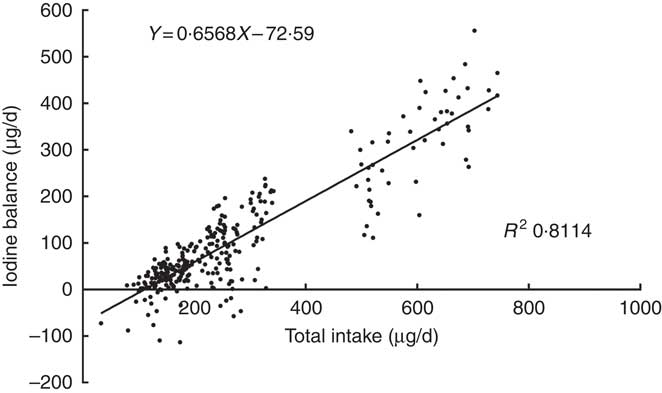
The intersection point of regression line and horizontal axis also represents the iodine intake under a zero balance of iodine, indicating that the level of the EAR is 110·5 μg/d. The same EAR values were obtained by two regressions. According to the relevant CV, the calculated iodine RNI is 154·7 μg/d.
Distribution of iodine intake and excretion
Table 6 shows the distribution of iodine intake and iodine excretion as well as the proportion of each part. A χ 2 test showed that the differences in both distributions of iodine intake (χ 2=3·532, P=0·171) and excretion (χ 2=4·033, P=0·211) between the first period and second period were not significant. Though volunteers were supplied the diet prepared with different table salts in different periods, the percentages of the different portions in the total intake or excretion were similar.
Discussion
RNI is the normal reference intake of certain nutrients in particular situation, including age, sex and physiological status. Therefore, it varies in different countries and regions. According to Fisher( Reference Fisher and Oddie 32 ) and DeGroot’s( Reference DeGroot 33 ) studies in 1960s, USA and Canada take 95 μg/d as an adult EAR, which is further confirmed by Harrison( Reference Harrison 11 ), and then they defined 150 μg/d as the adult iodine RDA (same as the RNI in China)( 31 ). It has been reported that the iodine balance is established when the iodine intake exceeds 100 μg/d in a previous iodine balance experiment( Reference Jahreis, Hausmann and Kiessling 18 ). Referred to this result and another study conducted on New Zealand adults by Thomson( Reference Thomson, Packer and Butler 34 ), Australia and New Zealand finally determined that the value of EAR is 100 μg/d, and the calculated RNI value is 150 μg/d with a CV of 20 %. The European Scientific Committee for Food believed that the iodine in the thyroid gland can reach a stable concentration with a total intake of 100 μg/d, so the EAR and RNI of iodine are recommended as 100 and 130 μg/d, respectively. However, for China and some other countries, they have to calculate RNI indirectly by referencing studies from other countries and the weight data due to the lack of related research support. CNSC has modified the DRI 2000 as a great deal of evidence suggest that the recommendation of iodine needs to be optimised. Our previous research and some other evidences have also suggested that the RNI should better fit to the situation of the Chinese population( Reference Sang, Wang and Yao 7 , Reference Shan, Chen and Lian 35 ).
In the present study, the iodised salt contributed approximately 62·7 % of the daily TI in week 4. This result was consistent with a previous study that the iodised salt contributes to 63·5 % of the daily TI( Reference Wu, Li and Chang 36 ). Iodine excretion (especially faecal iodine excretion) on any given day depends not only on the iodine intake of that day but also on the iodine intake of the preceding day(s). To overcome this difficulty and obtain valid tests with statistically significant slope, intercepts and correlation coefficients, data only for the last 3 d of each 7-d balance period were used( Reference Vought and London 15 ). The intercept (72·6) of the regression equation between TI and TE would represent any excretion of iodine independent of intake, and it was higher than the data of 57 μg/d found in an earlier study( Reference Vought and London 15 ).
Most of the volunteers were in positive iodine balance during the two experimental periods of our study, which was completely different from previous studies( Reference Dworkin, Jacquez and Beierwaltes 12 , Reference Bakker, Vulsma and de Randamie 13 , Reference Vought and London 15 ). Dworkin et al. ( Reference Dworkin, Jacquez and Beierwaltes 12 ) have reported that 77 out of 129 cases are in ‘negative iodine balance’ when the iodine intake of pregnant women is 80–250 μg/d. Malvaux et al. ( Reference Malvaux, Beckers and De Visscher 37 ) and Vought & London( Reference Vought and London 15 ) have also reported that a majority of volunteers are in ‘negative iodine balance’ in their iodine balance studies. Harrison( Reference Harrison 11 ) conducted an iodine balance experiment on eighteen healthy adults in the metabolic ward, and seven subjects were in negative iodine balance with 100 μg/d iodine intake. However, Vought and Malvaux did not think it is a negative iodine balance, considering that the body’s thyroid iodine stocks would be inevitably depleted in a short time, and if the body sustains a long period of ‘negative iodine balance’, it is clearly inconsistent with the facts( Reference Vought and London 15 , Reference Malvaux, Beckers and De Visscher 37 ). In our opinion, the ‘negative iodine balance’ observed in the classic iodine balance experiments did not reflect the real iodine metabolism due to a series of experimental design flaws. First, the experimental observation period is too short, and the dietary iodine provided in their experiments may be lower than before, leading to altered iodine metabolism( 31 ). Second, the measurement technique and quality control are flawed, resulting in failure of comprehensive and objective assessment of iodine intake and excretion( 31 , Reference Malvaux, Beckers and De Visscher 37 ). Although these studies have attempted to control the intake of iodine, they only have measured the iodine intake from food, while the iodine intake from other sources is ignored. Third, iodine intake is more prone to present skewed distribution when using a small sample size and a short observation period( Reference Vought and London 15 ). On the other hand, differences in iodine metabolism might exist in volunteers between different experiments. First, the physiological state is not the same, and researchers conducted experiments in metabolic disease ward and were mainly concerned about the iodine balance states of the newborns, pregnant women and the ones in the disease states in previous studies( Reference Harrison, Harden and Alexander 14 , Reference Malamos, Koutras and Marketos 21 , Reference Malvaux, Beckers and De Visscher 37 , Reference Smyth, Hetherton and Smith 38 ). However, in our study, all the subjects were healthy adults. ‘Positive iodine balance’ or ‘zero iodine balance’ has been reported in iodine balance studies of healthy people by Harrison(11) and Jahreis et al.( Reference Jahreis, Hausmann and Kiessling 18 ). Second, the living environment and dietary habits are not the same. Moreover, in the present study, the volunteers were all in sufficient iodine nutrition status, and the daily supply of iodine was adequate, leading to reduced incidence of iodine negative balance.
For iodine excretion, there is evidence that humans can ingest a certain amount of iodine by the respiratory pathway. Therefore, we determined the iodine intake and discharge through the respiratory pathway. However, we found that the iodine circulation through this way was very limited.
In addition, human sweat and women’s menstrual blood also contain a certain amount of iodine. The total menstrual flow has been collected and determined in a balance study( Reference Dworkin, Jacquez and Beierwaltes 12 ), and the iodine excretion per menstrual period for three patients, expressed as a percentage of the monthly iodine excretion, was 0·09, 0·13 and 0·23 %, respectively. Therefore, we ignored this part of iodine excretion in our study. The balance study was carried out in November at low temperature. Most of the volunteers spent time indoors, which was air-conditioned with the controlled temperature of 22±2°C. Therefore, the sensible perspiration was controlled and limited. The insensible evaporation is the main pathway via skin loss. Previous research( Reference Mao, Ko and Chen 24 ) has shown that iodine excretion by sweat is relatively stable under normal circumstances and is not affected by the dietary iodine content, perspiration amount and goitre prevalence. In our study, the calculated sweat iodine excretion was 16·1 μg/d, which was a non-negligible part to the iodine excretion.
There are certain limitations in our study. For instance, we suggested that to obtain more negative iodine balance data and to improve the accuracy and reliability of the zero iodine balance data, the nutritional iodine level of the volunteers should be further controlled. The potential risk of overestimation of iodine concentration when analysed by spectrophotometric methodology should also be considered. As–Ce catalytic spectrophotometry bases on the theory of Sandell–Kolthoff reaction. Evidences show that the catalytic effect of Na and Fe on Sandell–Kolthoff reaction would lead to false high values in the spectrophotometric determination of iodine( Reference Judprasong, Jongjaithet and Chavasit 39 ). The compliance of the participants should also be enhanced to promote the data quality. In addition it is advised to measure the iodine excretion perspired and reabsorbed by skin, which will improve the reference value of the results.
The results of this study show that the EAR level of iodine in Chinese adult women is 110·5 μg/d and the RNI is 154·7 μg/d. An RNI of 154·7 μg/d is higher than the RNI of 120 μg/d (Chinese DRI 2013)( Reference Congress 6 ) but close to the 150 μg/d (Chinese DRI 2000)( 40 ) and the USA( Reference Otten and Meyers 41 ). Our research provides direct evidence for the optimisation of the EAR and RNI of iodine for Chinese adult women. Dietary guidelines for iodine for other Chinese population groups may be extrapolated from this data.
Acknowledgements
The authors are particularly grateful to the participants from Tianjin Medical University for their contribution and support.
This work was financially supported by the National Natural Science Foundation of China (grant numbers 81330064, 31340033, 81703218), Tianjin Science and Technology Committee Project Foundation (grant number 14ZCZDSY00022) and Popular Science Projects of Tianjin (grant number 15KPXM01SF037). The funder had no role in the design, analysis or writing of this article.
The authors’ responsibilities are as follows: W. Z. and J. S. were the principal investigators and built the conception and design of the study. L. T. and X. T. were involved with the acquisition of data, data analysis and drafting the article; Z. X. revised the manuscript; J. S. and W. Z. were in charge of the final approval of the version; W. W., X. G., Z. S., X. L., Y. S., P. Z. and C. T. were involved with data acquisition and analysis.
There is no conflict of interest among all the authors.