


Introduction
After a period of increasing consumer interest in local foods over the last 20 years, local food markets in the USA are now maturing (Thilmany and Woods, Reference Thilmany and Woods2018). The definition of ‘local’ still varies considerably, but a key aspect of local foods is short supply chains, which we refer to as direct marketing channels. In some of these direct marketing channels farmers literally sell directly to consumers via venues such as farmers’ markets, Community Support Agriculture (CSAs) and roadside stands. However, in other forms of direct marketing channels, farmers market to a local business or organization (e.g. a school, hospital, grocery store, restaurant or other intermediary) which then sells to local consumers. Together we refer to the sales by farmers to all of these direct marketing channels collectively as total direct sales.
The most recent USDA estimate of total direct sales is US$8.7 billion (in 2015), estimated using data from the Local Food Marketing Practices Survey. Previous estimates include US$6.1 billion in 2012, which was a synthetic estimate based on data from Agricultural Resource Management Survey (ARMS) and the Census of Agriculture and US$4.8 billion in 2008, which was estimated using data from the ARMS (Low and Vogel, Reference Low and Vogel2011 and Low et al., Reference Low, Adalja, Beaulieu, Key, Martinez, Melton, Perez, Ralston, Stewart, Suttles, Vogel and Jablonski2015). While data differences prevent us from making a strong comparison statement, this prior research does suggest the most recent number (US$8.7 billion) represents an increase from previous years. However, direct-to-consumer sales—the subset of total direct sales in venues such as farmers’ markets, CSAs, and roadside stands that do not have any middlemen—are plateauing. Low et al. (Reference Low, Adalja, Beaulieu, Key, Martinez, Melton, Perez, Ralston, Stewart, Suttles, Vogel and Jablonski2015) found that between 2007 and 2012, the number of farmers engaged in direct sales to consumers increased, but the total direct sales to consumers did not, meaning the average sales per farm directly to consumers declined during this period.
At the same time, major food retailers such as Wal-Mart are carrying local foods and labeling them as such. By some reports, Wal-Mart is the largest buyer of local food nationally, with nearly US$750 million in local food sales annually (Tarkan Reference Tarkan2015). The interest of these major retailers in local foods means that consumers can now buy local foods with the rest of their groceries and need not make separate trips to direct-to-consumer venues. Restaurants are also featuring locally-sourced foods (Low et al., Reference Low, Adalja, Beaulieu, Key, Martinez, Melton, Perez, Ralston, Stewart, Suttles, Vogel and Jablonski2015). In addition, institutional channels (e.g. farm-to-school programs) and other local intermediaries (e.g. food hubs) are proliferating. Indeed, Low and Vogel (Reference Low and Vogel2011) estimated that in 2008 the value of direct sales through channels other than direct-to-consumer channels accounted for 50–66% of the value of all local food sales. More recent data from a different national data set supports their estimates; direct sales directly to institutions, retailers and other local intermediaries accounted for 66% of direct sales nationwide in 2015 (USDA NASS 2016b).
In this market environment, many farmers now have the (fortunate) problem of having to make choices between different direct marketing channels through which to sell their products. Indeed, farmers may choose to sell their products via multiple channels. However, each of these channels comes with specific challenges and transaction costs. In this work, we seek to shed light on potential challenges and highlight areas for further research by exploring the choices of farmers who sell directly in this multi-channel environment. In particular, we ask two questions: (1) what farm and farmer characteristics predict farmers’ participation in each direct marketing channel, and (2) what farm and farmer characteristics predict farmers’ choice of a particular marketing channel combination? We consider direct-to-consumer (e.g. farmers’ markets, CSAs, roadside stands and online sales), direct-to-retailer (e.g. grocers and restaurants), direct-to-institution (e.g. schools, hospitals and prisons) and direct-to-intermediary (e.g. food hub) marketing channels.
Understanding farmers’ use of these different marketing channels is important not only because of the maturing local food environment, but also because there remains strong interest among policymakers and philanthropists in supporting local food initiatives. The 2014 Farm Bill included US$501.5 million more in federal and state programs to support and promote local and regional food systems than the 2008 Farm Bill (Low et al., Reference Low, Adalja, Beaulieu, Key, Martinez, Melton, Perez, Ralston, Stewart, Suttles, Vogel and Jablonski2015). USDA's Farm-to-School program brings local food to 42% of US schools (National Farm to School Network, 2018). In terms of philanthropic support, in 2016, Sustainable Agriculture and Food System Funders (SAFSF) recorded at least US$165 million in grants for food and farm issues, which included the development of local and regional food infrastructure (SAFSF, 2016). Our work can help food system stakeholders and policymakers to make more informed decisions about marketing or funding strategies by helping them to better understand the direct marketing landscape.
Our research also builds on existing literature on farmers’ use of direct marketing strategies. However, we do so with a new data set—the Local Food Marketing Practices Survey, collected by USDA. This data set is the most disaggregated nationally representative data set on direct marketing channel use to date. In previous related work, Uematsu and Mishra (Reference Uematsu and Mishra2011) examined the number of direct marketing strategies used by farmers nationally using data from the USDA ARMS. Factors relating to the number of direct marketing strategies included farming experience, farm size, federal farm program payments and proximity to urban centers. Other studies have considered direct marketing channel choice for a subset of US producers. For example, Monson et al. (Reference Monson, Mainville and Kuminoff2008) found that farm size, crop type, organic certification and households were significantly related to a farmers’ choice to engage in direct marketing using a survey of small specialty crop producers in Virginia. Sage and Goldberger (Reference Sage and Goldberger2012) considered organic producers in Washington State and found that experience with organic production, social and environmental motivations for organic production and dairy/livestock production were significant factors associated with the choice to market directly. These questions are also of interest to scholars in regions outside the USA (e.g. Adanacioglu Reference Adanacioglu2017).
Our work can also help suggest future areas of study by highlighting patterns of marketing channel use that may be the result of certain barriers and transaction costs. Our work may thus inform the body of literature that considers how the use of different marketing channels relates to various measures of farm profitability, efficiency and performance. For example, Uematsu and Mishra (Reference Uematsu and Mishra2011) showed that the intensity of adoption of direct marketing strategies has no significant impact on gross cash farm income. However, Park et al. (Reference Park, Mishra and Wozniak2014) found that farmers choosing to sell through the direct-to-consumer channel only reported significantly lower earnings than farmers selling through other marketing channels. In a related simulation study, Kim et al. (Reference Kim, Curtis and Yeager2014) found that a mixed marketing strategy of marketing 40% of output via a farmers’ market and 60% via wholesale channels would be the best option (of those they consider) for risk-averse producers based on the mean and variance of profit. Yet other authors have conducted case studies to examine the performance of direct marketing firms in various specifics contexts (e.g. Hardesty and Leff Reference Hardesty and Leff2010; LeRoux et al., Reference LeRoux, Schmit, Roth and Streeter2010). In more recent work, using a stochastic (profit) frontier approach, Bauman et al. (Reference Bauman, Thilmany and Jablonski2017) found that marketing channel did not have an impact on financial efficiency for farmers engaged in direct marketing; differences in scale seemed to be a key driver of financial efficiency. In related work, Bauman et al. (Reference Bauman, Thilmany and Jablonski2018) found that farmers in the highest quartile of sales who participated in intermediated channels had a considerably higher return on assets. These varied results suggest we still need to learn more about the drivers and implications of different direct marketing channel choices and strategies among farmers.
To answer our research questions, we first develop a set of hypotheses about the relationship of various farm and farmer characteristics to direct marketing channel participation. Guided by the literature, we consider the relationship of marketing channel choice to a number of farm and farmer characteristics, including farm size and location, farm type and farm experience with direct marketing. Our data come from a new, nationally representative data set called the Local Food Marketing Practices Survey, collected by the USDA in 2016. We test our hypotheses empirically using two separate empirical models; we use binomial logit regressions to examine the binary decision to participate in each of the four main direct marketing channels, and we use a multinomial logit regression to examine the decision to participate in the most common mutually exclusive marketing channel combinations.
Our empirical estimation yields a variety of results, confirming many relationships that have been identified by others (e.g. the importance of farm size and region), refuting others (e.g. the importance of proximity to urban centers), but also identifying some relationships that may warrant further study. For example, livestock producers are less likely than other farmers to sell directly to retailers, and vegetable farmers are less likely to sell to intermediaries, suggesting product-specific barriers to participation in these direct marketing channels. As another example, beginning farmers are more likely to sell to consumers and retailers, whereas operations experienced with direct marketing are more likely to sell to intermediaries. These differing strategies by farmers with different levels of experience suggest there could be benefits to farmers from sharing knowledge across farmers of various ages and experience levels.
Data and variables
The data used in this analysis come from the 2015 Local Food Marketing Practices Survey, collected by the USDA. The survey was administered via mail, phone, web, e-mail and in-person data collection modes in all 50 states in the spring of 2016. Surveys were sent to 24,907 farms, and the response rate was 57.5%. Another 19,365 possible operations from a Multi-Agency Collaboration Environment list collected from public data sources were surveyed for coverage adjustment purposes only (USDA NASS 2016a). The weighted sample size represented by the survey, which accounts for nonresponse, coverage and misclassification, is 167,009 farms. These farms represent all US farms who sold some of their output through a direct marketing channel. Within that group, we consider only those farms selling products directly for human consumption (for example, feed crops such as hay, and ornamental crops such as flowers are excluded).
The survey includes questions about sales to four direct marketing channels—direct-to-consumer, direct-to-retail, direct-to-institution and direct-to-intermediary—and 14 total sub-channels within these channels. It also includes questions about sales of the raw and value-added product, locations and collective action related to market sub-channels, on-farm practices related to direct marketing, and other basic farm and operator characteristics.
The most common direct marketing channel used by farmers is direct-to-consumer (69% of farmers), followed by direct-to-intermediated and direct-to-institutional (36% of farmers) and direct-to-retail (14% of farmers) (USDA NASS 2017). However, some farmers use these marketing channels in combination; we can think of each of these combinations as a specific marketing strategy that involves a particular set of marketing and transaction costs. The top five most common mutually exclusive marketing channel combinations (representing the marketing channel combinations of more than 90% of farmers) are direct sales to: consumers only, consumers and retailers, intermediaries only, consumers and intermediaries, and retailers only. Four of these categories are also among the top five in terms of sales (as opposed to simple participation).
Characteristics of farms and farmers with direct sales in 2015 are described in Table 1. On average, US farmers participating in direct marketing earn US$52,376 from direct sales, but average sales differ across direct marketing channels (and not every farmer participates in every marketing channel). We see that farmers earn an average of US$18,123 from direct sales to consumers, US$14,003 from direct sales to retailers (but with a very large standard deviation) and an average of US$20,250 from direct sales to institutions and intermediaries (combined in our summary statistics due to concerns expressed by USDA NASS about data reliability of the individual categories). We can also parse these sales data in other ways that may be informative (not reported in the table). When considering only farmers who participated in each particular direct marketing channel (i.e. those with sales to that channel greater than zero), we see that farmers earn an average of US$26,365 from direct sales to consumers, US$98,996 from sales to retailers and an average of US$56,448 in sales to institutions and intermediaries.
Summary statistics for farms with direct sales in 2015

a Base category used for empirical estimation.
b Land that is not owned may be rented or used rent free. Observations are excluded if manual calculation of total acreage by authors based on survey did not match reported total acreage in survey.
We also consider the size of farms participating in direct marketing. Small farms are defined as those with US$1–249,999 in total (annual) gross value of sales across all marketing channels, including non-direct channels. More than 90% of farms represented in our data are classified as small farms using this cutoff; the current USDA cut-off for small farms is US$350,000, but it was not possible for us to use this cut-off due to the categories used in the survey (Hoppe and MacDonald, Reference Hoppe and MacDonald2013). We define a medium-sized farm as a farm with a total gross value of sales ranging from US$250,000 to 999,999 and a large farm as a farm with a total gross value of sales of US$1 million or more. According to our data, medium-sized and large farms account for 6.42% and 1.54% of farms with direct sales, respectively (Table 1).
Farms in our data set produce a wide variety of products. Table 1 shows the percentage of farms producing and marketing each category of output to either direct or traditional marketing channels. These categories are not mutually exclusive; for example, farmers can grow both fruits and vegetables. Of the farms represented in our data, 64.39% have sales of livestock products (animals, aquaculture and animal products), 28.77% sell fruits (including tree nuts and berries), 28.77% sell vegetables (including melons, potatoes and sweet potatoes) and 9.95% sell grains and oilseeds (including dry beans and peas). Although the percentage of farms selling livestock seems large, it is similar in magnitude to an estimate based on the 2012 US Census of Agriculture data. According to Low et al. (Reference Low, Adalja, Beaulieu, Key, Martinez, Melton, Perez, Ralston, Stewart, Suttles, Vogel and Jablonski2015), livestock farms (which they defined as those with 50% or more of their sales from livestock—a different measure from ours which we would expect to be more restrictive) represented almost 60% of all farms selling directly to consumers in 2012.
Each farm's location is defined with respect to metropolitan areas and seven regions in the USA (see Table 1). We use the 2013 Rural-Urban Continuum Codes (RUCC) to distinguish counties by the degree of urbanization. Among those farms represented in our data, 53.25% of farms are located in metro counties, 31.71% are located in rural metro-adjacent counties and 15.04% are located in remote rural counties. Interestingly, nearly 20% of direct farms are located in the Southeast region (defined in Table 1). This is the region with the largest number of farmers engaged in direct marketing. The Northwest region has the smallest number of farmers engaged in direct marketing, making up only 8.72% of farms in the data.
Finally, looking to the additional farm and farmer and characteristics (also in Table 1), we see that direct marketing farmers own an average of 83% of the land on which they farm and rent the rest from others. Farmers selling directly are 59-years-old on average and 17.4% of farmers engaging in direct marketing are female. Farm operations have engaged in direct marketing for 16 years on average (not necessarily continuously). However, 25.3% of farmers who participate in direct marketing on these operations are actually beginning farmers with 10 or fewer years of farming experience. Less than half of farmers (defined as the first operator listed in the survey) report farming as their primary occupation.
Empirical approach
We are interested in understanding the characteristics of farms and farmers that relate to (1) use of individual direct marketing channel and (2) overall direct marketing strategy. We use separate binary logit models to estimate the relationship between farm and farmer characteristic and the choice of each of the four main marketing channels—direct-to-consumer, direct-to-retailer, direct-to-institution and direct-to-intermediary. Contrary to the summary statistics, USDA NASS has permitted modeling the final two channels separately; we are less concerned about reliability issues related to sales because we are only looking at the participation decision. For each marketing channel, the likelihood of participating in (in other words, selling directly to) that channel is defined using the following binary logit model:
 $$\Pr \lsqb {y_i = 1 \vert x_{\bi i}} \rsqb = {\rm \Lambda} \,{\rm (}{\bi x}_{\bi i}^{\bi {\prime}} {\bi \beta} {\rm )} = \displaystyle{{{\rm exp}\,{\rm (}{\bi x}_{\bi i}^{\bi {\prime}} {\bi \beta} {\rm )}} \over {1 + {\rm exp}\,{\rm (}{\bi x}_{\bi i}^{\bi{\prime}} {\bi \beta} {\rm )}}}\;, $$
where the subscript i denotes a farmer; y i takes on a value of 1 if a farm sells directly to that marketing channel and zero otherwise. The xi vector represents farm and farmer characteristics described in the previous section of the paper; β is a parameter vector to be estimated; and Λ( · ) is the cumulative distribution function for the logistic distribution. All regressions are estimated using STATA and weighted using survey weights calculated and provided by USDA NASS.
The estimated parameters of the logit models are presented in terms of their average marginal effects (AMEs)—which is the average change in the probability of participating in the particular marketing channel given a one-unit change in the value of the regressor. For this analysis, we run four separate logit models, one for each direct marketing channel. The marginal effect of a change in variable j on the probability of farmer i participating in the direct marketing channel is given by:
 $$\displaystyle{{\partial p_i} \over {\partial x_{ij}}} = {\rm \Lambda} \,{\rm (}{\bi x}_{\bi i}^{\bi {\prime}} {\hat {\bi \beta}} {\rm )}\lsqb {1-{\rm \Lambda} \,{\rm (}{\bi x}_{\bi i}^{\bi{\prime}} {\hat {\bi \beta}} {\rm )}} \rsqb {\hat \beta} _j,$$
where p i is the probability of farmer i participating in the channel, x ij is the value of variable j for farmer i, Λ( · ) is the logistic cumulative distribution function, xi is the vector of variable values for farmer i,  ${\hat {\bi \beta}} $ is the vector of coefficient estimates from the logit regression estimation and ${\hat \beta} _j$ is the estimated coefficient on variable j. As the marginal effect changes with i, we report the AME of variable j on the probability of participating in each channel:
 $${\rm AM}{\rm E}_j = \; \displaystyle{1 \over N}\mathop \sum \limits_i \displaystyle{{\partial p_i} \over {\partial x_{ij}}},$$
where N is the total number of farmers. Marginal effects are calculated using the margins command in STATA.
We analyze farmers’ choices of participating in mutually exclusive direct marketing channel combinations (or marketing strategies) by employing a multinomial logit model with alternative-invariant regressors. According to our data, the five most frequent direct marketing channel combinations used by farmers are: direct-to-consumer only, direct-to-consumer and direct-to-retailer, direct-to-intermediary only, direct-to-consumer and direct-to-intermediary, and direct-to-retailer only. We pool all other marketing channel combinations in a sixth category labeled ‘other channels.’ The multinomial logit model accounts for these six choices (i.e. the six combinations of channels) simultaneously.
In this model, the likelihood of participating in each marketing channel combination l can be expressed as:
 $$\Pr \lsqb {y_i = l{\rm \vert} x_i} \rsqb = \displaystyle{{{\rm exp}\,{\rm (}{\bi x}_{\bi i}^{\bi {\prime}} {\bi \beta} _{\bi l}{\rm )}} \over {\mathop \sum \nolimits_{{\bi m} = 1}^6 {\rm exp}\,({\bi x}_{\bi i}^{\bi {\prime}} {\bi \beta} _{\bi m})}}{\bi \;}, {\bi \; \;} \; \; \; \; \; \; \; \; \; l = 1, \ldots, 6,$$
where the xi vector represents the same independent variables employed in the binary logit models described in the discussion of the binary logit models and βl represents a vector of coefficients to be estimated for each possible marketing channel combination l. This regression is weighted using survey weights calculated and provided by USDA NASS and estimated using STATA.
For this model, we again report AMEs—the average change in the probability of a farmer choosing each of the five most common marketing channel combination, or some other combination, given a one-unit change in each of the regressors. For this analysis, we run one multinomial logit regression, and farmers choose between six mutually exclusive direct marketing channel combinations, where a particular combination is denoted by l. The marginal effect of a change in variable j on the probability of individual i choosing direct marketing channel combination l is then given by:
 $$\displaystyle{{\partial p_{il}} \over {\partial x_{ij}}} = p_{il}\lpar {{{\hat \beta}}_{lj}-{\overline {{\hat \beta}}}_{ij}} \rpar \;, $$
where p il is the probability of farmer i choosing channel combination l, x ij is the value of variable j for individual i,  ${\hat \beta} _{lj}$ is the estimated coefficient of variable j for choice l, and $\overline {{\hat \beta}} _{ij} = \; \mathop \sum \nolimits_l p_{il}{\hat \beta} _{lj}$ is a probability-weighted average (average over choice l for each farmer i). As the marginal effect changes with i, we report the AME of variable j on the probability of choosing channel combination l:
 $${\rm AM}{\rm E}_{\,jl} = \; \displaystyle{1 \over N}\mathop \sum \limits_i \displaystyle{{\partial p_{il}} \over {\partial x_{ij}}},$$
where N is the total number of farmers. All marginal effects are calculated using the margins command in STATA.
We use prior literature to inform the choice of farm and household characteristics to include in the vector of regressors (x i) and to inform several hypotheses about their relationship to direct marketing channel participation. Factors that potentially influence marketing channel choice include farm size, product type, farm location and farmer experience and demographics.
First, we consider the farm size. We expect smaller farms to be more likely to sell directly to consumers and less likely to participate in other direct marketing channels than large farms, as small farms may not be able to meet minimum scale requirements to participate in other direct marketing channels (Low and Vogel, Reference Low and Vogel2011). Prior work has suggested that fruits and vegetables are the most common food categories to be sourced directly from farmers (Low and Vogel, Reference Low and Vogel2011; Low et al., Reference Low, Adalja, Beaulieu, Key, Martinez, Melton, Perez, Ralston, Stewart, Suttles, Vogel and Jablonski2015). Thus, we expect that farmers producing and selling fruits or vegetables to be more likely to participate in direct marketing to consumers, relative to farms producing and selling other agricultural products. Proximity to population centers of large cities and the large potential markets contained therein has also been shown to be a key determinant of successful marketing directly to consumers (Gale, Reference Gale1997; Govindasamy et al., Reference Govindasamy, Hossain and Adelaja1999; Morgan and Alipoe, Reference Morgan and Alipoe2001; Brown et al., Reference Brown, Gandee and D'Souza2006; Timmons and Wang, Reference Timmons and Wang2010; Detre et al., Reference Detre, Mark, Mishra and Adhikari2011). We hypothesize that the farms located in metro and metro-adjacent counties are more likely to sell directly to consumers than farmers in remote rural counties due to this increased market access. Considering farmer characteristics, beginning farmers may face lower barriers to entry to the direct-to-consumer marketing channel than to other direct marketing channels with higher transaction costs (Ahearn and Sterns, Reference Ahearn and Sterns2013; Bauman et al., Reference Bauman, Thilmany and Jablonski2017). We hypothesize that beginning farmers are more likely to participate in direct-to-consumer marketing than more experienced farmers and less likely to participate in other direct marketing channels. Farmer demographic characteristics, several farm operation characteristics and regional indicators are included as controls.
Results
Numerical results from the binary logit regressions and multinomial logit regression are reported in Tables 2 and 3. In addition, we provide graphical representations of the binary logit regression results in Figures 1–4, and graphical representations of the multinomial logit regression results in Figures 5–10. All regressions have Wald F-Statistics that are significant at the 1% level, which indicates that in each case, we can reject the joint null hypothesis that all of the variables have no effect. The results from the binary logit help us to better understand the relationship between farm and farmer characteristics and the decision to participate in each of the four particular marketing channels separately (Table 2). However, we know that many farmers sell to more than one channel. The results from the multinomial logit regression help us to better understand the relationship between farm and farmer characteristics and the use of common marketing channel combinations—we can think of each combination as a marketing strategy (Table 3). We organize our discussion of the results in terms of farm and farmer characteristics and alternate between discussion of the results in Table 2 (and corresponding Figs. 1–4) relating to individual marketing channel choice and the results in Table 3 (and corresponding Figs. 5–10) relating to marketing channel choice combinations. In Tables 2 and 3, as well as the figures, we report AMEs, which is the average change in the probability of choosing the particular channel (in the case of Table 2 and Figs. 1–4) or channel combination (in the case of Table 3 and Figs. 5–10) with a one-unit change in the regressor of interest, holding all else constant.
Relationship of characteristics to probability of selling direct to consumers.

Relationship of characteristics to probability of selling direct to retailers.

Relationship of characteristics to probability of selling direct to institutions.
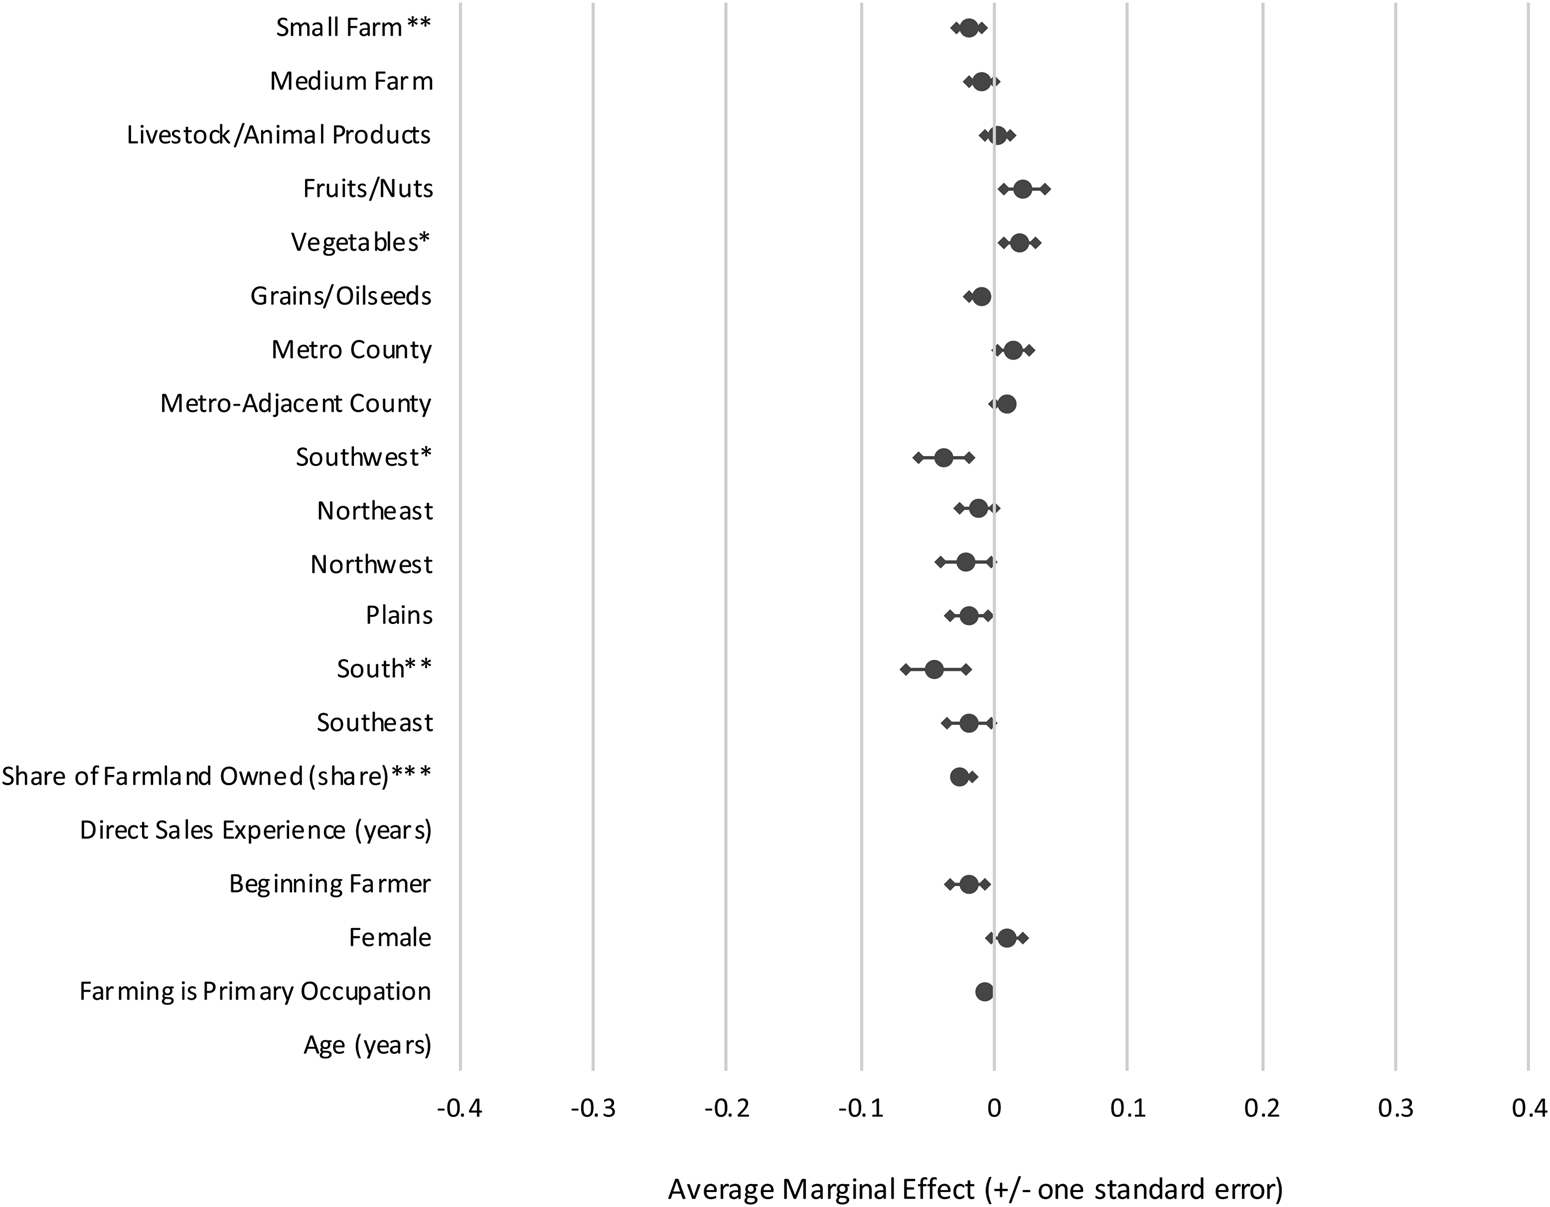
Relationship of characteristics to probability of selling directly to intermediaries.

Relationship of characteristics to probability of selling directly to consumers only.

Relationship of characteristics to probability of selling directly to consumers and retailers.

Relationship of characteristics to probability of selling directly to intermediaries only.

Relationship of characteristics to probability of selling directly to consumers and intermediaries.

Relationship of characteristics to probability of selling directly to retailers only.

Relationship of characteristics to probability of selling directly in other channel combinations.

Participation in four direct marketing channels (Binary logits)

a Produces and markets (via any channel, direct or otherwise).
*p < 0.10, **p < 0.05, ***p < 0.01.
Participation in five most common direct marketing channel combinations (Multinomial logit)
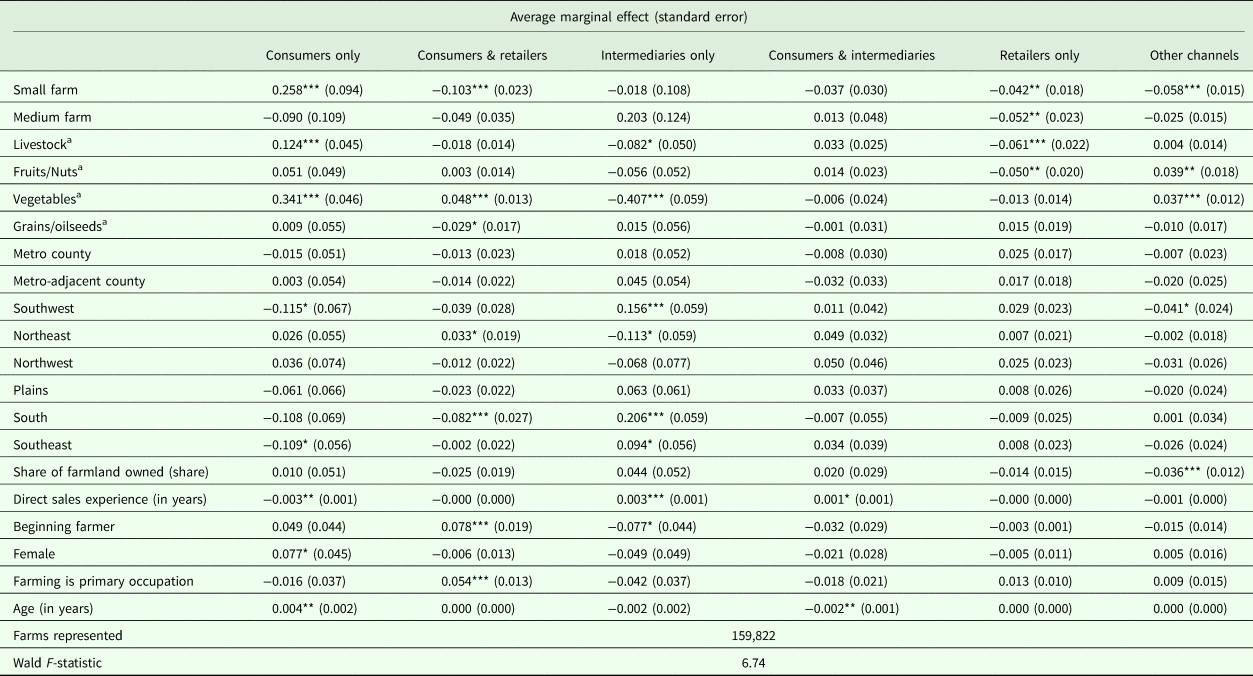
a Produces and markets (via any channel, direct or otherwise).
*p < 0.10, **p < 0.05, ***p < 0.01.
Farm size
As expected, we find that small farms are significantly more likely to sell to consumers only; on average the probability of selling directly to consumers only is 25.8 percentage points higher for small farms than for large farms (Table 3 and Fig. 5). However, in Table 2 and Figure 1 we see no significant difference in the probability of selling directly to consumers across farm sizes. This result suggests farms of all sizes include direct-to-consumer sales in their marketing portfolio. Even for medium-sized and large farms, selling some portion of their sales directly to consumers may help the farm to maintain its local branding and role in the community, even as they market through other channels.
We also see that small and medium-sized farms are significantly less likely to sell to retailers than large farms; on average the probability of selling directly to retailers is 16.7 percentage points lower for small farms and 11.1 percentage points lower for medium-sized farms relative to large farms (Table 2 and Fig. 2). Small and medium-sized farms are also significantly less likely to sell to retailers only relative to large farms (Table 3 and Fig. 9), and small farms are significantly less likely to sell to both consumers and retailers than large farms (Table 3 and Fig. 6). One reason for this is that small and medium-sized farms may find it more difficult than large farms to maintain the consistent supply of local food, as well as food safety and management standards, that are often required by retailers (Monson et al., Reference Monson, Mainville and Kuminoff2008).
We also find that small farms are significantly less likely to sell directly to institutions; on average the probability of selling directly to institutions is 1.9 percentage points lower for small farms than for large farms (Table 2 and Fig. 3). Although the magnitude of this difference is small, this result is consistent with the research that shows barriers to entry into the direct-to-institution marketing channel. These barriers are likely to be similar to those encountered by small farms trying to sell directly to retailers and may include meeting food safety requirements (Janssen, Reference Janssen2014), vendor bid systems and contracts that lockout local producers (Starr et al., Reference Starr, Card, Benepe, Auld, Lamm, Smith and Wilken2003) and other significant transaction costs (Hardesty, Reference Hardesty2008). Hardesty (Reference Hardesty2008) emphasized the importance of farmer collaboration to increase institutional purchases of local food. Feenstra and Ohmart (Reference Feenstra and Ohmart2012) showed that local brokers, cooperatives and nonprofit-supported distribution operations played a vital role in delivering local food to schools and institutions in a timely manner and assuming the responsibilities and liabilities involved.
That said, it is medium-sized farms—and not small farms—that we find are more likely to sell directly to intermediaries; on average the probability of selling directly to intermediaries is 23.1 percentage points higher for medium-sized farms than for large farms (Table 2 and Fig. 4). Interestingly, the effect is small, negative and not significant for small farms relative to large farms, suggesting that the importance of sales directly to intermediaries is unique to medium-sized farms (Table 2 and Fig. 4). Selling through an intermediary may allow medium-sized farms to lower their transaction costs without having to meet the scale requirements of some buyers. Indeed, Low et al. (Reference Low, Adalja, Beaulieu, Key, Martinez, Melton, Perez, Ralston, Stewart, Suttles, Vogel and Jablonski2015) found that for medium-sized farms, selling through intermediary marketing channels (which included direct-to-retailer, direct-to-institution, direct-to-intermediary in that particular study) generated larger revenues than selling direct to consumers. However, the fact that small farms are not also selling more to intermediaries than large farms suggests a possible area of opportunity, both for intermediaries and for small farms. For all results related to intermediaries and institutions, it should again be noted that USDA NASS has data reliability concerns regarding these two categories but suggested they were appropriate to separate for this estimation.
Farm type
The results shown in Table 2 and Figure 1 confirm our hypothesis that vegetable producers and fruit and nut producers are significantly more likely to sell directly to consumers than farms that do not produce and market these crops. On average the probability of selling directly to consumers is 35.4 percentage points higher for vegetable producers and 11.4 percentage points higher for fruit and nut producers than for farmers that do not produce and market each of these crop types, respectively (Table 2 and Fig. 1). These results are not surprising, as consumers associate direct-to-consumer marketing channels (e.g. farmers markets and CSAs) with fresh produce. Farms producing and selling vegetables are significantly more likely to sell directly to consumers only (Table 3 and Fig. 5) and to both retailers and consumers (Table 3 and Fig. 6) and significantly less likely to sell directly to local intermediaries (Table 2 and Fig. 4, Table 3 and Fig. 7). These results suggest barriers (e.g. product perishability) for vegetable producers wishing to sell to intermediaries and bear further exploration in future research. When choosing a combination of marketing channels, vegetable producers and fruit and nut producers are also significantly more likely to choose marketing combinations other than the five most common (Table 3 and Fig. 10).
We also find that farms raising and selling livestock and animal products are significantly more likely to sell directly to consumers and significantly less likely to sell directly to retailers than farms who do not sell these products; on average the probability of selling directly to consumers is 12.7 percentage points higher and the probability of selling directly to retailers is 8.6 percentage points lower for livestock/animal product producers relative to producers who do not produce these products (Table 2, Figs. 1 and 2). Livestock and animal product producers are also significantly more likely to sell to consumers only (Table 3 and Fig. 5) and significantly less likely to sell to retailers only than farmers who do not produce these goods (Table 3 and Fig. 9). Livestock producers may have significant challenges selling directly to retailers due to issues related to scale, food safety, food processing and other product requirements. For example, some retailers will buy a whole carcass (e.g. larger grocers with butcher shops), while others (e.g. restaurants) may insist on case-ready cuts. Meeting retailer specifications may require additional expertise and significant investments in specialized equipment, such as packaging machines (Gwin et al., Reference Gwin, Thiboumery and Stillman2013).
Farm location
Contrary to our hypothesis, we find no evidence that farms located in metro and metro-adjacent counties are more likely to sell directly to consumers relative to farms located in remote rural counties (Table 2 and Fig. 1). Previous studies have shown that urban location increases income from direct sales (Gale, Reference Gale1997; Govindasamy et al., Reference Govindasamy, Hossain and Adelaja1999; Brown et al., Reference Brown, Gandee and D'Souza2006) and have suggested that the availability of farmland, cost and quality of labor may drive location decisions of farms with direct sales (Low and Vogel, Reference Low and Vogel2011). However, we find that the level of urbanization (as measured by the rural-urban continuum variables noted above) does not impact farmers’ decisions to participate in any of the direct marketing channels. Our results suggest that as the market for local foods has matured, participation in direct sales may no longer be determined by proximity to cities. Another possible reason for this lack of result is that our categorization of rural and urban regions (using RUCC) is not a very good metric for urbanization. However, this is a very commonly-used metric in the related literature (see, e.g. Ahearn and Sterns Reference Ahearn and Sterns2013; Bauman et al., Reference Bauman, Thilmany and Jablonski2018, or Low and Vogel Reference Low and Vogel2011).
Relative to farms located in the Midwest, farms in the South, Southwest and Southeast are significantly less likely to participate in direct sales to consumers; on average the probability of a farm selling directly to consumers is 23.6 percentage points lower for farms located in the South, 21.6 percentage points lower for farms located in the Southwest and 13.7 percentage point lower for farms in the Southeast relative to farms in the Midwest (Table 2 and Fig. 1). Farms located in the South are also significantly less likely to sell directly to retailers than farms located in the Midwest (Table 2 and Fig. 2). However, we do find that farms located in the South, Southwest, Southeast and Plains are significantly more likely to sell directly to local intermediaries (Table 2 and Fig. 4) and farms in several of these regions are also significantly more likely to sell directly to intermediaries only (Table 3 and Fig. 7). These regional differences may be due to the differing structure of supply chains (King et al., Reference King, Hand, DiGiacomo, Clancy, Gómez, Hardesty, Lev and McLaughlin2010) and lower population density (Timmons and Wang, Reference Timmons and Wang2010) in the noted regions.
Farmer characteristics
Turning to farmer characteristics, we find that beginning farmers (farmers with 10 or fewer years of experience) are significantly more likely to sell directly to consumers than experienced farmers, as expected; on average the probability of selling directly to consumers is 11.3 percentage points higher for a beginning farmer than for an experienced farmer (Table 2 and Fig. 1). Unexpectedly, we also find that beginning farmers are significantly more likely to sell to retailers; on average the probability of selling directly to retailers is 7.7 percentage points higher for a beginning farmer than for an experienced farmer (Table 2 and Fig. 2). Similarly, we see that beginning farmers are significantly more likely to sell directly to both retailers and consumers than more experienced farmers (Table 3 and Fig. 6). These unexpected results relating to retailers could be due to beginning farmers’ relationships with restaurants; restaurants are included with grocers in the retail category. Beginning farmers are also significantly less likely to sell directly to intermediaries, as expected (Table 2 and Fig. 4). This result supports the idea that barriers to entry in the intermediary channel may be high for beginning farmers.
Several other interesting results emerged among our control variables. First, farms that have more experience selling directly are significantly more likely to sell directly to intermediaries and less likely to sell directly to consumers, although the magnitude of these effects is small; on average, the probability of selling directly to intermediaries is 4 percentage points higher for a farm with ten additional years selling directly (Table 2 and Fig. 4). This result suggests that selling to intermediaries may present a more stable marketing channel in the long run. However, the age of the operator works in the opposite direction; on average, the probability of selling directly to intermediaries is 4 percentage points lower for a farm operator with ten additional years of age (Table 2 and Fig. 4). In addition, farmers who farm as a primary occupation are significantly more likely to sell to retailers (Table 2 and Fig. 2). These farmers are likely to have more time than farmers who work other jobs to develop the necessary relationships to work with retailers.
Conclusions
In this work, we consider the farm and farmer characteristics related to US farmers’ direct marketing channel choices using binary and multinomial logit models. Some of our results corroborate previous findings related to direct marketing strategies by US farmers. For example, we find that farm size has a strong relationship to direct marketing channel choice, with small farms being more likely to sell directly to consumers and medium-sized farms more likely to sell to intermediaries, and both less likely to sell to retailers (including restaurants) than large farms. Also, in line with previous literature, we find that beginning farmers are more likely to participate in direct-to-consumer channels. However, we also find that beginning farmers are more likely to participate in retail channels, which was an unexpected and interesting result. Other interesting and unexpected results include our finding farmers producing and marketing livestock sell considerably less to retailers, while farmers producing and selling vegetables sell considerably less to intermediaries. In both cases, our results suggest potential barriers to producers, potentially due to issues such as food safety, perishability and economies of scale. Also surprisingly, we find no relationship between direct marketing channel choice and proximity to urban centers.
As the landscape of direct marketing changes, it is important for food system stakeholders to understand those changes so they can make informed decisions about marketing strategies and local food system investments. In this work, we contribute to this effort by providing an updated analysis of factors relating to direct-to-consumer marketing channel choice. We also identify key factors relating to the choice of other direct marketing channels that were somewhat surprising. Further study will be needed to better understand the drivers of these more surprising relationships and their implications for local food system stakeholders.
Author ORCIDs
Zoë T. Plakias, 0000-0002-7721-1055; Iryna Demko, 0000-0003-2458-2183; Ani L. Katchova, 0000-0002-7307-4073.
Acknowledgments
The authors are grateful to staff at the USDA Economic Research Service and National Agricultural Statistics Service for their assistance in accessing the farm-level survey data. In addition, author Dr. Iryna Demko is grateful to Yvonne Keller and Lydia Oberholtzer for their comments on an earlier version of the manuscript. This study was supported in part by NIFA Hatch Project (No. OHO01427-MRF, PI: Plakias).


 Open access