Obesity has emerged as one of the most prevalent global health problems over the last 30 years because of its association with comorbidities such as chronic inflammations, type 2 diabetes, cardiovascular disorders and certain types of cancer( Reference O’Neill and O’Driscoll 1 ). Whilst the aetiology of obesity is multifactorial, there is a growing recognition that high energy density diets (containing high levels of fat and sugar) are major contributors to long-term imbalance between energy intake and energy expenditure( Reference Hu, Wang and Yang 2 ), with comparable effects seen in rodents including mice such as the C57BL/6J strain. Indeed, energy-dense diets increase intestinal energy absorption and fat storage in adipose tissue( Reference Galgani and Ravussin 3 ).
In addition, these diets impair the hypothalamic regulation of hormones involved in the control of energy balance( Reference Wang, Ge and Cheng 4 ). Thus, one approach to reducing weight gain or causing weight loss would be to devise interventions that affect the cross-talk between the gut, adipose tissue and the hypothalamic mechanisms regulating energy balance.
Nutrient digestion and absorption provides the necessary energy for the survival of living organisms, and the gastrointestinal tract has evolved to optimise these processes( Reference Goodman 5 ). In particular, nutrient absorption takes place in the duodenum, jejunum and ileum, through paracellular movements or by uptake through specific nutrient transporters, which are able to transport fats (e.g. fatty acid transporter protein 4 (FATP4); cluster differentiation 36 (CD36)), sugars (i.e. GLUT2; sodium-glucose transporter protein 1 (SGLT1)) and amino acids (i.e. L-type amino acid transporter 4; neural amino acid transporter 1 (B0AT1)) into the bloodstream( Reference Ferraris and Vinnakota 6 ).
The complexity of nutrient absorption is further highlighted by the network of diverse intrinsic and extrinsic factors regulating this process. With regard to intrinsic factors, it is notable that deficiency of the anoretic hormone leptin in mice( Reference Ferraris and Vinnakota 6 ) increases energy ingestion leading to a greater adiposity and weight gain, coupled with associated hypothalamic–neuropeptide changes and chronic intestinal inflammation( Reference Monteiro-Sepulveda, Touch and Mendes-Sa 7 ). Similarly, targeted deletion of the gene encoding GLUT2, a key intestinal glucose transporter, also increases energy intake( Reference Schmitt, Aranias and Viel 8 ).
Of the extrinsic factors, the gut microbiota plays a key role in harvesting energy from ingested food and providing it for host metabolism( Reference Cani 9 – Reference van de Wouw, Schellekens and Dinan 12 ). Hence, germ-free mice are protected against obesity despite consuming more energy content than control mice, but this phenotype is reverted after faecal microbiota transplantation from conventionally raised mice( Reference Backhed, Ding and Wang 13 ). Using gnotobiotic mice fed a high-fat diet (HFD) or low-fat diet (LFD), respectively, a role has been suggested for Clostridium ramosum in the upregulation of body fat deposition promoting factors( Reference Woting, Pfeiffer and Loh 14 ). These data, coupled with the observed impact of gut microbiota on brain formation, including hypothalamic micro-structures( Reference Fernandez-Real, Serino and Blasco 15 ), provide novel avenues for modulating the activity of the intestine, adipose tissue and hypothalamus, involving microorganisms.
α-Lactalbumin (LAB) is a globular protein well known as a source of peptides having beneficial properties such as antioxidant bioactivity and immune modulation ability( Reference Mburu, Chelulei and Wei 16 ). It constitutes around 25 % of the bovine milk whey proteins( Reference Mburu, Chelulei and Wei 16 ). Whey can be extracted during the manufacture of cheese and also comprises other protein types, varying in abundances, including β-lactoglobulin (approximately 65%), bovine serum albumin (BSA, approximately 8 %), lactoperoxidase (0·25–0·5 %), lactoferrin (Lf, approximately 1 %) as well as other minor proteins such as immunogloblulins (<1 %)( Reference Morr and Ha 17 ). Recently, whey proteins have been considered as a potential dietary solution to obesity in light of the discovery that these proteins, as an isolate (WPI) or concentrate, acutely increase the production of hormones that are involved in satiety in both humans and rodents( Reference Chungchunlam, Henare and Ganesh 18 , Reference Zhou, Keenan and Losso 19 ). Moreover, intake of whey proteins in humans reduces fat absorption( Reference Stanstrup, Schou and Holmer-Jensen 20 ). This effect might be attributed to an altered composition of the gut microbiota involved in energy harvest, since other studies have shown that dietary whey proteins can influence the composition of the gut microbiota( Reference McAllan, Skuse and Cotter 21 – Reference Sprong, Schonewille and van der Meer 24 ). Indeed, we showed that WPI reduced the proportion of Firmicutes in the mouse gut microbiome( Reference Nilaweera, Cabrera-Rubio and Speakman 22 ), and this was accompanied by a reduction in the expression of intestinal nutrient transporters, specifically glut2 and fatp4. In addition, we showed that WPI reduced epididymal white adipose tissue (eWAT) weight and the overall body weight gain. Consistent with changes in the gut, WPI increased energy intake, which was reflected in the altered hypothalamic gene expression of neuropeptides, namely, proopiomelanocortin (pomc), neuropeptide Y (npy) and ghrelin( Reference Nilaweera, Cabrera-Rubio and Speakman 22 ).
While these data suggest a modulatory effect of WPI on the gut microbiome, hypothalamus and adipose tissue, it was not clear whether the changes in energy intake were driven directly from the gut/hypothalamus axis or were secondary to the changes in adiposity. Indeed, previously it was shown that specific whey proteins, such as BSA and Lf, influenced in a different way the body weight, energy intake and plasma leptin level( Reference McManus, Korpela and Speakman 25 , Reference McManus, Korpela and O’Connor 26 ).
Given that LAB has been shown to affect the energy balance but the underlying mechanism is still unclear( Reference Zapata, Singh and Pezeshki 27 , Reference Gao, Song and Du 28 ), in the current study we sought to further investigate the link established previously between gut–hypothalamic–adipose control of energy balance using LAB as the main protein source. The protein was given in a physiological amount (i.e. 20 % energy content) during HFD-induced weight gain phase in the C57BL/6J strain of mice, which was used as the model for humans. LAB was introduced early in development (5 weeks of age), given the WPI specificity to influence weight gain during this period( Reference Tranberg, Hellgren and Lykkesfeldt 29 ). As the control, we fed mice a LFD or HFD containing the same physiological amount of a non-whey milk protein, casein.
Methods
Experimental strategy
The in vivo experiments were approved by the University College Cork Animal Experimentation Ethics Committee (2011/005) and were licenced under the European Directive 2010/63/EU. Twenty-four C57BL/6J 3-week-old male-specific pathogen-free mice were purchased commercially (Harlan) and were singly housed in each cage with enrichment (Litaspen 8/20 and alpha-dry Plus bedding; LBS-Biotech, UK) on a 12 h light–12 h dark cycle with humidity maintained at 45–60 % and temperature between 19 and 22°C. The mice had ad libitum access to food and water throughout the study unless otherwise stated. The health of the animals and the environment parameters were checked and recorded daily. No adverse effects were observed by the dietary interventions or procedures detailed below. The mice were provided with a diet containing 10 % (low) fat and 20 % casein (LFD-CAS; #D12450Bi; Research Diets) (all percentage values by energy) during the initial 2-week acclimatisation period and then weight-matched mice were switched to a 45 % (high) fat diet containing either 20 % casein (HFD-CAS; #D12451i) or LAB (HFD-LAB; #D13081701i) (n 8 per group). The controls continued to receive LFD-CAS (n 8). The diets were OpenSource and were made by Research Diets, with LAB sourced from Sigma (diets composition details, online Supplementary Table S1). Body weight and food intake were measured weekly. The latter was converted to gross energy intake using the dietary energy density of the diets (HFD=19·79 kJ/g and LFD=16·11 kJ/g; Research Diets).
During weeks 8 and 9, mice were placed in TSE PhenoMaster cages for 3 d to measure metabolic parameters, specifically, oxygen consumption (ml/h, VO2), carbon dioxide production (ml/h, VCO2), RER (VCO2/VO2) and locomotor activity (X, Y and Z planes). The data were collected in the final 24 h of the housing period as detailed previously( Reference McAllan, Keane and Schellekens 30 ).
At week 10, mice were fasted for 10–12 h commencing at 22.00 hours in the dark phase, then anaesthetised (100 mg/kg ketamine and 10 mg/kg xylazine) and blood samples were collected. Mice were killed by cervical dislocation and tissues were collected and samples were stored at –80°C for subsequent analysis. The length of the small intestine and the weight of all the tissues were recorded on fresh tissues before snap freezing them.
DNA sequencing
Faecal samples were collected directly from the colon, homogenised and processed using mechanical and chemical lysis. The 16S rRNA gene (V3–V4 region) was amplified with universal primers (PCR1 forward and reverse primer as to the Illumina 16S Metagenomic Sequencing Protocol) that facilitated sequencing on the Illumina MiSeq platform (2×250 bp paired-end reads; V3 sequencing chemistry). The fastq files were filtered on the basis of quality (removal of low quality nucleotides at the 3′ end) and length (removal of sequences with <200 nt) with prinseq( Reference Schmieder and Edwards 31 ), and paired reads with a minimum overlap of 20 bp were joined using Fastq-join( Reference Aronesty 32 ).
Sequences were clustered (97 % identity) to obtain operative taxonomic units (OTU) using closed-reference usearch version 7.0 algorithm( Reference Edgar 33 ) and chimeric OTU were removed using the gold database. The taxonomic assignment of OTU was obtained using the ribosomal database project( Reference Cole, Wang and Fish 34 ). α- and β-diversities were determined using QIIME( Reference Caporaso, Kuczynski and Stombaugh 35 ), and additional analyses were performed with the R package phyloseq( Reference McMurdie and Holmes 36 ).
To identify chow-associated microbes, total DNA was extracted from approximately 10 g of chow containing 20 % fat and 20 % casein (LFD-CAS; #D17052702; Research Diets), and approximately 10 g of chow containing 40 % fat and 20% casein (HFD-CAS; #D17052705; Research Diets) using the Gene All Extragene SoilSV kit (GeneAll). The Qubit high-sensitivity DNA assay (Bio-Sciences Limited) was used for accurate quantification of the total DNA. Whole-metagenome shotgun library preparation was performed following the Nextera XT DNA library preparation guide from Illumina( Reference Clooney, Fouhy and Sleator 37 ) and sequencing was performed using the Illumina NextSeq 500 with a v2 NextSeq 500/550 high-output reagent kit (300 cycles).
The raw shotgun metagenomic sequences were filtered on the basis of quality (removal of low-quality nucleotides at the 3′ end and application of sliding window trimming, cutting once the average quality within the window falls below a threshold quality of 20 bp) and length (removal of sequences of <200 nt) with prinseq( Reference Schmieder and Edwards 31 ). The filtered sequences were then converted to bam files using SAMtools( Reference Li, Handsaker and Wysoker 38 ), and duplicate reads were subsequently removed using Picard tools (https://github.com/broadinstitute/picard). The quality of the sequences was tested using SAMtools in combination with Picard Tools, removing the low-quality sequences. Taxonimic analysis was performed using Kaiju( Reference Menzel, Ng and Krogh 39 ).
Gene expression
The small intestine samples, stored at –80°C, were initially immersed in a RNAlater-Ice frozen tissue transition solution and stored at –20°C, according to the instructions of the manufacturer (Ambion). This step allows untangling of the intestine while preserving the integrity of the RNA, so that tissue samples, corresponding to the ileum (1 cm from the distal end of the small intestine) and jejunum (the central part of the small intestine), could be cut.
Total RNA was extracted from the intestinal samples and hypothalamic blocks using RNeasy Minikit and QIAshredder columns (Qiagen), and from eWAT and subcutaneous white adipose tissue (sWAT) using QIAzol Lysis Reagent (Qiagen). The extracted RNA was treated with DNase (Qiagen). Complementary DNA was synthetised from 600 ng total RNA using Superscript™ II reverse transcriptase kit (Life Technologies) and subjected to real-time PCR (Roche) using SYBR Green Select Master Mix (Roche) as detailed before(
Reference McAllan, Speakman and Cryan
40
). The gene expression was calculated using
 $$2^{{{\minus}\Delta \Delta C_{{\rm p}} }} $$
and normalised against the reference gene β-actin (intestine and adipose tissue) and ywhaz (i.e. tyrosine 3-monoxygenase/tryptophan 5-monoxygenase activation protein, zeta polypeptide; hypothalamus). The sequence of the primers can be found elsewhere(
Reference McManus, Korpela and Speakman
25
,
Reference McAllan, Keane and Schellekens
30
,
Reference McAllan, Speakman and Cryan
40
).
$$2^{{{\minus}\Delta \Delta C_{{\rm p}} }} $$
and normalised against the reference gene β-actin (intestine and adipose tissue) and ywhaz (i.e. tyrosine 3-monoxygenase/tryptophan 5-monoxygenase activation protein, zeta polypeptide; hypothalamus). The sequence of the primers can be found elsewhere(
Reference McManus, Korpela and Speakman
25
,
Reference McAllan, Keane and Schellekens
30
,
Reference McAllan, Speakman and Cryan
40
).
Plasma leptin, glucose and TAG levels
Plasma leptin and glucose levels were determined using Mouse Leptin ELISA kit (Crystal Chem) and Mouse Glucose Assay (Crystal Chem), respectively. TAG level in the plasma was measured using Triglyceride Quantification Assay kit (Abcam).
Statistical analysis
For power calculation, the CV was measured using data (body weight gain) from a previous study( Reference McAllan, Speakman and Cryan 40 ) and determined to be 8·8 %. For a power of 80 % and a significance level of 5 %, this allows detection of a difference of 14 % with a sample size of eight mice per treatment. Body weight and energy intake differences over 10 weeks were analysed by a two-way repeated-measures ANOVA with Bonferroni’s post hoc pairwise comparisons. Statistical analysis of gene expression, cumulative energy intake, intestine weight/intestine length, plasma leptin and TAG data were performed using one-way ANOVA followed by pairwise comparison using Bonferroni’s post hoc test. Non-parametric data were compared by Kruskal–Wallis ANOVA followed by the Mann–Whitney U test. Data were expressed as means with their standard errors and significance was set at P<0·05 using SPSS software version 24 (IBM Corp.). VO2 and heat production were analysed by ANCOVA (SAS software version 9.3), with total body weight being used as the covariant.
Gut microbiota data were statistically analysed by Adonis and Anosim for β-diversity analysis. ANOVA was used to calculate significance for α-diversity-related analyses (statistical significance established at P<0·05). Statistical differences across multiple samples were determined by Kruskal–Wallis, and false discovery rate (q value) control based on the Benjamini–Hochberg procedure was used to correct for multiple testing with the R statistical package (https://www.r-project.org/). Test for association across all groups of samples was performed through correlation analysis. This was based on Spearman’s rank correlation test by the R function of cor.test, which aimed to examine similar expression association profiles between groups of samples (https://www.r-project.org/package=corrplot) and adjustment of the P value by the Benjamini–Hochberg method. Statistical significance was established at P<0·05 (*), with other ranges, i.e. P<0·01 (**) and P<0·001 (***), also being noted.
Results
α-Lactalbumin increased cumulative energy intake but not weight gain
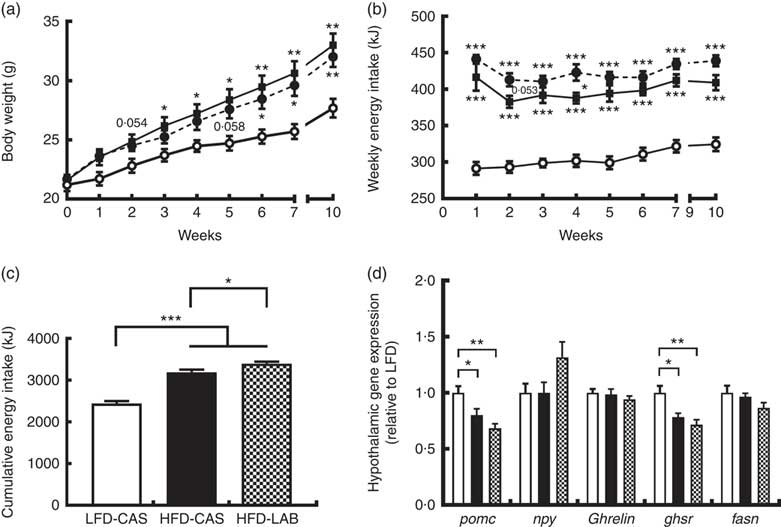
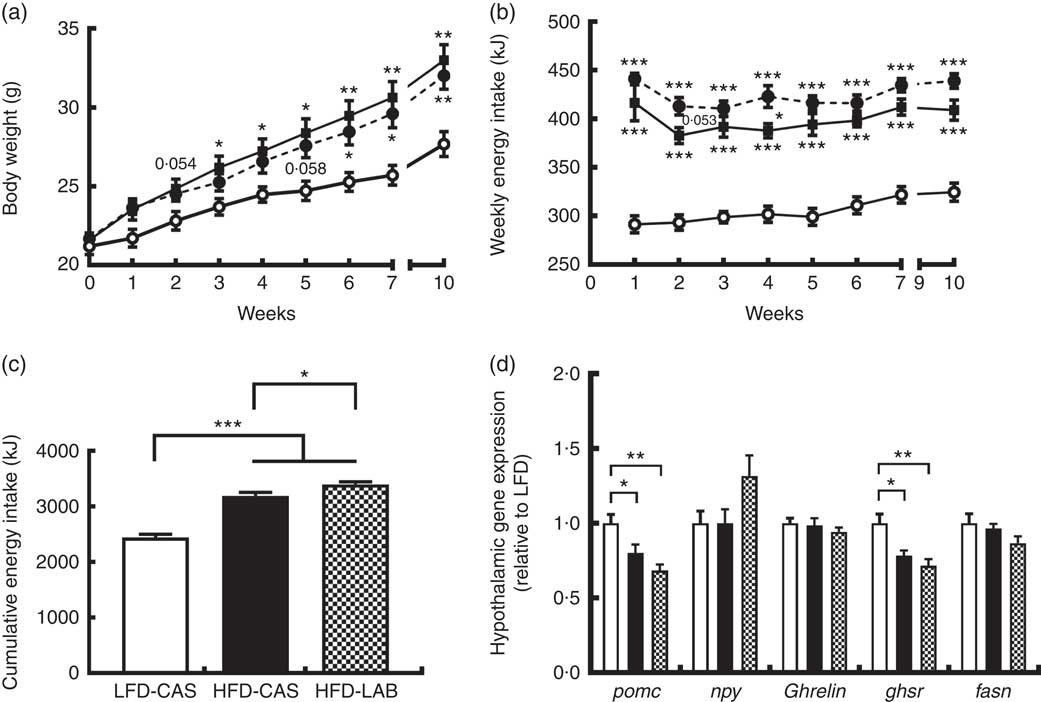
Mice fed HFD-LAB and HFD-CAS had similar body trajectories (Fig. 1(a)) but differed from the LFD-CAS group in the time taken to increase weight. Notably, the HFD-CAS group had a significantly higher weight than LFD-CAS by week 3 (P=0·033), while the weight of the HFD-LAB group did not significantly exceed that of the LFD-CAS group until week 6 (P=0·045) (F 8,160=440·2, P<0·001 for the effect of the time, F 2,20=5·5, P<0·05 for the effect of the diet, F 16,160=11·6, P<0·001 for the effect of the time×diet interaction) (Fig. 1(a)). Despite having similar body weight trajectories, the energy intake of HFD-LAB showed a trend towards an increase at week 2 (P=0·053) (413 (sem 9) kJ in HFD-LAB, 383 (sem 8) kJ in HFD-CAS and 293 (sem 8) kJ in LFD-CAS) and it was higher in HFD-LAB compared with HFD-CAS at week 4 (P=0·037) (F 7,140=7·2, P<0·001 for the effect of the time, F 2,20=81·7, P<0·001 for the effect of the diet, F 14,140=1·3, P>0·05 for the effect of the time×diet interaction) (Fig. 1(b)). The cumulative energy intake of HFD-LAB was significantly increased by week 10 relative to HFD-CAS (P=0·043) (Fig. 1(c)). The difference in energy intake was reflected in the hypothalamic expression of neuropeptides. Notably, at week 10, the expression of the anorexigenic neuropeptide pomc was reduced relative to the LFD-CAS control (P=0·043 compared with HFD-CAS and P=0·001 compared with HFD-LAB), without showing significant difference between the two HFD groups (Fig. 1(d)). While the gene expression for the orexigenic neuropeptides ghrelin and npy remained unchanged, the gene expression of growth hormone secretagogue receptor (ghsr) was reduced in both HFD groups compared with LFD-CAS (P=0·012 relative to HFD-CAS and P=0·001 relative to HFD-LAB) (Fig. 1(d)). Similar to pomc expression, the expression of ghsr between HFD-CAS and HFD-LAB groups did not change. There was no effect due to diet on the expression of the fatty acid synthase (fasn). The mismatch between energy intake and weight gain was unrelated to energy expenditure as both HFD-CAS and HFD-LAB groups had similar 24 h VO2 levels (97 (sem 3) in HFD-LAB, 95 (sem 3) in HFD-CAS and 101 (sem 3) in LFD-CAS; all values in ml/h) and heat production (2·1 (sem 0·05) in HFD-LAB, 2·0 (sem 0·05) in HFD-CAS and 2·2 (sem 0·06) in LFD-CAS; all values in kJ/h), where both parameters were measured during weeks 8 and 9. There were no differences between groups in terms of 24 h locomotor activity (303 (sem 28) in HFD-LAB, 293 (sem 29) in HFD-CAS and 365 (sem 37) in LFD-CAS). While the HFD-CAS and the HFD-LAB groups had similar RER, the corresponding values were lower compared with LFD-CAS (both with P<0·001), consistent with increased fat consumption by former groups (0·816 (sem 0·014) in HFD-LAB and 0·809 (sem 0·014) in HFD-CAS v. 0·916 (sem 0·008) LFD-CAS).
ɑ-Lactalbumin (LAB) affects cumulative energy intake without affecting body weight gain. Impact of a high-fat diet containing casein (HFD-CAS), high-fat diet containing LAB (HFD-LAB) and a low-fat diet containing casein (LFD-CAS) on body weight (a) and energy intake (b) trajectories during a 10-week feeding experiment. Also shown is the cumulative energy intake (c) after 10 weeks. In the hypothalamus was detected the level of expression of some genes involved in energy balance control (d) after 10 weeks of HFD-CAS or HFD-LAB intake relative to the control group LFD-CAS. pomc, Proopiomelanocortin; npy, neuropeptide Y; ghsr, growth hormone secretagogue receptor; fasn, fatty acid synthase. Statistical analysis: groups showing * are significant (* P<0·05, ** P<0·01, *** P<0·001). Cumulative energy intake, one-way ANOVA: F
(2,22)=81·7 (P<0·001 followed by Bonferroni's post hoc test). Hypothalamic gene expression, one-way ANOVA: pomc F
(Reference Hu, Wang and Yang2,Reference Nilaweera, Cabrera-Rubio and Speakman22)=9·2 (P<0·01); npy F
(Reference Hu, Wang and Yang2,Reference Nilaweera, Cabrera-Rubio and Speakman22)=2·8 (P=0·079); ghsR F
(Reference Hu, Wang and Yang2,Reference Nilaweera, Cabrera-Rubio and Speakman22)=9·8 (P<0·01); all followed by Bonferroni's post hoc test except npy. (a, b)
![]() , LFD-CAS;
, LFD-CAS;
![]() , HFD-CAS;
, HFD-CAS;
![]() , HFD-LAB. (c, d)
, HFD-LAB. (c, d)
![]() , LFD-CAS;
, LFD-CAS;
![]() , HFD-CAS;
, HFD-CAS;
![]() , HFD-LAB.
, HFD-LAB.
α-Lactalbumin decreases the intestinal expression of glucose and fatty acid transporters
To find an explanation for the apparent energy loss in the HFD-LAB group, the impact on gastro-intestinal size and related gene expression of several nutrient transporters were measured. The intestinal length was unaffected by the diet (33·2 (sem 0·61) cm in HFD-LAB, 32·4 (sem 0·74) cm in HFD-CAS and 32·9 (sem 0·38) cm in LFD-CAS). While the intestinal weight expressed relative to the length and body weight was similar between HFD-CAS and HFD-LAB groups, this was significantly lower compared with LFD-CAS controls (P=0·039 relative to HFD-CAS and P=0·019 relative to HFD-LAB) (Fig. 2(a)). The data from ANCOVA showed that there was no significant effect of diet on intestinal weight/length when the body weight was used as a covariant (0·024 (sem 0·001) g in HFD-LAB, 0·025 (sem 0·001) g in HFD-CAS and 0·026 (sem 0·001) g in LFD-CAS).
α-Lactalbumin (LAB) influences the expression of nutrient transporters within the small intestine. (a) Effect of LAB on intestine weight normalised by intestine length per 100 g of body weight. Level of gene expression in the ileum (b) and jejunum (c) after 10 weeks of intake of high-fat diet containing casein (HFD-CAS;
![]() ) or high-fat diet containing LAB (HFD-LAB;
) or high-fat diet containing LAB (HFD-LAB;
![]() ) relative to the control low-fat diet containing casein (LFD-CAS;
) relative to the control low-fat diet containing casein (LFD-CAS;
![]() ). sglt1, Sodium-glucose transporter 1; glut2, glucose transporter 2; cd36, cluster of differentiation 36; Slca19, methionine transporter; fatp4, fatty acid transporter 4; lat4, L type amino acid transporter 2. Statistical analysis: groups showing * are significant (* P<0·05, ** P<0·01, *** P<0·001). Intestine weight/intestine length, one-way ANOVA: F
(2,20)=5·5 (P<0·05) followed by Bonferroni's post hoc test. Ileum gene expression: Kruskal–Wallis test for sglt1 (P=0·035) and cd36 (P<0·001). Mann–Whitney U test for sglt1: 1 v. 2 U
(
15
)=9 (P=0·029); 1 v. 3 U
(
14
)=7 (P=0·026). Mann–Whitney U test for cd36: 1 v. 3 U
(
14
)=0 (P=0·001); 2 v. 3 U
(
15
)=0 (P<0·001). One-way ANOVA: glut2 F
(
2,19
)=6·4 (P<0·01). Jejunum gene expression: Kruskal–Wallis test for cd36 (P=0·001) and fatp4 (P=0·016). Mann–Whitney U test for cd36: 1 v. 3 U
(
14
)=0 (P=0·001); 2 v. 3 U
(
15
)=0 (P<0·001). Mann–Whitney U test for fatp4: 1 v. 3 U
(
15
)=0 (P<0·001). One-way ANOVA: lat4 F
(Reference Hu, Wang and Yang2,Reference Stanstrup, Schou and Holmer-Jensen20)=3·6 (P<0·05) followed by Bonferroni's post hoc test.
). sglt1, Sodium-glucose transporter 1; glut2, glucose transporter 2; cd36, cluster of differentiation 36; Slca19, methionine transporter; fatp4, fatty acid transporter 4; lat4, L type amino acid transporter 2. Statistical analysis: groups showing * are significant (* P<0·05, ** P<0·01, *** P<0·001). Intestine weight/intestine length, one-way ANOVA: F
(2,20)=5·5 (P<0·05) followed by Bonferroni's post hoc test. Ileum gene expression: Kruskal–Wallis test for sglt1 (P=0·035) and cd36 (P<0·001). Mann–Whitney U test for sglt1: 1 v. 2 U
(
15
)=9 (P=0·029); 1 v. 3 U
(
14
)=7 (P=0·026). Mann–Whitney U test for cd36: 1 v. 3 U
(
14
)=0 (P=0·001); 2 v. 3 U
(
15
)=0 (P<0·001). One-way ANOVA: glut2 F
(
2,19
)=6·4 (P<0·01). Jejunum gene expression: Kruskal–Wallis test for cd36 (P=0·001) and fatp4 (P=0·016). Mann–Whitney U test for cd36: 1 v. 3 U
(
14
)=0 (P=0·001); 2 v. 3 U
(
15
)=0 (P<0·001). Mann–Whitney U test for fatp4: 1 v. 3 U
(
15
)=0 (P<0·001). One-way ANOVA: lat4 F
(Reference Hu, Wang and Yang2,Reference Stanstrup, Schou and Holmer-Jensen20)=3·6 (P<0·05) followed by Bonferroni's post hoc test.
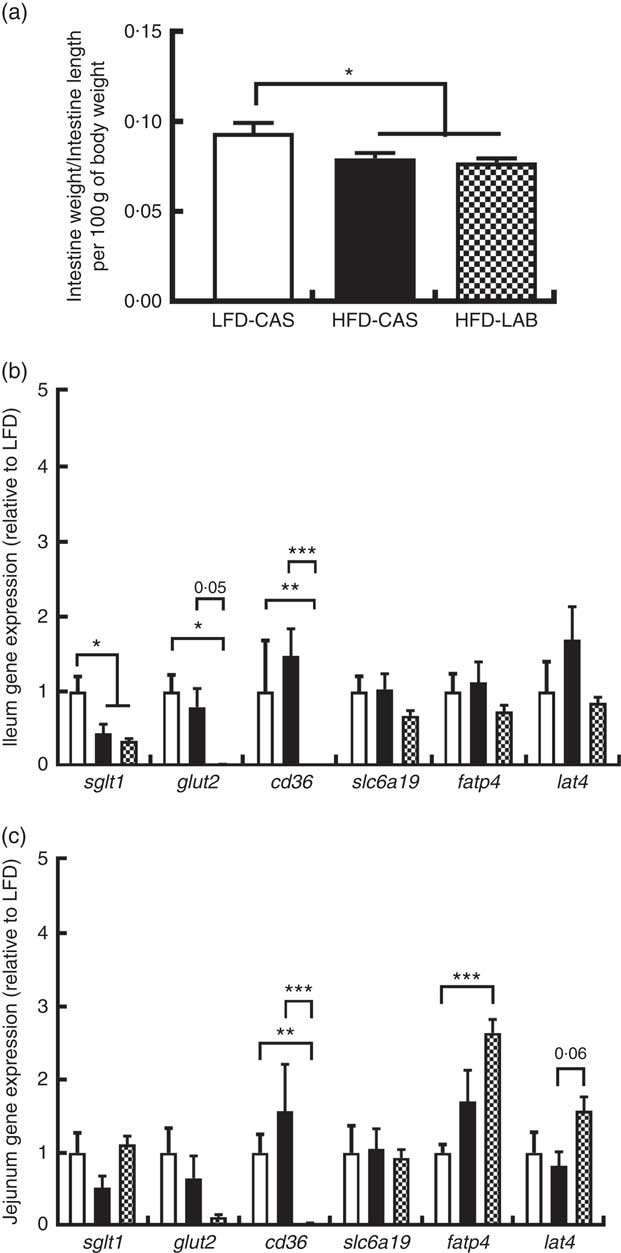
In the ileum, we observed a significant decrease in the expression of the sgl t1 in both high-fat groups compared with the LFD-CAS (P=0·026 relative to HFD-CAS and P=0·029 relative to HFD-LAB), but glut2 gene expression was specifically reduced in the HFD-LAB compared with LFD-CAS (P=0·01), and it showed a trend towards a decrease, at the significance threshold, compared with HFD-CAS (P=0·053) (Fig. 2(b)). While fatp4 gene expression was unaffected in the ileum, the cd36 (an integral membrane protein responsible for importing fatty acids into the cell) was reduced in the HFD-LAB compared with the LFD-CAS (P=0·001) and HFD-CAS (P<0·001) (Fig. 2(b)). The expression of genes encoding the l-amino acid transporter, lat4, and the neutral amino acid transporter slc6a19 was not significantly affected (Fig. 2(b)).
The same gene expression was measured in the jejunum. Similar to the ileum data, cd36 gene expression in the jejunum was reduced in the HFD-LAB group compared with the other two groups (P=0·001 relative to LFD-CAS and P<0·001 relative to HFD-CAS), whereas glut2 expression did not change across the groups (Fig. 2(c)). In addition, in the jejunum, the level of expression of fatp4 was significantly higher in the HFD-LAB group compared with the LFD-CAS control group (P<0·001), and the expression of lat4 showed a trend towards an increase in the HFD-LAB-fed mice relative to HFD-CAS-fed mice (P=0·061) (Fig. 2(c)).
In light of the results obtained for glut2 and cd36 gene expression, we measured the levels of glucose and TAG in the plasma. We observed that the glucose in the plasma of HFD-LAB-fed mice (3·11 (sem 0·23) mg/ml) was not significantly different from HFD-CAS (2·93 (SEM 0·08) mg/ml) but was lower compared with LFD-CAS-fed mice (3·64 (sem 0·08) mg/ml P=0·018). The level of TAG in the HFD-LAB (0·37 (sem 0·04) mg/ml), HFD-CAS (0·35 (sem 0·06) mg/ml) and LFD-CAS (0·36 (sem 0·05) mg/ml) groups was not significantly different.
α-Lactalbumin does not affect leptin gene expression and plasma hormone availability
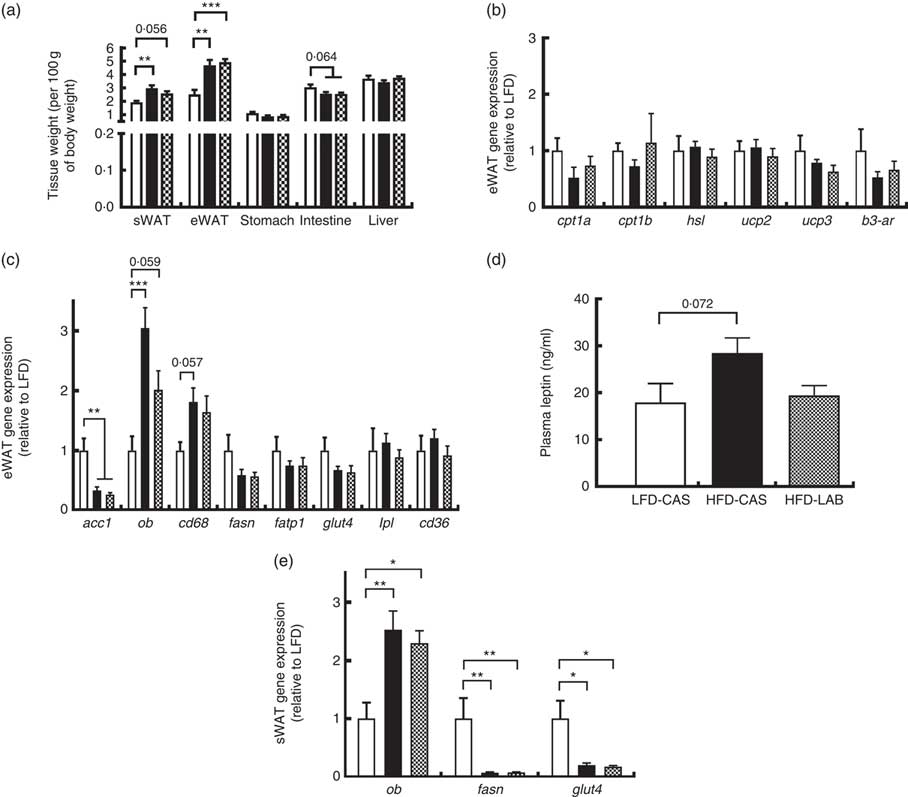
Several tissues were harvested from the mice and their weights were recorded (Fig. 3(a)). The weights of both the sWAT and the eWAT were greater in both the HFD groups compared with the LFD-CAS control group (sWAT: P=0·002 relative to HFD-CAS and P=0·056 relative to HFD-LAB; eWAT: P=0·001 relative to HFD-CAS and P<0·001 relative to HFD-LAB), but no differences were observed in the adipose tissue weights between HFD-CAS and HFD-LAB (Fig. 3(a)). Next, the expression of several genes involved in the catabolism and anabolism of fatty acids in the eWAT and sWAT was measured. In the present study, the expression in the eWAT of genes involved in fatty acid catabolism (carnitine palmoitoyltransferase I, cpt1; uncoupling protein, ucp; hormone-sensitive lipase, hsl; β-3 adrenergic receptor β-3ar) and anabolism (acetyl CoA carboxylase 1, acc1; fasn; lipoprotein lipase, lpl) between HFD-LAB- and HFD-CAS-fed animals did not differ (Fig. 3(b) and (c)). There was also no change in the expression of genes involved in fatty acid transport, such as cd36, fatp1 and glut4 (Fig. 3(c)). However, consistent with the increased adiposity of the high-fat-fed groups, acc1 gene expression was down-regulated in HFD-CAS (P=0·008) and HFD-LAB (P=0·002) compared with LFD-CAS (Fig. 3(c)). In addition, the inflammatory marker, cluster of differentiation 68 (cd68) expression showed a trend towards an increase in the HFD-CAS group compared with the LFD-CAS (P=0·057); but for the HFD-LAB group, the increase was not significant relative to LFD-CAS (Fig. 3(c)). The unchanged adipose tissue weights, coupled with gene expression data in the eWAT, suggest an alternative mechanism of energy loss in the HFD-LAB group. We also measured leptin (ob) gene expression in the eWAT to assess whether there is a specific effect of LAB in leptin regulation, similar to that attributed to the whey protein Lf( Reference McManus, Korpela and O’Connor 26 ).
Effect of ɑ-lactalbumin (LAB) on tissue weights and on the expression of genes involved in the catabolism and anabolism of adipose tissue. (a) Tissue weights normalised by 100 g of body weight. Expression of catabolic (b) and anabolic (c) genes in the epididymal white adipose tissue (eWAT) was investigated after 10 weeks of intake of high-fat diet containing casein (HFD-CAS;
![]() ) or high-fat diet containing LAB (HFD-LAB;
) or high-fat diet containing LAB (HFD-LAB;
![]() ) relative to the control low-fat diet containing casein (LFD-CAS; □). cpt1a and cpt1b, Carnitine palmitoyltransferase I, hsl, hormone-sensitive lipase; ucp2 and ucp3, uncoupling protein; β3-AR, β-3 adrenergic receptor; acc1, acetyl-CoA carboxylase; ob, leptin gene; cd68, cluster of differentiation 68; fasn, fatty acid synthase, fatp1, fatty acid transporter 1; glut4, glucose transporter 4; lpl, lipoprotein lipase; cd36, cluster of differentiation 36. Again after 10 weeks, the level of serum leptin (d) was measured in the three groups. Expression of the genes ob, fasn and glut4 (e) in the subcutaneous white adipose tissue (sWAT). Statistical analysis: groups showing * are significant (* P<0·05, ** P<0·01, *** P<0·001). Tissue weights: one-way ANOVA sWAT F
(Reference Hu, Wang and Yang2,Reference Nilaweera, Cabrera-Rubio and Speakman22)=8·3 (P<0·01); stomach F
(Reference Hu, Wang and Yang2,Reference Nilaweera, Cabrera-Rubio and Speakman22)=3·4 (P=0·051); intestine F
(Reference Hu, Wang and Yang2,Reference Stanstrup, Schou and Holmer-Jensen20)=4 (P<0·05); eWAT F
(Reference Hu, Wang and Yang2,Reference McAllan, Skuse and Cotter21)=12·7 (P<0·001); all followed by Bonferroni's post hoc test. eWAT gene expression (anabolism): Kruskal–Wallis test for acc (P=0·007). Mann–Whitney U test for acc: 1 v. 2 U
(Reference Fernandez-Real, Serino and Blasco15)=4 (P=0·008); 2 v. 3 U
(Reference Fernandez-Real, Serino and Blasco15)=1 (P=0·002). One-way ANOVA ob F
(Reference Hu, Wang and Yang2,Reference Nilaweera, Cabrera-Rubio and Speakman21)=12·6 (P<0·001); cd68 F
(Reference Hu, Wang and Yang2,Reference McAllan, Skuse and Cotter21)=3·5 (P<0·05); both followed by Bonferroni's post hoc test. Plasma leptin: one-way ANOVA F
(Reference Hu, Wang and Yang2,Reference Nilaweera, Cabrera-Rubio and Speakman22)=3·3 (P=0·056). sWAT gene expression: one-way ANOVA ob F
(Reference Hu, Wang and Yang2,Reference McAllan, Skuse and Cotter21)=8·2 (P<0·01) followed by Bonferroni's post hoc test. Kruskal–Wallis test for fasn (P=0·001) and glut4 (P=0·032). Mann–Whitney U test for fasn: 1 v. 2 U
(Reference Fernandez-Real, Serino and Blasco15)=1 (P=0·001); 1 v. 3 U
(Reference Woting, Pfeiffer and Loh14)=0 (P=0·001). Mann–Whitney U test for glut4: 1 v. 2 U
(Reference Fernandez-Real, Serino and Blasco15)=8 (P=0·021); 1 v. 3 U
(Reference Backhed, Ding and Wang13)=6 (P=0·035).
) relative to the control low-fat diet containing casein (LFD-CAS; □). cpt1a and cpt1b, Carnitine palmitoyltransferase I, hsl, hormone-sensitive lipase; ucp2 and ucp3, uncoupling protein; β3-AR, β-3 adrenergic receptor; acc1, acetyl-CoA carboxylase; ob, leptin gene; cd68, cluster of differentiation 68; fasn, fatty acid synthase, fatp1, fatty acid transporter 1; glut4, glucose transporter 4; lpl, lipoprotein lipase; cd36, cluster of differentiation 36. Again after 10 weeks, the level of serum leptin (d) was measured in the three groups. Expression of the genes ob, fasn and glut4 (e) in the subcutaneous white adipose tissue (sWAT). Statistical analysis: groups showing * are significant (* P<0·05, ** P<0·01, *** P<0·001). Tissue weights: one-way ANOVA sWAT F
(Reference Hu, Wang and Yang2,Reference Nilaweera, Cabrera-Rubio and Speakman22)=8·3 (P<0·01); stomach F
(Reference Hu, Wang and Yang2,Reference Nilaweera, Cabrera-Rubio and Speakman22)=3·4 (P=0·051); intestine F
(Reference Hu, Wang and Yang2,Reference Stanstrup, Schou and Holmer-Jensen20)=4 (P<0·05); eWAT F
(Reference Hu, Wang and Yang2,Reference McAllan, Skuse and Cotter21)=12·7 (P<0·001); all followed by Bonferroni's post hoc test. eWAT gene expression (anabolism): Kruskal–Wallis test for acc (P=0·007). Mann–Whitney U test for acc: 1 v. 2 U
(Reference Fernandez-Real, Serino and Blasco15)=4 (P=0·008); 2 v. 3 U
(Reference Fernandez-Real, Serino and Blasco15)=1 (P=0·002). One-way ANOVA ob F
(Reference Hu, Wang and Yang2,Reference Nilaweera, Cabrera-Rubio and Speakman21)=12·6 (P<0·001); cd68 F
(Reference Hu, Wang and Yang2,Reference McAllan, Skuse and Cotter21)=3·5 (P<0·05); both followed by Bonferroni's post hoc test. Plasma leptin: one-way ANOVA F
(Reference Hu, Wang and Yang2,Reference Nilaweera, Cabrera-Rubio and Speakman22)=3·3 (P=0·056). sWAT gene expression: one-way ANOVA ob F
(Reference Hu, Wang and Yang2,Reference McAllan, Skuse and Cotter21)=8·2 (P<0·01) followed by Bonferroni's post hoc test. Kruskal–Wallis test for fasn (P=0·001) and glut4 (P=0·032). Mann–Whitney U test for fasn: 1 v. 2 U
(Reference Fernandez-Real, Serino and Blasco15)=1 (P=0·001); 1 v. 3 U
(Reference Woting, Pfeiffer and Loh14)=0 (P=0·001). Mann–Whitney U test for glut4: 1 v. 2 U
(Reference Fernandez-Real, Serino and Blasco15)=8 (P=0·021); 1 v. 3 U
(Reference Backhed, Ding and Wang13)=6 (P=0·035).
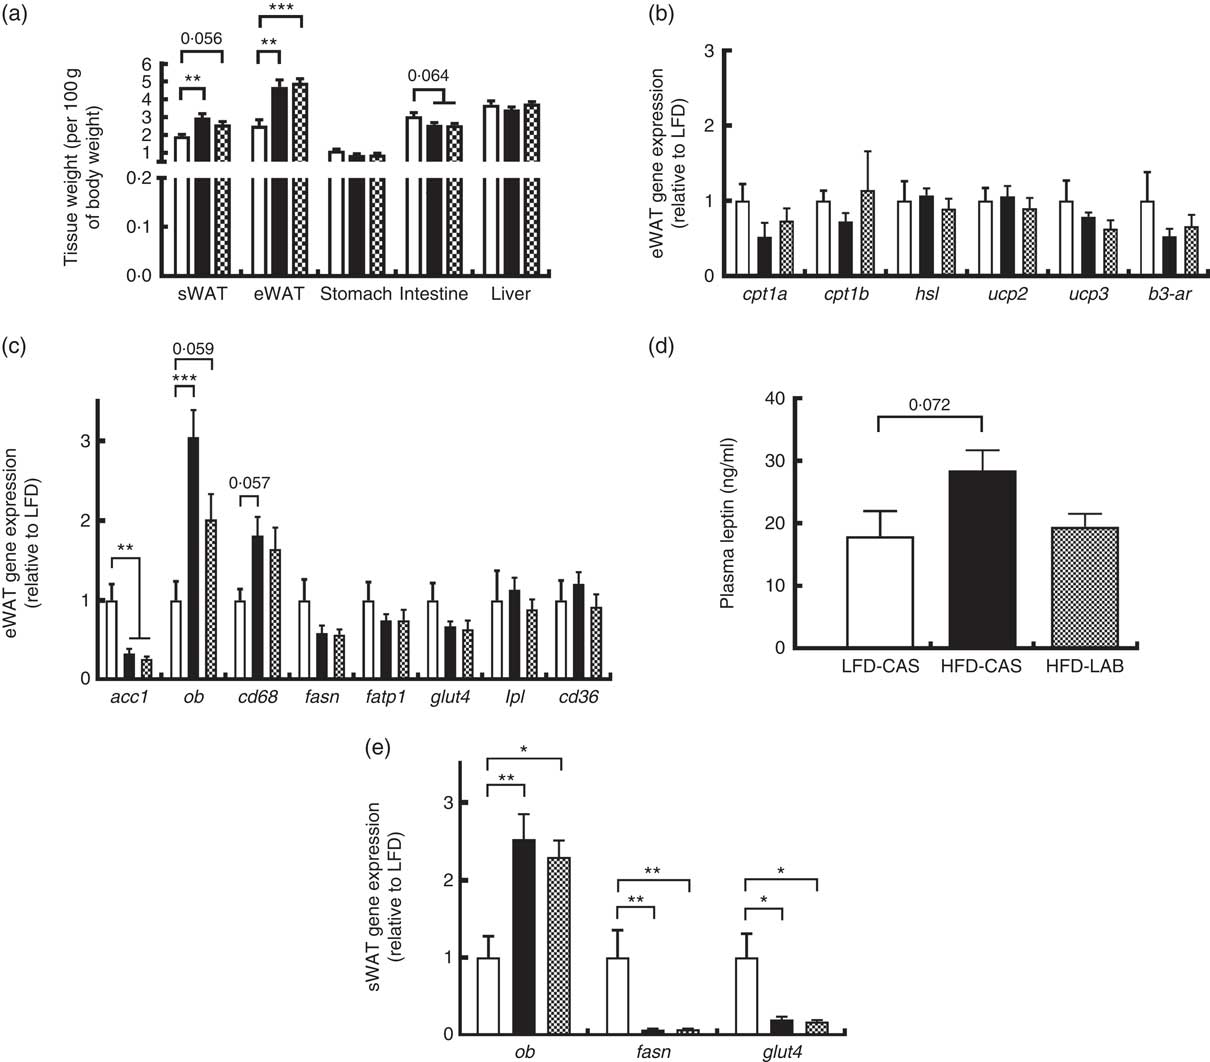
Consistent with the gain in body weight and adipose tissue weight, the expression of the ob gene in the HFD-CAS group increased compared with the control LFD-CAS (P<0·001); and in the HFD-LAB group, it showed a trend towards an increase relative to the LFD control (P=0·059), without showing any differences between the two HFD groups (P=0·08) (Fig. 3(c)).
Similarly, no differences in ob expression were detected in the sWAT between the HFD groups (Fig. 3(e)), and the expression of fasn and glut4 genes were decreased compared with the LFD-CAS group (fasn: P=0·001 relative to HFD-CAS and P=0·001 relative to HFD-LAB; glut4: P=0·021 relative to HFD-CAS and P=0·035 relative to HFD-LAB), with no difference between HFD-CAS and HFD-LAB groups (Fig. 3(e)).
The ob gene expression in eWAT and sWAT was reflected in the plasma availability of leptin, as the presence of LAB in the HFD did not influence the plasma hormone level, relative to HFD-CAS (Fig. 3(d)).
β-Diversity and gut bacterial composition differs due to α-lactalbumin intake
After quality filtration and length trimming, an average of 182 494 high-quality 16S rRNA sequences per sample (i.e. faecal pellets collected from the colon) were obtained across two groups, that is, HFD-CAS (n 8) and HFD-LAB (n 8). Analysis of these data revealed that, while α-diversity did not differ significantly across groups, a significant difference in β-diversity (P=0·002) between the microbiota of the HFD-CAS and HFD-LAB animals was apparent, as represented by distinct clustering upon principal coordinate analysis of all 16S rRNA reads (clustered at 97 % similarity) (Fig. 4(a)).
Impact of ɑ-lactalbumin (LAB) on the composition of the gut microbiota. (a) β-Diversity of the two groups (high-fat diet containing casein (HFD-CAS), red; high-fat diet containing LAB (HFD-LAB), light blue) calculated using principal coordinate analysis. (b) Bar chart representing the phylum-level proportions in faecal samples of mice fed with HFD-CAS and HFD-LAB using the Kruskal–Wallis method, showing Firmicutes (light purple), Bacteroidetes (blue), Proteobacteria (brown), Deferribacteres (dark purple) and other taxa (green). (c) Heatmap illustrating Spearman's rank correlations between the abundance of family- and genus-level gut microbes and cd36 expression, energy intake and glucose transporter 2 (glut2) expression and in both the HFD-CAS and HFD-LAB groups. The P value adjustment was done using the Benjamini–Hochberg method. Groups showing * are significant (* P<0·05, ** P<0·01, *** P<0·001; for statistical analysis, see the Methods section).
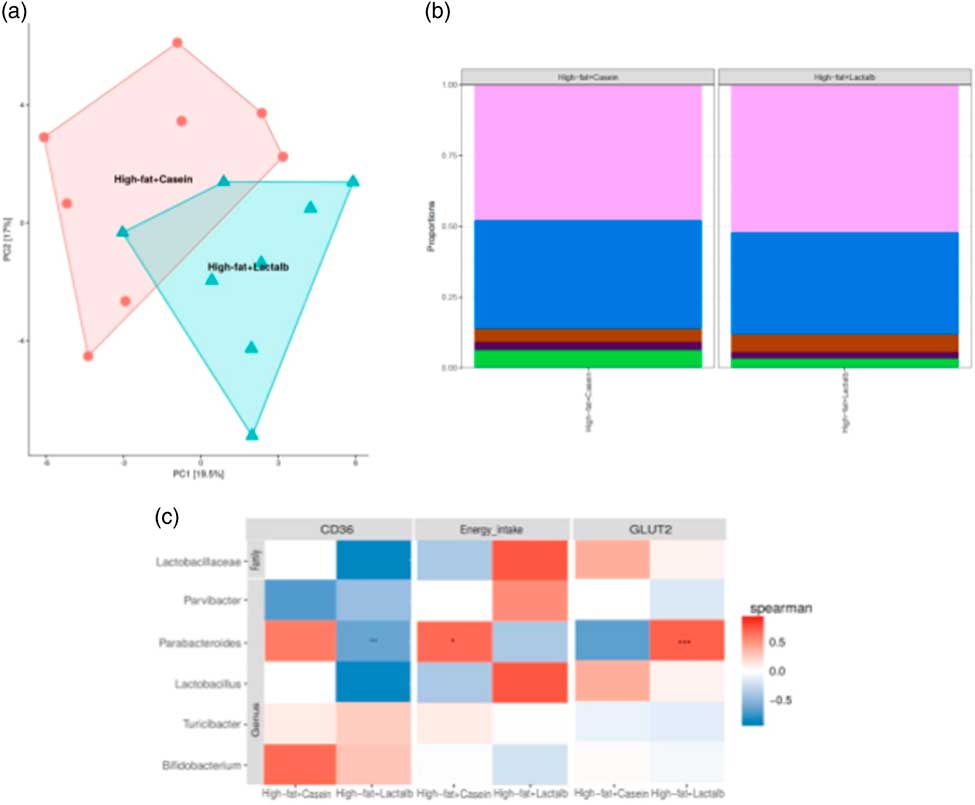
Differences in β-diversity were reflected by taxonomic differences between the HFD-CAS and HFD-LAB groups. At the phylum level, a lower Firmicutes/Bacteroidetes (ratio F/B) was apparent in the HFD-CAS samples (ratio F/B=1·23) relative to the HFD-LAB equivalents (ratio F/B=1·42), though significance was not achieved (Fig. 4(b)). At the family level, two families differed significantly in a diet-associated manner, namely, Lactobacillaceae (higher levels in HFD-LAB samples) and Streptococcaceae (higher proportions in HFD-CAS samples) (Table 1).
Relative abundance (%) of genera and families in which their abundance is significantly higher either in the high-fat diet (HFD)-casein (CAS) group or in the HFD-α-lactalbumin (LAB) group*
* Statistical differences across multiple samples were estimated by the bioinformatics methods ‘false discovery rate’ control based on the Benjamini–Hochberg procedure.
At the genus level, statistically significant differences were apparent in the abundance of Parabacteroides, Bifidobacterium, Parvibacter and Lactobacillus, all of which were present in higher proportions in the HFD-LAB sample groups as well as Lactococcus, Roseburia (P=0·021), Phascolarctobacterium (P=0·018) and Turicibacter, present in higher proportions in the HFD-CAS group (Table 1), were noted.
To assess the possibility that the presence of particular taxa within the chow containing CAS could be responsible for the associated increased proportion of Streptococcaeae in the gut, the microbiota of the CAS-containing chow was analysed. This revealed that the family Streptococcaceae (99·6 and 99·8 % in LFD-CAS and HFD-CAS chow, respectively) and the associated genus, Lactococcus (99·6 and 99·8 % in LFD-CAS and HFD-CAS chow, respectively), were dominant (online supplementary Table S2).
Correlation and independent analyses of the associated profiles were conducted between cd36 and glut2 expression levels, as well as energy intake, against bacterial composition at the genus level. Dairy taxa potentially sourced from the food substrate were not considered. After adjustment for multiple testing (Benjamini–Hochberg-corrected), it was noted that energy intake positively correlated within the group of HFD-CAS samples with Parabacteroides. Within the HFD-LAB group, Parabacteroides negatively correlated with cd36 expression. Glut2 expression was positively correlated with Parabacteroides in HFD-LAB samples (Fig. 4(c)).
Discussion
In this study, we investigated the effects of a specific dietary whey protein (LAB) on intestinal–adipose–hypothalamic control of energy balance. We show that supplementation of LAB in an HFD reduced cd36 and glut2 gene expression in the intestine and was associated with changes in the composition of the gut microbiota. These changes were accompanied by increased cumulative energy ingestion. This, coupled with the fact that targeted deletion of the glut2 gene increases energy intake( Reference Schmitt, Aranias and Viel 8 ), suggests a potential link between gut microbiota, intestinal nutrient transporters and energy intake in response to LAB supplementation. These effects were unrelated to adiposity, as HFD-LAB-fed mice had similar weight gain, adipose tissue weight (both eWAT and sWAT) and plasma TAG.
Previous studies have shown that diets rich in whey proteins cause short-term satiety effects in mice and in humans( Reference Lam, Moughan and Awati 41 – Reference Yu, South and Huang 43 ). Long-term effects on energy balance, however, do not involve the production of satiety hormones( Reference Zhou, Keenan and Losso 19 ). On a background of HFD intake, which has been shown to reduce the brain sensitivity to satiety hormones( Reference Westerterp 44 ), the increased energy intake in mice fed with HFD-CAS compared with LFD and even higher (cumulative) energy intake in HFD-LAB is likely to involve another mechanism of regulation within the adipose tissue–gut–brain connection.
Hypothalamic–neuropeptide expression provided an insight into the regulatory effect of LAB on energy intake. Notably, the expression of the anorexigenic neuropeptide pomc gene expression was significantly lower in the HFD-CAS group in line with the higher energy intake compared with LFD-CAS, similar to that shown in previous studies( Reference McManus, Korpela and O’Connor 26 , Reference McAllan, Keane and Schellekens 30 ). In the HFD-LAB group, while pomc expression remained low, the expression of the orexigenic neuropeptide, npy, did not change across the groups. In contrast, effects on energy intake and on hypothalamic pomc and npy expression were previously found in mice fed with WPI compared with casein in an LFD( Reference Nilaweera, Cabrera-Rubio and Speakman 22 ). In addition, neither the expression of npy nor the cumulative energy intake changed in mice fed a HFD-containing Lf compared with casein( Reference McManus, Korpela and O’Connor 26 ). These data suggest that the whey protein LAB have bioactivity that influences energy intake and that is not mediated by the modulation of hypothalamic neuropeptide genes investigated in this study.
In the present study, while the HFD-CAS group increased weight rapidly, reaching a significant increase relative to LFD values by week 3, it was a further 3 weeks before the mice fed HFD-LAB diet significantly increased body weight relative to LFD-fed animals. The finding that the higher cumulative energy intake was not reflected in the increased body weight in the HFD-LAB group suggests a mechanism must exist to explain the missing energy from the supply. This is consistent with a rat study, which showed that HFD intake with LAB did not change energy intake but decreased adiposity( Reference Zapata, Singh and Pezeshki 27 ). The difference in energy intake between this study and our present study could be related to the fact that the rat study included both egg albumin and LAB as the protein sources in the same diet, whereas we used LAB as the only protein source. This apparent energy loss could be related to lipid oxidation, as a recent study showed that pre-exercise LAB-enriched whey protein meal preserved lipid oxidation alongside rapid delivery of amino acids to tissues for use during exercise, decreasing the adiposity in rats( Reference Bouthegourd, Roseau and Makarios-Lahham 45 ). However, we did not observe this effect in the sedentary mice used in our present study, as RER was similar between HFD-LAB- and HFD-CAS-fed mice, and adipose-specific gene expression linked to lipid catabolism also did not change. This, coupled with the similar sWAT and eWAT weights between HFD-LAB and HFD-CAS groups, suggests that the energy loss in the sedentary mice fed LAB occurs through another mechanism.
It has been shown previously that WPI reduces fat absorption in humans and mice( Reference Tranberg, Hellgren and Lykkesfeldt 29 , Reference Frestedt, Zenk and Kuskowski 46 , Reference Pilvi, Korpela and Huttunen 47 ), and we showed that this effect could be related to decreased ileal fatp4 gene expression( Reference Nilaweera, Cabrera-Rubio and Speakman 22 ). In addition, we also showed a time course reduction of glut2 gene expression in the same region with 17 weeks of WPI intake, and this effect on intestinal gene expression was independent of sucrose content in the diet( Reference Nilaweera, Cabrera-Rubio and Speakman 22 ). In the present study, by feeding a constituent protein of WPI, that is, LAB, to mice for a shorter time period (10 weeks) and by analysing their intestinal gene expression, we now observed a reduction in the expression of sglt in both HFD groups relative to LFD groups. This can be a reflection of higher carbohydrate content in the LFD compared with the two HFD (online Supplementary Table S1). In addition, we show a reduction in glut2 expression in the ileum exposed to HFD, specifically with LAB. The similar effects of LAB and WPI on intestinal glut2 expression in the ileum suggest that LAB may contribute to the bioactivity in WPI influencing glut2 expression; and this bioactivity, whatever it may be, appears to be effective independent of sucrose or fat content in the diet( Reference Nilaweera, Cabrera-Rubio and Speakman 22 ). It was shown that the recruitment of apical GLUT2 in the small intestine is detrimental for health, that is, it leads to an excess of glucose uptake with increased obesity and type 2 diabetes risk( Reference Kellett, Brot-Laroche and Mace 48 ). Our study suggests a potential effect of a diet enriched in LAB in the control of intestinal GLUT-related transcripts that could influence glucose absorption. In another in vitro study, using human intestinal Caco-2 cells, it was shown that polyphenols can also lead to a decrease in the abundance of apical GLUT2( Reference Alzaid, Cheung and Preedy 49 ).
In the present study, we observed also a reduction in cd36 gene expression within both ileum and jejunum. Thus, in combination, these data further support the hypothesis that whey protein LAB seems to affect different components of the mechanism involved in the absorption of glucose and fatty acids within the small intestine, at least at the gene expression level. This would explain, at least in part, the loss of energy that occurs in mice fed LAB. Further analysis aimed to look at the protein level and energy content in the faeces need to be done to confirm this hypothesis. Notably, differences in the level of cd36 and glut2 in the jejunum during LAB intake are in agreement with the fact that the modality and the degree of absorption can change along the intestinal tract. This is due to a different density of nutrient transporters across the three major regions of the small intestine( Reference Spiller 50 ). Based on the effect of LAB in an HFD on the expression of nutrient transporters in the intestinal epithelium and associated energy loss, we speculate that mice compensate by increasing energy intake. In fact, in this study we observed that the levels of glucose and TAG in the plasma did not show significant changes between HFD groups.
Furthermore, the HFD groups consumed more energy than LFD. Since there were no differences in the energy expenditure, the energy surplus has been stored in the adipose tissue. Thus, the lower expression of acc and fasn in the adipose tissue, presumably reflects the reduced necessity to produce fat endogenously when there is an external supply of excess energy. A similar reduction in fasn gene expression has been noted in a previous study( Reference McAllan, Skuse and Cotter 21 ). On the contrary, other studies show that HFD intake increases fasn and acc in the adipose tissue( Reference Jiang, Wang and Proctor 51 – Reference de Oliveira Santana, Lelis and Mendes 53 ). The reasons for these discrepancies are unclear, but we speculate that contributing factors can include different genetic background, age, diet (composition and duration) and different housing environment.
Leptin, a hormone encoded by the ob gene, controls food intake and body weight through an interaction with specific receptors within the hypothalamus( Reference Havel 54 ). In obese humans and in mice fed an obesogenic diet, the adipose tissue mass increases, enhancing significantly the level of serum leptin and leading to metabolic dysfunctions( Reference Myers, Leibel and Seeley 55 ). In addition to the effect on intestinal nutrient transporters and energy intake, WPI in an LFD also reduced eWAT weight and plasma leptin, raising the possibility that the reduced adipose tissue and associated signals, including reduced leptin, could have stimulated the energy intake in mice. However, feeding mice with an HFD containing 20 % of WPI for 8 weeks did not have an effect on plasma leptin levels, compared with mice fed an HFD containing CAS( Reference McAllan, Keane and Schellekens 30 ). On the contrary, HFD containing Lf significantly reduced plasma leptin levels compared with the HFD-CAS controls( Reference McManus, Korpela and O’Connor 26 ). This is another demonstration of the distinct bioactivities that WPI-associated whey proteins can have. In this study, mice fed an HFD containing LAB as the sole protein source showed no significant decrease in plasma leptin, which reflected no change in eWAT and sWAT ob gene expression in the HFD-LAB group, compared to the HFD-CAS group.
We also demonstrated that an HFD containing LAB has a strong influence on the composition of the gut microbiota. β-Diversity data highlighted differences in the clustering of samples from the HFD-LAB group compared with the HFD-CAS group. Corresponding taxonomic analyses were also completed. In particular, we observed a significantly higher proportion of Parabacteroides in the HFD-LAB group, which is notable in that this genus showed a significantly positive correlation with the expression of nutrient transporters. Notably other studies have suggested that Parabacteroides protects the gut from inflammation and there have been reports of the apparent absence of this genus in the digestive tract of people with inflammatory bowel diseases( Reference Zitomersky, Atkinson and Franklin 56 , Reference Noor, Ridgway and Scovell 57 ). We also observed that the genera Bifidobacterium and Lactobacillus are significantly more abundant in the HFD-LAB group. In several human studies, an association was noted between lower levels of Bifidobacterium and obesity( Reference Kalliomaki, Collado and Salminen 58 – Reference Schwiertz, Taras and Schafer 60 ). In addition, higher levels of Bifidobacterium have been linked with an increase in SCFA production, an improvement in gut mucosal barrier and lower intestinal lipopolysaccharide levels( Reference Schwiertz, Taras and Schafer 60 , Reference Pinzone, Celesia and Di Rosa 61 ). Furthermore, specific strains of Bifidobacterium and Lactobacillus spp. have been shown to exhibit anti-obesity effects( Reference Torres-Fuentes, Schellekens and Dinan 62 ). It is worth highlighting the importance of species and strain-level differences as, for example, human and animal studies have highlighted an association between different Lactobacillus species with weight gain or weight protection( Reference Drissi, Merhej and Angelakis 63 , Reference Million, Angelakis and Paul 64 ). For this reason, more accurate in-depth metagenomic analyses, such as shotgun analysis, should be considered in the future to investigate the Lactobacillus species that populate the gut of HFD-LAB-fed mice.
A number of bacterial taxa typically associated with dairy products were also found to be altered in the gut. A recent human feeding study demonstrated that many bacteriophages and Streptococcus and Lactococcus genera, that were significantly altered in individuals whose diet was supplemented with whey proteins, were present in high proportions within the whey protein supplement( Reference Cronin, Barton and Skuse 65 ) and thus presumably originated from the food source. The family Streptococcaceae and the associated genus, Lactococcus, are significantly more abundant in the HFD-CAS group compared with the HFD-LAB group. This is consistent with our previous study that showed that Streptococcaceae proportion increased significantly in the CAS-fed mice compared with the WPI-fed mice( Reference Nilaweera, Cabrera-Rubio and Speakman 22 ). However, this phenomenon is likely a reflection of the high proportion of Streptococcaceae and Lactococcus reads detected after analysis of both LFD-CAS and HFD-CAS chows.
The changes in the gut microbiota in the presence of LAB, coupled with the reduced intestinal expression of genes for nutrient transporters, support and provide a potential scenario for the energy mismatch in the HFD-LAB group compared with the control group. However, the specific mechanism that connects these changes in intestinal transporters’ gene expression, gut microbiota and energy intake in the presence of LAB remains to be elucidated. Further studies are needed to assess whether these effects are seen with different genetic background, sex, housing environment (group v. single housing) and dietary fat content and duration. In conclusion, this present study has demonstrated for the first time, how an HFD containing a specific whey protein, that is, LAB, specifically affects the metabolism, microbiota and nutrient absorption regulation, without preventing weight gain and adipose tissue mass accumulation in mice.
Acknowledgements
The authors thank Fiona Crispie and Laura Finnegan from Teagasc Moorepark Food Research Centre for their assistance in the 16S and shotgun metagenomic. The authors also thank Dr Oleksandr Nychyk (Teagasc Moorepark Food Research Centre) and Sofia Cussotto (UCC, Anatomy and Neuroscience Department) for their help with the statistical analysis.
S. B. was funded under the Teagasc Walsh Fellowship scheme (grant number 2016007). K. N. N. was supported by Teagasc, Ireland, and in part by a research grant from Science Foundation Ireland (SFI) under grant number SFI/16/BBSRC/3389 and BBSRC under the grant number BB/P009875/1 (to K. N. N. and J. R. S).
The author contributions are as follows: K. N. N., P. D. C., J. R. S. and J. F. C. designed the study; S. B. and K. N. N. performed the experiments; R. C.-R. carried out the bioinformatics analyses; S. B., K. N. N. and R. C.-R generated the figures. All authors contributed to the drafting of the manuscript. All the authors approved the final version for submission.
The authors declare that there are no conflicts of interest.
Supplementary material
For supplementary material/s referred to in this article, please visit https://doi.org/10.1017/S0007114519000461