


Word processing is essential for reading comprehension and fluency (Grabe & Yamashita, Reference Grabe and Yamashita2022). Therefore, understanding the cognitive mechanisms involved in word processing during second language (L2) reading is crucial for enhancing students’ L2 proficiency and advancing reading research.
Researchers have often used eye tracking to study how people process words during reading comprehension (Conklin et al., Reference Conklin, Pellicer-Sánchez and Carrol2018; Godfroid, Reference Godfroid2019; Rayner, Reference Rayner2009). Eye fixations on a word are widely regarded as indicators of word processing during reading and are influenced by various factors, including both reader-related and lexical variables. Among lexical features, word length, frequency, and predictability are known to play particularly important roles (Kliegl et al., Reference Kliegl, Grabner, Rolfs and Engbert2004, Reference Kliegl, Nuthmann and Engbert2006; Laurinavichyute et al., Reference Laurinavichyute, Sekerina, Alexeeva, Bagdasaryan and Kliegl2019). Aligned with this theory, studies have shown that these features influence fixations on words in both first language (L1) and L2 reading (e.g., Berzak et al., Reference Berzak, Nakamura, Smith, Weng, Katz, Flynn and Levy2022; Cop et al., Reference Cop, Dirix, Drieghe and Duyck2017; Kuperman et al., Reference Kuperman, Matsuki and Van Dyke2018). However, few L2 studies have explored all three factors together in a single study to determine their relative importance, leaving it unclear which of these features is more critical for word processing during L2 reading. Furthermore, although individual differences, such as reading proficiency, also impact word processing and fixations (Kim et al., Reference Kim, Crossley and Skalicky2018; Rayner, Reference Rayner2009), previous L2 studies have not always considered these factors when investigating the impact of lexical features on fixations (an exception being Cop et al., Reference Cop, Keuleers, Drieghe and Duyck2015, who considered L1 and L2 proficiency). This gap also underscores the need for further research in this area.
Considering these gaps, this study investigated the relative importance of lexical features such as word length, frequency, and predictability in shaping word processing during L2 English reading, as reflected in eye movements. It also examined the influence of reader characteristics and other linguistic features for comparison. To achieve this, we employed a machine-learning approach (i.e., random forest) to estimate the relative importance of different predictors (Matsuki et al., Reference Matsuki, Kuperman and Van Dyke2016; Mizumoto, Reference Mizumoto2022). Additionally, for certain lexical features, we used indices derived from large language models (LLMs), which are commonly employed in natural language processing (NLP) and computational linguistics (e.g., surprisal). This study’s findings will provide theoretical insights into the cognitive mechanisms of L2 reading and eye-movement control in reading, while fostering interdisciplinary interaction between fields such as L2 research and NLP.
Background
Word processing during reading
Word processing and eye movements during reading
Word processing during reading involves recognizing individual words and activating all associated knowledge (e.g., phonological, orthographic, semantic) from long-term memory. In addition, processing words within connected text involves processes such as retrieving word meaning in context and integrating words into the overall text representation. Consequently, contextual factors come into play during word processing in text reading, alongside the inherent characteristics of the words themselves, such as length and frequency (Rayner, Reference Rayner1998, Reference Rayner2009).
Word processing during reading is frequently studied using eye tracking, which provides detailed, real-time processing data under natural reading conditions (Godfroid, Reference Godfroid2019; Rayner, Reference Rayner1998, Reference Rayner2009; Roberts & Siyanova-Chanturia, Reference Roberts and Siyanova-Chanturia2013). Monitoring readers’ eye movements allows us to examine how they process the specific word and the amount of cognitive effort required (Conklin et al., Reference Conklin, Pellicer-Sánchez and Carrol2018). Researchers typically analyze the reader’s fixation count and duration for individual words, as well as whether a word is skipped or regressed from the later context.
Several eye-tracking measures are commonly reported and considered to reflect different stages of word processing (Conklin et al., Reference Conklin, Pellicer-Sánchez and Carrol2018; Godfroid et al., Reference Godfroid2019; Roberts & Siyanova-Chanturia, Reference Roberts and Siyanova-Chanturia2013). For example, skipping reflects a very early stage of word processing, called parafoveal processing (i.e., processing of visual information from words that are near, but not yet directly fixated on, in the reader’s visual field). If a word is processed up to a certain extent within the parafoveal view, it is likely to be skipped. When a word is fixated on, its duration is often divided into early and late measures. First fixation duration (the duration of the initial fixation on a word) and first-pass reading time (the total time spent on a word before leaving it) are often classified as early measures. They reflect the initial stage of word processing, such as word recognition, which involves automatic and unconscious processing. In contrast, total reading time (or total fixation duration), which includes additional eye movements on a word after first-pass reading, is considered a late measure. It reflects the retrieval of word meaning and the integration of the word into context, often influenced by contextual and discourse-level factors alongside lexical features. Furthermore, the frequency and duration of regressions (i.e., backward eye movements) are sometimes referred to as intermediate measures, as they do not neatly fall into either the early or late categories (Conklin et al., Reference Conklin, Pellicer-Sánchez and Carrol2018). These intermediate measures capture initial processing difficulties as well as the corrective actions taken to resolve them. This ability to differentiate between different stages of online reading is one of the greatest advantages of eye-tracking techniques (Roberts & Siyanova-Chanturia, Reference Roberts and Siyanova-Chanturia2013).
Role of lexical features: word length, frequency, and predictability
Word length, frequency, and predictability are three critical factors that significantly influence eye fixations on words during reading (Kliegl et al., Reference Kliegl, Grabner, Rolfs and Engbert2004, Reference Kliegl, Nuthmann and Engbert2006; Laurinavichyute et al., Reference Laurinavichyute, Sekerina, Alexeeva, Bagdasaryan and Kliegl2019). Longer words, less frequently used words, and words that are less predictable from the context are more likely to be fixated on and tend to have longer fixation durations (Rayner, Reference Rayner2009). These factors are often integral to computational models of eye-movement control in reading. For instance, the E-Z Reader 5 (Reichle et al., Reference Reichle, Pollatsek, Fisher and Rayner1998), a serial processing cognitive model, posits that eye-movement control is determined by five processes. Among these, the first two processes—the familiarity check of a word and the completion of lexical access—are both driven by word frequency. Additionally, predictability specifically influences the familiarity check. In its updated version, the E-Z Reader 6 (Reichle et al., Reference Reichle, Rayner and Pollatsek1999), word length plays a key role in predicting fixation positions within words. Similarly, the SWIFT model (Engbert et al., Reference Engbert, Nuthmann, Richter and Kliegl2005), a parallel processing cognitive model, describes a dynamic mechanism in which word length, frequency, and predictability affect processing cost, enabling the model to account for a variety of eye-movement patterns observed in reading experiments.
In empirical studies, word length is typically measured by the number of letters, and frequency is often assessed by the number of occurrences in a corpus. Predictability has been traditionally determined by using human responses from cloze tests. Recently, more advanced methods have been used to assess word predictability, with surprisal being a notable example. Surprisal is defined as the negative logarithm of the probability of a word occurring within its context. A higher surprisal value indicates that the word is less likely to occur in that context, making it more cognitively demanding to process. Research on surprisal has been advanced by the work of Hale (Reference Hale2001) and Levy (Reference Levy2008). Their studies utilized probabilistic language models to calculate surprisal and demonstrated that the value correlates with human reading times and neural activity, supporting its relevance to cognitive processes (see also the review by Frank, Reference Frank2021).
Similar to surprisal, another method used for computationally modeling contextual effects is the semantic relatedness of a word to its context. This is typically evaluated based on word vectors generated by distributional semantic models such as latent semantic analysis (LSA; Landauer et al., Reference Landauer, Foltz and Laham1998) and Word2Vec (Mikolov et al., Reference Mikolov, Chen, Corrado and Dean2013). While LSA and Word2Vec construct semantic representations of words at the type level, newer models based on transformers, such as BERT (Devlin et al., Reference Devlin, Chang, Lee and Toutanova2019), create token-level representations that are more sensitive to context. Salicchi et al. (Reference Salicchi, Chersoni and Lenci2023) demonstrate that, in addition to surprisal (calculated using GPT2-xl), semantic relatedness (determined by BERT) is also a significant predictor of eye-tracking data for L1 English readers.
The influence of each lexical feature on fixation behavior has been demonstrated in separate studies, mostly in L1 reading, but few have examined these factors together in a single study. The study by Kuperman et al. (Reference Kuperman, Matsuki and Van Dyke2018), who targeted L1 English readers, is notable for considering various factors potentially influencing word processing and exploring their relative importance. This study included lexical features such as length, frequency, bigram frequency, surprisal, and position in a passage, along with overall text difficulty. They also considered reader-related factors such as vocabulary size, decoding ability, and phonological awareness. The study used random forest to assess the relative importance of these variables in predicting various eye-tracking measures for individual words (Matsuki et al., Reference Matsuki, Kuperman and Van Dyke2016). Their results revealed that word length was a highly important variable for all eye-tracking measures, except for the first fixation duration. Individual differences were found to be more important in predicting early processing measures (e.g., first fixation duration), whereas lexical and text features are more important in predicting late processing measures (e.g., total fixation duration). These results show some overlap with findings from other studies (e.g., Brysbaert & Vitu, Reference Brysbaert, Vitu and Underwood1998; Kuperman et al., Reference Kuperman, Schroeder and Gnetov2024).
Prior evidence on L2 reading
Differences and similarities between L1 and L2 reading
L1 and L2 reading differ in several key areas, including linguistic features, cognitive factors, and sociocultural influences (Grabe & Yamashita, Reference Grabe and Yamashita2022). According to the BIA+ model (Dijkstra & van Heuven, Reference Dijkstra and van Heuven2002), L1 and L2 words are stored in a shared lexicon and accessed without strict separation by language. However, because L2 words are generally encountered less frequently and with less exposure, their resting-level activations are lower, making recognition of L2 words more effortful (Cop et al., Reference Cop, Dirix, Drieghe and Duyck2017) and resulting in a stronger frequency effect in L2 than L1 (Cop et al., Reference Cop, Keuleers, Drieghe and Duyck2015).
However, Siegelman et al. (Reference Siegelman, Elgort, Brysbaert, Agrawal, Amenta, Arsenijević Mijalković, Chang, Chernova, Chetail, Clarke, Content, Crepaldi, Davaabold, Delgersuren, Deutsch, Dibrova, Drieghe, Filipović Đurđević, Finch and Kuperman2024) emphasized the issue of focusing predominantly on L1-L2 differences in L2 reading research. This focus risks neglecting the shared components of reading mechanisms between L1 and L2, which are just as important both theoretically and practically. Despite the differences outlined above, the fundamental cognitive processes underlying reading (e.g., word recognition, syntactic parsing, meaning proposition encoding, and inferencing) are consistent between L1 and L2, and many predictors of reading performance are shared across these contexts (Grabe & Yamashita, Reference Grabe and Yamashita2022). Supporting this perspective, Kuperman et al. (Reference Kuperman, Siegelman, Schroeder, Acartürk, Alexeeva, Amenta, Bertram, Bonandrini, Brysbaert, Chernova, Da Fonseca, Dirix, Duyck, Fella, Frost, Gattei, Kalaitzi, Lõo, Marelli and Usal2023) found that an individual’s L1 reading behavior explains a significant portion of their L2 English reading behavior, based on their eye-tracking data. Similarly, Siegelman et al. (Reference Siegelman, Elgort, Brysbaert, Agrawal, Amenta, Arsenijević Mijalković, Chang, Chernova, Chetail, Clarke, Content, Crepaldi, Davaabold, Delgersuren, Deutsch, Dibrova, Drieghe, Filipović Đurđević, Finch and Kuperman2024) demonstrated that core reading proficiency skills—such as vocabulary, grammatical knowledge, and listening comprehension—play equally important roles in predicting reading comprehension for both L1 and L2 speakers. These findings suggest that reading proficiency should be viewed as existing on a continuum of skill, ability, and experience, encompassing both L1 and L2 readers. Taken together, the differences between L1 and L2 reading are likely not due to fundamental reading or eye-movement mechanisms but rather to factors such as L2 proficiency, frequency of exposure, and the resulting differences in word processing efficiency.
Word processing and lexical features in L2 reading
The aforementioned link between word processing and lexical features is well-established in L2 reading as well. Kim et al. (Reference Kim, Crossley and Skalicky2018) conducted a comprehensive study that examined word processing in L2 English reading and various lexical features, along with text difficulty and reader characteristics. They found that word frequency, concreteness, and orthographic distinctiveness significantly affected word processing times. Their study also revealed that words in more difficult texts took longer to process, whereas higher proficiency in L2 reading resulted in shorter processing times. Although these findings provide valuable insights, a key limitation of Kim et al.’s study is its reliance on word-by-word presentation to measure word-reading times. This method has often been questioned for not reflecting natural reading conditions (Rayner, Reference Rayner1998), and Kim et al. acknowledged the need for verification through eye-tracking methods.
Several studies have investigated the relationship between L2 word processing and lexical features using eye tracking. For example, Cop et al. (Reference Cop, Dirix, Drieghe and Duyck2017) analyzed data from the Ghent Eye-tracking Corpus (GECO) and reported that word length significantly impacted word skipping in both L1 and L2 English reading. Using the same dataset, Cop et al. (Reference Cop, Keuleers, Drieghe and Duyck2015) demonstrated that word frequency affected single-fixation duration in both L1 and L2 reading, with a stronger effect in L2 compared to L1. Similarly, Nahatame et al. (Reference Nahatame, Ogiso, Kimura and Ushiro2024) found that word length and frequency significantly influenced several fixation duration measures of individual words among L2 English readers.
Schneider (Reference Schneider2023) analyzed the data from Cop et al.’s (Reference Cop, Dirix, Drieghe and Duyck2017) GECO to examine the impact of several lexical features, including word length, bigram surprisal (using the British National Corpus), distance (the distance between the current word and its previous occurrence), and the presence of punctuation. The results of a linear regression model showed that all these factors significantly affected the total fixation duration for individual words in both L1 and L2. Longer and less predictable words, greater distances from their previous occurrence, and the presence of punctuation all led to longer reading times. Furthermore, using a stepwise regression approach, Schneider’s study found the following order of variable importance: word length, punctuation, distance, and surprisal. The low importance of surprisal is consistent with Kuperman et al.’s (Reference Kuperman, Matsuki and Van Dyke2018) findings.
Berzak et al. (Reference Berzak, Nakamura, Smith, Weng, Katz, Flynn and Levy2022) analyzed data from an eye-tracking corpus of five different L1s and L2 English sentence reading (CELER) to investigate the effects of word length, frequency, and surprisal (using GPT2). Their analysis was conducted using a linear mixed-effects model for three fixation duration measures: first fixation duration, gaze duration (also known as first-pass reading time), and total fixation duration. A similar analysis was performed using Cop et al.’s (Reference Cop, Dirix, Drieghe and Duyck2017) GECO dataset as a reference. Their results showed that, with a few exceptions, word length, frequency, and predictability significantly influenced all duration measures in both L1 and L2 across both datasets.
The present study
Previous research has emphasized the importance of lexical features—particularly word length, frequency, and predictability—in predicting word processing during reading, as reflected in eye movements. While some studies have demonstrated the influence of these features on L2 reading as well (e.g., Cop et al., Reference Cop, Keuleers, Drieghe and Duyck2015, Reference Cop, Dirix, Drieghe and Duyck2017), few have simultaneously examined the effects of multiple lexical features, specifically the key factors of word length, frequency, and predictability.
Schneider (Reference Schneider2023) and Berzak et al. (Reference Berzak, Nakamura, Smith, Weng, Katz, Flynn and Levy2022) are exceptions, but their analyses are not comprehensive. Schneider (Reference Schneider2023) investigated the impact of word length and predictability on L2 word processing but did not include word frequency. Berzak et al. (Reference Berzak, Nakamura, Smith, Weng, Katz, Flynn and Levy2022) examined all three key factors and demonstrated their significant effects on L2 word processing; however, their participants read isolated sentences rather than connected text, where different cognitive mechanisms are at play compared to single-sentence reading. In addition, neither study considers other potentially influential factors, such as semantic relatedness, text difficulty, and certain reader variables (Kim et al., Reference Kim, Crossley and Skalicky2018; Kuperman et al., Reference Kuperman, Matsuki and Van Dyke2018; Salicchi et al., Reference Salicchi, Chersoni and Lenci2023). They are also limited by only analyzing fixation duration measures and excluding other important eye-tracking measures, such as skipping and regression.
These previous studies also have constraints concerning the assessment of the variable importance. Berzak et al. (Reference Berzak, Nakamura, Smith, Weng, Katz, Flynn and Levy2022) explored the three key lexical features but did not examine their relative importance. Schneider (Reference Schneider2023) assessed variable importance based on F-values from a stepwise regression approach; however, Mizumoto (Reference Mizumoto2022) recommended random forest, along with Dominance Analysis, as a reliable method for evaluating variable importance. Mizumoto emphasized that “variable importance calculated from random forest is accurate, and correlations among predictors do not greatly influence the estimate of variable importance in random forest, in contrast to multiple regression analysis” (p. 177). Similarly, Matsuki et al. (Reference Matsuki, Kuperman and Van Dyke2016) advocate for the use of random forest in exploratory studies of reading behavior, highlighting its advantages in addressing common statistical challenges, such as model overfitting and multicollinearity.
To overcome the limitations of previous studies, we aim to examine the relative importance of the key lexical features—length, frequency, and predictability—in word processing during L2 English reading, while also considering other lexical, textual, and reader factors. Building on the approach used in Kuperman et al.’s (Reference Kuperman, Matsuki and Van Dyke2018) study on L1 reading, we will build a random forest model to predict eye-movement behavior (e.g., fixation duration, skipping, regressions) on individual words among L2 English readers. The following research questions (RQs) were addressed:
RQ1: Which lexical features are more important for predicting word processing during L2 English reading, based on eye-tracking data?
RQ2: Are there any features more important than lexical ones for predicting word processing during L2 English reading, based on eye-tracking data?
This study mainly focuses on three lexical features as key predictors: word length, frequency, and predictability. While other features, including the age of acquisition, concreteness, and neighborhood density, are also known to influence fixations during reading (e.g., Dirix et al., Reference Dirix, Cop, Drieghe and Duyck2017; Dirix & Duyck, Reference Dirix and Duyck2017; see also Godfroid, Reference Godfroid2019 for a review), these three are particularly important and are commonly included in models of eye-movement control for L1 reading (Engbert et al., Reference Engbert, Nuthmann, Richter and Kliegl2005; Kliegl et al., Reference Kliegl, Grabner, Rolfs and Engbert2004, Reference Kliegl, Nuthmann and Engbert2006; Laurinavichyute et al., Reference Laurinavichyute, Sekerina, Alexeeva, Bagdasaryan and Kliegl2019; Reichle et al., Reference Reichle, Rayner and Pollatsek1999). Furthermore, the selection of predictors in the present study is motivated by the aim of comparing our findings with Kuperman et al.’s (Reference Kuperman, Matsuki and Van Dyke2018) L1 results. By assessing the relative importance of these features in L2 reading, this study provides insights into the similarities and differences in word processing between L1 and L2 reading. Since frequency has a stronger influence on L2 reading (Cop et al., Reference Cop, Keuleers, Drieghe and Duyck2015), word frequency may play a more dominant role in L2 than in L1. However, given the shared cognitive mechanisms underlying L1 and L2 reading, the importance of these features may follow a similar pattern in both contexts.
For the present study, we used eye-tracking data made publicly available by Nahatame et al. (Reference Nahatame, Ogiso, Kimura and Ushiro2024). Their analysis, which employed linear mixed-effects models, showed that word length and frequency significantly affected several fixation duration measures. However, they did not examine the effects of word predictability and assess the relative importance of these features. Additionally, they did not analyze other eye-tracking measures such as skipping and regression. The present study builds on their work by incorporating indices of word predictability and additional features, evaluating the relative importance of the variables using a machine learning approach (i.e., random forest), and examining additional eye-tracking measures.
Method
Eye-tracking data
We used data from the Tsukuba Eye-Tracking Corpus (TECO) created by Nahatame et al. (Reference Nahatame, Ogiso, Kimura and Ushiro2024), which is publicly available on the OSF (https://osf.io/wrvj3/). This dataset was selected for its extensive and reliable data on L2 English text reading, as well as the availability of detailed word information, including position within passages and lines (see below for more details). It contains eye-tracking data from 41 Japanese L2 English learners, ranging from intermediate to advanced proficiency levels, who read 30 explanatory passages totaling over 10,000 words. The dataset includes nine eye-tracking measures calculated for each participant and each token, resulting in over 410,000 data points.
Of the nine eye-tracking measures, we analyzed the following six that reflect different stages of processing (Conklin et al., Reference Conklin, Pellicer-Sánchez and Carrol2018):
Early measures: skipping (skip), first fixation duration (ffd)
Late measures: number of fixations (nfix), total fixation duration (tfd)
Intermediate measures: regression-in (regin), regression path duration (rpd)
Skip and regin are binary variables, indicating whether a word was skipped during the first-pass reading and whether there was a regression to the word from subsequent context, respectively. Ffd, rpd, and tfd are all fixation duration measures: ffd refers to the duration of the first fixation on a word; rpd is the duration from the initial fixation on a word until readers fixate on the next (i.e., subsequent) word, including any regressions to the previous context; tfd is the total duration of all fixations on a word. Although the original corpus provides gaze duration (gd), a standard eye-movement measure, it was not included in the present analysis because it conceptually overlaps with both ffd and tfd and is also reported to be highly correlated with them (see Nahatame et al., Reference Nahatame, Ogiso, Kimura and Ushiro2024). The original corpus sets the lower limit for fixation duration at 80 ms, as fixations shorter than this threshold are unlikely to facilitate meaningful information extraction (Conklin et al., Reference Conklin, Pellicer-Sánchez and Carrol2018). Nfix refers to the total number of fixations on a word. These measures were categorized to reflect different stages of word processing (i.e., early, late, and intermediate), as outlined earlier in the Background section. For further details on these measures and the eye-tracking experiment, refer to Nahatame et al. (Reference Nahatame, Ogiso, Kimura and Ushiro2024).
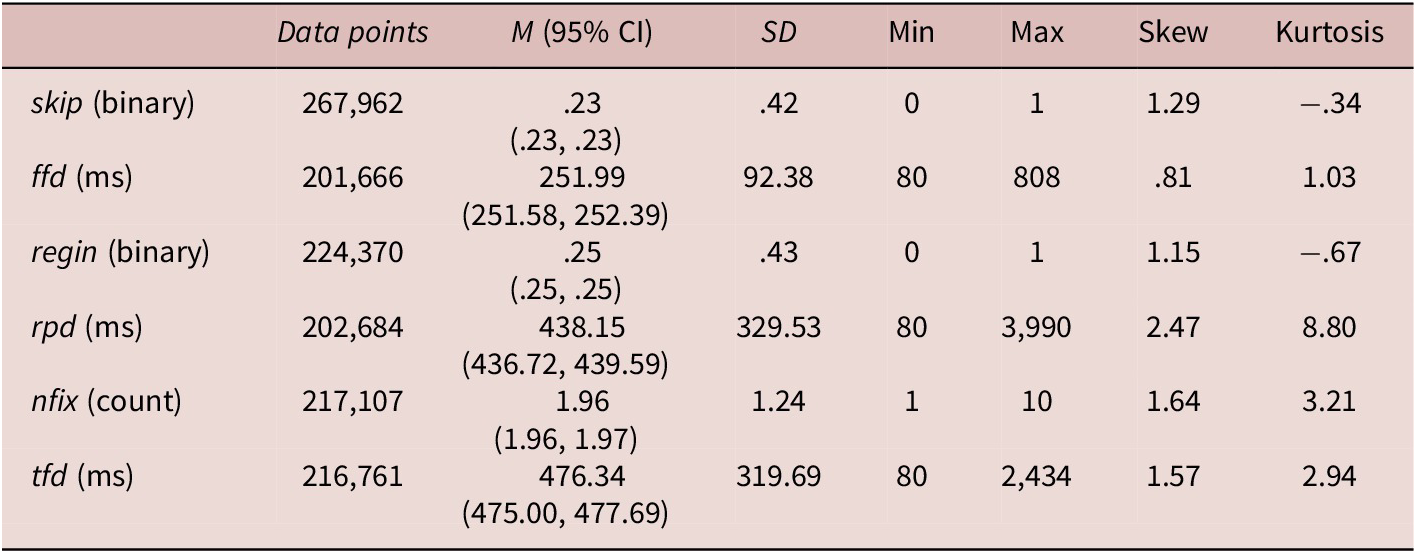
In this study, we extracted the data for analysis from the original corpus using the following steps: First, words located at the right- and left-most edges of lines (i.e., at the beginning and end of lines) were excluded (Kuperman et al., Reference Kuperman, Matsuki and Van Dyke2018) due to their unique fixation behavior (Conklin et al., Reference Conklin, Pellicer-Sánchez and Carrol2018; Godfroid, Reference Godfroid2019; Nahatame et al., Reference Nahatame, Ogiso, Kimura and Ushiro2024). This resulted in the exclusion of approximately 20% of the data. Words with punctuation were also excluded (Berzak et al., Reference Berzak, Nakamura, Smith, Weng, Katz, Flynn and Levy2022), leading to an additional 10% data reduction. Then, data with total fixation duration (tfd) in the top 1% of the individual participants were removed as outliers (Kuperman et al., Reference Kuperman, Matsuki and Van Dyke2018, Reference Kuperman, Siegelman, Schroeder, Acartürk, Alexeeva, Amenta, Bertram, Bonandrini, Brysbaert, Chernova, Da Fonseca, Dirix, Duyck, Fella, Frost, Gattei, Kalaitzi, Lõo, Marelli and Usal2023). For the count and duration measures, we also excluded data that exceeded the individual’s mean by +2.5 standard deviations as outliers (Cop et al., Reference Cop, Dirix, Drieghe and Duyck2017). Finally, we excluded data for which the lexical features used in the analysis, such as word frequency and bigram scores, were unavailable due to missing values in external databases or structural constraints (see below for details). As a result of these filtering steps, the final dataset retained approximately 50% to 65% of the original data. Table 1 presents the descriptive statistics for each eye-tracking measure based on these datasets.
Descriptive statistics for six eye-tracking measures used in this study

Note: skip = skipping; ffd = first fixation duration; regin = regression-in; rpd = regression path duration; nfix = number of fixations; tfd = total fixation duration.
Predictors
Lexical features
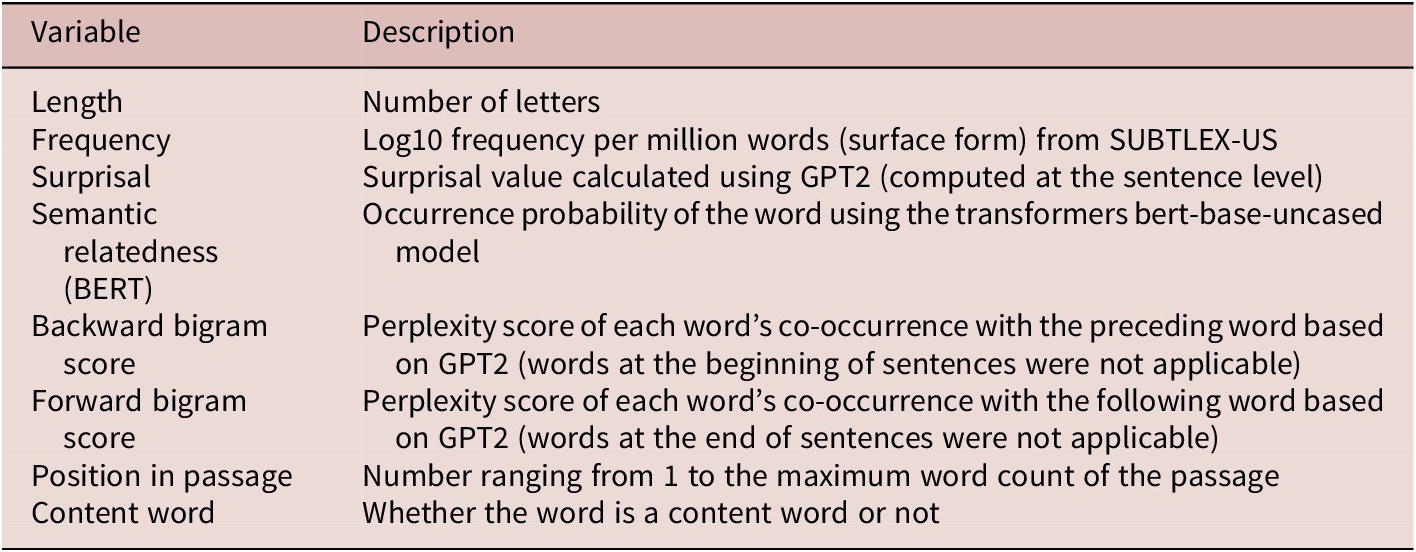
We included the following eight variables of lexical features as predictors: (a) length, (b) frequency, (c) surprisal, (d) semantic relatedness (BERT), (e) backward bigram score, (f) forward bigram score, (g) word position in the passage, and (h) content words. Table 2 lists these variables with their brief descriptions.
Variables of lexical features

These variables, except for content word and semantic relatedness, are conceptually similar to those included in Kuperman et al. (Reference Kuperman, Matsuki and Van Dyke2018), although the calculation methods differ. Kuperman et al. excluded function words from their analysis, but in the present study, we included a variable indicating whether a word is a content word, allowing us to examine its relative importance in word processing. The variables for length and word position were sourced from the original corpus, while all other variables were newly added in the present study. Note that the descriptive statistics presented below are based on data excluding edge words, words with punctuation, and those with missing values. Nevertheless, due to the trimming process applied to eye-tracking measures, the lexical feature data varied slightly across different eye-tracking measures.
Word length was measured by the number of letters (M = 4.56, SD = 2.40). Frequency was assessed using the log10 frequency per million words from SUBTLEX-US (Brysbaert & New, Reference Brysbaert and New2009) without distinguishing between different parts of speech (M = 4.45, SD = 1.34). Higher values indicate words that appear more frequently in the corpus. We adopted SUBTLEX-US because it is an openly available corpus of American English, making it possible for reproducible analyses and relevant to Japanese English learners, who primarily study American English through their textbooks and classroom instructions. In addition, SUBTLEX is widely recognized and frequently employed in similar eye-tracking research (e.g., Berzak et al., Reference Berzak, Nakamura, Smith, Weng, Katz, Flynn and Levy2022; Cop et al., Reference Cop, Keuleers, Drieghe and Duyck2015; Kuperman et al., Reference Kuperman, Matsuki and Van Dyke2018). We excluded proper nouns, hyphenated words, and words not found in the database from the frequency calculations, marking their frequency as NA.
Surprisal and bigram scores, which index word predictability, and semantic relatedness, which reflects contextual fit, were calculated using LLMs. Surprisal was calculated at the sentence level using GPT2 (gpt2-medium) through the GPT2LMHeadModel function from the Hugging Face Transformers library (Wolf et al., Reference Wolf, Debut, Sanh, Chaumond, Delangue, Moi, Cistac, Rault, Louf, Funtowicz, Davison, Shleifer, von Platen, Ma, Jernite, Plu, Xu, Scao, Gugger and Rush2020; M = 3.95, SD = 2.85). For semantic relatedness (BERT), we used bert-base-uncased from the transformers library to mask the target word and determine its occurrence probability from the surrounding context (M = .54, SD = .39). Tokenization was performed using BertTokenizer. In cases where words were tokenized into subwords (e.g., “wallpaper” into “wall” and “paper”), the scores for each subword were averaged to obtain the probability for the whole word. For bigrams, instead of using simple frequency (Kuperman et al., Reference Kuperman, Matsuki and Van Dyke2018), we utilized the perplexity score from GPT2. The perplexity score indicates how difficult it is to predict a given word combination, with higher values indicating greater difficulty. By using GPT2, we can accurately measure the rarity of word combinations with a statistical score. Calculations were performed using GPT2LMHeadModel with gpt2-medium (M = 394,521.62, SD = 9,381,463.45 for backward bigrams; M = 129,993.58, SD =1,194,574.59 for forward bigrams).
Word position in the passage was represented by a number ranging from 1 to the maximum word count (M = 170.11, SD = 100.66). Larger values indicate that the word appears later in the passage. The variable Content word was a binary indicator of whether a word was a content word, with content words constituting 51% of the words analyzed.
Sentence and text features
To determine the relative importance of lexical features compared to other linguistic features, we also included some sentence and text features. The variables of sentence features included simple measures of syntactic complexity and those obtained by calculating some of the lexical features at the sentence level: (a) sentence length (number of words; M = 17.52, SD = 7.46), (b) number of verbs (M = 2.42, SD = 1.49), (c) average word frequency (M = 4.32, SD = .38), (d) sentence probability (i.e., the probability of the word combinations in a sentence as calculated using GPT2; M = .03, SD = .02), and (e) ratio of content to function words (M = 1.62, SD = .93). Note that the descriptive statistics presented here are based on all sentences in the texts. In addition to sentence features, we included overall text difficulty as a text property, similar to Kuperman et al. (Reference Kuperman, Matsuki and Van Dyke2018). In this study, the difficulty of each passage was assessed using the Flesch-Kincaid Grade Level (Kincaid et al., Reference Kincaid, Fishburne, Rogers and Chissom1975), a widely recognized readability formula that calculates text difficulty based on average word and sentence length (M = 9.92, SD = 2.91).
Reader characteristics
For reader characteristics, we included the following two variables from the original corpus: English reading proficiency and self-confidence in using the English language. English reading proficiency was measured using the reading comprehension section of the EIKEN test, a widely used standardized English proficiency test in Japan. The sum score of the 19 multiple-choice comprehension question items was used (M = 12.85, SD = 3.15; Cronbach’s α = .75 [.63, .85]). For more details about this test, refer to Nahatame et al. (Reference Nahatame, Ogiso, Kimura and Ushiro2024).
Self-confidence in the English language was assessed using a seven-point scale across three areas: (a) general English ability, (b) reading comprehension, and (c) reading speed. The average of these scores was calculated (M = 3.85, SD = .97; Cronbach’s α = .83 [.72, .91]), with higher values indicating higher confidence.
Statistical analysis
We constructed random forest models using the six eye-tracking measures described above as the dependent variable and a total of 16 predictor variables: eight lexical features, six sentence/text features, and two reader properties. We adopted random forest as our main analytical approach because it can avoid issues of overfitting and collinearity and is recommended as a method to estimate variable importance (Matsuki et al., Reference Matsuki, Kuperman and Van Dyke2016; Mizumoto, Reference Mizumoto2022). We standardized all predictors before modeling to mitigate potential instability.
For binary eye-tracking data, we applied a random forest classification model using scikit-learn’s RandomForestClassifier (Pedregosa et al., Reference Pedregosa, Varoquaux, Gramfort, Michel, Thirion, Grisel, Blondel, Prettenhofer, Weiss, Dubourg, Vanderplas, Passos, Cournapeau, Brucher, Perrot and Duchesnay2011). For fixation duration and count data, we applied a random forest regression model using scikit-learn’s RandomForestRegressor. To optimize the model parameters, we performed a grid search using 10% of the data randomly extracted (using scikit-learn’s GridSearchCV). This study conducted a grid search for three parameters: number of decision trees (n_estimators), maximum number of features (max_features), and maximum depth of the trees (max_depth). We used accuracy as the metric for binary data and negative mean squared error for continuous data to determine the optimal set of parameters. If parameters with equal accuracy were found, we selected the one with fewer variables for faster computation.
Based on these random forest models, we created a ranked list of relative importance scores for each predictor, calculated using the “feature_importances” method of the RandomForestClassifier. These scores are derived from multiple iterations of random forest models based on the number of trees specified in n_estimators. Following Kuperman et al. (Reference Kuperman, Matsuki and Van Dyke2018), we identified particularly important variables by visually inspecting the gap where the importance scores exhibit a steep gradient. Additionally, considering that word length could be a highly important variable in predicting eye-tracking data (Kuperman et al., Reference Kuperman, Matsuki and Van Dyke2018), we focused on variables that were more important than length. After identifying the important variables, we assessed Spearman’s rank-order correlations between these variables and targeted eye-tracking measures to assess their relationship. However, it is important to note that these correlations are calculated independently of the random forest modeling and should only be considered as supplementary information to aid in interpreting variable relationships (Kuperman et al., Reference Kuperman, Matsuki and Van Dyke2018).
Random forest models were constructed using Python 3.9.5 (Python Software Foundation, 2021), whereas other analyses such as descriptive statistics and correlations were computed using R 4.2.2 (R Core Team, 2022).
Data availability
All data, materials, and analysis codes from this study are openly available on the OSF at https://osf.io/3xsep/. In addition, the original TECO corpus has been augmented with lexical features from this study (https://osf.io/wrvj3/).
Results
Skipping
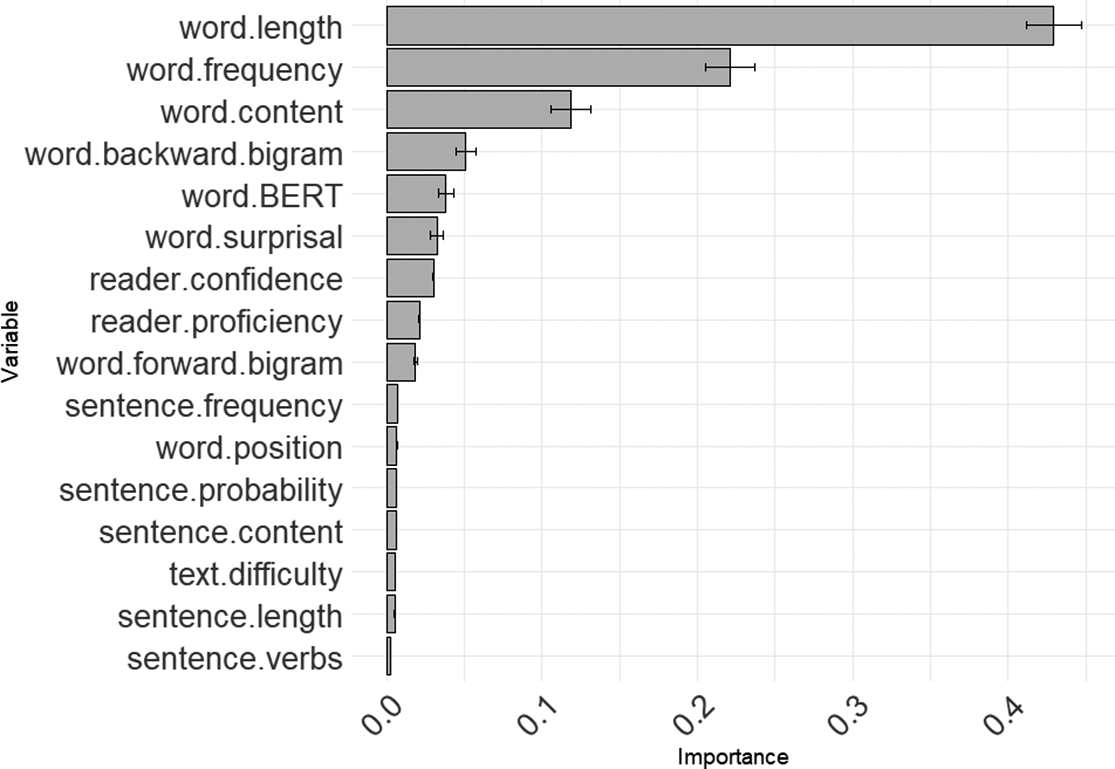
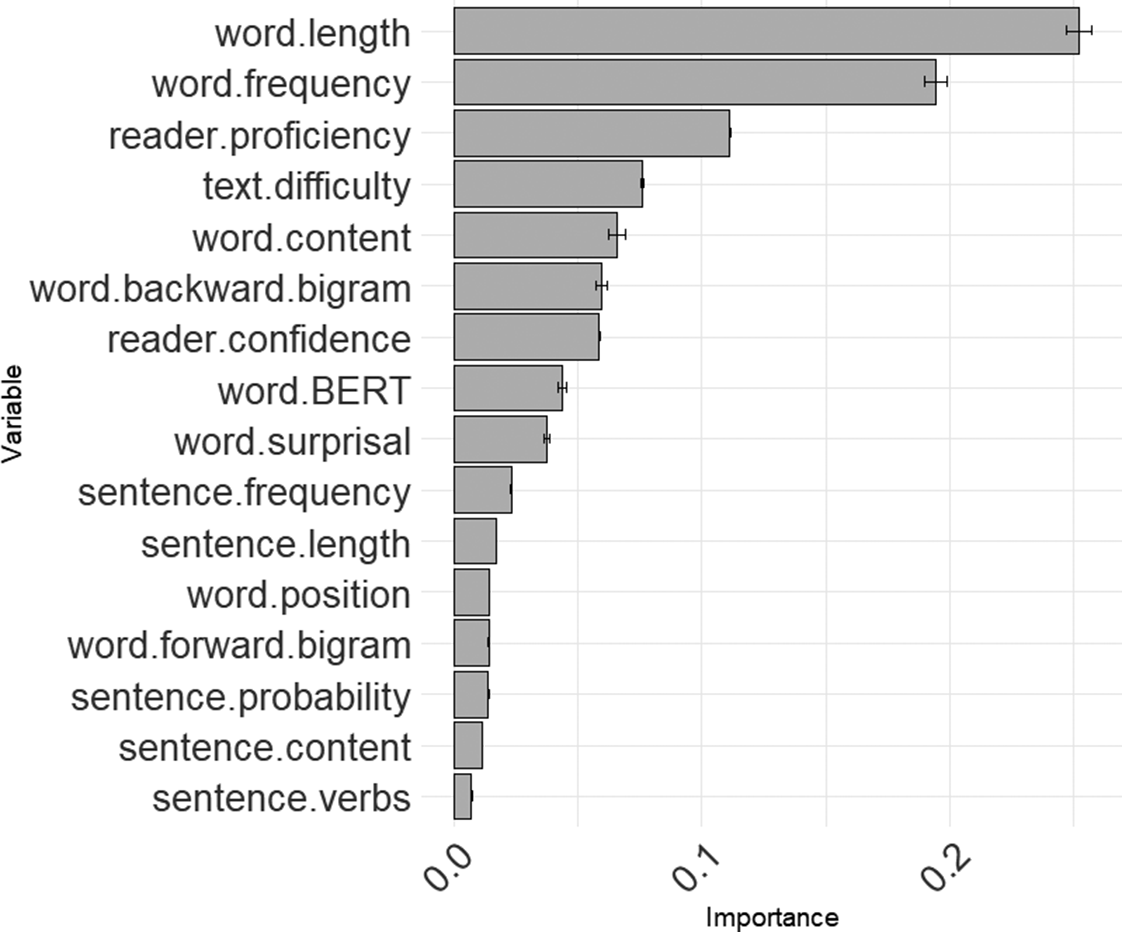
Based on the grid search results, the optimal parameters for skipping (skip) were n_estimators = 200, max_features = “log2” (= 4), and max_depth = 10. The average accuracy score from cross-validation was approximately .81. Figure 1 shows a ranked list of the relative importance scores for each predictor in skip (see Supplementary Materials for detailed results of the importance scores). As seen in this figure, word length indicates quite high importance, followed by word frequency and then content word status.
Relative importance of each predictor for skipping (skip).
Note: Each score is presented with its mean value and accompanied by error bars indicating the standard error.

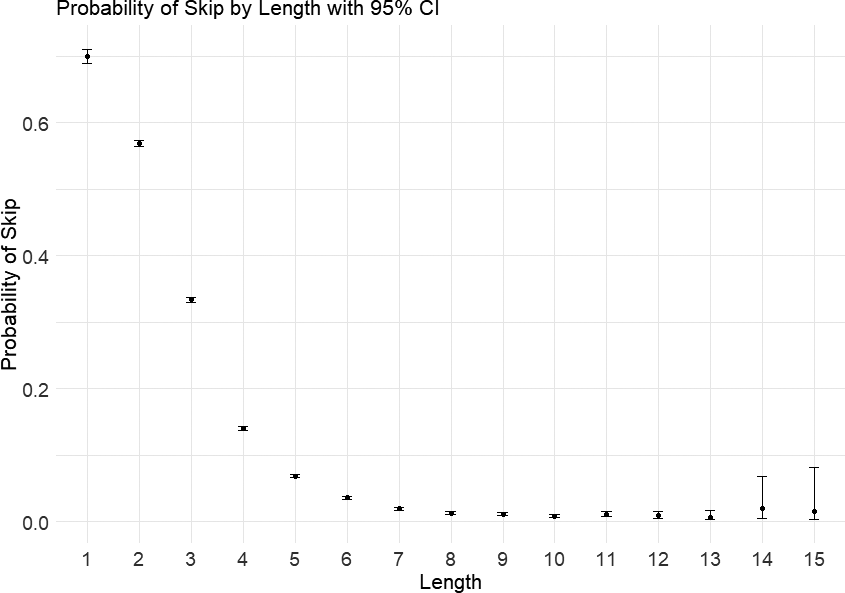
To interpret the association between skipping and these features, we assessed the rank-order correlations between them. The results indicated a negative and moderate correlation between skipping and word length, ρ = −.49, p < .001, suggesting that longer words tended to be skipped less frequently (see Figure 2). A moderate positive correlation was observed between skipping and word frequency, ρ = .42, p < .001, indicating that higher-frequency words were more likely to be skipped. In contrast, skipping showed a moderate negative correlation with content word status, ρ = −.38, p < .001, suggesting that content words were less likely to be skipped compared to function words (7% vs. 39%).
Relationship between skipping probability and word length.

First fixation duration
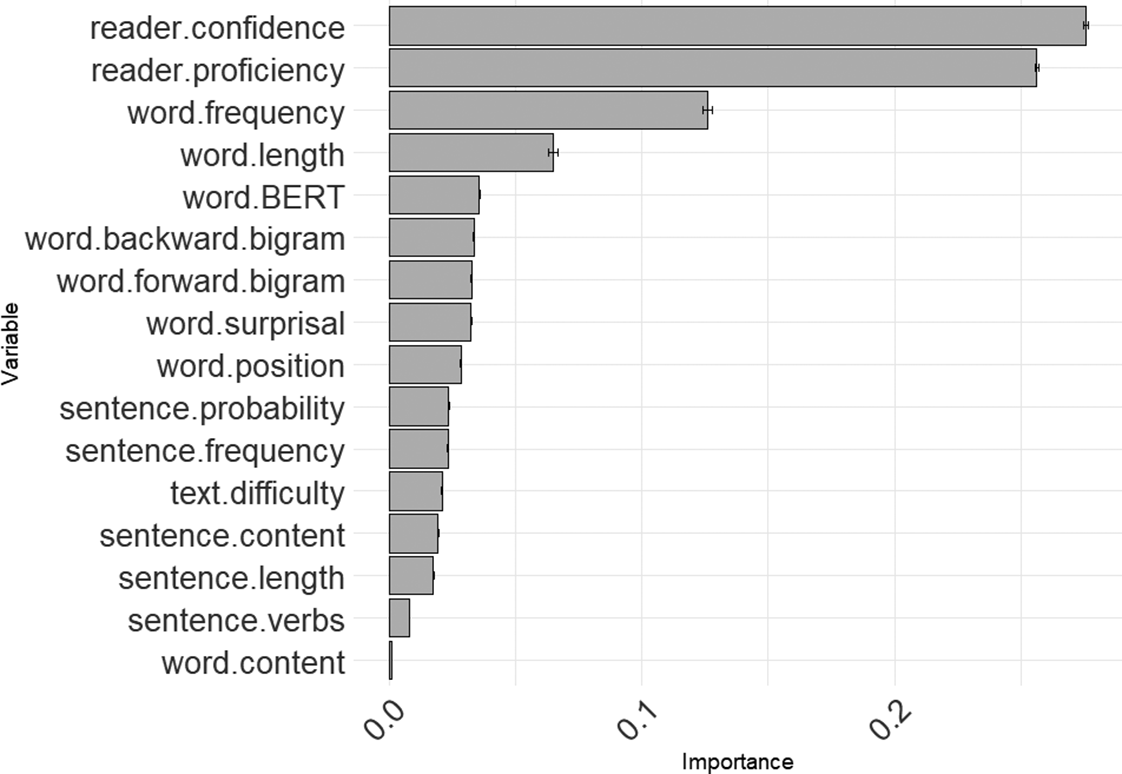
For the first fixation duration (ffd), the optimal parameters were n_estimators = 500, max_features = None (Number of variables used = 16), and max_depth = 10. The average R 2 score from cross-validation was .11. As Figure 3 shows, the reader factors of confidence and proficiency indicated higher importance, followed by word frequency and then word length. The remaining variables showed minor differences in importance.
Relative importance of each predictor for first fixation duration (ffd).
Note: Each score is presented with its mean value and accompanied by error bars indicating the standard error.

To assess the association between ffd and these important variables, we calculated the rank-order correlations: proficiency, ρ = −.05, p < .001; confidence, ρ = −.03, p < .001; frequency, ρ = −.15, p < .001; length, ρ = .15, p < .001. Higher proficiency and confidence levels, along with more frequent and shorter words, were associated with shorter first fixation durations.
Regression-in
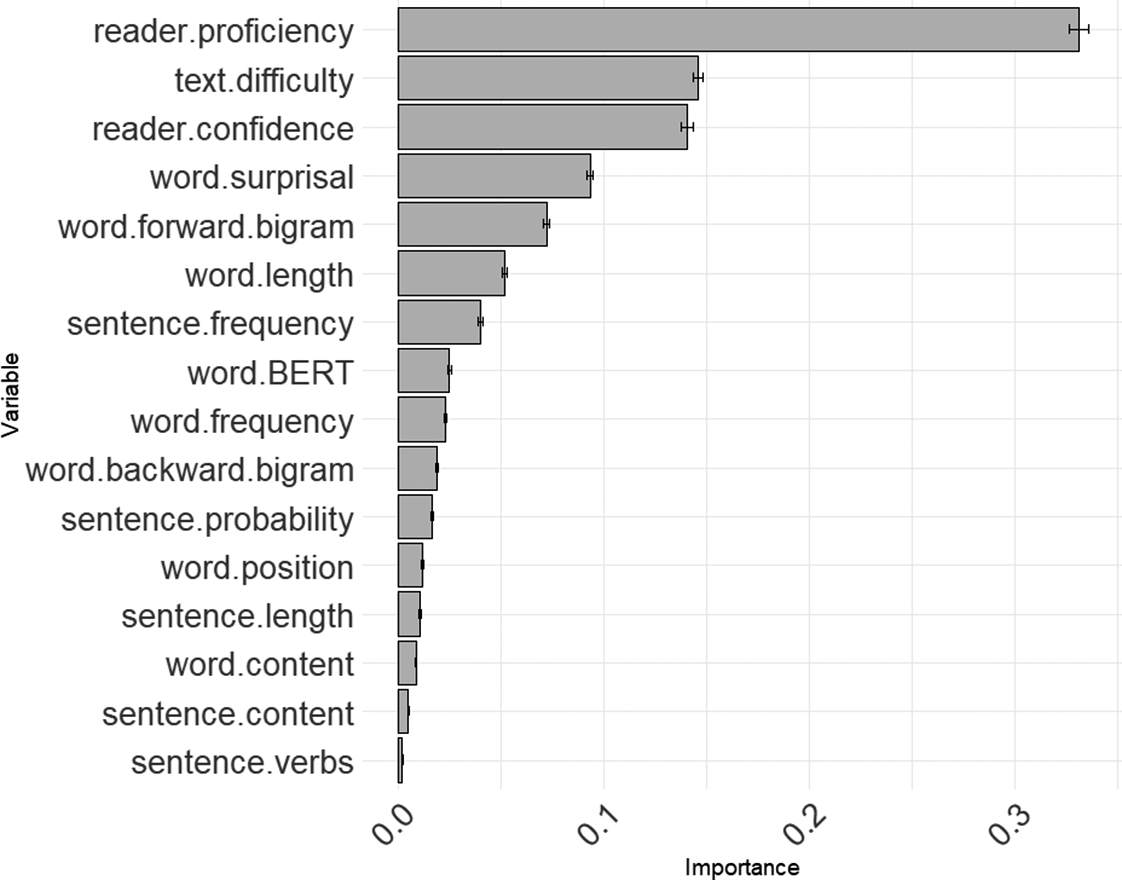
For regression-in (regin), the optimal parameters were n_estimators = 1,000, max_features = “log2” (= 4), and max_depth = 5. The average accuracy from cross-validation was approximately .75. As Figure 4 shows, proficiency indicated the highest importance, followed by text difficulty, confidence, surprisal, forward bigram, and word length.
Relative importance of each predictor for regression-in (regin).
Note: Each score is presented with its mean value and accompanied by error bars indicating the standard error.

The rank-order correlations were calculated between regin and these variables: proficiency, ρ = −.05, p < .001; text difficulty, ρ = .05, p < .001; confidence, ρ = −.04, p < .001; surprisal, ρ = .04, p < .001; forward bigram, ρ = .04, p < .001; length, ρ = −.03, p < .001. Words were more likely to be regressed from the later context when participants had lower proficiency and confidence. Furthermore, words were more likely to be regressed when they were in more difficult passages, were shorter and less predictable (i.e., higher surprisal values), and did not frequently co-occur with the following words (i.e., higher forward bigram scores).
Regression path duration
For regression path duration (rpd), the optimal parameters were n_estimators = 1,000, max_features = “log2” (=4), and max_depth = 10. The average R 2 score from cross-validation was .15. As Figure 5 shows, word length had the highest importance, followed by frequency. These two variables had quite high importance, whereas the others followed in the order of proficiency, confidence, and backward bigram score.
Relative importance of each predictor for regression path duration (rpd).
Note: Each score is presented with its mean value and accompanied by error bars indicating the standard error.

The rank-order correlation was calculated between regression path duration (rpd) and these variables: length, ρ = .40, p < .001; frequency, ρ = −.38, p < .001; proficiency, ρ = −.09, p < .001; confidence, ρ = −.08, p < .001; backward bigram score, ρ = .28, p < .001. Longer and lower-frequency words and words that rarely co-occur with preceding words (i.e., higher backward bigram scores) were all associated with longer regression path durations (rpd). Conversely, readers with higher confidence and proficiency tended to exhibit shorter rpd for individual words.
Number of fixations
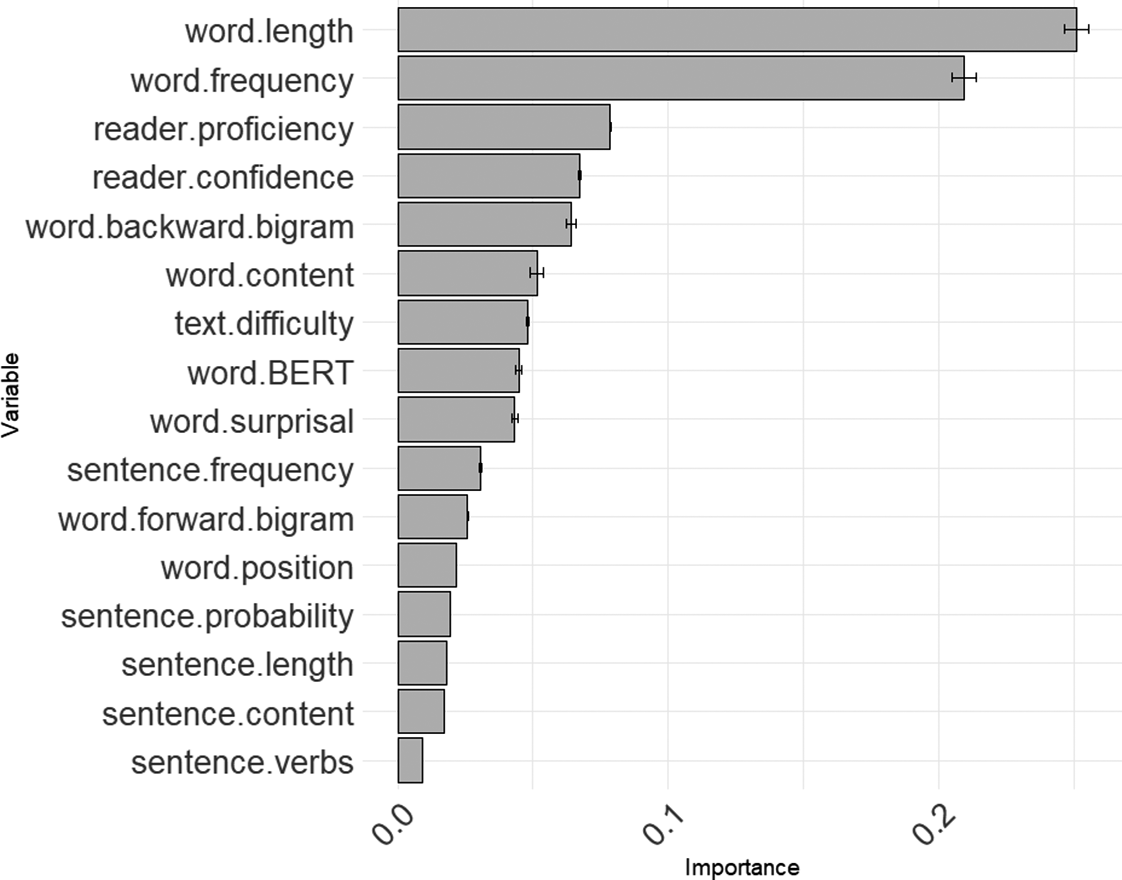
For the number of fixations (nfix), the optimal parameters were n_estimators = 1,000, max_features = None (16), and max_depth = 10. The average R 2 score from cross-validation was .21. As Figure 6 shows, length had the highest importance by far, followed by proficiency, confidence, and text difficulty.
Relative importance of each predictor for the number of fixations (nfix).
Note: Each score is presented with its mean value and accompanied by error bars indicating the standard error.

To assess the association between nfix and these variables, we calculated the rank-order correlations: length, ρ = .35, p < .001; proficiency, ρ = −.10, p < .001; confidence, ρ = −.06, p < .001; text difficulty, ρ = .13, p < .001. Longer words and words in more difficult texts had a higher number of fixations, while higher proficiency and confidence were associated with fewer fixations on individual words.
Total fixation duration
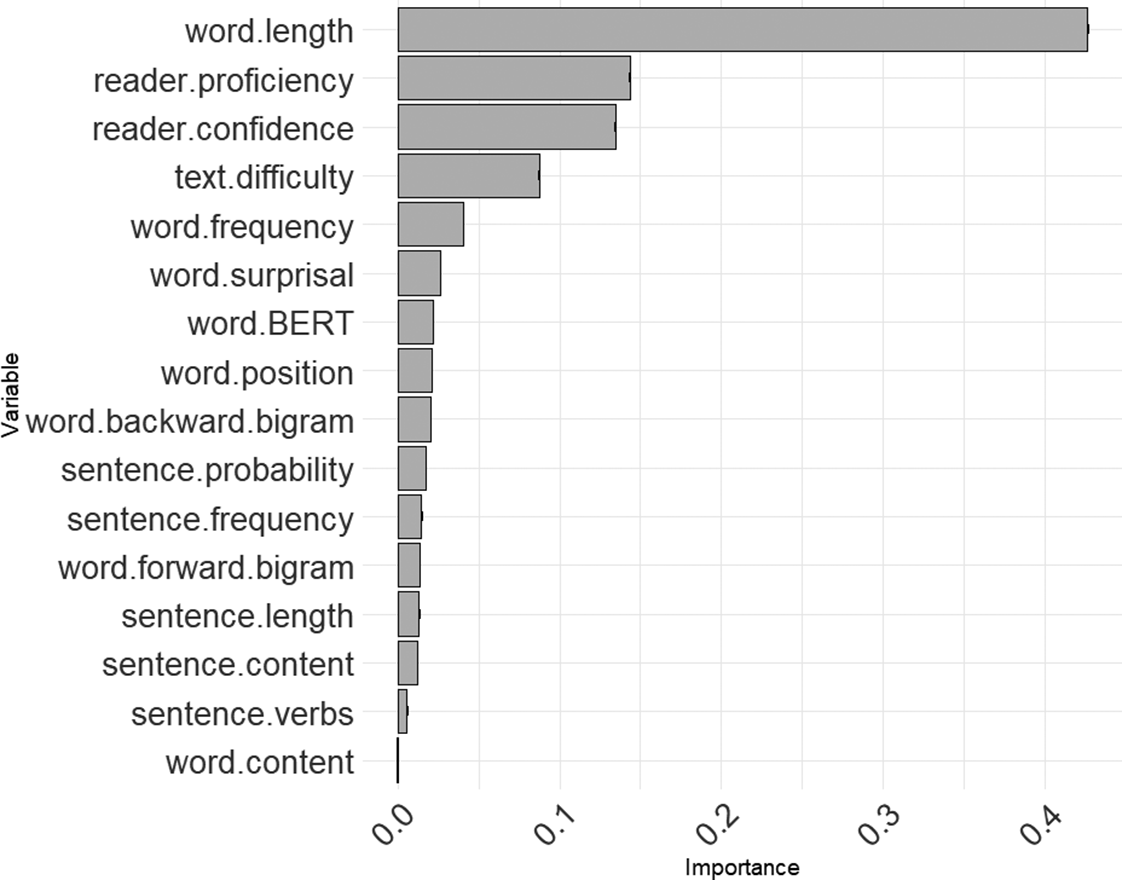
For total fixation duration (tfd), the optimal parameters were n_estimators = 1,000, max_features = “log2” (= 4), and max_depth = 10. The average R 2 score from cross-validation was .22. As Figure 7 shows, length had the highest importance, followed by frequency. These two variables had quite high importance, with the others following in the order of proficiency and text difficulty.
Relative importance of each predictor for total fixation duration (tfd).
Note: Each score is presented with its mean value and accompanied by error bars indicating the standard error.

To assess the association between total fixation duration (tfd) and these variables, we calculated the rank-order correlations: length, ρ = .40, p < .001; frequency, ρ = −.38, p < .001; proficiency, ρ = −.11, p < .001; text difficulty, ρ = .13, p < .001. Longer, lower-frequency words and words in more difficult texts had longer tfd. Conversely, higher proficiency was associated with shorter tfd for individual words.
Summary of the results
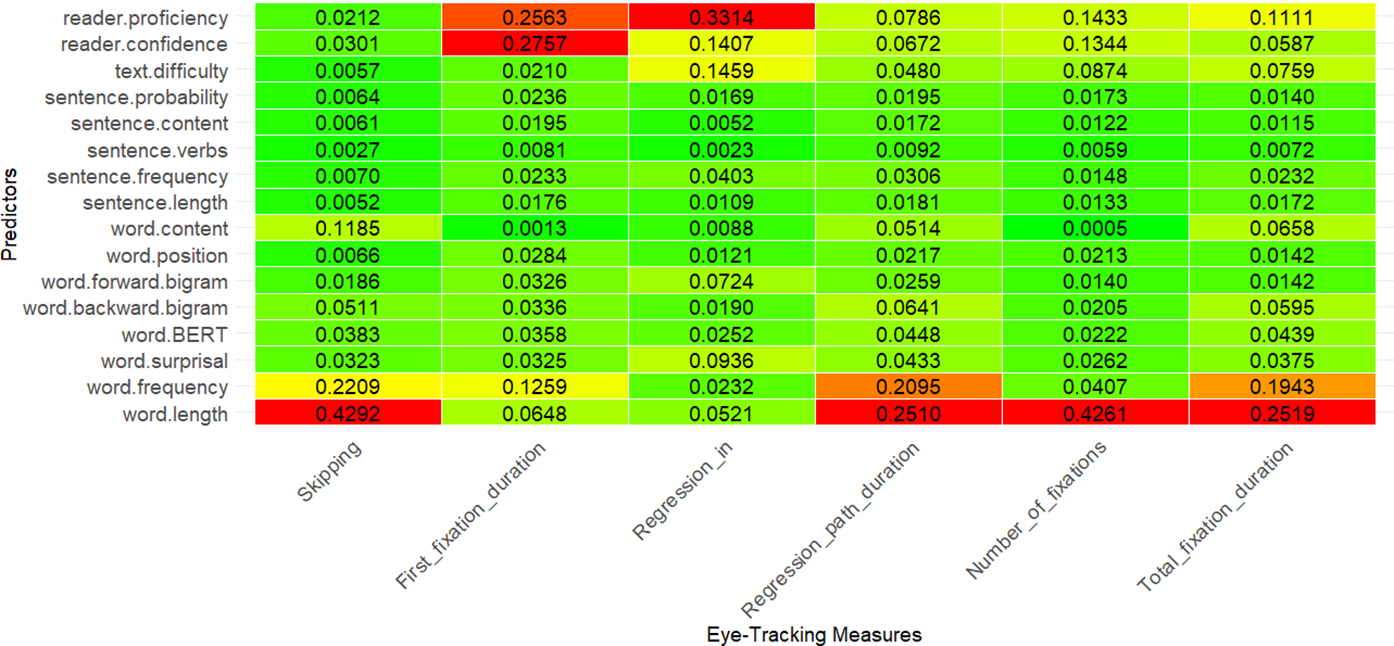
To provide a clear and integrated overview of the results, Figure 8 represents a visual summary that illustrates the relative importance of predictors across all dependent variables.
Heatmap of predictor importance across eye-tracking measures.
Note: Warmer colors (red, orange, and yellow) indicate higher relative importance, whereas cooler green indicates lower relative importance. To enhance interpretability, the color gradient in this heatmap is based on normalized values within each column, allowing the relative importance of predictors to be compared independently within each measure.

Discussion
Drawing on the results presented above, we address the two RQs posed in this study by focusing on the features identified as relatively important. We then provide a comprehensive theoretical discussion, including commonalities between L1 and L2 reading, insights into models of eye-movement control in reading, the distinct stages of lexical processing, and the use of LLMs to assess lexical features.
RQ1: Which lexical features are more important?
Length
The results indicated that word length was the most important predictor for several eye-tracking measures, including skipping (skip), regression path duration (rpd), number of fixations (nfix), and total fixation duration (tfd). Additionally, it ranked fourth for first fixation duration (ffd) and sixth for regression-in (regin). The high importance of word length aligns with Kuperman et al.’s (Reference Kuperman, Matsuki and Van Dyke2018) L1 study. Its strong role in predicting word skipping is also consistent with the findings of Brysbaert and Vitu (Reference Brysbaert, Vitu and Underwood1998). As numerous previous studies have demonstrated, longer words are less likely to be skipped, are fixated on more times, and have longer fixation durations (Rayner, Reference Rayner2009). While this relationship has been established in previous L2 reading studies (Berzak et al., Reference Berzak, Nakamura, Smith, Weng, Katz, Flynn and Levy2022; Cop et al., Reference Cop, Dirix, Drieghe and Duyck2017; Nahatame et al., Reference Nahatame, Ogiso, Kimura and Ushiro2024), the present study offers a unique contribution by demonstrating that word length often serves as a more significant determinant of fixation behavior than other lexical features, such as frequency and predictability.
Frequency
Although word length played an important role in several eye-tracking measures, it is noteworthy that certain lexical features exceeded the importance of word length for some measures. Word frequency was one such feature, ranking third in importance for first fixation duration (ffd). It also ranked second in importance, following word length, for skipping (skip), regression path duration (rpd), and total fixation duration (tfd). These findings suggest that word frequency also plays a significant role in fixation behavior during word processing, particularly in the first fixation duration. More frequent words were more likely to be skipped and to exhibit shorter fixation durations, aligning with previous studies (e.g., Berzak et al., Reference Berzak, Nakamura, Smith, Weng, Katz, Flynn and Levy2022; Kuperman et al., Reference Kuperman, Schroeder and Gnetov2024). In L2 reading, for example, Cop et al. (Reference Cop, Keuleers, Drieghe and Duyck2015) demonstrated the significant impact of word frequency on single fixation duration. The current study elaborates on these findings by illustrating the relative importance of frequency compared to other lexical features (e.g., length and predictability) in predicting various eye-tracking measures in L2 reading.
Predictability
Other lexical features that ranked higher than length included surprisal and forward bigram scores for regression-in (regin), which were the fourth and fifth most important, respectively. Consistent with theoretical explanations and previous findings (e.g., Berzak et al., Reference Berzak, Nakamura, Smith, Weng, Katz, Flynn and Levy2022; Hale, Reference Hale2001; Levy, Reference Levy2008), words that are harder to predict from the context or less likely to co-occur with the following word are more likely to be regressed from the later context, reflecting increased processing difficulty.
In contrast to the present study, Kuperman et al. (Reference Kuperman, Matsuki and Van Dyke2018) found that surprisal and bigram frequency were not highly important for predicting fixation behavior for words, including regressions, in L1 English readers. This discrepancy may be explained by the use of LLMs to evaluate predictability in this study. Berzak et al. (Reference Berzak, Nakamura, Smith, Weng, Katz, Flynn and Levy2022) and Salicchi et al. (Reference Salicchi, Chersoni and Lenci2023), both of whom used GPT2 to calculate surprisal, found that surprisal significantly contributed to predicting fixation behavior on individual words during reading (see Theoretical Implications below for further discussion on using LLMs to assess predictability).
RQ2: Are there any features more important than lexical ones?
Reader characteristics
For some eye-tracking measures, reader characteristics were more important than any lexical features, including word length. For first fixation durations (ffd), the two most important factors were the reader variables of confidence and proficiency. Similarly, for regression-in (regin), proficiency had the highest importance, and confidence was the third most important variable. Higher proficiency and confidence resulted in shorter first fixation durations and lower probability of regressions, consistent with theoretical expectations and previous findings (e.g., Rayner, Reference Rayner2009; Kuperman et al., Reference Kuperman, Matsuki and Van Dyke2018). This indicates that individual differences, such as reading ability and confidence, play a more critical role in the initial stage of word processing and regressions from subsequent contexts, outweighing the influence of lexical features.
Although they did not exceed the importance of word length, proficiency and confidence ranked second and third, respectively, in the number of fixations (nfix). While word length is the most important factor, individual differences also play a role in determining how often a word is fixated on.
Text difficulty
Another important variable, besides lexical features, is overall text difficulty for regression-in (regin). This variable ranked second in terms of importance, following proficiency. Text difficulty also held relatively high importance for other measures, ranking fourth for the number of fixations (nfix) and total fixation duration (tfd). When surrounding words or sentences are more challenging, readers are likely to regress to the word more frequently to address difficulties in integrating it into the context or overall text representation, leading to more frequent and longer fixations on the word. Interestingly, eye movements on individual words are influenced not just by the words’ characteristics but also by the features of the entire text they belong to. This aligns with the findings of Kuperman et al. (Reference Kuperman, Matsuki and Van Dyke2018), who found that text difficulty was an important predictor of total reading time for individual words in L1 readers. However, although this study included sentence features as a variable, their importance was lower for any eye-tracking measures.
Theoretical Implications
The findings of this study indicate that lexical features deemed important in L1 reading (i.e., length, frequency, and predictability) also play a significant role in L2 reading. Furthermore, more importantly, the hierarchy of predictors in L2 reading closely mirrors that observed in L1 reading (Kuperman et al., Reference Kuperman, Matsuki and Van Dyke2018, Reference Kuperman, Schroeder and Gnetov2024), albeit with some differences. For instance, word length is the most influential factor for most eye-tracking measures, while word frequency surpasses it in importance for first fixation duration. Similarly, individual differences predict first fixation duration more strongly than lexical features, and overall text difficulty is a key determinant of the total fixation duration. The similarity in predictor importance suggests that the fundamental cognitive processes involved in word processing are shared between L1 and L2 reading, highlighting the importance of considering their commonalities as well as their differences (Siegelman et al., Reference Siegelman, Elgort, Brysbaert, Agrawal, Amenta, Arsenijević Mijalković, Chang, Chernova, Chetail, Clarke, Content, Crepaldi, Davaabold, Delgersuren, Deutsch, Dibrova, Drieghe, Filipović Đurđević, Finch and Kuperman2024).
In addition, this study contributes insights into models of eye-movement control in reading (Engbert et al., Reference Engbert, Nuthmann, Richter and Kliegl2005; Reichle et al., Reference Reichle, Pollatsek, Fisher and Rayner1998, Reference Reichle, Rayner and Pollatsek1999). Specifically, it demonstrated the importance of word length, frequency, and predictability—key factors commonly incorporated in such models—in explaining eye-movement behavior during L2 reading. This suggests that these models may be adapted for L2 reading without introducing entirely new control mechanisms. Moreover, the relative importance of each variable identified in this study offers a reference for parameter adjustments within these models, potentially enhancing their predictive accuracy. Nevertheless, this study does not involve direct simulations of these models, which could be a possible avenue for future research.
This study also makes an important theoretical contribution by providing a nuanced understanding of how different lexical features influence various stages of word processing during L2 reading. The findings identified word length as the most critical factor for determining whether a word is skipped, highlighting its pivotal role in parafoveal processing. For words that were directly fixated, word frequency dominated the early processing stage (first fixation duration), predictability became more influential during the intermediate stage (regression-in), and word length reemerged as crucial in later or overall processing stages (number of fixations, total fixation durations). The prominence of word frequency during early processing aligns with the view that frequency plays a crucial role in the familiarity check, an initial stage of word recognition (Reichle et al., Reference Reichle, Pollatsek, Fisher and Rayner1998, Reference Reichle, Rayner and Pollatsek1999). The importance of predictability during intermediate processing is expected, as less predictable words—those harder to anticipate from the context or less likely to co-occur with the subsequent word—may not be fully processed during the first-pass reading or may present challenges when integrated with subsequent words, leading to regressions to address these difficulties. The reemergence of word length as a key factor in later or comprehensive measures emphasizes its foundational role in shaping overall processing demands, which supports its frequent inclusion in text readability indices (e.g., Kincaid et al., Reference Kincaid, Fishburne, Rogers and Chissom1975). These findings highlight the complex interplay between lexical features and different stages of word processing, offering deeper insights into the mechanisms underlying L2 word processing.
While the roles of lexical features in word processing are well-established, it should be noted again that individual differences, such as reading proficiency and confidence, had an even greater impact on first fixation duration and regression-in. This suggests that early and efficient word processing largely depends on individual differences rather than lexical features.
It is noteworthy that this study adopted indices of word predictability derived from LLMs, such as surprisal and bigram scores. While these indices emerged as important factors for regressions, overall, their importance was limited compared to the simplest lexical feature, word length. Thus, although indices derived from LLMs can help predict human eye movements, in many cases, fixation behavior on individual words during reading is predicted primarily by word length. This finding may be valuable from a computational cost perspective, while it also highlights the need for further research and discussion on the psychological validity of LLM-based indices, particularly in L2 processing. To further explore this issue, we calculated the correlation between the bigram scores used in this study and bigram frequency from the Corpus of Contemporary American English (COCA), excluding extreme values (based on 36% of the dataset, comprising 3,581 words). The Spearman’s rank correlation coefficient was −.37, indicating that while LLM-based estimates show a moderate relationship with human or corpus-based data, they may capture distinct properties.
Conclusion and implications
This study showed that word length, frequency, and predictability—key factors theoretically expected to influence word processing during reading—are all significant predictors for word processing in L2 English reading, based on eye-tracking data. Among these factors, word length consistently emerged as the most important across multiple eye-tracking measures. However, certain lexical features surpassed word length in importance for specific eye-tracking measures. For example, word frequency indicated greater importance than length on fixation duration measures reflecting initial word processing (i.e., first fixation duration), while predictability was more significant than length for regressions from later contexts. Additionally, individual differences, such as reading proficiency and confidence, were found to play a larger role than any single lexical factor in predicting first fixation durations and regressions. Overall text difficulty, a global context factor, also played a more important role than lexical features for regressions, indicating that factors beyond individual words strongly influence certain stages of word processing. These findings enhance our understanding of the complex mechanisms underlying word processing during L2 reading, emphasize the commonalities between L1 and L2 reading processes, and have the potential to further shape eye-movement control models in reading.
Limitations and future directions
This study has several limitations and promising areas for future research. First, we primarily focused on the relationship between fixations on words and the features of the words being fixated on, without considering the characteristics of the preceding and following words. Previous studies have shown that the characteristics of preceding words, such as length and frequency, can influence the fixation on the subsequent words (e.g., Kliegl et al., Reference Kliegl, Nuthmann and Engbert2006; Kuperman & Van Dyke, Reference Kuperman and Van Dyke2011). Including these variables could allow for a more comprehensive analysis of fixation behavior during word processing. Additionally, some lexical features are not included in this study but likely influence L2 word processing, such as the age of acquisition, neighborhood density, and concreteness (Dirix et al., Reference Dirix, Cop, Drieghe and Duyck2017; Dirix & Duyck, Reference Dirix and Duyck2017; Kim et al., Reference Kim, Crossley and Skalicky2018). It would be interesting to consider these factors in future studies.
Second, while this study found word length to be the most important factor for several eye-tracking measures, Kuperman et al. (Reference Kuperman, Matsuki and Van Dyke2018) pointed out that in random forest models, variables with strong influences could make other variables appear less important and affect the threshold for determining importance. This may be true for skipping and the number of fixations in this study, where word length is especially important. Kuperman et al. examined the interaction between word length and other variables by dividing the data based on length (i.e., shorter and longer words) and then assessing the importance of other variables. Exploring such interactions with word length would be valuable, although it is necessary to discuss how we could examine these interactions more appropriately, as Kuperman et al. suggested. Similarly, given that proficiency or reading skill is likely to modulate the effects of word length and frequency (Cop et al., Reference Cop, Keuleers, Drieghe and Duyck2015; Kuperman & Van Dyke, Reference Kuperman and Van Dyke2011), exploring the interactions between these factors is also a worthwhile avenue for further investigation.
Third, the findings are based on modeling data from a specific group of participants reading a particular type of text. It is important to examine whether these results hold and what differences emerge when studying L2 readers with different L1s, varying proficiency levels, and texts from different genres. For example, this study focused on Japanese-English bilinguals, whose L1 and L2 use different scripts. Script similarity likely influences L2 word processing, which may, in turn, affect the importance of certain lexical features. Future research should explore whether the predictors examined in this study hold similar importance for bilinguals whose languages share the same script (e.g., Spanish-English bilinguals).
Finally, it is important to note that this study focused solely on word-level eye-tracking data. In addition, it restricts the original dataset by excluding certain words (e.g., those at the edges of lines, with punctuation, and at the beginning and end of the sentence), thereby reducing the data by about half. Therefore, the present findings may not apply to all words in a text, nor can they be directly extended to sentence- or passage-level processing. When eye-tracking data are considered at the sentence or passage level (e.g., how many times regressions occur during the reading of a whole sentence or passage), global measures of text complexity, such as syntactic complexity and text coherence, may emerge as important factors (see Kuperman et al., Reference Kuperman, Buzato and Rothe-Neves2025, for more discussion). This aspect is being explored in another study (Nahatame & Yamaguchi, Reference Nahatame and Yamaguchiaccepted), which examines the relationship between passage-level eye-tracking data, text readability indices, and various linguistic features, including global complexity measures.
Supplementary material
The supplementary material for this article can be found at http://doi.org/10.1017/S0272263125101137.
Acknowledgments
This work was supported by JSPS KAKENHI Grant Number 23K25335.
Author contribution
Shingo Nahatame: conceptualization; data curation; formal analysis; writing – original draft preparation; writing – review & editing; funding acquisition. Satoru Uchida: conceptualization; data curation; formal analysis; methodology; writing – original draft preparation; writing – review & editing.
Competing interests
The authors declare none.


 Open access