







1. Introduction
The buoyant flow of an electrically conducting fluid in the presence of a magnetic field constitutes a topic of fundamental research with applications in mainly two engineering fields: advanced material manufacturing, such as crystal growth of semiconductors (Ozoe Reference Ozoe2005), and nuclear fusion technology (Smolentsev et al. Reference Smolentsev, Moreau, Bühler and Mistrangelo2010). In the latter category, either pure lithium or lead-lithium eutectic alloy (PbLi) may be used in liquid breeder blankets for tritium self-sufficiency and power extraction. Among possible concepts under evaluation, the water-cooled lead-lithium (WCLL) blanket is currently one of the two candidates considered in Europe (Federici et al. Reference Federici, Boccaccini, Cismondi, Gasparotto, Poitevin and Ricapito2019). In this system, the nuclear fusion heat is removed by numerous cooling pipes immersed in the liquid metal, as described by Martelli et al. (Reference Martelli, Caruso, Giannetti and Del Nevo2018) and Arena et al. (Reference Arena2023), and tritium is recovered by circulating PbLi to ancillary systems. Due to the presence of the plasma-confining magnetic field, flow-induced electric currents give rise to Lorentz forces that significantly affect the flow structure and heat transfer characteristics. In the WCLL concept, the forced flow of liquid metal can be significantly reduced to minimize the magnetohydrodynamic (MHD) pressure drop (Smolentsev Reference Smolentsev2021). Even so, the presence of cooling pipes that obstruct the flow and generate large thermal gradients within the fluid leads to complex flow patterns with implications on the associated heat and mass transfer. To support the development of liquid breeder blankets, it is essential to investigate magneto-convective heat transfer at these cooling pipes to gain insight into the physical phenomena occurring in a liquid breeder blanket. Besides the application to nuclear fusion engineering, convective heat transfer from immersed structures, such as cylindrical obstacles, represents a fundamental problem in magnetohydrodynamics that is worth investigating comprehensively.
The MHD heat transfer and, more generally, magneto-convection in pipes and ducts have been studied by many authors and in several configurations, as is evident from the recent comprehensive review by Zikanov et al. (Reference Zikanov, Belyaev, Listratov, Frick, Razuvanov and Sviridov2021). In the case of natural convection, most of the work focused on the classical Rayleigh–Bénard problem (Burr & Müller Reference Burr and Müller2001; Vogt et al. Reference Vogt, Ishimi, Yanagisawa, Tasaka, Sakuraba and Eckert2018; Zürner et al. Reference Zürner, Schindler, Vogt, Eckert and Schumacher2019; Akhmedagaev et al. Reference Akhmedagaev, Zikanov, Krasnov and Schumacher2020) and the differentially heated cavity with a horizontal temperature gradient (Ozoe & Okada Reference Ozoe and Okada1989; Garandet, Alboussière & Moreau Reference Garandet, Alboussière and Moreau1992; Okada & Ozoe Reference Okada and Ozoe1992; Authié, Tagawa & Moreau Reference Authié, Tagawa and Moreau2003; Burr et al. Reference Burr, Barleon, Jochmann and Tsinober2003). However, geometries with internal obstacles did not attract that much attention. Only a handful of numerical publications report on the subject (Bühler & Mistrangelo Reference Bühler and Mistrangelo2017; Mistrangelo, Bühler & Koehly Reference Mistrangelo, Bühler and Koehly2019; Mistrangelo et al. Reference Mistrangelo, Bühler, Brinkmann, Courtessole, Klüber and Koehly2023) along with recent attempts to simulate the flow in the entire breeding unit of a WCLL equatorial module (Tassone et al. Reference Tassone, Caruso, Giannetti and Del Nevo2019; Yan, Ying & Abdou Reference Yan, Ying and Abdou2020). Despite the current appeal for magneto-convection studies applied to fusion science, experimental investigations of buoyant heat transfer around pipes in the presence of a magnetic field are still lacking. The present work, therefore, constitutes the first endeavour to address this fundamental topic.
2. Definition of the problem
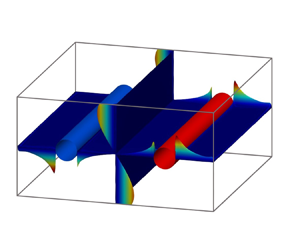
The generic problem investigated consists of an adiabatic electrically insulated rectangular cavity in which two parallel cylinders are inserted horizontally along the coordinate  $x$, as shown in figure 1. The characteristic length of the geometry $L$ is half the distance between the so-called Hartmann walls, which are perpendicular to the applied magnetic field. For non-dimensional notation, all lengths are scaled by $L$ such that the liquid metal is confined to ${-2 \leq x \leq 2}$, ${-1 \leq y \leq 1}$, ${-2 \leq z \leq 2}$. The directions of the magnetic field ${\boldsymbol {B} = -\mathit {B} \boldsymbol {\hat {y}}}$ and gravity ${\boldsymbol {g} = -\mathit {g} \boldsymbol {\hat {y}}}$ are aligned and anti-parallel to the $y$ coordinate vector. Walls parallel to the magnetic field are referred to as endwalls at ${x = \pm 2}$ and sidewalls at ${z = \pm 2}$. In the box-centred coordinate system, the axes of the cooled and heated cylinders are located at ${y = 0}$ and at ${z = 1}$ and ${z = -1}$, respectively, i.e. $L$ is also a typical scale for the distance of the cylinders that is relevant for the driving horizontal temperature gradient. In this set-up, the differential temperature $\Delta T$, i.e. the deviation from the mean temperature $\bar {T}$, is imposed by the two cylinders maintained at constant temperatures ${T_{1}=\bar {T}-\Delta T}$ and ${T_{2}=\bar {T}+\Delta T}$. Due to these thermal constraints, the temperature distribution in the liquid metal and, consequently, its density ${\rho (T)}$, are non-uniform in the cavity and give rise to driving buoyant forces.
Definition of the experimental problem.

The non-dimensional parameters quantifying the importance of electromagnetic, viscous and buoyant effects are the Hartmann number  $Ha$ and Grashof number $Gr$. More precisely, the ratio of electromagnetic to viscous forces is given by the square of the Hartmann number, and the Grashof number expresses the ratio of buoyant and viscous forces. These non-dimensional numbers are written as follows:
 \begin{equation} Ha = BL\sqrt{\frac{\sigma}{\rho\nu}},\quad Gr = \frac{g\beta\Delta TL^{3}}{\nu^{2}}. \end{equation}
The heat transfer is characterized by the non-dimensional Nusselt number
 \begin{equation} Nu=\frac{hL}{k}, \end{equation}
where the heat transfer coefficient  $h$ is determined later according to (3.1). The variables $\rho$, $\beta$, $\nu$, $k$ and $\sigma$ denote the density, coefficient of volumetric thermal expansion, kinematic viscosity and thermal and electrical conductivities of the liquid metal, respectively. In the present work, the thermophysical properties of the fluid, a gallium–indium–tin alloy (GaInSn), have been taken at the average temperature $\bar {T}$ as reported by Plevachuk et al. (Reference Plevachuk, Sklyarchuk, Eckert, Gerbeth and Novakovic2014).
For free convective flow in a magnetic field, the characteristic magnitude of velocity results from the balance of the buoyant and electromagnetic forces  ${u_{0} = \rho \beta g\Delta T / \sigma B^{2}}$ as outlined, e.g. by Hjellming & Walker (Reference Hjellming and Walker1987). With this definition, it follows that the Reynolds number ${Re = u_{0}L / \nu }$ is equivalent to the ratio ${Gr / {Ha}^{2}}$, and the square of the Lykoudis number ${Ly^{2} = {Ha}^{4} / Gr}$ corresponds to the interaction parameter representing the ratio of electromagnetic and inertia force.
3. Experimental set-up
3.1. The rectangular cavity
A detailed description of the experimental set-up shown schematically in figure 2 has been given by Koehly, Bühler & Mistrangelo (Reference Koehly, Bühler and Mistrangelo2019). The liquid metal is contained in a thermally and electrically insulated rectangular box  ${(200\ \mathrm {mm}\times 100\ \mathrm {mm}\times 200\ \mathrm {mm})}$. The walls of the test section are made of polyether ether ketone (PEEK) plastic, a material selected for its high service temperature and compatibility with the model fluid GaInSn. The decision to use this liquid metal alloy has been motivated by the ability to perform experiments at room temperature, given that the melting point of the alloy is just above $10\,^{\circ }{\rm C}$ (Plevachuk et al. Reference Plevachuk, Sklyarchuk, Eckert, Gerbeth and Novakovic2014). The test section is thermally insulated with $15\ \mathrm {mm}$ of insulation installed on its top and bottom walls and $50\ \mathrm {mm}$ on all four other lateral walls. With these extra layers, the insulated box can fit into the gap of the large dipole magnet available in the MEKKA laboratory at KIT, which is capable of generating a uniform field of up to $2.1\ \mathrm {T}$ within a volume of approximately ${(800\ \mathrm {mm}\times 168\ \mathrm {mm}\times 480\ \mathrm {mm})}$ (Barleon, Mack & Stieglitz Reference Barleon, Mack and Stieglitz1996).
Sketch of the test section with thermocouples, photographs of centre probe and pipes with internal copper cores that have groves for high-velocity flow of tempered water.

3.2. Differentially heated cylinders
The two horizontal cylinders immersed in the liquid metal have an outer diameter of  ${d = 22\ \mathrm {mm}}$ and are inserted $100\ \mathrm {mm}$ apart. The cylinders are made of an outer pipe containing an inner solid core forming eight channels in which tempered water is flown at high velocity and desired temperature (see figure 2). The internal cores and the outer tubes are made of copper to ensure a wall temperature as uniform as possible. Each pipe is connected to its own temperature-controlled water circuit, which includes a thermostat providing stable temperatures within ${\pm }0.05\,^{\circ }\mathrm {C}$. The mean pipe temperatures $T_{1}$ and $T_{2}$ are obtained from 8 thermocouples crimped between the inner core and the outer tube of each cylinder at various axial and circumferential locations, thereby also allowing us to assess the uniformity of the temperature distribution at the outer wall of the cylinders. The external surface of the tubes is coated with a $2\,\mathrm {\mu }\mathrm {m}$ thick silicon carbide layer to prevent corrosion from the liquid metal but is thin enough for its thermal resistance to be neglected. This coating also provides electrical insulation of the pipes, hence avoiding thermoelectric effects at the copper/GaInSn interface and prohibiting induced electric current from leaking into the pipes.
3.3. Instrumentation
The fully instrumented test section is shown in figure 3. It is equipped with thermocouples to monitor temperature at locations where most relevant phenomena have been identified by numerical simulations during a preliminary assessment (Koehly et al. Reference Koehly, Bühler and Mistrangelo2019). The details of the instrumentation are depicted in figure 2. Temperature distributions are measured along the magnetic field direction at the middle of an endwall at  ${(2, y, 0)}$ and on the sidewall closest to the hot pipe at ${(x_{{P}}, y, -2)}$ by two arrays of respectively 15 and 11 thermocouples embedded into the plastic plates. In addition, a multi-point thermal sensor, referred to as the centre probe, is inserted through a port on the top Hartmann wall for recording the vertical temperature profile in the centre of the cavity. This probe consists of 11 thermocouples mounted into a guided tube and evenly spaced across the inner height of the test section. Since the shaft of the probe is located in the centre of the cavity, the tips of these thermocouples protrude slightly out of the symmetry plane by $6.5\ \mathrm {mm}$ so that their non-dimensional position is ${x_{{P}} = -0.13}$. Finally, another set of 18 thermocouples is installed at the top fluid/wall interface to capture the temperature distribution at the Hartmann wall along the direction orthogonal to the pipes ${(x_{{P}},1,z)}$.
Photograph of the fully instrumented test section mounted on its levelled supporting frame. Before being inserted into the magnet, the test section was thermally insulated.

In order to extend the parametric study to lower Grashof numbers, for which only small driving temperature gradients are applied, the thermal field must be measured with great accuracy. For this reason, copper-constantan thermocouples (type-T) have been preferred to minimize thermomagnetic effects and associated errors (Kollie et al. Reference Kollie, Anderson, Horton and Roberts1977). All signals are recorded with respect to a high-stability ice-point reference system (Kaye K170) accurate to  $0.02\,^{\circ }\mathrm {C}$, and thermoelectric voltages are measured with a system (Beckhoff KL3312) offering a resolution of $1\,\mathrm {\mu }\mathrm {V}$, which corresponds to approximately $0.025\,^{\circ }\mathrm {C}$ in the range of temperatures explored. Therefore, the uncertainty on temperature measurements is considered to be less than $0.05\,^{\circ }\mathrm {C}$.
The heat transferred between the cylinders and the liquid metal is indirectly measured by quantifying the amount of heat exchanged between the tempered water flows and the copper pipes. To determine these heat fluxes, each temperature-controlled circuit is equipped with a flowmeter recording the water mass flow rate  $\dot {m}$, and a pair of thermocouples positioned upstream and downstream of the inner cores help assess the temperature variation $\Delta T_{x}$ along the pipe axes. Assuming that the box is insulated well enough to neglect external heat exchanges and that the liquid metal flow is steady state or statistically established in case of turbulence, the heat fluxes on both cylinders become equal in magnitude and can be derived from the amount of heat released at the hot pipe, or absorbed at the cold pipe
 \begin{equation} {\rm \pi}dl_{x}h\Delta T=-\dot{m}c_{p}\Delta T_{x}. \end{equation}
Here,  ${\rm \pi} dl_{x}$ is the exchange area between a cylinder and the liquid metal (see figure 1), $h$ the average heat transfer coefficient and $c_{p}$ the specific heat of water evaluated at the temperatures $T_{1}$ and $T_{2}$ of the cooling and heating circuits, respectively. To ensure accurate measurements, a high-precision digital multimeter (Prema 8017) is used to directly measure thermoelectric voltages between the two junctions at the entrance and exit of the pipes with an accuracy of $0.6\,\mathrm {\mu }\mathrm {V}$, corresponding to an uncertainty of $0.015\,^{\circ }\mathrm {C}$ on $\Delta T_{x}$, and mass flow rate readings are returned by the flowmeters with a relative error of less than $2.5\,\%$.
It is worth noting that, from a technical point of view, it is impossible to precisely achieve isothermal conditions along the cylinders with the present set-up despite the desirable need for well-defined boundary conditions. Nevertheless, it is possible to keep  $\Delta T_{x}$ small enough in comparison with the driving temperature difference $\Delta T$ to consider that the axial temperature gradients along the cylinders have a negligible impact on the flow. For instance, at the highest temperature difference explored for $Gr = 5\times 10^{7}$, the ratio $\Delta T_{x}/\Delta T$ does not exceed $3\,\%$ in the hydrodynamic case ( $Ha=0$). With increasing magnetic field this value rapidly decreases below $1\,\%$ when magnetic braking in the liquid metal reduces heat transfer (e.g. $\Delta T_{x}/\Delta T = 0.007$ for $Ha = 3000$).
3.4. Experimental procedure
Before completing the assembly of the experimental apparatus, the inner walls of the cavity and the coated pipes were brushed with GaInSn to provide adequate wetting of the liquid metal with all internal surfaces of the cavity as suggested by Morley et al. (Reference Morley, Burris, Cadwallader and Nornberg2008).
The test section was then installed on a sliding frame and levelled to ensure its correct alignment with respect to gravity, as shown in figure 2. After filling up the box with GaInSn and testing the instrumentation, the set-up was thermally insulated to the greatest extend possible before being moved into the magnet gap. In order to minimize undesirable but also unavoidable external heat exchange, both open ends of the magnet gap were sealed off and the magnet's cooling rate was adjusted to keep the ambient temperature in the gap close to the average temperature  $\bar {T}=(T_{1}+T_{2})/2$ of the liquid metal at all times throughout the experimental campaign.
Experiments were carried out for magnetic fields of up to  $1.5\ \mathrm {T}$ and for several temperature differences $\Delta T$ ranging from less than $2\,^{\circ }\mathrm {C}$ to almost $70\,^{\circ }\mathrm {C}$. During the experimental campaign, the lowest temperature $T_{1}$ of the cold pipe was not set to less than $12\,^{\circ }\mathrm {C}$ to prevent the liquid metal from freezing, and the highest temperature $T_{2}$ of the hot pipe was limited to the maximum operating temperature of the thermostat on the hot circuit, namely $80\,^{\circ }\mathrm {C}$. In both temperature-controlled circuits, the water was flown at approximately the same flow rate of $1\ {\rm m}^{3}\ {\rm h}^{-1}$ corresponding to the highest value allowed by the equipment. This setting was found to offer a good trade-off between the necessity of establishing nearly isothermal conditions along the cylinders while ensuring a large enough water temperature variation in the pipes $\Delta T_{x}$ to accurately measure the heat transfer coefficient. After setting up the temperatures of the pipes, and adjusting the strength of the magnetic field, transient temperature fields were monitored and data were collected once thermal steady state was reached, which could take an hour or more.
For reference, typical physical parameters (temperatures and magnetic field strength) associated with targeted non-dimensional values of  ${Gr}$ and ${Ha}$ explored in this study are summarized in table 1.
Examples of cold ( ${T_1}$), hot ( ${T_2}$) and mean ( $\bar {T}$) temperatures for selected Grashof numbers, and magnitudes of the magnetic field ( ${B}$) for some Hartmann numbers.

4. Experimental results
Results for temperature shown in the following represent average values from 1090 samples collected at a rate of 2 samples per second. For a universal representation of temperature data, a non-dimensional notation is chosen as
 \begin{equation} T^{*}=\frac{T-\bar{T}}{\Delta T}, \end{equation}
i.e. deviation from the mean temperature is measured in multiples of  $\Delta T$. With this scale, the non-dimensional temperatures of the cylinders become ${T_{1}^{*} = -1}$ and ${T_{2}^{*}=1}$. It seems worth pointing out that, with the choice of $\Delta T$ introduced above, the applied horizontal temperature gradient driving the buoyant motion is equal to unity in non-dimensional representation. In the rest of the text, the star notation for dimensionless quantities is omitted for simplicity.
From figure 4 one receives an impression about temperature fields  ${T(0, y, z)}$ in the middle of the cavity for two cases, pure heat conduction when the fluid velocity is zero (left) and a case for which convective heat transfer is dominant (right). The result for ${Gr = 0}$ is obtained by solving only the heat equation without flow and the convective case has been calculated by solving the three-dimensional MHD equations where buoyancy is considered via the Boussinesq approximation (for more details see e.g. Mistrangelo et al. Reference Mistrangelo, Bühler, Brinkmann, Courtessole, Klüber and Koehly2023). It is obvious that in the absence of fluid motion, pure heat conduction yields zero non-dimensional temperature along the vertical symmetry plane, as sketched in figure 4(a) showing a vertical isotherm ${T = 0}$ at ${z = 0}$ (green line). Deviations of ${T(0, y, 0)}$ from zero may result from convective heat transfer illustrated, for instance, in figure 4(b) for low Hartmann number ${(Ha = 45)}$ and for ${Gr = 3\times 10^{7}}$. In the presence of a weak magnetic field, or when no magnetic field is applied, a hot plume rises up from the heated cylinder, thus feeding the top layers with warm fluid and mixing it. On the other end, streams of fluid fall down around the cold cylinder, supplying the lower plenum with chilled liquid metal. As a result, the thermal field becomes stratified with isotherms preferentially oriented horizontally.
Computed isotherms of the temperature field  $T(0,y,z)$ for two typical cases: (a) pure heat conduction ${(Gr = 0)}$ yielding ${Nu_{0} = 1.33}$; (b) magneto-convection at ${Gr = 3\times 10^{7}}$ and low Hartmann number ${(Ha = 45)}$ exhibiting horizontal thermal stratification. The temperature difference between isotherms is ${\delta T = 0.1}$. Coloured lines (red, green, blue) mark ${T = 1, 0, -1}$, respectively.

With the insight gained from the discussion of figure 4, it is straightforward to understand and interpret the measured data displayed in the following through figures 5–17.
Non-dimensional temperature distribution along the vertical direction in the centre of the cavity  ${T(x_{{P}}, y, 0)}$ for varying Grashof numbers and ${Ha = 0}$.

4.1. Ordinary hydrodynamic flow  ${(Ha = 0)}$

The discussion of experimental results starts with the hydrodynamic case  ${Ha = 0}$. Figure 5 shows the temperature distribution measured with the centre probe ${T(x_{{P}}, y, 0)}$ for various Grashof numbers in the range ${10^{6}\leq Gr\leq 5\times 10^{7}}$. It can be seen that, for all investigated values of $Gr$, the liquid metal exhibits a pronounced stratification with warmer fluid staying on top of colder layers. Since all non-dimensional temperature profiles nearly collapse onto a single line, one can conclude that thermal stratification caused by strong convection is present even for the smallest Grashof value considered in the present study, i.e. ${Gr = 10^{6}}$, for which the applied temperature difference $\Delta T$ is less than $0.7\,^{\circ }\mathrm {C}$. Unfortunately, inferring flows at smaller $Gr$ is too difficult due to limitations in resolving temperature with sufficient accuracy at such tiny temperature differences.
The pronounced stratification is not limited to the vicinity of the centre probe. Comparing temperature profiles from various locations in the box, as shown in figure 6, reveals that vertical temperature distributions are nearly identical, thus confirming that isotherms are horizontal throughout the entire cavity, at least at some distance from the cylinders.
Comparison of non-dimensional temperature profiles measured along the vertical direction in the centre of the cavity  ${T(x_{{P}}, y, 0)}$, at the endwall ${T(2, y, 0)}$, and at one sidewall ${T(x_{{P}}, y, -2)}$ for ${Gr = 2.5\times 10^{7}}$ and ${Ha = 0}$.

4.2. Magneto-convective flow ${(Ha \gg 1)}$

Magnetohydrodynamic experiments were performed for various magnetic fields ranging from  $25\ \mathrm {mT}$ to $1.5\ \mathrm {T}$, corresponding to ${50 \leq Ha \leq 3000}$, and for the same Grashof numbers investigated above for ${Ha = 0}$. Depending on the strength of the magnetic field and the intensity of the differential heating, the temperature distributions resulting from the magneto-convective flow exhibit different patterns. The magnetic damping of convection is first illustrated by the results presented in figures 7–9 that are obtained for a fixed Grashof number ${Gr = 2.5\times 10^{7}}$ and gradually increasing Hartmann numbers. In subsequent analyses, the Hartmann number is set to selected values while $Gr$ is varied to give a complete overview of the physical phenomena involved.
In figure 7, temperature profiles measured along the magnetic field direction in the centre of the cavity are plotted for various Hartmann numbers. As  $Ha$ increases, the vertical temperature amplitude first grows to reach a maximum value for ${Ha \simeq 200}$, before monotonically decreasing to almost nothing at the strongest magnetic field applied. This behaviour can possibly be explained by the fact that the application of the magnetic field initially results in the suppression of turbulent mixing in the hot and cold layers at small Hartmann numbers, which leads to a more pronounced stratification with even warmer temperatures near the top wall and colder ones at the bottom of the cavity. Beyond ${Ha = 200}$, magnetic braking reduces the fluid velocity, causing a substantial impediment to the convective heat transfer until eventually, for very large $Ha$, convective transport seemingly disappears. The vertical temperature gradient in the centre of the cavity ${\partial _{y}T(x_{{P}}, 0, 0)}$, which is used in the following to describe the degree of thermal stratification, is correlated to the intensity of the convective heat transfer. As the Hartmann number increases, this quantity gradually approaches zero, signalling that thermal conduction emerges as the dominating heat transfer mechanism. This is evident from data obtained at the highest Hartmann number presently investigated ${(Ha \simeq 3000)}$ as the temperature along $y$ becomes almost constant and equal to the average temperature of the pipes ${T \approx \bar {T} = 0}$. However, one must note that small residual values of ${\partial _{y}T}$ indicate that the purely conductive state is not yet fully reached in the present ${(Gr,Ha)}$ parametric study.
Non-dimensional temperature distribution along the vertical direction in the centre of the cavity  ${(x_{{P}}, y, 0)}$ for ${Gr = 2.5\times 10^{7}}$ and ${0 \leq Ha \lesssim 3000}$.

The arguments advanced above to interpret the intensified stratification at low or moderate Hartmann numbers are supported by a statistical analysis of the data recorded at the centre probe. Profiles of standard deviation of temperature derived from samples of 1090 data points collected at equidistant times are shown in figure 8 for  ${Gr = 2.5\times 10^{7}}$. Results for ${Ha = 0}$ reveal the occurrence of an unsteady or turbulent convective cell located between the cylinders. Temperature fluctuations remain small, and the maximum standard deviation stays below $1.5\,\%\ (0.6\,^{\circ }\mathrm {C})$ when no magnetic field is applied. Recordings obtained in the presence of external magnetic fields show a strong suppression of temperature oscillations in the core flow, even at the lowest magnetic fields investigated here. Since the statistical amplitude of the signals is of the same order or smaller than the resolution of the measurements for ${Ha \geq 50}$, we can only conclude that these oscillations, if they still exist, are smaller than the resolution of the measurement system, i.e. smaller than $0.05\,^\circ \mathrm {C}$.
Profiles of standard deviation of temperature along the vertical direction in the centre of cavity  ${(x_{{P}}, y, 0)}$ for ${Gr = 2.5\times 10^{7}}$.

It is worth highlighting that, for intermediate Hartmann numbers, e.g. for  ${Ha = 502}$ and $716$, some measurable temperature fluctuations occur again near the top and bottom walls. Although these fluctuations have larger magnitudes near the Hartmann walls on which they are also observable, they extend quite far into the fluid domain so that it may be difficult to attribute them to a destabilization of the Hartmann layer in that range of parameters. For higher Hartmann numbers, ${Ha \gtrsim 1000}$, the magnetic damping is large enough that no fluctuations can be detected anymore.
Given that the magnetic field may sufficiently brake the flow to almost completely suppress convective heat transfer, it is evident that the thermal stratification with initially horizontal isotherms observed for hydrodynamic and small Hartmann number flows progressively tilts as  $Ha$ increases until isotherms become vertical in the centre of the cavity. Results discussed above for the centre of the cavity and displayed in figure 7 support this description. The anticipated flow behaviour is further backed by measurements on the fluid–wall interface presented, for instance, in figure 9 where temperature distributions along the sidewall ${T(x_{{P}}, y, -2)}$ and the Hartmann wall ${T(x_{{P}}, 1, z)}$ are shown for the same Grashof number as that discussed above, ${Gr = 2.5\times 10^{7}}$. For the smaller Hartmann numbers, one can clearly observe a horizontal thermal stratification with a pronounced temperature gradient along $y$ and constant temperature along $z$. With increasing magnetic field, the sidewall close to the hot pipe at ${z = -2}$ becomes uniformly warm, with only slight temperature drops near the corners caused by heat conduction around the cylinders within the almost stagnant fluid. In contrast, the top Hartmann wall gradually transitions from being isothermal at ${Ha = 0}$ to exhibiting ample horizontal temperature variations with warmer fluid confined on the hot pipe side ( ${z < 0}$) and colder liquid metal stranded on the opposite cold pipe side ( ${z > 0}$). Figure 9 further illustrates that, with increasing $Ha$, results converge towards the (red) line obtained theoretically for pure heat conduction, i.e. for ${Gr = 0}$, for which the complete temperature field is displayed in figure 4. Although the conductive thermal state is nearly reached at the highest Hartmann number investigated, the theoretical curve is not yet met at ${Ha = 2990}$ due to some residual convection still present and already discussed above. This observation could also result from small parasitic heat exchange with the ambient atmosphere despite all efforts to mitigate external heat transfer.
Non-dimensional temperature distribution  ${T(x_{{P}}, y, -2)}$ in the middle plane along the sidewall and ${T(x_{{P}}, 1, z)}$ along the top Hartmann wall for ${Gr = 2.5\times 10^{7}}$ and various Hartmann numbers $Ha$. The solid red line represents a theoretical result for pure heat conduction with ${Gr = 0}$.

The comparison of data recorded in the centre of the cavity and at the endwall shown in figure 10 for  ${Gr = 4.5\times 10^{6}}$ suggests that temperatures are no longer uniform along the direction of the cylinders ( $x$-axis) once a magnetic field is imposed. While temperature distributions ${T(2, y, 0)}$ close to the endwall and ${T(x_{{P}}, y, 0)}$ in the centre of the cavity are comparable for hydrodynamic (see figure 6) and low Hartmann number flows, e.g. ${Ha \lesssim 100}$, the profiles separate from each other with a stronger magnetic field. For instance, for ${Ha = 480}$ and $993$, the temperature magnitude at the endwall is $3.3$ and $4.8$ times larger than in the centre of the cavity, respectively. At the highest Hartmann number, ${Ha = 2990}$, the temperature variation at the endwall remains distinguishably larger than the one in the centre, where the temperature tends to become almost constant as a result of the suppression of the convective motion by the strong magnetic field. This observation clearly indicates that a more intense convection motion associated with enhanced heat transfer occurs in the field-aligned boundary layers of thickness ${\delta \sim Ha^{-1/2}}$ located near the endwalls where axial currents induced by the core flow close. Here, components of current perpendicular to $\boldsymbol {B}$ are locally less than in the centre of the cavity, which leads to much weaker flow-opposing Lorentz forces. These observations are in agreement with numerical simulations for the present problem performed by Mistrangelo et al. (Reference Mistrangelo, Bühler, Brinkmann, Courtessole, Klüber and Koehly2023). This situation is similar to that observed for magnetic Rayleigh–Bénard convection, for which Houchens, Witkowski & Walker (Reference Houchens, Witkowski and Walker2002) find that ‘for all moderately large values of $Ha$, the only significant convective heat transfer is confined to the parallel layer’. The conclusion by the latter authors has been confirmed with more recent numerical simulations by Liu, Krasnov & Schumacher (Reference Liu, Krasnov and Schumacher2018), Zürner et al. (Reference Zürner, Schindler, Vogt, Eckert and Schumacher2020) or McCormack et al. (Reference McCormack, Teimurazov, Shishkina and Linkmann2023), where higher heat transfer along field-aligned walls has been attributed to the existence the so-called wall modes.
Comparison of non-dimensional temperature distributions measured along the vertical direction in the centre of the cavity  $T(x_{{P}},y,0)$ (filled symbols) and at the middle of the endwall ${T(2, y, 0)}$ (open symbols) for ${Gr = 4.5\times 10^{6}}$ and ${Ha = 99}$, $480$, $993$ and $2990$.

While vertical temperature distributions are displayed for only four selected Hartmann numbers in figure 10, a detailed analysis of the magnetic damping in the centre of the cavity and at the endwalls has been performed for all magnetic fields. Results are summarized in figure 11, where the vertical components of temperature gradients  $\partial _{y}T(x_{{P}}, 0, 0)$ at the centre of the cavity and $\partial _{y}T(2, 0, 0)$ in the middle of the endwall are displayed. For hydrodynamic flow with ${Ha = 0}$, one can notice comparable temperature gradients measured by the centre probe and near the endwall. The slightly smaller gradient detected close the endwall may be the result of reduced convection caused by the wall shear stress. There could additionally be some minor parasitic conjugate heat flux along the endwall that would also support this observation. Owing to turbulence suppression by the magnetic field, the vertical temperature gradients first increase both in the centre of the cavity and at the endwall to reach a maximum value of approximately $1.2$ as $Ha$ grows, before decreasing as the magnetic field further strengthens. However, one should note that the vertical temperature gradient, and thus the intensity of the convective transfer, decays much faster with increasing Hartmann number in the centre of the test section than near the endwall. In the range of magnetic fields investigated, the vertical gradient in the core flow appears to vanish at a pace proportional to $Ha^{-2}$, whereas the rate of decay near the endwall is closer to $Ha^{-3/2}$. Results therefore suggest that the intensity of the convective heat transfer quantified by $\partial _{y}T$ diminishes slower near the endwall than in the centre of the cavity by a factor of $\sqrt {Ha}$.
Suppression of convective heat transfer with increasing magnetic field. Comparison of vertical temperature gradients measured in the centre of the cavity  $\partial _{y}T(x_{{P}}, 0, 0)$ and at the endwall $\partial _{y}T(2,0,0)$ as a function of $Ha$ for ${Gr = 4.5\times 10^{6}}$.

When comparing data obtained for various applied temperature differences, i.e. different  $Gr$, and growing Hartmann numbers, one may notice that it takes progressively stronger buoyancy forces to overcome the increasingly higher magnetic braking (see figure 12). For instance, experiments carried out for ${Ha \approx 500}$ show that buoyant flow is sufficiently attenuated for conduction to become the predominant heat transfer mode for $Gr\,{\lesssim}\,2\,{\times}\,10^{6}$. When the Hartmann number increases to ${Ha \approx 750}$, the same conditions occur as long as ${Gr \lesssim 5\times 10^{6}}$, and for ${Ha \approx 1000}$, conductive heat transfer remains preeminent for ${Gr \lesssim 10^{7}}$.
Non-dimensional temperature distribution  ${T(x_{{P}}, y, -2)}$ in the middle plane along the sidewall and ${T(x_{{P}}, 1, z)}$ along the top Hartmann wall for various Grashof numbers $Gr$ and $Ha \approx 500$ (a), 750 (b) and 1000 (c).

The competition between the buoyancy force promoting the convective flow and the electromagnetic force suppressing it is clearly highlighted in figures 13, where temperature profiles measured along the centre probe at  $x_{{P}}$ are plotted for various Grashof and Hartmann numbers. The results collected for different $(Gr,Ha)$ demonstrate that the magneto-convective flow is controlled by a single similarity parameter $Gr/{Ha}^{2}$ since data collapse to unique distributions for the same quantity $Gr/{Ha}^2$ at all measurement locations. As confirmed by the results obtained at the sidewall and along the Hartmann wall, shown in figure 14, this behaviour is predominant for most of the fluid domain at some sufficient distance from the endwalls.
Non-dimensional temperature distributions  ${T(x_{{P}}, y, 0)}$ along the vertical direction in the centre of the cavity for various $Gr/Ha^{2}$.

Non-dimensional temperature distribution  ${T(x_{{P}}, y, -2)}$ in the middle plane along the sidewall and ${T(x_{{P}}, 1, z)}$ along the top Hartmann wall for various $Gr/{Ha}^{2}$.

The universality of the scaling law observed is confirmed by plotting the vertical temperature gradient  $\partial _{y}T(x_{{P}}, 0, 0)$ measured in the centre as a function of the ratio $Gr/{Ha}^{2}$ in figure 15. It is worth emphasizing that all 221 points of the parametric study obtained for different $Gr$ and $Ha$ fall onto a single curve that hints at several flow and heat transfer regimes:
(i) For
${Gr/{Ha}^{2} \lesssim 1}$, ${\partial _{y}T(x_{{P}}, 0, 0) \simeq 0}$ indicates a conduction-dominated regime where isotherms are essentially vertically oriented as a result of the flow suppression by the electromagnetic force.(ii) For
${1 \lesssim Gr/{Ha}^{2} \lesssim 1000}$, ${\partial _{y}T(x_{{P}}, 0, 0)}$ increases with $Gr/{Ha}^{2}$, implying tilted isotherms resulting from a magneto-convective flow regime where the electromagnetic force balances the buoyancy force.(iii) For
${Gr/{Ha}^{2} \gtrsim 1000}$, ${\partial _{y}T(x_{{P}}, 0, 0)}$ becomes constant (${\simeq }1.2$) and independent of $Gr/{Ha}^{2}$. The large vertical temperature gradient likely testifies to a laminar buoyancy-dominated flow regime characterized by a stratified temperature field with horizontal isotherms.(iv) Finally, for turbulent buoyant flow observed in the absence of magnetic field, i.e. when
${Gr/{Ha}^{2} \rightarrow \infty }$ for ${Ha \rightarrow 0}$, the vertical temperature gradient drops to ${\partial _{y}T = 0.656}$ as shown for instance in figure 11.


Vertical component of the temperature gradient  $\partial _{y}T(x_{{P}}, 0, 0)$ measured in the centre of the cavity as a function of the combined parameter $Gr/{Ha}^{2}$. The value indicated as the turbulent hydrodynamic limit as ${Ha \rightarrow 0}$ has been measured for ${Gr = 2.5\times 10^{7}}$.

Near the endwall, the convective heat transfer scales differently than in the core, as suggested by the analysis of the vertical temperature gradient displayed in figure 16. The results indicate that the combined parameter  $Gr/{Ha}^{3/2}$, rather than $Gr/{Ha}^{2}$ as in the core, appears more appropriate to describe the flow regime resulting from the balance of electromagnetic and buoyancy forces. Here, the non-zero positive values of the vertical component of the temperature gradient observed at the lowest values of $Gr/{Ha}^{3/2}$ investigated demonstrate that a residual convective flow motion persists in the layers near the endwalls, even when the flow has been nearly fully damped in the core. Finally, for ${Gr/{Ha}^{3/2} \gtrsim 7000}$, the vertical temperature gradient decreases after reaching a maximum value of approximately $1.2$, which seems to indicate the development of instabilities or turbulence in the parallel layers located at the endwalls of the cavity.
Vertical component of the temperature gradient  $\partial _{y}T(2, 0, 0)$ measured at the endwall as a function of the combined parameter $Gr/{Ha}^{3/2}$.

It is interesting to compare the temperature gradient in the centre of the box,  $\partial _{y}T(x_{{P}}, 0, 0)$, with that at the midpoint of the endwall, $\partial _{y}T(2, 0, 0)$, to characterize the intensity of convection in the core relative to the endwall layers. This is done in figure 17, which displays the ratio of both quantities. When plotted against the parameter $Gr/{Ha}^{2}$, three very characteristic regimes can clearly be identified.
Ratio of vertical temperature gradients measured in the centre of the cavity and at the endwall as a function of the combined parameter  $Gr/{Ha}^{2}$.

For small values such as  ${Gr/{Ha}^{2} \lesssim 5}$, the ratio of temperature gradients seems to approach a constant value ${\partial _{y}T_{{P}}/\partial _{y}T_{{EW}} \thickapprox 0.136}$. This asymptotic behaviour is possibly the result of increasing velocity in the endwall boundary layers when the core flow velocity diminishes as the Hartmann number gets larger. As demonstrated by numerical simulations performed by Mistrangelo et al. (Reference Mistrangelo, Bühler, Brinkmann, Courtessole, Klüber and Koehly2023) for flows at ${Gr = 2.5\times 10^{7}}$, the heat convected surges locally in the endwall boundary layer with increasing $Ha$ to compensate for weaker convective transport in the core of the flow. This situation is analogue to earlier observations of pressure-driven flows in conducting ducts made by Walker (Reference Walker1981) or Tillack & McCarthy (Reference Tillack and McCarthy1989) where, as a result of sidewall layers becoming thinner when the magnetic field strengthens, the velocity in the boundary layer increases such that the ratio of flow carried by the sidewall jet and by the core flow remains constant.
With stronger buoyancy force or weaker magnetic braking, for  ${5 \lesssim Gr/{Ha}^{2} \lesssim 100}$, an intermediate flow regime is identified in which the amount of heat transported in the endwall layers progressively reduces compared with that in the core. In this domain, the ratio of vertical temperature gradients $\partial _{y}T_{{P}}/\partial _{y}T_{{EW}}$ grows linearly with $Gr/{Ha}^{2}$ as long as the flow remains laminar in the entire cavity.
Finally, for  ${Gr/{Ha}^{2} \gtrsim 500}$, the ratio of temperature gradients apparently approaches a logarithmic law with values larger than unity, evoking the law of the wall of a wall-bounded turbulent flow. Now, the convective heat flux in the layer is less important than in the core.
4.3. Heat transfer with the presence of a magnetic field
The heat transfer rates were quantified by measuring the amount of heat exchanged at the cylinders for various Grashof and Hartmann numbers. The time-averaged Nusselt numbers deduced from the measurements are plotted against the quantity  $Gr/{Ha}^{2}$ in figure 18. The results confirm the occurrence of several heat transfer regimes associated with the flow regimes identified above.
Nusselt numbers measured for various  $(Gr,Ha)$.

At the lowest values of  $Gr/{Ha}^{2}$ investigated, i.e. ${Gr/{Ha}^{2} \lesssim 10}$, the purely conductive regime is confirmed since the Nusselt numbers approach a constant value. The experimental data suggest an asymptotic value of $Nu$ close to the theoretical prediction ${Nu_{0} \approx 1.33}$ obtained by the numerical calculation of pure heat conduction, as shown above in figure 4 or reported by Mistrangelo et al. (Reference Mistrangelo, Bühler, Brinkmann, Courtessole, Klüber and Koehly2023).
For  ${30 \lesssim Gr/{Ha}^{2} \lesssim 500}$, the heat transfer varies as ${Nu \sim (Gr/{Ha}^{2})^{1/3}}$.
Finally, as  $Gr/{Ha}^{2}$ further increases, an inflection in $Nu$ growth can be observed as the flow likely becomes turbulent in the layers near the endwalls.
Alternatively, the pure convective part of heat transfer as  $Nu-Nu_{0}$ is displayed in figure 19. When the flow is laminar both in the core and in the layers near the endwalls, for ${Gr/{Ha}^{2} \lesssim 200}$, the convective heat transport increases proportional to the combined parameter $Gr/{Ha}^{2}$. This result is not surprising as, in this flow regime characterized by a balance between the driving buoyancy force and the braking electromagnetic force, the characteristic velocity of the fluid writes as $u_{0}=\nu /L Gr/{Ha}^{2}$. For higher values ${Gr/{Ha}^{2} \gtrsim 500}$, a different heat transfer regime occurs when the flow becomes turbulent in the endwall layers with an increase of convective heat transfer as ${Nu-Nu_{0} \sim (Gr/{Ha}^{2})^{1/4}}$.
Data from figure 18 re-plotted to show only the convective part of the Nusselt number, i.e.  $Nu-Nu_{0}$, where ${Nu_{0} = 1.33}$ has been used.

5. Conclusions
Magneto-convection around two differentially heated horizontal circular cylinders immersed in a pool of liquid metal confined to a rectangular cavity has been investigated experimentally. Besides the fundamental MHD aspect of this topic, magneto-convection around internal obstacles has engineering applications in the development of liquid metal breeder blankets for future magnetic confinement fusion reactors. The temperature difference between the cylinders, denoted in non-dimensional terms by the Grashof number  $Gr$, generates density gradients in the fluid that drive the buoyant motion. In the presence of a vertical magnetic field $\boldsymbol {B}$, quantified by the Hartmann number $Ha$, flow-induced electric currents give rise to electromagnetic Lorentz forces opposing the fluid motion. In a detailed parametric study, $Gr$ and $Ha$ have been varied over a wide range in order to achieve a good overview of temperature distributions, heat transfer and possible flow regimes depending on these governing parameters.
For hydrodynamic and low Hartmann number flows, the experimental investigation reveals that the temperature field becomes stratified with horizontal isotherms. A plume of fluid rises up from the hot cylinder and feeds and mixes the warm layer beneath the top wall of the box. The liquid metal releases heat when flowing down around the cold cylinder, thus supplying the bottom layer with chilled fluid. With increasing magnetic field or smaller driving temperature gradient, isotherms tilt and eventually become aligned with the vertically oriented magnetic field when convection is sufficiently damped by magnetic braking. The present experiments suggest that the magneto-convective flow is controlled by the single combined parameter  $Gr/{Ha}^{2}$ rather than by $Ha$ or $Gr$ independently. This parameter can be interpreted as a Reynolds number based on a velocity scale derived from the balance of buoyancy and electromagnetic forces. The results show that the electromagnetic force almost entirely suppresses the convection motion in the core of the flow for the lowest values of $Gr/{Ha}^{2}$. It results in a conduction-dominated heat transfer regime for which weak buoyant flow may only be occurring in the boundary layers aligned with the magnetic field along the endwalls of the box, where currents with smaller components perpendicular to $\boldsymbol {B}$ induces less magnetic damping than in the core. Strongest flows with highest heat transfer occur at largest values of $Gr/{Ha}^{2}$ considered. For such flows, the effect of the electromagnetic force primarily consists in suppressing turbulence, resulting in laminarization of the flow. In the present study, the average heat transfer rate at the cylinders has been quantified, and the dependence of the non-dimensional Nusselt number $Nu$ on $Gr/{Ha}^{2}$ has been discussed. While implicit to the definitions, it is worth mentioning that $Gr/{Ha}^{2}$ represents the ratio of buoyancy to electromagnetic forces. In that sense it is not surprising that it controls transitions between buoyancy-dominated and Lorentz-force-dominated flow regimes, as reported for instance in previous works combining convection and magnetic fields (Akhmedagaev et al. Reference Akhmedagaev, Zikanov, Belyaev and Listratov2023).
Unfortunately, the opaque liquid metal does not provide optical access to the fluid and excludes standard velocimetry techniques usually employed in transparent fluids. Attempts to obtain velocity signals from ultrasonic Doppler velocimetry were unsuccessful because the liquid metal was too pure, i.e. not seeded with enough oxide particles to reflect ultrasound back, or because velocities were too small to be inferred by this technique. For this reason, the velocity field remains hidden in the present experimental investigation. Readers interested in details of flow patterns can refer to the corresponding theoretical analysis of the problem by numerical simulations presented by Mistrangelo et al. (Reference Mistrangelo, Bühler, Brinkmann, Courtessole, Klüber and Koehly2023).
Funding
This work has been carried out within the framework of the EUROfusion Consortium, funded by the European Union via the Euratom Research and Training Programme (grant agreement no. 101052200 – EUROfusion). Views and opinions expressed are, however, those of the author(s) only and do not necessarily reflect those of the European Union or the European Commission. Neither the European Union nor the European Commission can be held responsible for them.
Declaration of interests
The authors report no conflict of interest.


 Open access

