
Introduction
The slave trades out of Africa were undoubtedly some of the most significant elements of global history during the early modern period, from the fifteenth century to the nineteenth. The transatlantic trade connected all the major continents of the world, most evidently Europe, Africa, and the Americas (in what has been dubbed the ‘Triangular Trade’), but tying in Asian economies through a demand for Asian goods that could be bartered for slaves in Africa. During the same period there was also an important trade in slaves and other commodities connecting Africa to the Middle Eastern and Asian economies. The impact of these global connections on various other societies connected to this trade has been highly debated in the existing literature.
There has been a major controversy over whether the impact of the slave trades on African societies was negative (for example, in the form of increased levels of violence and warfare, demographic losses, and hindrance to the development of commercial markets), or whether African societies were resilient enough to withstand any substantial negative impact.Footnote 1 The role of the massive importation of African slaves in the development of the Americas has also been quite controversial. There is no doubt that, to a very large extent, the expansion of the American plantation complex was based upon the exploitation of slave labour in several parts of the Americas. One interpretation, however, views slavery as a factor for stagnation, or even decline, in the further socioeconomic development of these regions.Footnote 2 By contrast, in recent years new findings have suggested that the American slave plantation complex was often highly efficient in exploiting enslaved labourers. A significant increase in productivity over time has been argued to have been driven by improved crop varieties.Footnote 3 Other scholars have emphasized an intensifying oppression and coercion of slaves, forcing them to work harder.Footnote 4 Additionally, it has been suggested that offering inducements to slaves – in effect, wages – drove greater efficiency.Footnote 5 The impact of the transatlantic trade in slaves in Asia has so far not received as much scholarly attention, but it was undoubtedly an important element in this picture, since one of the important categories of goods that the Europeans bartered in exchange for slaves in Africa was Indian textiles, thus expanding the market for Indian textile production.Footnote 6
The transatlantic slave trade did have intimate connections to several European economies, but the consequences have also been fiercely debated. This scholarly debate has primarily focused on the British transatlantic slave trade and British connections to the American plantation complex. One important reason for this focus on Britain was no doubt the publication of Eric Williams’ much-cited book Capitalism and slavery, first published in 1944. In this book, Williams argued that British participation in the transatlantic slave trade played a key role in the British industrial revolution. This argument has generated a great amount of research, not the least concerning the level of the profits from this trade.Footnote 7 Some scholars have then moved on to discuss the wider importance of the profits from the slave trade, for example by comparing the percentage of profit with national income or investments in industrializing Britain. A debate has thereby ensued over whether the profits from the slave trade were large enough to actually play any substantial role in Britain’s economic development. The issue has remained highly controversial, and individual historians often seem to talk past each other. Many scholars, apparently influenced by dependency theory, or studying global history, agree with the essence of Eric Williams’ argument, sometimes to the point of finding it almost obvious that the slave trade played an important role in the development of Britain and other countries that participated in the slave trade. However, a number of other scholars, possibly mainly economic historians, dismiss Williams’ claims, arguing that the trade, and the profits accruing from it, were too small to really matter for the British economy, let alone the economy of the whole of Europe. No consensus has so far been reached.Footnote 8
Against this background, some scholars have turned to counterfactuals. One such hypothesis, for example, contends that, if the British economy had not participated in the slave trade, the economic resources devoted to activities in that trade would have been used for something else, and the manufactures sold in exchange for slaves or plantation produce would have found alternative markets. Another counterfactual argues that, even if the British economy had not had access to vast amounts of land in the Americas (worked in part by African slaves), raw materials for the industries could have been imported from elsewhere in the world, without any significant negative effect upon the national economy.Footnote 9
The assumptions underlying such counterfactual models can be quite controversial. For instance, the American plantation complex might seem unimportant as a supplier of cotton and other plantation crops, if one assumes a very high elasticity of supply of these crops in other parts of the world, and declining costs of maritime transport. In his recent book Empire of cotton, Sven Beckert has essentially argued against making such an assumption. In his view, the coercion involved in the expansion of the American plantation complex was the key ‘that opened fresh lands and mobilized new labor, becoming the essential ingredient of the emerging empire of cotton – and thus an essential ingredient in forging industrial capitalism’.Footnote 10 European agents who attempted to secure a supply of cotton elsewhere in the world were, according to Beckert, generally unable to do so for an extended period, since obtaining such supplies from rural areas required quite drastically changed social relations.Footnote 11 Beckert’s claims, however, can be disputed, not least because some regions of the world were able to expand cotton production quite rapidly. This was evident during the 1860s, when the export of cotton to Britain from Egypt, Brazil, and especially India increased markedly in response to the ‘cotton famine’ created by the American Civil War.Footnote 12 Even if local production was sufficiently elastic to accommodate such changes, other factors such as transport costs might well have prohibited any effective development of alternative sources of supply.Footnote 13
The aim of this article is to contribute to this debate on the socioeconomic importance of the transatlantic slave trade and the American plantation complex. For that purpose it employs a methodological approach that so far has not been widely used in previous scholarship in this field: estimating the value added in the transnational value-chains associated with the slave trade and the plantation complex. Certainly, there have been some attempts to use the same methodology in previous research. David Eltis and Stanley Engerman pioneered this path, estimating the value added in West Indian sugar production in 1805 to be around £5.4 million, which would be equivalent to around 2% of British GDP at the time.Footnote 14 More recently, I have studied the value added in the production, refining, and trade of colonial sugar over the course of the eighteenth century, arguing that during this period it increased from around 1% to 4% of British GDP.Footnote 15 There have also been recent attempts to estimate the value added in the Dutch slave trade, using the same methodology. The findings suggest that the economic value of the Dutch slave trade amounted to a not insubstantial part of the Netherlands economy.Footnote 16
The main limitation of these previous studies is that they have concentrated on one commodity, notably sugar or slaves (and in Eltis and Engerman’s case only dealing with plantation production in the Caribbean). This article, however, attempts a substantially more comprehensive approach, which involves estimating the value added by economic activities associated with both the transatlantic slave trade and the American slave plantation complex throughout the whole of the value-chains studied. It will focus upon value-chains connecting Britain to Africa and the Americas. The reason for choosing to study the value-chains associated with Britain is primarily because the British case has been critical in much of the previous scholarly debate in the field, not least because Britain was the most important slave-trading nation during the eighteenth century. There is the additional advantage of comparatively more available data, which allow for a quantification of the value added in the British case in particular. However, it is also the case that Britain, compared to other European countries, was more dependent on overseas trade by the end of the eighteenth century.Footnote 17 One should therefore be careful not to generalize about Europe based on the British data presented in this article.
Studying the value added of slavery and the slave trade
As noted above, some previous research has attempted to determine the importance of the slave trade by comparing the profits from the trade with British national income.Footnote 18 This approach is problematic since capital income, meaning profits and rents, is just one (and often a quite small) fraction of the total national income. It might therefore seem more suitable to compare the profits from the slave trade (and/or the American plantation complex) to the capital incomes in the economy, rather than to total national income. Previous research by Thomas Piketty has shown that total capital incomes might have accounted for around one-third of the British national income in the late eighteenth century, but in many other cases the amount was substantially lower.Footnote 19 Unfortunately, so far no data have come to light on the capital income of the British economy prior to this period. Some scholars, such as Joseph Inikori, have also argued that the profits from the slave trade do not take the trade’s consequences into full account, since a crucial aspect was the creation of markets for various goods and services, aside from investments enabled by any profits.Footnote 20
Another way of measuring the magnitude of these activities is therefore to analyse the aggregate economic values involved in the transnational value-chains related to the Triangular Trade and the American plantation complex, including all factor incomes and not just profits. It is this approach that will be used in this article. Value-chains are a means to analyse global economic connections. A value-chain is here taken to mean all activities that are necessary in order to produce and deliver a product to a market.Footnote 21 Each value-chain contains several links, so one example of a value-chain might include the initial cultivation of an agricultural crop (such as sugar cane), the processing (production of raw sugar), the transportation and marketing of the intermediate good, further refining (into fine sugar), and transportation of the final product to a retailer. In order to avoid double-counting, only the value actually added to a product at every single stage of the value-chain should be included. The value added of an economic activity in the value-chain is thus a form of cost accounting. This is estimated as the difference between the output revenue and the costs of intermediate goods used in production.Footnote 22 For an individual business in the value-chain, what is measured as added value will generally mean its costs of production, such as the cost of acquiring labour, as well as the profits gained from its operations. Costs for one business would, however, mean revenue for others, so that a wage cost, for example, meant an income for the labourers.
Comparing the value added in different sectors and trades can allow us to determine their relative economic magnitude. Most importantly, summing up the value added in all sectors of the economy is one common method employed in assembling national accounts, in order to arrive at estimates of a country’s total gross domestic product.Footnote 23 Estimating the value added involved in the transnational value-chains of the Triangular Trade and the American plantation complex therefore allows a comparison with estimates of domestic national accounts. In sum, the article asks: how important was the British involvement in the Triangular Trade and the American plantation complex, if measured by the value added by the transnational value-chains, relative to British GDP?
A critical issue for this study concerns the delineation of the research question. Broadening the number of transnational value-chains that are associated with the Triangular Trade and/or with the American plantation complex will naturally raise the estimated figures of value added. In this article, three clusters of value-chains will be considered to be ‘involved’ in the Triangular Trade or the American plantation complex. The first cluster of activities is the value-chains in the Triangular Trade per se. The term ‘Triangular Trade’ has become a shorthand for the stylized pattern of manufactures exported to Africa and exchanged for slaves, slaves exported to the Americas and exchanged for raw materials from the slave plantation complex, and the raw materials in turn exported back to Europe and used in the processing industry there. The pattern is certainly stylized in the sense that many individual traders did not conduct trade following this pattern, so that there was also a good deal of bilateral trade.Footnote 24
The second cluster of activities included in the analysis is the production for the British market in the American plantation complex. This was where the labour of most of the slaves transported across the Atlantic was actually exploited. Even though these activities mainly came from production in British colonies, they would not be included in studies of British historical national accounts adhering to present-day national borders.
The third cluster of activities included in the analysis consists of economic activities in Britain that were directly dependent on the American plantation complex (such as the British cotton industry using imports of raw cotton from the Americas). As has been argued in previous literature, this dependency could take two forms: access to a supply of inputs to, and a market for the output from, industrializing Britain. Several scholars have argued that the second aspect might have been the more important one for the British economy.Footnote 25 The plantation complex did, however, also play an important role in industrializing Britain as a supplier of raw materials necessary for some of the key manufacturing industries, such as raw sugar or raw cotton, though they might have been acquired from other sources.Footnote 26 Here, an attempt is made to quantify the importance of the American plantation complex from both of these perspectives. An industry dependent on inputs from the American plantation complex could also sell part or the whole of its output to the same market. While the industry would then be dependent on the Triangular Trade/American plantation complex for both inputs and output, it would seem erroneous to quantitatively add both of these estimated ratios together, since we would then be double-counting the same economic activity in terms of their value added. The article deals with this issue by trying to estimate the value added to exports other than processed versions of the raw materials imported from the Americas.
All three clusters thus concern economic activities that can be regarded as being directly associated with the American plantation complex. Any indirect linkage effects are not included in the quantitative estimates presented here. However, they will be addressed in a final section.
Data
This article has been enabled by much previous historical research that has assembled data from a wide range of primary sources. In regard to the trade in slaves, the number of slaves embarked and disembarked by British slave traders is by now well established, thanks to the contributions of numerous scholars to the Transatlantic Slave Trade Database edited by David Eltis, Stephen Behrendt, David Richardson, and Herbert Klein.Footnote 27 The value of the ‘intermediate goods’ in the slave trade is thus calculated as the total cost of slaves embarked in Africa by British traders. This cost is obtained by computing the number of slaves exported, in relation to the annual average price of slaves in Africa (assembled by David Richardson).Footnote 28 There was considerable mortality among the slaves during the voyage from the coast of Africa to the Caribbean. The value of the ‘output’ from the slave trade is therefore calculated as the product of the number of slaves disembarked in the Americas by British traders, and the annual average price of slaves in the Americas, as assembled by David Eltis and co-authors.Footnote 29 The ‘value added’ of the slave trade is then assessed as the difference between the value of the ‘output’ and the value of the ‘intermediate goods’ of this trade.
As for the production, processing, and trade of the raw materials from the American plantation complex, data availability varies. Data on exports from the American colonies are fragmentary. The volume of British imports (including re-exports) for several key commodities can, however, be found in the research of Elizabeth Boody Schumpeter.Footnote 30 These data have been used here for the volumes of the goods involved in the value-chain (assuming some losses during shipping and processing). One of the most important commodities, cotton, was imported by Britain from many different parts of the world during the eighteenth century, including the Americas and other places, but most importantly the Middle East. The amount of cotton arriving from the Americas, rather than from anywhere else in the world, has therefore been estimated from previously published data.Footnote 31
The main limitation concerns data for the prices of the commodities throughout the value-chain over the period studied. This article therefore focuses on the three key commodities from the American plantation complex: sugar, cotton, and tobacco. The price of raw sugar sold in Jamaica has been tabulated by David Beck Ryden for the period from 1752 onwards.Footnote 32 John McCusker, Richard Sheridan, and Kenneth Morgan have all assembled various data on the wholesale price of raw sugar in Britain.Footnote 33 Gregory Clark provides details of the price of refined sugar at the retail stage in Britain.Footnote 34
The price of tobacco in one of the major tobacco-producing regions, Maryland, is available for the period 1700–75, in data published by the US Census Bureau.Footnote 35 For the nineteenth century, the price of tobacco in Pennsylvania, assembled by Peter Lindert, has been used as a proxy.Footnote 36 I have been unable to find any wholesale prices for tobacco in Britain, apart from the final consumer prices assembled by Gregory Clark.Footnote 37
As for cotton, prices are again available from Pennsylvania, although it was not a major cotton producer in the Americas.Footnote 38 The cotton imported from the Americas to Britain came primarily from the Caribbean for most of the period studied in this article. The price of cotton in Pennsylvania may thus have been considerably higher than the cost in the areas of production, owing to transport costs. An assumption is therefore made that the price of raw cotton in the areas of production in the Americas would have been half of that found in Pennsylvania. If this proxy price were lower than what prices actually were, the estimated value added in the cotton plantations would consequently also be too low, and the estimated value added in the cotton trade too high, and vice versa. It would thus matter for how the value added was distributed between the links in the value-chain, but would have no effect upon the aggregate estimates. There are also price series for raw cotton in Britain, assembled by Alfred Wadsworth and Julia de Lacy Mann, as well as by Gregory Clark.Footnote 39
The value of the output at each stage of the value-chain is then calculated, for all three commodities, as the amount of each respective product imported into Britain multiplied by the price of the product at each stage of the value-chain. Data have been interpolated for the years of missing data. For all three commodities studied, value added on the plantations has then been assumed to be equivalent to 90% of output value. This is analogous to the research by Eltis and Engerman.Footnote 40 It is possible that the costs of inputs were lower on tobacco and cotton plantations at the time, given that sugar plantations required certain machines to process the sugar cane into raw sugar. Assuming a lower cost of inputs for other types of plantations would only serve to elevate the estimated value added in these plantations. The value added at later stages in the value-chain is calculated as the value of the output minus the value of input of intermediate goods (from previous stages in the value-chain). The exception is the value added involved in the processing of cotton. Raw cotton was used for a large number of different types of textiles. It would therefore be too complex a task for this article to attempt to quantify the value added to any potential output from American cotton. For that purpose, previous estimates of the value added in the whole of the cotton textiles industry have been used.Footnote 41 The share of this sector’s added value that could be said to be associated with the American plantation complex was calculated based on the ratio of imports of cotton coming from the Americas (relative to total imports of cotton), as discussed above.
Unfortunately, the value-chains of other plantation commodities, such as coffee, cocoa, rice, or indigo, must be omitted from the present estimates, owing to lack of data. If it had been possible to include them, it would only have increased the estimated importance of the American plantation complex. These other commodities do, however, only comprise a minor share of the value of British imports from the Americas, compared to the three commodities studied in this article, so the underestimation would presumably be comparatively small.Footnote 42 Future research might potentially improve these results.
A final step in the calculation is to estimate the value added involved in the industries that were producing goods for African and American markets. Since there was a wide variety of goods exported to these markets, it would be very hard to trace the value added in all the different value-chains. A simplified model has therefore been assumed, based on the total value of exports and an assumed ratio of ‘value added to output value’. Data on the value of exports from Britain to Africa and to the American plantation complex are used as a proxy for the output value of this production.Footnote 43 Since the aim of this study is to estimate the connection to the American plantation complex, any exports to the Americas outside this complex would have to be excluded. Data from the 1770s indicate that the southern continental colonies at this time accounted for approximately one-fifth of all imports into the British North American colonies.Footnote 44 For lack of better data, this ratio has here been assumed to apply throughout the period studied. As for manufactured goods exported to Africa, quite a large share was in the form of re-exports, rather than goods manufactured in Britain. The re-exports of Indian textiles and other re-exported goods, such as cowrie shells, have therefore been excluded from the estimate.Footnote 45
In order to arrive at a proxy for the value added in these exports, we also need to take the value of intermediate goods into account. David Eltis and Stanley Engerman have provided data on both the value of output and the value added in six different industries in Britain around the time of their study.Footnote 46 These data enable the calculation of the ratio between the value added and the value of output. The value added involved in the production of other manufactures in the present study has hence been estimated using this ratio of value added to output value.
The data presented have been deflated to take into account inflation, using the consumer goods price index reported by B. R. Mitchell.Footnote 47 The estimates of the value added involved in these economic activities are here presented relative to the most recently published estimates of British GDP by Stephen Broadberry and his co-authors. They have based their figures on the value of the output of the British economy, sector by sector, using data, estimates, or proxies for the volume and prices of the output of each sector.Footnote 48
Results
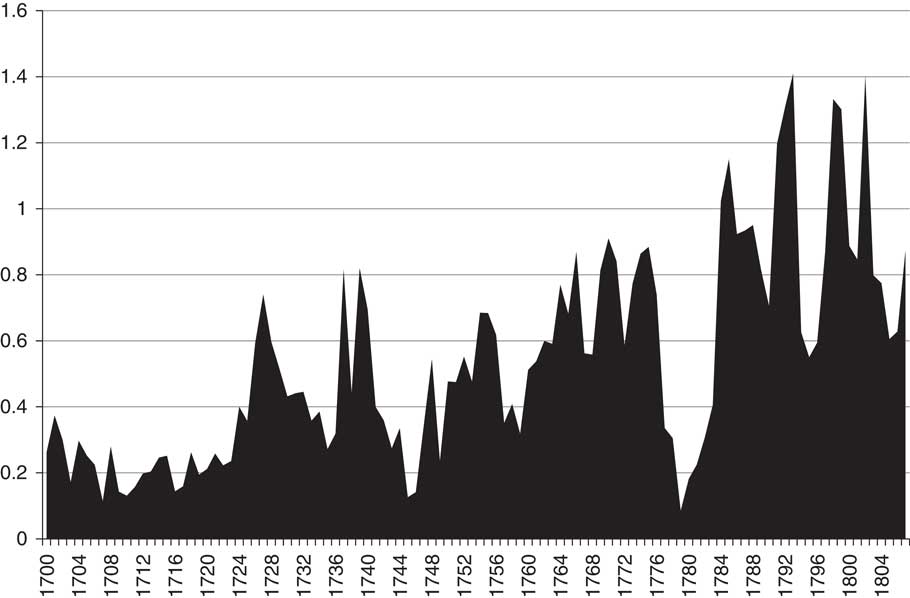
Figure 1 provides data on the value added in the slave trade. The British slave trade grew quite substantially over the period under study, increasing from around 15,000 slaves per year on average embarked from Africa in the first decade of the eighteenth century, to around 40,000 slaves per year on average a century later, until the British slave trade was abolished. The prices of slaves also increased, so that the value of those arriving in the Americas on British ships rose substantially. However, the cost of the ‘intermediate good’ of the trade (that is, the slaves embarked in Africa) also increased, and almost at the same pace as the value of the slaves sold in the Americas. The value added therefore only rose from £200,000 on average for the first decade of the eighteenth century, £900,000 (constant prices, 1701=100) on average for the first years of the nineteenth century. The trade thus exhibits an average annual real growth rate of 1.2%. As a consequence, the value added involved in trading slaves was comparatively small, and only increased marginally relative to British GDP over the period. Furthermore, fluctuations between years were substantial.
Value added of the British slave trade, 1700–1807 (in £ million, constant prices, 1701=100). Sources: number of slaves embarked and disembarked on British ships from TSTD2, 2010; prices of slaves in Africa from Richardson, ‘Prices of slaves’; prices of slaves in the Americas from Eltis, Lewis, and Richardson, ‘Slave prices’.
The slave trade grew in response to the growth of the American plantation complex, and the consequent growing demand for labour. Figure 2 shows data for the relative importance of the production of three of the main commodities in the plantation complex in the Americas: sugar, tobacco, and cotton. Sugar imports to Britain grew almost tenfold over the period, from 380,000 cwt (hundredweight, 1 cwt=112 lb) per year on average during the first decade of the eighteenth century, to 3.56 million cwt a century later. Whereas the price of sugar increased in Europe, the same trend was not as strong in the Americas, judging from the available data from Caribbean sugar plantations. The value added in sugar production in the Americas thus increased from perhaps some £200,000 per year during the first decade of the eighteenth century to around £2.2 million a century later (constant prices, 1701=100), an average annual real growth rate of some 2.3%. Relative to British GDP, the production of sugar on American plantations thus increased substantially in importance during the period.
Value added of the production of colonial commodities in the Americas exported to Britain, 1700–1807 (in £ million, constant prices, 1701=100). Sources: imported volumes from Schumpeter, English overseas trade statistics, tables XVI–XVII. The share of cotton arriving from the Americas, rather than anywhere else in the world, has been estimated from the data provided in Jaquay, ‘Caribbean cotton production’, table 6, for the period 1700–80, and from Edwards, Growth of the British cotton trade, tables C/1–C/3, for the period 1781–1807. Price of muscovado sugar in the Caribbean from Ryden, West Indian slavery, table A.7. Tobacco and cotton price data from Pennsylvania from Lindert et al., ‘Pennsylvania spliced series’. In all three cases, value added on the plantations has been assumed to be equivalent to 90% of output value, analogous to the estimate for sugar in Eltis and Engerman, ‘Importance of slavery’, table 1.
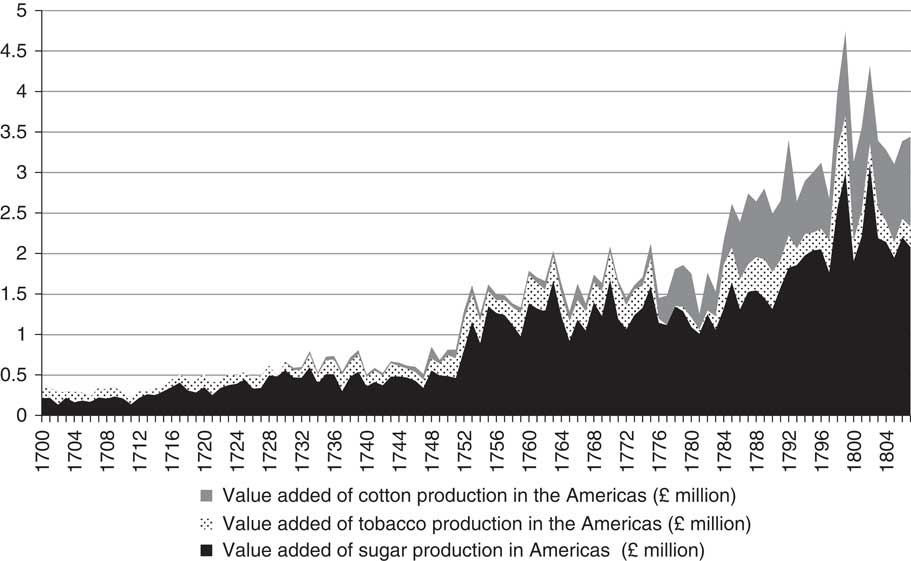
The tobacco trade, in contrast, increased during the first half of the eighteenth century in terms of volume traded, but during the latter half of the century decreased somewhat, in some years virtually coming to a standstill during the American Revolution. Nevertheless, the falling volume of the tobacco trade was countered by increasing prices in both the Americas and Europe, particularly in the aftermath of the American revolutionary wars. In consequence, the value added of the production on tobacco plantations increased slightly, from £100,000 per year, to £300,000 a century later (constant prices, 1701=100), an average annual real growth rate of 0.8%. The tobacco plantations thereby struggled to remain on roughly the same relative level of importance in British GDP throughout the period studied.
As for cotton, a substantial share of all raw cotton imported into Great Britain during the eighteenth century came from the Caribbean. For a long period, the volumes were marginal, and only in the second half of the eighteenth century did production in, and exports from, the Caribbean, and later the North American continent, start to take off in absolute terms. This is reflected in a comparatively marginal value added from cotton plantations for most of the period shown in Figure 2. Once the cotton plantations had started to produce, however, they quickly grew in importance, with estimated value added increasing to around £1 million in constant prices (1701=100) by the first decade of the nineteenth century.
Figure 3 shows the value added in the value-chain between the plantations in the Americas and the stage of processing in Britain. This would have included the freight costs for the transportation of the commodities from the plantations to the ports and shipping to Europe, insurance costs, costs for any financial services (including the payment of interests on any capital borrowed for these agents), brokerage fees, wholesalers’ costs, and so on. Sugar remained the most important commodity for this leg of the Triangular Trade throughout the period studied in this article. The value added increased dramatically, from £500,000 during the first decade of the eighteenth century to the remarkable figure of £5.5 million a century later (constant prices, 1701=100), an average annual real growth rate of 2.2%. In part, this quite astonishing rise is due to a substantial increase in the absolute volumes of sugar traded across the Atlantic, as mentioned above. However, much of this increase was an effect of rising transport costs (such as freight rates and insurance costs) during the very turbulent period at the end of the century, driving up the real price of sugar in Europe.Footnote 49
Value added of the shipping of and trade in colonial commodities from the Americas to Britain, 1700–1807 (in £ million, constant prices, 1701=100). Sources: imported volumes from Schumpeter, English overseas trade statistics, tables XVI–XVII. The share of cotton arriving from the Americas, rather than anywhere else in the world, has been estimated from the data provided in Jaquay, ‘Caribbean cotton production’, table 6, for the period 1700–80, and from Edwards, Growth of the British cotton trade, tables C/1–C/3 for the period 1781–1807. Price of muscovado sugar in the Caribbean from Ryden, West Indian slavery, table A.7. Wholesale sugar prices in England from McCusker, ‘Rum trade’, table E-44, p. 1143; Sheridan, Sugar and slavery, appendix V; Morgan, Bristol and the Atlantic trade, table 7.10. Tobacco prices: price data from Maryland from US Census Bureau, Historical statistics of the United States, series Z579, Z583; and from Pennsylvania from Lindert et al., ‘Pennsylvania spliced series’; retail prices in England from Clark, ‘England’. Cotton prices: American price data from Pennsylvania from Lindert et al., ‘Pennsylvania spliced series’; prices in England from Wadsworth and de Lacy Mann, Cotton trade, appendix H for the period 1700–80, and from Clark, ‘England’, for the period 1781–1807.
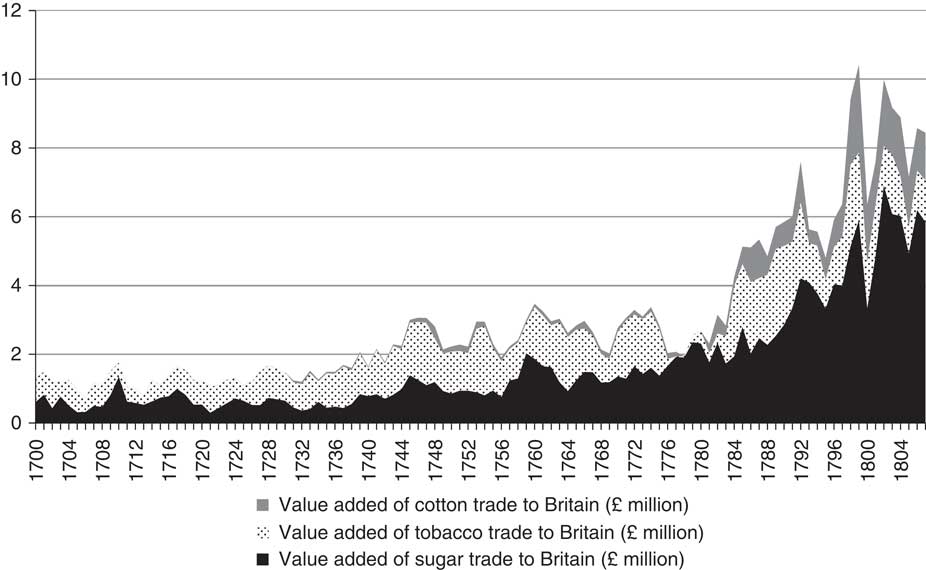
As previously noted, the tobacco trade increased in volume terms until around the middle of the century, after which the amount imported into Britain decreased. Owing to rising prices during the second half of the century, the value added of the tobacco trade still increased over the period, from around £600,000 during the first decade of the eighteenth century to around £1.3 million a century later (constant prices, 1701=100), an average annual real growth rate of 0.7%. As for the trade in raw cotton, the same pattern can be seen as discussed above in relation to the cotton plantations. The cotton trade from the Americas only started to have any economic significance relative to British GDP from the 1780s onwards. Once it had begun to take off, however, growth was rapid, so that the trade had an estimated value added of around £1.5 million by the first decade of the nineteenth century (constant prices, 1701=100).
While the production of and trade in muscovado sugar increased in importance relative to British GDP, the refining of sugar in Britain did not exhibit the same trend. The value added certainly increased during the period, but much of this increase occurred during the first three decades of the eighteenth century (as well as a marked increase at the very end of the period). The processing of tobacco experienced a somewhat similar fate, with very little change in value added over the period, only to experience a substantial increase in the final years. Of the three value-chains studied here, the industry that experienced the most significant growth was the cotton industry. The value added in the industry which was based on cotton from the American plantation complex in particular grew from virtually zero to an average of £4.6 million during the first decade of the nineteenth century (constant prices, 1701=100).
While Figure 4 shows the development of industries that were dependent on the American plantation complex for their inputs, Figure 5 illustrates the importance of the industries in terms of markets for their output. One market for some British manufactures was the African market, where goods were exchanged for slaves as well as some other trade goods. African consumers demanded goods such as textiles, metals, and other items, and the value of these exports increased as the slave trade grew during the eighteenth century. A large proportion of these exports, however, had comparatively marginal effects for the British economy, since they were re-exports, such as Indian textiles. On the other hand, the exports that were of British origin did increase in importance, even if the value added remained comparatively small, increasing from around £50,000 in the first decade of the eighteenth century to around £200,000 a century later (constant prices, 1701=100), an average annual real growth rate of 1.4%.
Value added of key manufacturing industries dependent on inputs of raw materials from the American plantation complex, 1700–1807 (in £ million, constant prices, 1701=100). Sources: imported volumes from Schumpeter, English overseas trade statistics, tables XVI–XVII. The share of cotton arriving from the Americas, rather than anywhere else in the world, has been estimated from the data provided in Jaquay, ‘Caribbean cotton production’, table 6, for the period 1700–80, and from Edwards, Growth of the British cotton trade, tables C/1–C/3 for the period 1781–1807. Sugar industry: wholesale prices in England from McCusker, ‘Rum trade’, table E-44, p. 1143; Sheridan, Sugar and slavery, appendix V; Morgan, Bristol and the Atlantic trade, table 7.10; retail prices in England from Clark, ‘England’. Tobacco industry: price data from Maryland from US Census Bureau, Historical statistics of the United States, series Z579, Z583; and from Pennsylvania from Lindert et al., ‘Pennsylvania spliced series’; retail prices in England from Clark, ‘England’. Cotton industry: production value-added data from Deane and Cole, British economic growth, table 42, for benchmark years.

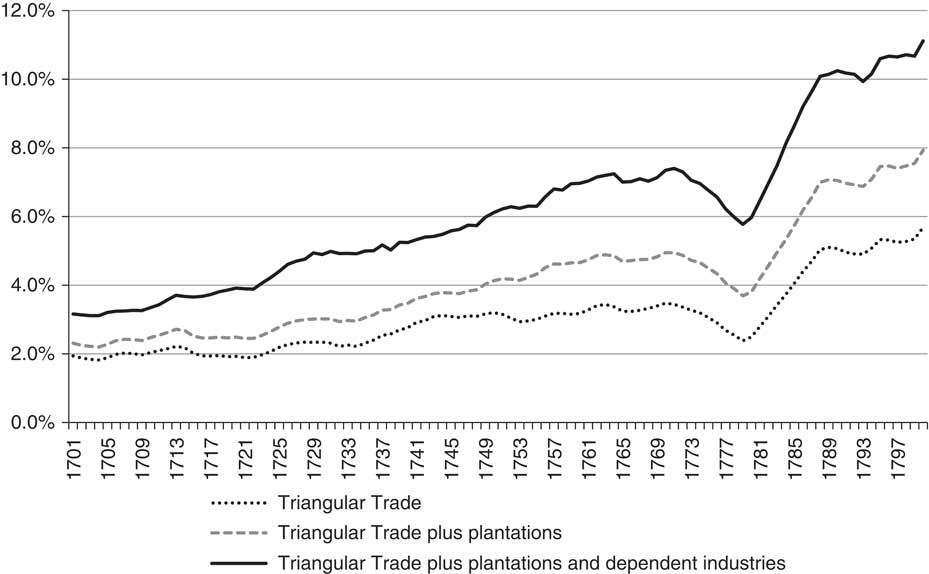
Value-added of manufacturing industries producing output sold on the African and American markets, 1701–1800 (in £ million, constant prices, 1701=100). The goods sold to the American market are estimated to only include goods sold to the parts of the Americas belonging to the plantation complex. Sources: total official value of exports to the Americas and Africa, respectively, from Schumpeter, English overseas trade statistics, table V; estimated ratio of value added relative to output value based on weighted average of seven industries reported in Eltis and Engerman, ‘Importance of slavery’, table 1; share of manufactures in the form of re-exports exchanged for slaves in Africa based on Gemery, Hogendorn, and Johnson, ‘Evidence’, tables 1–4.
The American markets were more important than the African ones. Many of the exports to the Americas went to the American slave plantation complex, rather than to the parts of North America where there were comparatively few or no slaves. As can be seen in Figure 5, American markets were growing in importance. During the first decade of the eighteenth century, American consumers in the plantation complex purchased output contributing to around £300,000 of value added for the British economy. A century later, however, the American markets in the plantation complex were purchasing output contributing to a value added of around £1.8 million (constant prices, 1701=100), an average annual real growth rate of 2.0%. The American revolutionary wars naturally meant a huge decrease in the value of exports to the Americas. Once peace returned after the United States had acquired independence, however, the exports quickly resumed, and thus the output necessary in order to supply these exports also expanded.
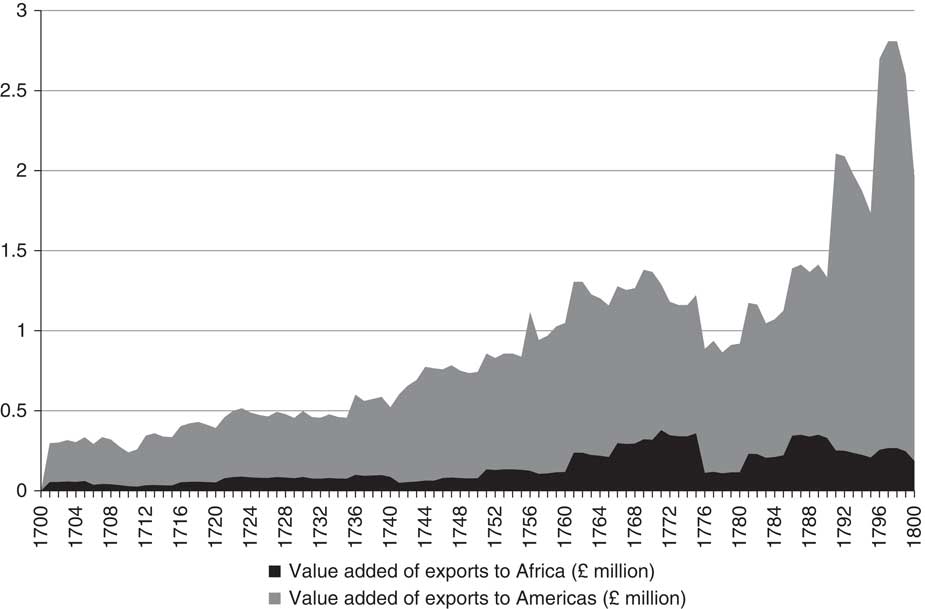
Finally, Figure 6 shows an attempt to aggregate the data from all the stages of the value-chains shown in Figures 1–5, and relate these combined data to the British GDP. As can be seen, the Triangular Trade and the American plantation complex grew substantially in importance over the period studied. If we start by only looking at the activities of the Triangular Trade narrowly defined (the exports of manufactures to Africa, the trade in slaves across the Atlantic, and the exports of raw materials to Europe), these activities increased markedly. In turn, this created an annual value added average equivalent to around 2.0% of British GDP during the first decade of the eighteenth century, increasing to an average value added equivalent to around 5.2% of British GDP a century later. If we include the production on the plantations in the Americas in the aggregate estimate, the figures are instead 2.3% of British GDP for the first decade of the eighteenth century, rising to 7.6% a century later. If we add industries dependent upon the American plantation complex, the estimated value added created in all these economic activities was together equivalent to 3.1% of British GDP during the first decade of the eighteenth century, and 10.8% a century later.
Value-added of all British economic activities directly related to the American plantation complex, relative to British GDP, 1701–1800 (nine-year moving average). Sources: Figures 1–5 for data on nominal value added on activities involved. Data on British GDP from Broadberry et al., British economic growth, appendix 5.3.
Secondary effects
The growth of economic activities directly associated with the Triangular Trade or the American plantation complex would in turn have contributed to the development of other parts of the economy, through backward and forward linkages to a host of other value-chains. For example, a growth in demand for maritime shipping associated with the Triangular Trade most certainly had effects upon the development of the financial, insurance, and shipbuilding industries.Footnote 50 It has also been argued that these factors helped drive the development of docks in the ports of Europe.Footnote 51 Copper sheathing, a technology that was developed during the second half of the eighteenth century, not least in order to reduce the mortality of slaves, would have created a demand for a supply of copper.Footnote 52 Yet another example would be the output of British agriculture, which supplied provisions for the slaves purchased in Africa.Footnote 53 Furthermore, many farmers might have been producing supplies for feeding the slaves working in the American plantation complex.Footnote 54 Furthermore, the wider impact might not have been limited to linkage effects for other industries.
In addition, it has been suggested that this would include fundamental shifts in institutions and economic structures. The growth of the Atlantic trade may thus have had other important consequences, for example, through contributing to institutional change in Britain, as Daron Acemoglu, Simon Johnson, and James Robinson have famously argued.Footnote 55 It might also have contributed to urbanization, and to the growth of a British high-wage economy, as Robert Allen has claimed.Footnote 56
One of the most fundamental contributors to the value added of a product is the cost of labour at each link in the value-chain. The economic activities studied in this article entailed the toil of hundreds of thousands of people around the world. One key group of these people was made up of the slaves transported across the Atlantic and exploited by their masters on the plantations in the Americas. Other people laboured, for example as sailors in the shipping industry, as workers in ports and warehouses, as labourers in the various industries refining the products, or in the transportation and retailing of the final products. All these people would have earned their livelihoods from the money they were paid from working in these value-chains. Furthermore, many planters, traders, and industrialists would have been able to make a living from their participation in these value-chains. These latter agents chose to participate in these trades, not because the economic activities necessarily gave rise to any consistently high profits, but because the average profits were presumably at least as high as any alternative that they could have engaged in. Moreover, they had a chance to strike it lucky with the occasional ‘super-profitable’ business venture.
Conclusion
The aim of this article has been to study the economic importance of the transatlantic slave trade and the American plantation complex. Many agents and economic activities in British society were directly involved in the Triangular Trade, or directly dependent upon this trade in the form of inputs from the Americas. The article has attempted to quantify just how substantial these economic activities were in terms of the value added generated. There have been some limited efforts previously to use this methodology when studying the importance of colonies and the slave trade, most importantly by David Eltis and Stanley Engerman, who estimated the value added involved in the sugar production in the British Caribbean. The same methodological approach has been deployed here. However, the scope of the analysis has been broadened by including more commodities throughout the value-chains involved. The estimates have then been compared to the estimated GDP of the whole British economy.
The value-chains connecting Britain to the transatlantic slave trade and the American plantation complex were only a handful among the countless value-chains creating numerous global connections during the early modern period. One reason that these particular value-chains have been the focus of this article is data availability: there is simply substantially more quantitative data available on British connections to Africa and the Americas than there are for many value-chains connecting other parts of the world. Future research might contribute to put the single case studied here into a broader perspective.
But these particular value-chains were also studied because, arguably, they were of considerable importance, not just for shaping the British economy but also for many other societies around the world. The results of the quantitative estimates presented here thus suggest that individual transnational value-chains might not have been very important in quantitative terms if each one is analysed in isolation, and in particular if a study concentrates on one particular link in the value-chain. Analysed together, however, the economic activities involved in the Triangular Trade and the American plantation complex add up to a large magnitude quantitatively, if compared to that of the aggregate British economy, as has been done in this article. By the end of the eighteenth century, the British part of the Triangular Trade alone incorporated economic activities equivalent to around 5% of the British gross domestic product. If we add the activities in the American plantation complex, as well as the industries in Britain directly dependent upon this (either for inputs of raw materials or for markets for output), the estimated figures show that economic activities equivalent to around 11% of British GDP were directly involved in or associated with the Triangular Trade and the American plantation complex. Activities of this magnitude can hardly be dismissed as marginal to the British economy at the time.
Most importantly, the estimates presented here reveal that the activities associated with the Triangular Trade and the American plantation complex grew at a high rate over the eighteenth century. These value-chains not only managed to keep up with the aggregate growth of the British economy, but also to increase in relative importance. This would suggest a quite remarkable growth for the whole of the Triangular Trade and the American plantation complex. The growth was not even across all value-chains. Nevertheless, while cotton experienced the most drastic growth (which should be unsurprising given previous research in the field of economic history), other value-chains, notably the export of manufactures to Africa and the Americas, the production of, trade in, and refining of sugar, and the slave trade itself also experienced not only a growth of value added in real terms, but also a growth that exceeded that of the British economy overall. In fact all value-chains analysed here, except for tobacco, seem to have increased in importance relative to the British GDP.
The value-chains studied here provided livelihoods for hundreds of thousands of people. Most of these people probably never became very rich, but some were certainly able to appropriate substantial wealth from their participation in these trades. The only individuals who were unable to choose whether to participate or not were the slaves. The coercion and exploitation that they experienced was, however, the foundation that enabled many transnational value-chains to enrich a whole host of other people that extended from Africa to Britain, the Americas, Asia, and Europe.
Klas Rönnbäck is associate professor of economic history at the University of Gothenburg, Sweden. His main research interests concern the economic aspects of slavery and colonialism. His book Labour and living standards in pre-colonial West Africa: the case of the Gold Coast was published by Routledge in 2016.


