


The increase in obesity and diabetes prevalence is a worldwide major public health concern. According to WHO(1), worldwide obesity has nearly tripled since 1975. In 2020, 764 million adults were obese(2). According to the International Diabetes Federation(3), 537 million adults are living with diabetes in 2021. Insulin resistance (IR) is a major factor that leads from obesity to type 2 diabetes(Reference Roden and Shulman4). Although overfeeding and lack of exercise during infancy and adulthood predispose to non-communicable diseases, many epidemiological studies strongly suggest that maternal undernutrition or obesity(Reference Moreno-Fernandez, Ochoa and Lopez-Frias5–Reference Schoonejans and Ozanne8) could lead to obesity, IR, type 2 diabetes and CVD in the offspring during adulthood. This phenomenon has been called: Barker’s hypothesis, fetal programming or Developmental Origins of Health and Disease. Growing bodies of evidence from rodent models demonstrate that maternal nutrition during pregnancy can increase the risk of developing metabolic alterations in offspring during early life and adulthood(Reference Schoonejans and Ozanne8).
The amount and type of dietary fatty acids (FA) also contribute to fetal programming(Reference Hughes and Oxford10,Reference Mennitti, Oliveira and Morais11) . In rodent models, a high-fat (HF) diet rich in SFA given during pregnancy induces several metabolic alterations in offspring during adulthood: liver steatosis, increased body and visceral fat mass, adipocyte hypertrophy, pro-inflammatory cytokines production, IR, pancreatic islet hypertrophy and oxidative stress(Reference Mennitti, Oliveira and Morais11,Reference Christoforou and Sferruzzi-Perri12) . Long-chain (LC) n-3 PUFA, mainly EPA and DHA, can prevent and even decrease IR in rodents fed a HF diet, which has also been shown in humans(Reference Taouis, Dagou and Ster13–Reference Delpino, Figueiredo and da Silva18). During pregnancy, the only source of PUFA for the developing fetus is via the placenta. Placental tissue expresses lipoprotein receptors and enzymes with lipase and phospholipase activities involved in the maternal FA transfer across the placenta. NEFA that originate from maternal metabolism and dietary FA can also cross the placenta(Reference Mennitti, Oliveira and Morais11,Reference Shrestha, Sleep and Cuffe19) . Several studies have demonstrated selectivity in placental transfer of FA and a strong preference by the placental plasma membrane binding sites for LC-PUFA, especially DHA(Reference Duttaroy20–Reference Hanebutt, Demmelmair and Schiessl22). Nishimura et al. (Reference Nishimura, Barbieiri and Castro23) demonstrated that the maternal dietary EPA and DHA content during the third trimester of pregnancy is directly associated with the content of these FA in mature breast milk. Additionally, the same human study showed a direct relation between the dietary n-3 to n-6 ratio in the postpartum period and milk composition(Reference Nishimura, Barbieiri and Castro23). In gestational diabetes mellitus-exposed mothers, DHA transfer to the fetus (assessed by 13C DHA) is reduced(Reference Larqué, Pagán and Prieto24). Several studies performed in animal models have assessed, in offspring at adulthood, the effects of LC n-3 PUFA(Reference Mennitti, Oliveira and Morais11,Reference Demmelmair and Koletzko25) given during pregnancy and/or lactation on adiposity, liver steatosis, inflammation(Reference Mark, Wyrwoll and Zulkafli26–Reference Wang, Wu and Zhang30) and/or oxidant/antioxidant status, and DNA methylation. Other studies have assessed their effects on insulin sensitivity(Reference Chicco, Creus and Illesca28–Reference Sardinha, Fernandes and Tavares do Carmo33), but with different models: glucocorticoids-induced IR or LC n-3 PUFA given only in the offspring diet and not to dams or use of fat-1 mice model, rending somewhat difficult to draw conclusions about the specific role of diet given to dams.
A meta-analysis of eleven randomised controlled trials(Reference Vahdaninia, Mackenzie and Dean34) and a recent review(Reference Meyer, Brei and Bader35) concluded no beneficial effect of LC n-3 PUFA given during pregnancy on obesity in offspring. Another one concluded no benefit towards IR but to a significant decrease in C-reactive protein(Reference Amirani, Asemi and Asbaghi36). In the MIGHT randomised controlled trial, a supplementation during pregnancy of 800 mg/d of DHA v. 200 mg/d associated with dietary counselling in overweight or obese mothers did not reduce the risk of gestational diabetes mellitus, macrosomia or IR in neonates(Reference Garmendia, Casanello and Flores37). A Danish study compared the metabolic parameters of offspring aged 9–16 years from mothers with gestational diabetes mellitus or healthy mothers(Reference Maslova, Hansen and Strøm38); no association was found between LC n-3 PUFA and seafood intakes of mothers during pregnancy with offspring metabolic outcomes, but gestational diabetes mellitus-exposed women reporting no fish intake between week 12 and 30 v. intake > 2 times/week had an offspring with a higher BMI, waist circumference and homoeostasis model assessment for insulin resistance (HOMA-IR). It is to note that following supplementation, the plasma concentrations of LC n-3 PUFA were less raised in obese pregnant women than in lean ones, which could have attenuated their beneficial effects(Reference Monthe-Dreze, Penfield-Cyr and Smid39,Reference Alvarez, Muñoz and Ortiz40) .
Because of the discrepancy in results and the small number of studies, the present study aimed to determine whether n-3 LC PUFA administered during pregnancy and lactation to female rats fed a HF diet could prevent IR in the adult male offspring, and examined the basic mechanisms potentially involved in their favourable effects.
Experimental methods
Animal care
The experimental procedure was approved by the Animal Ethical Committee (agreement R-2012-NG-01). The protocol was carried out in conformity with French laws and regulations and the ARRIVE Guidelines for Reporting Animal Research.
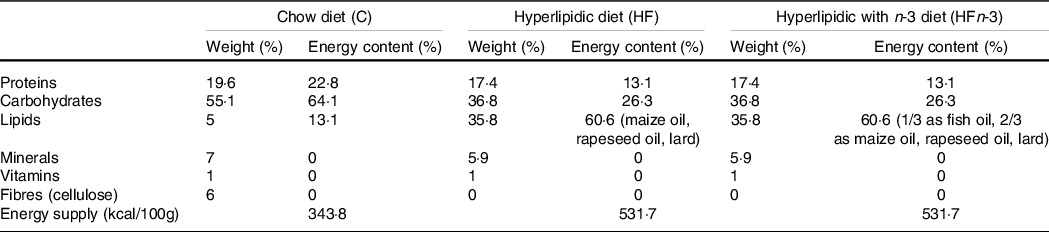
Twenty-one nulliparous 5-week-old female Sprague–Dawley rats (Elevage Janvier) were individually housed in a temperature-, humidity- and light-controlled room. After 1 week of acclimation, they were randomly divided into three groups (n 7 per group), fed ad libitum with either a standard chow (C) diet (control group; n°210 SAFE), or a HF diet (HF group, 60·6 % of energy content as fat, n°230 SAFE), or a HF n-3 diet (HFn-3 group, 60·6 % of the energy content as fat; n°230 modified SAFE). Fat in HF diet was provided by maize oil, rapeseed oil and lard (Table 1). In HFn-3 diet (60·6 % of energy content as fat), one-third of fat was replaced by a marine-derived TAG oil rich in LC n-3 PUFA (Omegavie® 1050 TG Quality Silver, kindly provided by Polaris) (Table 1). The FA composition of the three diets is reported in Table 2.
Composition of the different diets
Diet composition was provided by the diet manufacturer (SAFE).
Fatty acid composition of the different diets in mg per 1000 g of diet

Fatty acid composition was determined by the diet manufacturer SAFE (Augy) and Polaris (Quimper).
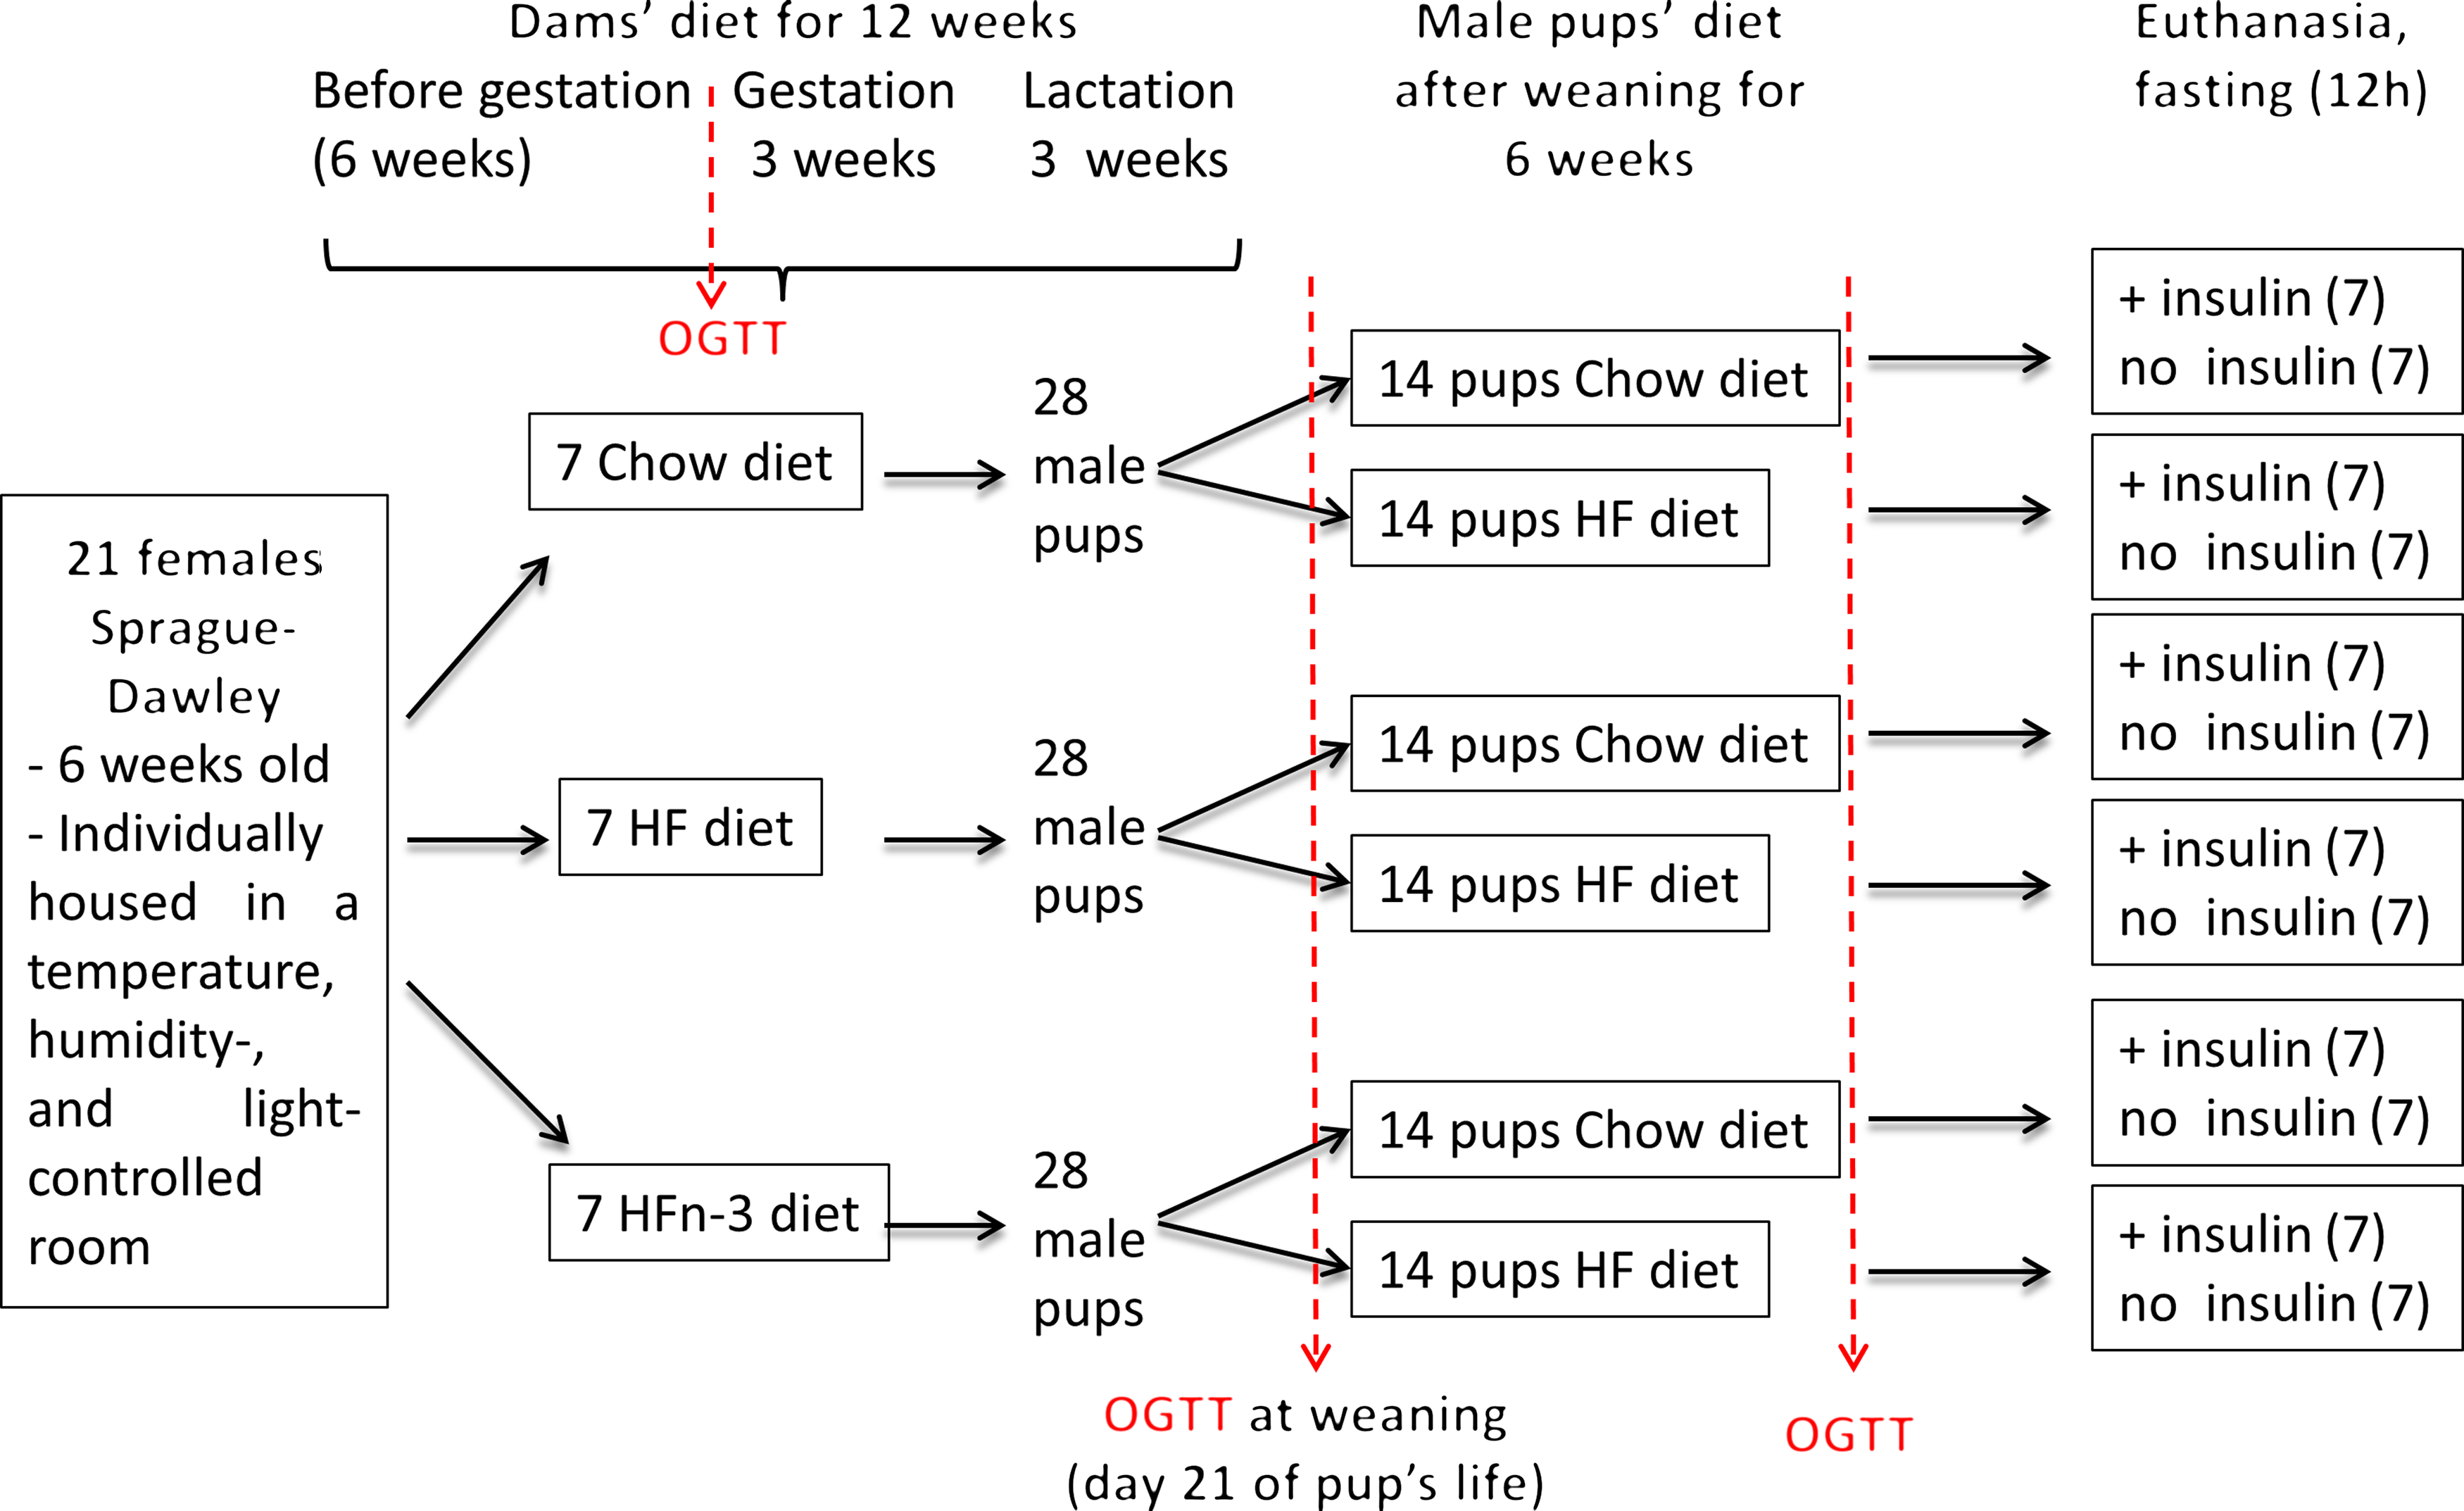
After 6 weeks of diet, two dams of each group were mated for 48 h with one Sprague–Dawley male rat fed a C diet (eleven different males). Dams were further continued on their initial diet throughout gestation and lactation. At birth, all the litters were weighed and adjusted to eleven pups (male and female) per dam to ensure a standard litter size per dam, with four males per litter. At weaning (day 21 after birth), female pups were given for adoption at Brest University Animal Facility. For each dam’s diet, male pups of each dam (seven dams per diet, four male pups per dam) were divided at weaning in two equal subgroups, one receiving the C diet (10–14 pups), the other one the HF diet without LC n-3 PUFA (HF diet, 11–14 pups) for 7 weeks before euthanasia (Fig. 1). The dams and pups were weighed twice a week all along the study.
Schematic overview of the experimental protocol.
At sacrifice (2 days after weaning for the dams and 7 weeks after weaning for the male offspring), dams and adult offspring were submitted to the same protocol. After 12 h fast in the dark phase, rats were randomised and were euthanised (decapitation after intra-peritoneal pentobarbital injection, 50 mg/kg). Half of each group of dams or of adult offspring received, 10 min before sacrifice, an intra-peritoneal injection of either 9‰ NaCl (vehicle) or 4 μg/kg of insulin (Umuline). Blood was immediately collected, and the plasma was separated by centrifugation and stored at –20°C until subsequent analysis. Liver, leg muscles (gastrocnemius) and peri-epididymal fat tissue were weighted and snap frozen into liquid N2 and stored at –80°C.
Oral glucose tolerance test
An oral glucose tolerance test (OGTT) (3 g/kg body weight) was performed in dams 3 d before mating, in pups at weaning (postnatal day 21) and 6 weeks after weaning (Fig. 1). After 12 h fasting, a local anaesthesia with lidocaine (5 % EMLA cream; AstraZeneca) was performed on the tail, and a vein blood sample was taken (t = 0). The glucose solution was then administrated orally by gavage. Blood samples were collected at 15, 30, 45, 60, 90 and 120 min. For each sample, a fraction was immediately used for glucose determination with a GLUCOTOUCH Pro Glucometer (Lifescan), another fraction was collected in heparinised tubes (Microvette; Sarstedt) and plasma was separated by centrifugation and stored at –20°C.
HOMA-IR score was calculated using the formula: fasting insulin (μIU/ml) × (fasting blood glucose (mmol/L)/22·5.
Milk and plasma glucose, insulin, leptin and NEFA plasma concentrations
Plasma insulin and leptin concentrations were determined using ELISA kits (Merck-Millipore). Plasma and milk NEFA concentrations were determined by a colorimetric method using a NEFA C kit (Wako Chemical).
Western blot
Liver, leg muscles (gastrocnemius) and peri-epididymal fat tissue (1 g) were ground in liquid N2 and tissue proteins were extracted in ice-cold buffer containing 150 mM NaCl, 10 mM Tris, 1 mM EDTA, 1 mM ethylene glycol-bis(β-aminoethyl ether)-N,N,N′,N′-tetraacetic acid (EGTA), 1 % triton, 0·5% NP40, 2 mM phenylmethylsulfonyl fluoride (PMSF), 10 µg/mL leupeptin, 10 µg/mL aprotinin, 100 mM Na fluoride, 10 mM Na pyrophosphate, 2 mM Na orthovanadate and pH 7·4. After 45 min on ice, homogenates were centrifuged 5 min at 10 000 g at 4°C. Protein concentrations in supernatants were determined by a DC protein assay (Bio-Rad). Lysates were separated by SDS-PAGE, and immunoblotting was performed using antibodies directed against Akt or Akt phosphorylated on Serine 473 or actin (secondary antibody Goat Anti-Rabbit HRP-linked at a concentration of 1/2500, ref #7074; primary antibody anti-Akt at a concentration of 1/1000, ref # 9272; primary antibody anti-pAkt Ser473 Akt at a concentration of 1/1000, ref #9271; primary antibody anti-actin at a concentration of 1/4000, ref #4970; Cell Signaling Technology). The results were analysed using Image J software to obtain the optical density (NIH). Actin was used as loading control.
Statistics
Data are presented as mean values with their standard error of the means. Statistical analyses were performed using ANOVA test and Bonferroni post-test with Prism statistics Software for MacOS system (Graphpad software Inc.). A P value < 0·05 was considered as statistically significant.
Results
Morphometric and biochemical characteristics of dams
Body weights were not different among the three groups at the start of the study as well as after 6 weeks of diet (Table 3). At the end of gestation, body weight was higher in HF and HFn-3 dams than in C dams (P = 0·031 and 0·039, respectively) with no difference between HF and HFn-3 dams (Table 4). Litter size was not different among the three groups (Table 3). At the end of lactation, body weight of HF dams was higher than that of HFn-3 (P = 0·031) and C groups (P = 0·034) (Table 3).
Morphometric and biochemical characteristics of dams
(Mean values with their standard error of the means)
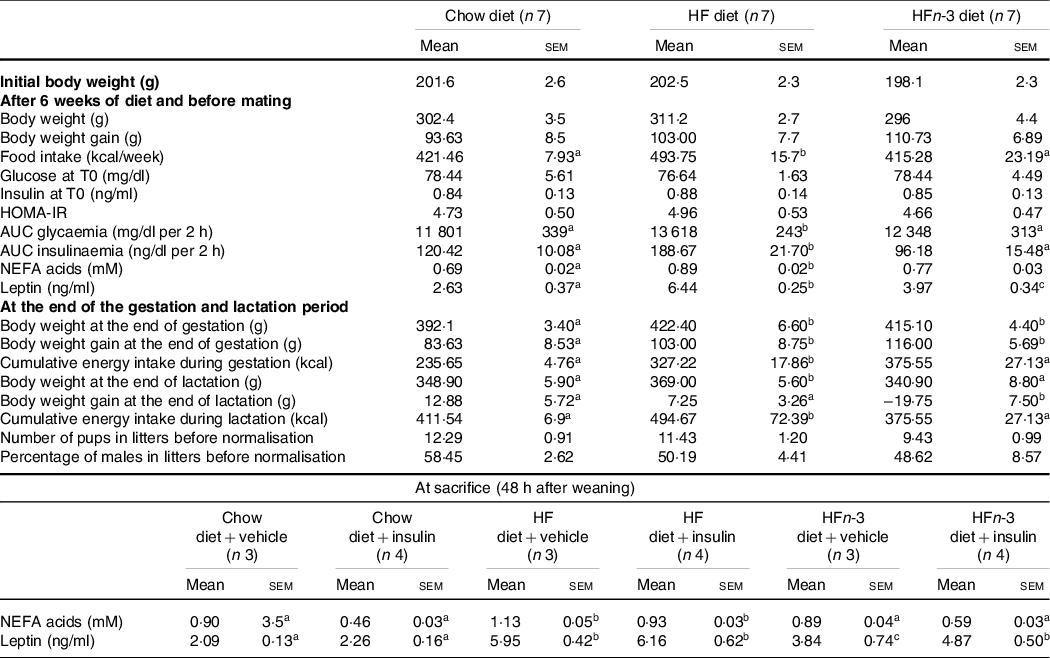
The number of rats per group is indicated under each heading. OGTT was performed in a fasting state (12 h). The difference for body weight after lactation was calculated between the body weight at the end of lactation and the body weight after birthing. HOMA-IR (homoeostasis model assessment of insulin resistance) score was calculated using the formula: fasting insulin (μIU/ml) × (fasting blood glucose (mmol/l)/22·5. Results for each parameter were analysed by one-way ANOVA or two-way ANOVA (data at sacrifice). For each row, data points with differing superscript letters (a,b) differ from each other by P < 0·05 by post hoc test after intergroup differences were found by one-way ANOVA.
Morphometric and biochemical characteristics of rat male offspring at weaning (day 21)
(Mean values with their standard error of the means)

HOMA-IR (homoeostasis model assessment of insulin resistance) score was calculated using the formula: fasting insulin (μIU/ml) × (fasting blood glucose (mmol/l)/22·5.The number of rats per group is indicated in the table heading. Results for each parameter were analysed by one-way ANOVA. For each row, data points with differing superscript letters (a, b) differ from each other by P < 0·05 or less by post hoc test after intergroup differences were found by one-way ANOVA.
Before and during gestation as well as during lactation, energy intake of HF-fed rats was higher than that of HFn-3 and C rats (P < 0·05) (Table 3); energy intake of HFn-3 was not different from that of C rats. The difference of food intake between groups occurred as soon as week 2 on the diet (data not shown).
After 6 weeks on their respective diets, NEFA concentrations were increased by 28 % in HF dams compared with C dams (0·89 (sem 0·02) mM v. 0·69 (sem 0·02) mM, P = 0·021, Table 3) reflecting the higher percentage of fat in the diet. NEFA plasma levels in HFn-3 dams (0·77 (sem 0·03) mM) were not different from those of HF and C dams (Table 3). Leptin plasma levels before gestation were different among the three groups with HF dams showing a 144 % increase as compared with C dams, while HFn-3 leptin levels were decreased by 38 % as compared with HF dams but were still higher than in C dams (Table 3).
At sacrifice, NEFA plasma levels were higher in HF dams than in C (P = 0·022) and HFn-3 dams (P = 0·021), but not different between HFn-3 and C dams (Table 3). Following insulin acute injection before sacrifice, NEFA plasma levels decreased significantly in C rats by 49 % (P = 0·001) and in HFn-3 rats by 30 % (P = 0·002) but not in HF-fed dams (Table 3). In addition, NEFA plasma levels of HFn-3 dams injected with insulin were statistically different and intermediate from that of C- and HF-insulin injected dams (P = 0·023 and 0·002, respectively; Table 3). As we observed before gestation, leptin plasma levels were higher in HF than in C dams (P = 0·004) and in HFn-3 ones (P = 0·031), but no difference was observed between HFn-3 and C dams (Table 3).
Effect of diet on glycaemic and insulinaemic responses to oral glucose tolerance test and peripheral tissues insulin signalling in dams
At time 0, glycaemia and insulinaemia were not different among the three groups. AUC of glycaemia and insulinaemia during OGTT before gestation were higher in HF than in HFn-3 (P = 0·032 and 0·015, respectively) and C rats (P = 0·025 and 0·026, respectively; Table 3). No difference was observed between HFn-3 and C rats (P = 0·264 and 0·244, respectively). HOMA-IR was not different between the three groups of dams (Table 3).
To determine if any of the diet altered insulin signalling, total Akt and Ser473 Akt phosphorylation were determined in liver, muscle and adipose tissue (AT) of dams at sacrifice. The activation of Akt occurs downstream of phosphoinositide 3’-kinase. Phosphoinositide 3’-kinase generates phosphatidylinositol-3,4,5-triphosphate PIP(3), a lipid second messenger essential for the translocation of PKB/Akt to the plasma membrane where it is phosphorylated and activated by phosphoinositide-dependent kinase-1. Akt is a key mediator of the distal steps in insulin signalling, such as modulation of glucose uptake by GLUT4, glycogen synthesis by glycogen synthase kinase (GSK3), protein and fat synthesis by mTOR and gene expression by forkhead family box O(Reference Roden and Shulman4).
Akt protein abundance remained unaffected by diets in any of the analysed tissues, as estimated by the ratio Akt/β-actin (Fig. 2(a)). Ser473 Akt phosphorylation was almost completely abolished in the three tissues of HF dams (ratio insulin/vehicle Ser473Akt < 1; Fig. 2(b)) while it was activated by 4- and 3-fold, respectively, in liver and muscle of HFn-3 dams (Fig. 2(b)). However, it was partially reduced in AT of HFn-3 dams as compared with C dams (P = 0·033) (Fig. 2(b)). This absence of impairment of the Ser473 Akt phosphorylation in HFn-3 dams may have contributed to the improved glucose tolerance during the OGTT.
Analysis of dams’ response to insulin at sacrifice after 12 h fasting. Insulin was injected intra-peritoneally at a dose of 4 μg/kg 10 min before euthanasia. C means chow, H means high fat, HFn-3 means high-fat n-3 enriched diet. (a) Western blots of Akt and phosphorylated Akt on Ser473. To ensure equal protein loading and transfer, membranes were reprobed for β-actin; (b) quantification of Ser473 Akt phosphorylation ratio insulin/vehicle. Data are mean values with their standard error of the means (n 7/group). For each tissue, data with differing superscripts differ from each other by P < 0·05 or less when assessed by one-way ANOVA followed by post hoc test.

Characteristics of rat male offspring at birth and at weaning (postnatal day 21)
No difference in sex ratio and number of pups per dam according to the dam’s diet was observed. At birth, the male offspring born to HF dams were heavier than those born to C dams (10·24 (sem 0·41) g v. 8·31 (sem 0·32) g, P = 0·007) or to HFn-3 dams (8·02 (sem 0·31) g, P = 0·006) while not difference occurred between C and HFn-3 pups (Table 4). At weaning, HF male offspring were heavier (46·64 (sem 1·38) g) than C (35·96 (sem 0·64) g, P = 0·001) and HFn-3 pups (32·85 (sem 1·29) g, P = 0·002) while body weight and body weight gain were not different between C and HFn-3 pups (Table 4). The difference in body weight between HF pups and C or HFn-3 pups increased every week during lactation (Table 4) and at weaning, HFn-3 male offspring gained 31·8 % less weight than HF male ones.
NEFA concentrations in the dam’s milk at weaning were higher in HF and HFn-3 than in C dams (8·09 (sem 0·30) mM and 7·43 (sem 0·30) v. 3·13 (sem 0·29) mM, P = 0·027 and 0·024, respectively). They were not different between HF and HFn-3 dams (Table 4).
Glucose, insulin, leptin and NEFA concentrations of pups at weaning
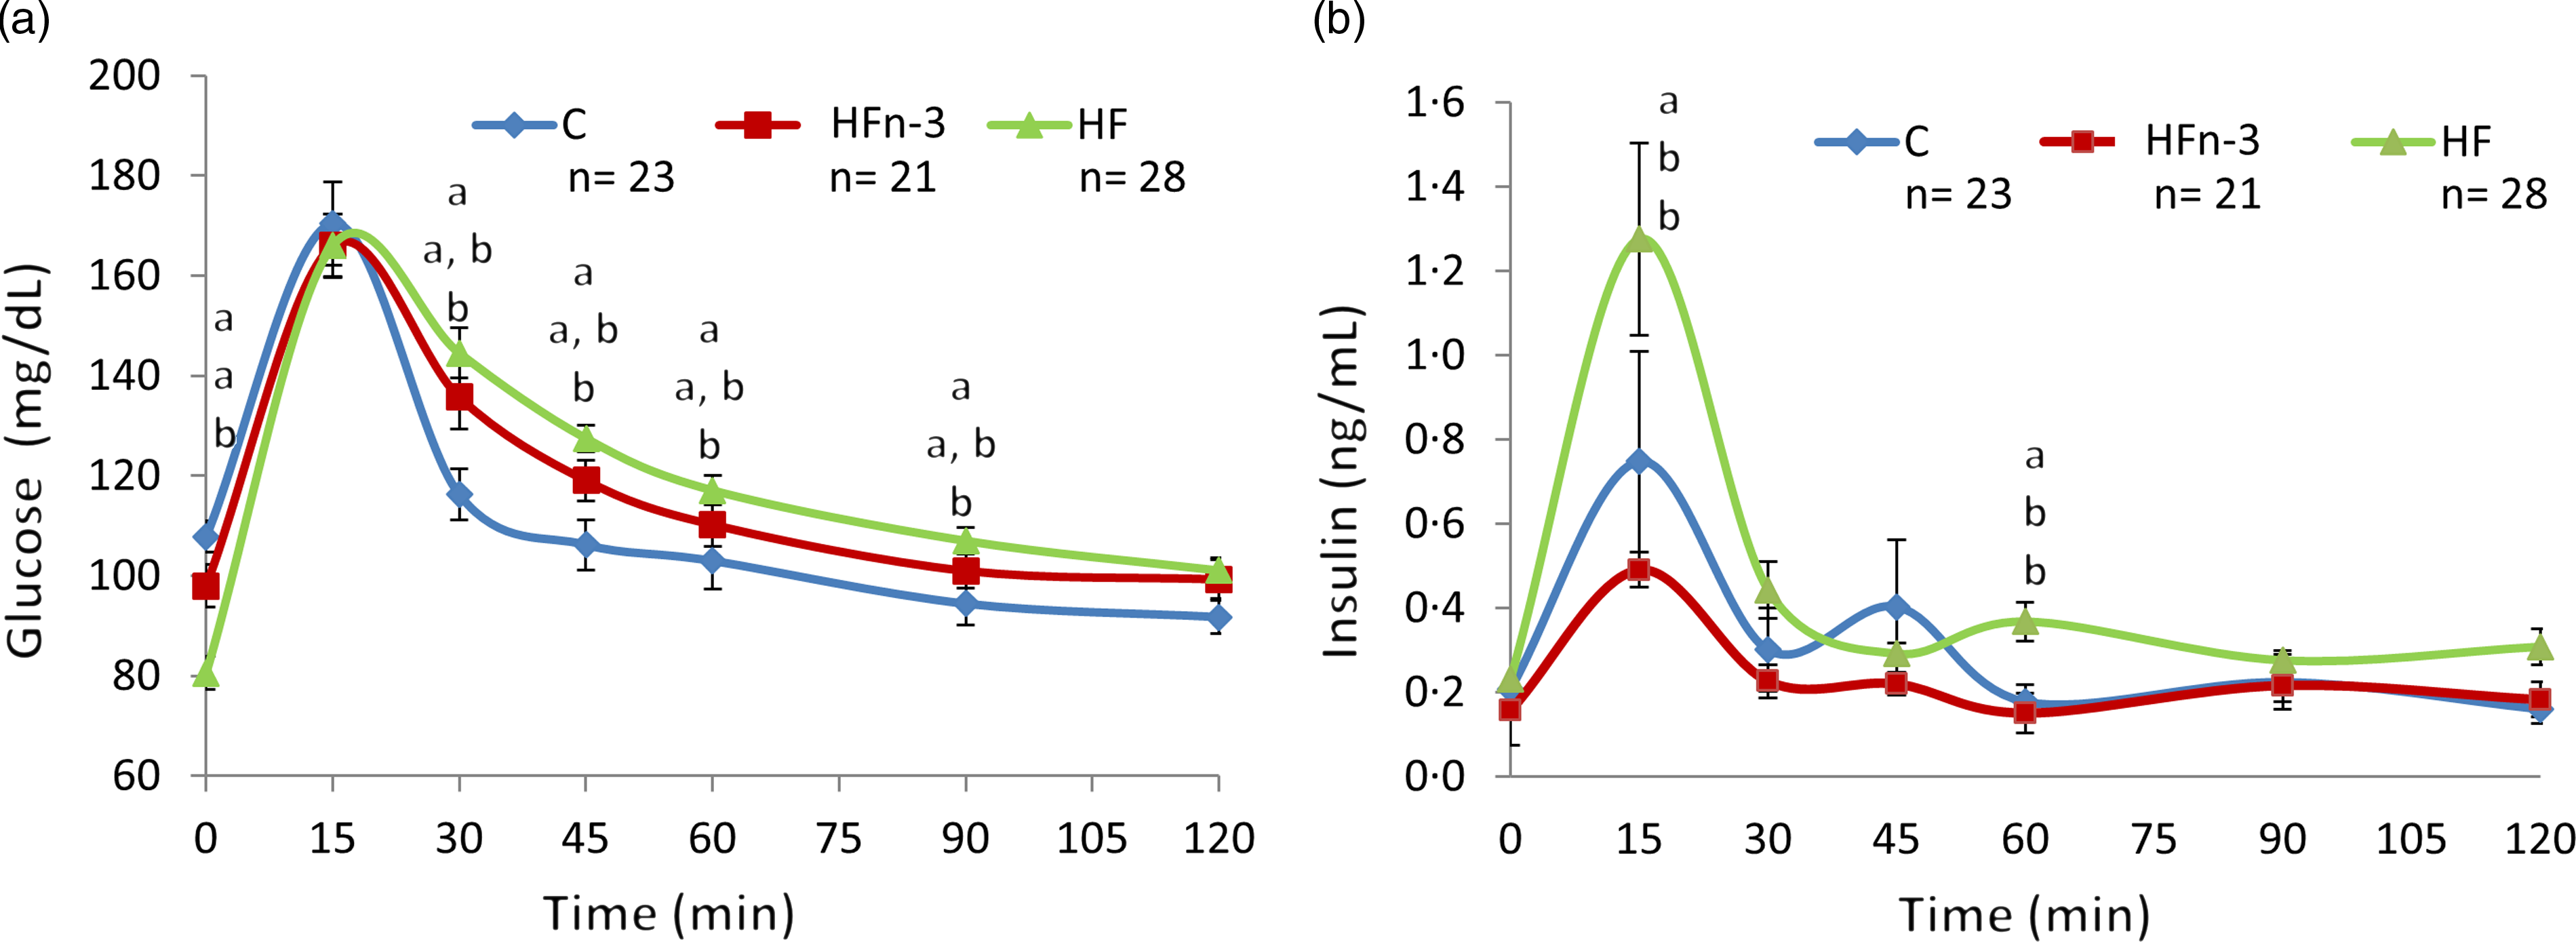
During OGTT, glycaemia was increased from time 30 min to time 90 min in HF pups as compared with C pups (P < 0·05) (Fig. 3(a)). Glycaemic response in HFn-3 pups was intermediate, but not different from that of HF and C offspring. AUC of glycaemia was higher in HF pups than in HFn-3 and C pups (P = 0·02 and 0·03, respectively), and not different between HFn-3 and C pups (Table 4). Even though glucose levels were decreased in HF pups, insulinaemia at time 0 was not different between the three groups (Table 4). However, insulin levels during OGTT were increased at time 15, 60, 120 min in HF pups as compared with C and HFn-3 pups (P < 0·05) (Fig. 3(b)). Insulin AUC was increased by 2-fold for HF pups as compared with HFn-3 pups (P = 0·006), whereas it was not different between HFn-3 and C ones. As a result, HF pups need to secrete more insulin than HFn-3 ones to maintain a glycaemia close to that of HFn-3 pups (Fig. 3, Table 4). HOMA-IR was not different between the three groups of pups (Table 4).
Oral glucose tolerance test at weaning after 12 h fasting (day 21). This figure related to Table 3. C means chow, H means high fat, HFn-3 means high-fat n-3 enriched diet. (a) Blood glucose plasma levels; (b) insulin plasma levels. Data are mean values with their standard error of the means (n 21–28/group). Data were analysed using a repeated-measures one-way ANOVA followed by post hoc test. For each time point, data with differing superscripts differ from each other by P < 0·05 or less when assessed by one-way ANOVA followed by post hoc test.
Basal plasma leptin levels were higher in HF (2·22 (sem 0·10) ng/ml) than in C pups (0·48 (sem 0·09) ng/ml, P = 0·003) and HFn-3 ones (1·19 (sem 0·10) ng/ml, P = 0·007), and in HFn-3 than in C pups (P = 0·012). Notably, they were higher in HFn-3 than in C rats (P = 0·004; Table 4) despite displaying similar body weight. Basal NEFA plasma concentrations were higher in HF and HFn-3 diet pups as compared with chow-fed ones (Table 4).
Body weight and energy intake of 9-week-old male rat offspring fed a C or HF diet for 6 weeks
After weaning, male rat’s offspring of each dam were randomly divided into two groups and fed either a chow diet (C-C, HF-C, HFn-3-C) or a HF diet (C-HF, HF-HF, HFn-3-HF) over 6 weeks (Fig. 1). HF-C rats presented a higher body weight than C-C (P = 0·036) or HFn-3-C ones (P = 0·029; Table 5). Nevertheless, body weight of C-C and HFn-3-C rats was not different (Table 5). Body weight of C-HF and HF-HF rats was similar, but body weight of HFn-3-HF rats was lower than that of C-HF and HF-HF pups (P = 0·039 and 0·026, respectively; Table 5).
Morphometric and biochemical characteristics of rat male offspring at 9 weeks old after 6 weeks of diet
(Mean values with their standard error of the means)
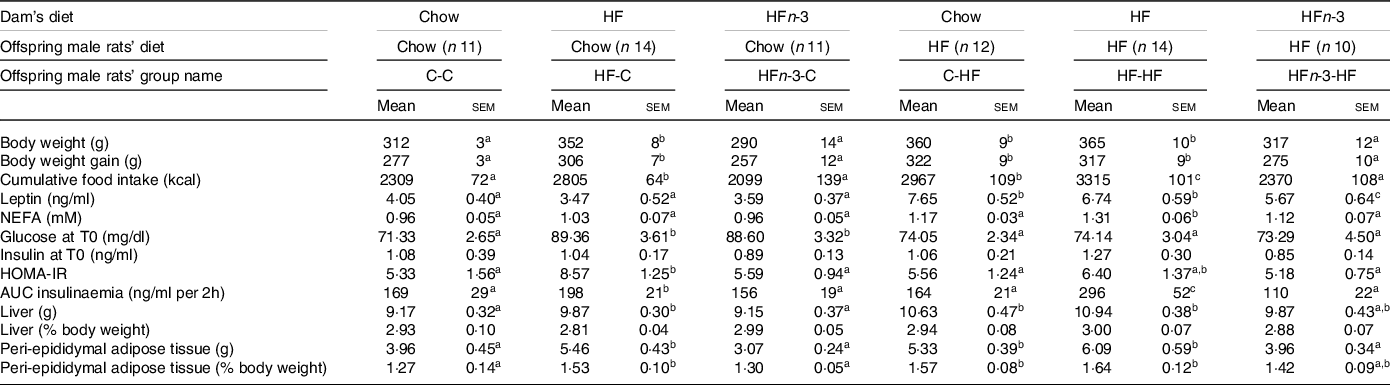
The first letter of the group corresponds to the dam’s diet and the second one to the pup’s one after weaning. HOMA-IR (homoeostasis model assessment of insulin resistance) score was calculated using the formula: fasting insulin (μIU/ml) × (fasting blood glucose (mmol/l)/22·5.The number of rats per group is indicated in the table heading. Results for each parameter were analysed by two-way ANOVA. For each row, data points with differing superscript letters (a, b, c, d) differ from each other by P < 0·05 or less by post hoc test after intergroup differences were found by two-way ANOVA.
Cumulated energy intake over 6 weeks was higher for HF-C pups than for C-C ones (P = 0·037) and HFn-3-C (P = 0·031), and not different between C-C and HFn-3-C rats (Table 5). Energy intake was also higher in HF-HF pups than in C-HF and HFn-3-HF pups (P = 0·043 and 0·037, respectively) while it was lower in HFn-3-HF than in C-HF rats (P < 0·05; Table 5). In male offspring fed a C diet after weaning, HFn-3 diet in gestation and lactation resulted in energy intake and weight gain similar to the ones observed for C diet, contrarily to HF one.
Glucose, insulin, leptin and NEFA plasma levels of 9-week-old male offspring
In C-fed rats after weaning, glycaemic response during OGTT was higher in HF-C and HFn-3-C than in C-C (P = 0·003), and not different between HF-C and HFn-3-C rats (Fig. 4(a)). The AUC of glycaemia was higher in HF-C and HFn-3-C rats than in C-C ones (P = 0·028 and 0·021, respectively), and not different between HF-C and HFn-3-C pups (Table 5). Insulinaemia was higher at time 15 min in HF-C rats than in C-C ones (P = 0·027; Fig. 4(c)). AUC of insulinaemia was higher in HF-C than in C-C and in HFn-3-C rats (P = 0·03 and 0·01, respectively), and similar between C-C and HFn-3-C rats (Table 5).
Oral glucose tolerance test in 9-week-old male rat offspring born to C, HF or HFn-3 dams and fed C or HF for 6 weeks after weaning, after a 12 h fast. This figure related to Table 4. The first letter corresponds to dam’s diet and the second one to pup’s one after weaning. C means chow, H means high fat, HFn-3 means high-fat n-3 enriched diet. (a) Glucose plasma levels when C diet post-weaning; (b) glucose plasma levels when HF diet post-weaning; (c) insulin plasma levels when C diet post-weaning; (d) insulin plasma levels when HF diet post-weaning. Data are mean values with their standard error of the means (n 10–14/group). Data were analysed using a repeated-measures one-way ANOVA followed by post hoc test. For each time point, data with differing superscripts differ from each other by P < 0·05 or less when assessed by one-way ANOVA followed by post hoc test.

In HF-fed rats, glycaemic response was higher at time 15 and 30 min in HF-HF than in C-HF and HFn-3-HF ones, and not different between C-HF and HFn-3-HF rats (Fig. 4(b)). AUC of glycaemia was higher in HF-HF rats than in C-HF and HFn-3-HF ones (P = 0·019 and 0·023, respectively), and different between C-HF and HFn-3-HF rats (P = 0·036; Table 5). In HF-fed male offspring, insulinaemia during the OGTT was higher from time 15 min to time 45 min in HF-HF rats than in C-HF and HFn-3-HF ones (P = 0·001 and 0·0006, respectively) (Fig. 4(d)); it was not different between C-HF and HFn-3-HF rats (Fig. 4(d)). In HF-fed rats, AUC of insulinaemia was higher in HF-HF rats than in C-HF and HFn-3-HF ones (P = 0·007 and 0·006, respectively) and was not different between C-HF and HFn-3-HFrats (Table 5). These results evidence that offspring born from HF diet-fed dams always present a higher AUC of insulinaemia independent of their post-weaning diet. This was not observed for HFn-3 fed dams whose offspring display values similar to the ones of rats born to C-fed dams (Table 5). HOMA-IR was lower in HFn-3-C pups as compared with HF-C pups and lower HOMA-IR in HFn-3-HF adult pups as compared with HF-HF pups (Table 5). Basal plasma NEFA concentrations were not different among the three groups of C-fed rats. Contrarily, they were higher in HF-HF pups than in C-HF and in HFn-3-HF pups (P = 0·0029 and 0·022, respectively). They were not different between C-HF and HFn-3-HF (Table 5).
Basal plasma leptin levels were not different among all C-fed groups (Table 5). In HF-fed male rat offspring, leptin concentration was higher in C-HF and HF-HF rats than in HFn-3-HF ones (P = 0·040 and 0·035, respectively). They were not different between C-HF and HF-HF rats (Table 5).
Liver weight (expressed as percentage of body weight) was not different among the twelve groups. However, peri-epididymal AT (expressed as percentage of body weight) was more important in C-HF and HF-HF rats than in their C-C and HF-C counterparts (P < 0·05; Table 5). This was not observed between HFn-3-HF and HFn-3-C rats (Table 5). Moreover, in HFn-3-HF rats, peri-epididymal AT mass was decreased by 14 and 22% as compared with C-HF and HF-HF, respectively (Table 5).
Physiological characteristics of male offspring at sacrifice
As described in the ‘Materials and methods’ section, at 10 weeks, each of the six groups was randomly divided into two subgroups: one receiving an intra-peritoneal saline injection and the other an intra-peritoneal insulin injection in order to activate insulin signalling (4 IU/kg of insulin).
As observed at time 0 during OGTT, plasma leptin concentration in the saline injected groups was higher in C-HF and HF-HF rats than in HFn-3-HF ones (P = 0·037 and 0·042, respectively) but was not different between C-HF and HF-HF ones (Table 6).
Biochemical characteristics of male rats offspring at sacrifice in a fasting state (12 h)
(Mean values with their standard error of the means)
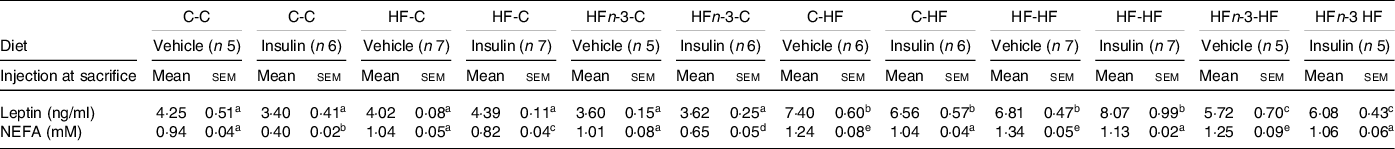
The first letter of the group corresponds to the dam’s diet and the second one to the pup’s one after weaning.
The number of rats per group is indicated in the table heading. Results for each parameter were analysed by two-way ANOVA. For each row, data points with differing superscript letters (a, b, c, d, e) differ from each other by P = 0·05 or less by post hoc test after intergroup differences were found by two-way ANOVA.
After saline injection, plasma NEFA concentration was higher in all HF-fed rats than in all C-fed rats groups (P < 0·05; Table 6). Following insulin, NEFA concentrations were decreased in all C-fed and HF-fed rats (P < 0·05; Table 6).
Akt expression and Ser473 phosphorylation in liver, muscle and peri-epididymal adipose tissue of male offspring at sacrifice
To assess whether HFn-3 dams feeding during gestation and lactation might improve insulin signalling in male offspring, the phosphorylation of Akt on Ser473 was determined after an insulin bolus at sacrifice, as performed for dams.
When compared with actin by western blot, Akt protein abundance did not vary between any pups’ groups in the three tissues (Fig. 5). However, differences occurred regarding to its phosphorylation on Ser473.
Akt and Ser473 Akt phosphorylation in the liver, muscle and peri-epididymal adipose tissue in response to insulin at sacrifice after 12 h fasting in 10-week-old male rats fed C or HF diet after weaning. This figure related to Table 5. The first letter corresponds to dam’s diet and the second one to the offspring’s one after weaning. C means chow, H means high fat, HFn-3 means high-fat n-3 enriched diet. Insulin was injected intra-peritoneally at 4 μg/kg 10 min before euthanasia. (a) Ser473 Akt phosphorylation in liver, muscle and adipose tissue of C-fed offspring; (b) western blots for Akt and Ser473 Akt phosphorylation in liver, muscle and adipose tissue of HF diet fed offspring. To ensure equal protein loading and transfer, membranes were reprobed for β-actin; (c) quantification of the Ser473 Akt phosphorylation ratio insulin/vehicle. Data are mean values with their standard error of the means (n 5–7/group). Data were analysed using a two-way ANOVA (factors: dams diet, offspring diet) followed by post hoc test. Fig. 5(c): For each tissue, data with differing superscripts differ from each other by P < 0·05 or less when analysed using a two-way ANOVA followed by post hoc test. For the liver: dams diet, F = 5·24, P = 0·03; offspring diet, F = 3·67, P = 0·04; interaction dams diet × offspring diet, F = 3·16, P = 0·04. For the muscle: dams diet, F = 10·73, P = 0·01; offspring diet, F = 9·35, P = 0·01; interaction dams diet × offspring diet, F = 7·83, P = 0·01. For the adipose tissue: dams diet, F = 2·06, P = 0·03; offspring diet, F = 1·87, P = 0·04; interaction dams diet × offspring diet, F = 1·58, P = 0·03.

In liver, a significant Ser473Akt phosphorylation occurred in C-C (P < 0·05) and in HFn-3-C rats (P < 0·05), while it was blunted in HF-C rats (Fig. 5(a) and (c)). Ser473Akt phosphorylation was decreased by 80 % in HFC and 53 % HFn-3-C male offspring as compared with C-C rats (P = 0·003 and 0·007, respectively, Fig. 5(c)). In addition, phosphorylation was significantly higher in HFn-3-C rats than in HF-C ones (P = 0·01; Fig. 5(c)). Similarly, when male offspring born to HFn-3 dams were fed HF post-weaning, Ser473Akt phosphorylation was decreased by only 20 % compared with C-HF diet fed rats (P = 0·03), which is far less than in HF-HF rats for which no phosphorylation occurred (Fig. 5(c)). Moreover, Ser473Akt phosphorylation in HFn-3-HF rats was similar to that of HF-C diet rats (Fig. 5(c)).
In muscle, Ser473Akt phosphorylation increased in all C-fed groups in response to insulin (Fig. 5(a) and (c)). Ser473Akt phosphorylation was higher in C-C than in HF-C rats (P = 0·033) and in a lesser extent higher in C-C rats than in HFn-3-C ones (P = 0·048; Fig. 5(c)). Notably, Ser473Akt phosphorylation was higher in HFn-3-C than in HF-C rats (P = 0·038; Fig. 5(c)).
In peri-epididymal AT, Ser473Akt was phosphorylated in response to the insulin bolus in C-C rats (by 3 folds in comparison with vehicle, P = 0·034) and in HFn-3-C pups (by 4·5 folds in comparison with vehicle, P = 0·021) but not in HF-C pups (Fig. 5(a) and (c)). In this tissue, Ser473Akt phosphorylation was significantly higher in HFn-3-C than in C-C pups (P = 0·040; Fig. 5(a) and (c)).
When male offspring born to C, HF, HFn-3 diet were fed with a HF diet after weaning, Ser473Akt was not phosphorylated following insulin application, in muscle and peri-epididymal AT (Fig. 5(b) and (c)).
Discussion
The aim of this study was to test the hypothesis that feeding dams a HF diet enriched in n-3 FA during gestation and lactation would prevent metabolic alterations observed when fed a HF diet, as far as the adult male offspring is fed a C diet after weaning.
We show that adult offspring exposed to LC n-3PUFA during gestation and lactation were protected against excessive weight gain and energy intake, obesity, glucose intolerance (GI) and IR when C or HF fed after weaning as compared with offspring of HF diet fed dams. The discrepancy observed between this protective effect in rats (our study and others) and the lack of effect in humans can be explained by species-specific differences in terms of defined windows of development of AT and beta cells. In addition, the model used in our study (a very HF diet) in dams and the amount of LC n-3 PUFA given are not expandable to human diet.
After 6 weeks of diet and before pregnancy, body weight of dams was not different among the groups even though their energy intake was higher in HF than in C and HFn-3 dams. The lack of body weight difference in HF dams although slightly higher than in the other two groups may result from a lack of statistical power. The absence of body weight difference in HF dams has been previously described in the literature. Female rats or mice are notoriously known to be resistant to HF diet feeding contrary to male rats(Reference Pettersson, Waldén and Carlsson41). Oestrogens have been proposed to exert a protective effect against IR and the metabolic syndrome since the prevalence of these symptoms increases in menopausal women(Reference Shi and Clegg42).
As expected, and after 6 weeks on HF diet, the glycaemic and insulinaemic responses and the NEFA plasma levels were higher in HF than in C dams, reflecting GI and IR of both glucose metabolism and lipolysis. These alterations were not observed in HFn-3 rats, confirming their preventive effect towards IR in rodents as reported in many studies(Reference Delarue14). Although higher in HFn-3 than in C dams, plasma leptin concentrations were lower in HFn-3 than in HF dams, related to a probable lower fat mass and/or reduced leptin expression in AT as previously observed(Reference Sharma and Agnihotri43,Reference Ukropec, Reseland and Gasperikova44) . These results are also in agreement with those obtained the day of sacrifice of dams.
At sacrifice and after 12 weeks of diet, HF diet hampered lipid mobilisation in response to insulin, as evidenced by NEFA plasma concentrations. LC n-3 PUFA prevented this alteration as HFn-3 dams displayed similar NEFA plasma concentration as C dams following insulin bolus, reflecting an increased insulin sensitivity of lipolysis by LC n-3 PUFA. Consistent with these results, the defect of Akt Ser473 phosphorylation induced by the HF diet was completely prevented in HFn-3 dams in liver and muscle and partially in AT as previously observed(Reference Le Foll, Corporeau and Le Guen45,Reference Nasu-Kawaharada, Nakamura and Kakarla46) .
Dam’s diet did not influence the number of pups per litter or the sex ratio in our experiments as previously reported(Reference Zheng, Xiao and Zhang47,Reference George, Draycott and Muir48) . Pups born to HF dams were heavier at birth and during the lactation period than those born to C dams, as previously reported(Reference Nasu-Kawaharada, Nakamura and Kakarla46,Reference Zheng, Xiao and Zhang47) . At birth, body weight of male offspring of HFn-3 dams was similar to the body weight of male offspring born to C dams, as previously reported(Reference George, Draycott and Muir48). This effect was also observed throughout the lactation period, demonstrating a protective effect of LC n-3 PUFA towards maternal HF diet maternal-fetal transmission of excess weight during gestation and lactation(Reference Nasu-Kawaharada, Nakamura and Kakarla46,Reference George, Draycott and Muir48) . In accordance with previous results, we observed that NEFA concentrations in the milk of HF and HFn-3 dams were not different and were higher than in milk of C dams(Reference Hussain, Nookaew and Khoomrung32,Reference Zheng, Xiao and Zhang47–Reference Rolls, Gurr and Van Duijvenvoorde50) . Although the composition of milk was not assessed in the present study, others have shown in mice that the composition of milk following fish oil intake mirrored that of maternal diet(Reference Hussain, Nookaew and Khoomrung32,Reference Rolls, Gurr and Van Duijvenvoorde50,Reference Priego, Sanchez and García51) .
At weaning, the higher leptin plasma concentrations in HF than in C offspring have been previously reported(Reference Shankar, Kang and Harrell52); it can be related to a higher fat mass and/or higher milk leptin concentrations(Reference Bautista, Montaño and Ramirez53–Reference Sun, Purcell and Terrillion55). Even though HFn-3 male offspring display similar body weight as C male offspring, leptin plasma levels of HFn-3 male offspring were lower than that of HF male offspring, but higher than that of C male offspring. This could be explained by a lower fat mass(Reference Hussain, Nookaew and Khoomrung32) and/or leptin concentrations in milk(Reference Zambrano, Rodríguez-González and Reyes-Castro54) and/or expression in AT(Reference Sharma and Agnihotri43,Reference Rostami, Samadi and Yuzbashian56) . In addition to a higher body weight, at weaning, male offspring from HF dams had higher glycaemic and insulinaemic responses to OGTT reflecting both GI and IR as reported in mice(Reference Nasu-Kawaharada, Nakamura and Kakarla46). In offspring of HFn-3 dams, insulinaemic and glycaemic responses were not different from that of offspring of C dams but different from that of HF male offspring. This demonstrates that LC n-3 PUFA have a protective effect towards HF diet programmed IR at weaning as reported in mice(Reference George, Draycott and Muir48).
To assess whether LC n-3 PUFA could also modulate fetal imprinting at adulthood, the three offspring groups were fed over a 6-week period following weaning either a C or a HF diet without LC n-3 PUFA. In adults fed a C control diet, body weight of male offspring of C and HFn-3 dams was lower than those born to HF dams after 6 weeks of diet. When weanling rats were fed a HF diet, the body weight of the adult male offspring of HFn-3 dams remained similar to that of rats born to C dams fed the C diet, while the HF diet induced an increase in body weight in C and HF dams’ male offspring. However, the increase in body weight remained lower in adult pups from C dams than in pups from HF dams. Altogether, these results demonstrate the ability of LC n-3 PUFA to prevent, in adulthood, the HF diet-induced programming of obesity. This effect can be explained, at least partly, by the lower energy intake of adult rats born to HFn-3 dams after both the C and HF diet. In offspring from HFn-3 dams, leptinaemia in response to the HF diet was less increased than in offspring of C and HF dams. Indeed, hyperleptinaemia and leptin resistance have been reported in weanling rats from HF diet fed dams(Reference Ferezou-Viala, Roy and Serougne57). The lower leptin levels observed in male offspring from HFn-3 rats fed HF diet after weaning may result from a lesser fat mass and we may also hypothesise a leptin-sensitising effect of LC n-3 PUFA. Indeed, in mice, DHA decreases HF diet-induced hypothalamic inflammation and improved hypothalamic signalling pathway of leptin(Reference Cheng, Hu and Shi58). This leptin sensitising effect of LC n-3 PUFA could have contributed to the lower energy intake of adult male rats born to HFn-3 dams. The effect of LC n-3 PUFA given during gestation and lactation may also result partly from a reorganisation of the arcuate nucleus to paraventricular nucleus of the hypothalamus neuronal circuitry that is impaired with a HF diet during gestation and lactation, resulting in increase in expression of orexigenic peptides(Reference Chang, Gaysinskaya and Karatayev59,Reference Schipper, Bouyer and Oosting60) . Furthermore, it is of interest to note that an elevated sensation of fullness following a diet rich in LC n-3 PUFA has been reported in overweight and obese patients(Reference Parra, Ramel and Bandarra61).
The adult male offspring of HF dams displayed a higher glycaemic and insulinaemic response to OGTT than those born to C dams, both after being fed the C or the HF diet as previously reported(Reference Howie, Deborah and Sloboda62,Reference Latouche, Heywood and Henry63) . Offspring of HFn-3 diet fed dams displayed an insulinaemic response similar to that of offspring born to C dams, while their glycaemic response was intermediate between that of offspring of C and of HF dams. The fact that we did not perform an insulin tolerance test to assess insulin sensitivity is a limitation to formally assert that IR has been prevented. However, the lower HOMA-IR observed in HFn-3-C pups as compared with HF-C pups and the lower HOMA-IR observed in HFn-3-HF adult pups as compared with HF-HF pups (Table 5) may suggest that, when given a HF diet without LC n-3 PUFA, IR of adult pups has been at least partially prevented by LC n-3 PUFA given to dams. To assess the effectiveness of insulin response in male offspring, insulin signalling activation was measured through the expression of Akt protein and its phosphorylation on Ser473. Expression of Akt was not altered in any of our experiments. The amplitude of Akt phosphorylation in offspring of C dams fed a C diet was the highest in muscle as compared with liver and peri-epididymal AT. The post-weaning HF diet profoundly depressed Akt phosphorylation in the three tissues in offspring of C dams in agreement with previous results(Reference Latouche, Heywood and Henry63). Ser473 Akt phosphorylation was deeply depressed in liver and AT and to a lesser extent in muscle when offspring of HF dams were fed the C diet, in comparison with male offspring of C dams fed a C diet after weaning indicating that insulin signalling is hampered in C-fed HF dam male offspring, as previously observed(Reference Le Foll, Corporeau and Le Guen45,Reference Nasu-Kawaharada, Nakamura and Kakarla46,Reference Shankar, Kang and Harrell52) . The HF diet after weaning of HF pups further amplified the depression of Akt phosphorylation in muscle. Ser473Akt phosphorylation in offspring of HFn-3 dams fed a C diet after weaning was less depressed in liver and muscle as compared with what was observed for offspring of HF dams fed a C diet, indicating partial protection of insulin signalling in HFn-3 male offspring fed a C diet. HF-diet feeding post-weaning of HFn-3 male offspring reversed this protective effect, agreeing with their IR. However, Ser473Akt phosphorylation in liver of HFn-3-HF rats was similar to that of HFn-3-C rats, which might contribute to the improvement of their glucose tolerance in comparison with that of HF-HF ones. Moreover, Ser473Akt phosphorylation in male HFn-3-C rats was also greater than that of C-C and HF-C rats in peri-epididymal AT, which demonstrates a tissue-specific protective effect of LC n-3 diet towards fetal programming of IR. This tissue-specific effect of LC n-3 PUFA confirms our previous observations made in a different model of IR(Reference Taouis, Dagou and Ster13,Reference Le Foll, Corporeau and Le Guen45) . A protective effect towards fetal programming of IR in liver has also been reported by Wang et al.(Reference Wang, Wu and Zhang30). In this study, no other insulin sensitive tissues were assessed, thus preventing us to determine whether n-3 PUFA also exerted other tissue-specific effect. Similarly, in the transgenic model Fat1 C57BL6 mice, characterised by a very high content of LC n-3 PUFA in tissues, excessive placental and liver growth during pregnancy was prevented, and better insulin sensitivity was observed as compared with wild-type mice. This was associated with a lower macrophage infiltration of AT in adulthood(Reference Heerwagen, Stewart and de la Houssaye29). However, in our work, when fed a HF diet after weaning, offspring of HFn-3 dams displayed a depression of Ser473Akt phosphorylation in muscle and peri-epididymal AT, similar to that of HF-HF rats, so that in these dietary conditions LC n-3 PUFA were no more protective. A possible explanation may be a lower amount of LC n-3 PUFA incorporated into tissues in adulthood (10 weeks after weaning) than in other studies(Reference Taouis, Dagou and Ster13,Reference Storlien, Kraegen and Chisholm64–Reference Neschen, Moore and Regittnig67) , inasmuch as on difference with Ramalingham et al. study(Reference Ramalingam, Menikdiwela and Clevenger68), our rats did not received LC n-3 PUFA in their diets after weaning.
Several mechanisms could have contributed to the protective effect of LC n-3 PUFA towards fetal imprinting. Maternal oocyte quality and conceptus metabolism are altered in rodents that are obese or fed diets with altered nutrient composition pre-gestationally. Similarly, in humans, women who were obese had lower levels of SFA and polyunsaturated n-3 FA across all studied stages of oocyte development, and overweight women had lower n-3 FA in Metaphase II oocytes, which can contribute to alter embryo development and metabolism at the cell signalling level(Reference Matorras, Exposito and Ferrando69). LC n-3 PUFA given to infertile women improve oocyte quality(Reference Abodi, De Cosmi and Parazzini70), so that, beyond their positive effect on fertility, they could also participate to improve fetal programming in obese.
The placenta contributes to modulate the risks of diseases during adulthood by modulating its metabolism(Reference Sferruzzi-Perri and Camm71). Placental size, shape and transport function are important for fetal growth and development. The delivery of maternal LC-PUFA to the fetus is largely mediated via the placental transport, metabolic and adaptive functionalities. Supplementation of n-3 PUFA is beneficial for the obese and overweight women by maintaining optimal FA levels during gestation by inhibiting the placental ability to esterify and store lipids(Reference Calabuig-Navarro, Puchowicz and Glazebrook72). Dietary n-3 PUFA play a key role in various placental functions, with particular focus on placental inflammation(Reference Jones, Mark and Waddell73), and oxidative stress, factors implicated in development of IR.
LC n-3 PUFA can also play a protective role via their epigenetic effect on non-coding RNA, methylation of DNA and histone modifications(Reference Amatruda, Ippolito and Vizzuso74). Hepatic IR results for a part from several epigenetic alterations(Reference Maude, Sanchez-Cabanillas and Cebola75), as obesity-associated type 2 diabetes(Reference Ibrahim76). In rodents, being overweight and having excessive fat or sugar absorption are associated with alterations in DNA methylation patterns. These modifications affect the promoter regions of several genes, including leptin promoter(Reference Milagro, Campión and García-Díaz77), NADH dehydrogenase (ubiquinone)1 subcomplex subunit 6 (ND UFB6) and FA synthase, which play an important role on energy homoeostasis and obesity(Reference Lomba, Martínez and García-Díaz78).
Rats’ visceral adipocytes’ CpG 15 has been shown to be hypomethylated, and numerous CpG sites in the leptin promoter region were hypermethylated as a result of a HF, high-sucrose diet(Reference Uriarte, Paternain and Milagro79). Changing to a normal energetic diet also reversed the HF sucrose-induced DNA methylation alterations at these CpG sites. Additionally, these dietary-related modifications have been linked to hypermethylated CpG on the promoters of the peroxisome proliferator-activated receptorγ(PPARG C1A) and FA synthase, as well as a CpG site of the sterol regulatory element binding transcription factor 1 (SREB F1), all transcription factors known to be targets of anti-lipogenic effects of LC n-3 PUFA in liver(Reference Jump80).
The levels of DNA methylation in neonatal blood are associated with IR in 5-year-old children(Reference van Dijk, Peters and Buckley81). In the models of maternal HF diet in mice, offspring display epigenetic modifications in the liver, including widespread hypermethylation and altered gene expression along with changes in the enrichment of active promoter histone marks(Reference Seki, Suzuki and Guo82,Reference Suter, Ma and Vuguin83) . Maternal HF diet also led to the altered expression of genes encoding the epigenetic machinery in offspring, particularly those in the histone acetylation pathway such as SIRT1(Reference Suter, Ma and Vuguin83). SIRT1 overexpression has been reported to attenuate the effects of a maternal HF diet in offspring and protect against hepatic steatosis and IR(Reference Li, Xu and Giles84). In the fat-1 model, SIRT1 is overexpressed(Reference Rahman, Halade and Bhattacharya85).
It has been shown that LC n-3 PUFA given to dams or to mothers had epigenetic effects(Reference Burdge and Lillycrop86–Reference Basak and Duttaroy88). MicroRNA-143 (miR-143) seems to stimulate adipocytes’ differentiation and is correlated with obese condition in mice fed with a HF diet. The expression of miR-143 and PPAR is increased by DHA, suggesting a potential role in AT differentiation(Reference McGregor and Choi89). One animal experiment evaluated DHA epigenetic impact on histone acetylation, possibly correlated with the MetS pathways. This work reported that n-3 FA have a beneficial effect on dyslipidaemia-induced epigenetic changes in maternal placenta and fetal liver of weanling female Wistar rats fed with control and different HF diets (HF lard or HF fish oil). Maternal dyslipidaemia caused a 4·75-fold increase in fetal liver TAG accumulation with a 78 % decrease in the DNA-binding ability of PPAR-α. The combination EPA + DHA had a profound effect on modulating DNA methylation and histone acetylation in placenta and fetal liver(Reference Ramaiyan and Talahalli90). A randomised controlled trial showed that prenatal DHA supplementation (800 mg/d given in pregnant women) induced a difference of methylation in twenty-one regions at birth some of which persisted until age of 5 years(Reference van Dijk, Zhou and Peters91). Altogether, it can be proposed that LC n-3 PUFA given to dams in our study could have exerted part of their protective effect through repairing epigenetic alteration induced by HF diet on some transcription factors, especially those implicated in liver/AT lipogenesis, inflammation and reticulum endoplasmic stress.
Another mechanism of the protective effect of LC n-3 PUFA could have been through the reversal of ‘whitening’ of brown adipose tissue (BAT) towards browning. Indeed, very recently, Hao et al.(Reference Hao, Nie and Chen92) have shown that a HF diet induced a ‘whitening’ of AT due to large lipid droplet accumulation within BAT cells, associated with obesity in wild-type mice, whereas the changes in body fat mass and BAT morphology were significantly alleviated in fat-1 mice. In addition, Tsuji et al.(Reference Tsuji, Bussberg and MacDonald93) demonstrated that the transplantation of BAT from fat-1 mice to wild-type mice fed a HF diet counteracted the metabolic abnormalities such as GI and increased energy expenditure. Fan et al.(Reference Fan, Toney and Jang94) have shown that LC n-3 PUFA given to dams promoted fetal BAT development through epigenetic modifications. The offspring received maternal n-3 PUFA nutrition exhibited a significant increase in whole-body energy expenditure. These data are in accordance with other studies in mice(Reference Yue, Liu and Zhang95,Reference Wei, Hu and Huang96) .
Conclusion
Altogether, our results demonstrate that LC n-3 PUFA given to HF diet-fed rats 6 weeks before mating and throughout gestation and lactation prevent excess body weight gain, and GI in the offspring at birth and until weaning. This protective effect towards obesity persisted at adulthood even when the offspring did no longer receive LC n-3 PUFA into their diet. The lower AUC of insulinaemia during OGTT and lower HOMA-IR of adult pups after a HF diet without of LC n-3 PUFA may suggest that IR was at least partially prevented by the LCn-3 PUFA given to dams. Furthermore, when fed a chow diet after weaning, the alteration of insulin signalling was completely prevented in AT, and partially prevented in liver and muscle, in adult male offspring of HFn-3 fed dams as compared with male offspring of HF-fed dam.
Acknowledgements
The authors would like to acknowledge Séverine Loisel and Christelle Goanvec for scientific discussions. The authors also thank Marie-Françoise Scoazec and Manuel Feillant for their technical daily support and advices with the animals.
This work was financed by a grant from Region Bretagne (JD) and a grant from the ALFEDIAM/Sanofi-Aventis (CLF).
C. L. F. and N. G. contributed to conceptualisation. C. L. F. and J. D. acquired funding. N. G. and C. L. F. contributed to methodology, investigation and formal analysis. NG wrote the original draft. N. G., C. L. F. and J. D. reviewed and edited the final version. All authors contributed to the article and approved the submitted version.
The authors have no conflict of interest related to this paper.


