Early programming refers to prenatal and early postnatal factors that may influence the risk of developing chronic disease in adulthood(Reference Vickers1). Emerging evidence suggests that early life growth patterns play an important role in the aetiology of obesity(Reference Ogden, Carroll and Kit2). Infant feeding mode such as early introduction of solid foods and formula feeding seems to affect the risk of developing obesity(Reference Huh, Rifas-Shiman and Taveras3), although results are conflicting(Reference Moorcroft, Marshall and McCormick4). Breastfeeding has been proposed to decrease the risk of obesity and to lower serum cholesterol levels in adulthood(Reference Owen, Whincup and Kaye5). Besides diet, another environmental exposure implicated in obesity development and associated metabolic disorders is the gut microbiota(Reference Delzenne, Neyrinck and Bäckhed6). At birth, the infant colon is rapidly colonised by microbes(Reference Adlerberth and Wold7). During weaning, there is increasing diversity of gut microbiota, but it takes years before the commensal microbiota is established. Gut microbiota can make an impact on metabolism by fermentation of nutrients and secretion of bioactive compounds(Reference Delzenne and Cani8), and may exert effects on host gene expression in the enterohepatic system, including genes involved in metabolism and immune function. A disturbed gut microbiome, with increased numbers of Firmicutes and decreased numbers of Bacteroidetes, was demonstrated to be linked to energy harvest and obesity(Reference Ley, Bäckhed and Turnbaugh9), first in animal models and later also in human subjects(Reference Kalliomäki, Salminen and Isolauri10–Reference Turnbaugh, Ridaura and Faith12). This was followed by a report on aberrancies in infant gut microbiota preceding the development of obesity(Reference Kalliomäki, Collado and Salminen13), thereby proposing a possibility for prevention of obesity and associated metabolic disorders by modulation of gut microbiota.
Probiotics, ‘live micro-organisms which when administered in adequate amounts confer a health benefit on the host’(14) have been proposed to affect metabolic programming(Reference Laitinen, Collado and Isolauri15, Reference Ooi and Liong16) and blood lipid concentrations. Animal studies have shown that the probiotic Lactobacillus paracasei ssp. paracasei strain F19 (LF19) induced up-regulation of genes involved in regulation of energy homeostasis(Reference Nerstedt, Nilsson and Ohlson17), reduced body fat and affected the lipoprotein profile(Reference Aronsson, Huang and Parini18). Collectively, these studies suggest that LF19 may influence body composition as well as metabolic programming. However, whether these findings can be extrapolated to human subjects need to be verified.
The methodology of studying biochemical processes in biofluids and tissues, based on concentration changes of low molecular compounds, i.e. metabolites, is commonly known as metabolomics(Reference Fiehn19). Metabolomics involves a combination of sensitive analytical techniques for metabolite detection and quantification and bioinformatics based on multivariate statistics for data analysis and evaluation. The methodology has been demonstrated as effective in screening for biomarkers or biomarker patterns and for understanding the underlying mechanisms of different biochemical processes(Reference Kell20, Reference Wang, Klipfell and Bennett21). Due to the close relationship among nutrients, gene transcription, gene expression and ultimately metabolism, the interest for metabolomics as a tool in nutritional research has rapidly increased. This also includes studying the effects of gut microbiota and microbial manipulation by probiotics on the human phenotype and ultimately how this can be utilised in the development towards personalised disease prevention by means of dietary modifications(Reference Brennan22).
Therefore, we explored the effects of supplementation with LF19 during weaning on the serum lipid profile and global plasma metabolome.
Methods
Subjects
The present study is part of a double-blind, placebo-controlled, randomised intervention trial on the effects of feeding the probiotic LF19 from 4 to 13 months of age. The study was registered at www.clinicaltrials.gov (NCT 00894816). The design has previously been described in detail(Reference West, Gothefors and Granström23). Briefly, the trial was conducted from August 2000 to November 2003. Inclusion criteria were healthy infants born at term, vaginally delivered with a birth weight >2500 g, no atopic manifestation or medication that could have affected gut microbiota, i.e. antibiotics or prior pre- or probiotic intake. Written and oral information was provided before enrolment, and written consent was signed by the parents. Infants were randomised to daily intake of cereals with or without the addition of 1 × 10⁸ colony-forming units of strain LF19. The cereals contained cows' milk protein and were rice-based from 4 to 6 and wheat-based from 6 to 13 months of age. The composition of cereals is displayed in Table 1. The recommended intake was at least one serving of cereals daily from 4 to 13 months of age. Mean daily intake was 0·8 (sd 0·5) and 0·9 (sd 0·4) servings daily in the LF19 and placebo groups(Reference West, Gothefors and Granström23), respectively. Parents were asked to abstain from feeding the infant other probiotic-containing products. No other dietary advice was given. Breastfeeding duration, intake of cereals and intake of other probiotics were prospectively followed by use of diary cards(Reference West, Gothefors and Granström23). Of 179 included infants, 171 completed the intervention; eighty-four and eighty-seven infants in the LF19 and placebo groups, respectively. The study was conducted following the World Medical Association Declaration of Helsinki(24). Approval of the trial was obtained from the ethics committee of the Medical Faculty of Umeå University.
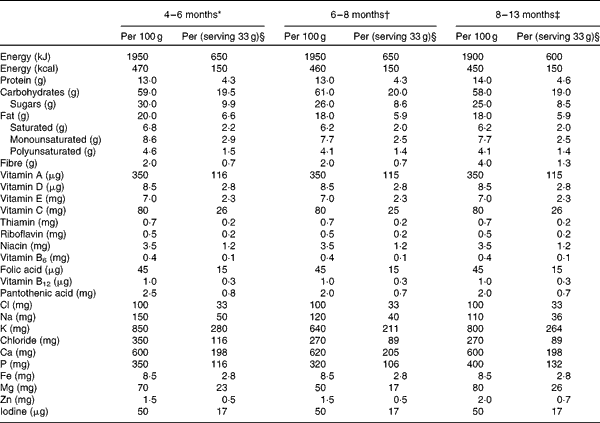
Nutrient content of the study cereals

* Ingredients: rice starch, skimmed milk powder, vegetable oil (palm, rapeseed or sunflower), pineapple juice concentrate (16 %), banana powder (8 %), unsalted whey powder, oat starch, wheat starch, milk protein, emulsifier (vegetable mono- and diacylglycerols), vitamins and minerals, as indicated above.
† Ingredients: skimmed milk powder, rice starch, wheat starch, vegetable oil (palm, rapeseed and sunflower), apple juice concentrate (14 %), pear juice concentrate (7 %), dried apple (4·5 %), milk protein, emulsifier (vegetable mono- and diacylglycerols), vitamins and minerals, as indicated above.
‡ Ingredients: skimmed milk powder, graham starch, vegetable oil (palm, rapeseed, sunflower), pear juice concentrate (12 %), rice starch, oat starch, banana powder (9·5 %), dried plum (3·5 %), milk protein), emulsifier (vegetable mono- and diacylglycerols), vitamins and minerals as indicated above.
§ One serving of cereals contained 108 colony-forming units of Lactobacillus paracasei ssp. paracasei F19.
Anthropometric data and blood samplings
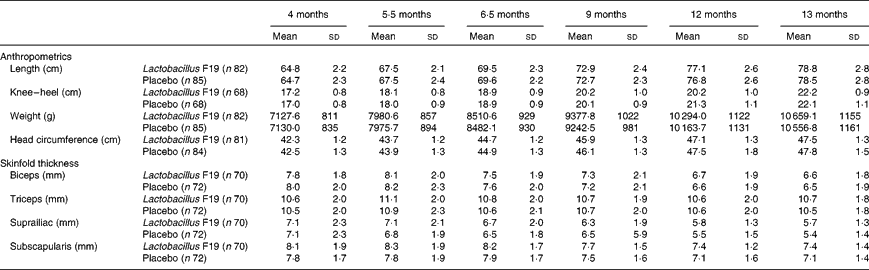
Weight, length, head circumference, knee–heel length and skinfold thickness were assessed at 4 (entry), 5·5, 6·5, 9, 12 and 13 months of age. Infants were weighed to the nearest 0·01 kg using a Seca 835 digital baby scale (Seca), and recumbent length was measured to the nearest mm using a Harpenden infantometer (CMS Weighing Equipment). Head circumference was measured using a non-elastic tape measure to the nearest mm. Knee–heel length was measured using an infant knemometer (Infant Knemometer BK5, FORCE Instituttet). Triceps, biceps, suprailiac and subscapular skinfold thicknesses were measured using a standard skinfold caliper (Harpenden skinfold caliper HSK-BI, British Indicators), which was operated with a constant pressure of 10 g/mm2.
Venous blood samples were collected at 5·5 and 13 months of age. Sera were stored at − 20°C until analysis. Plasma was stored at − 70°C until analysis.
Biochemical analyses
In total, serum samples were available from eighty-two and eighty-five infants in the LF19 and placebo groups, respectively. Of these, serum samples drawn at 5·5 months of age were available from sixty-eight and sixty-seven infants in the LF19 and placebo groups, respectively. The corresponding number at 13 months of age was seventy-three in both groups. Serum lipids were analysed for total cholesterol (TC), HDL-cholesterol, ApoA1, ApoB and TAG by the Roche/Hitachi method, which is the routine analysis used at the Department of Clinical Chemistry at Umeå University hospital. LDL-cholesterol was calculated using the Friedewald formula(Reference Friedewald, Levy and Fredrickson25).
Metabolomic analysis
For characterisation of the plasma metabolome, twenty infants from each treatment group were randomly selected.
Sample preparation for GC-time-of-flight/MS analysis
Frozen plasma samples were allowed to thaw at 37°C for 15 min, and immediately thereafter 900 μl of extraction solution (methanol–water in the ratio 8:1 containing eleven internal standards (each 7 ng/μl)) was added to a 100 μl aliquot of plasma followed by vortexing for approximately 10 s. After vortexing, the samples were vigorously shaken at 30 Hz for 1 min in a MM301 Vibration Mill (Retsch GmbH & Company KG), then placed on ice for 120 min and subsequently centrifuged at 19 600 g for 10 min at 4°C. A 100 μl aliquot of the supernatant was transferred to a GC vial and evaporated to dryness. Methoxymation using 15 μl of methoxyamine solution in pyridine (15 μg/μl) was carried out at room temperature for 16 h. Finally, the sample was trimethylsilylated with 15 μl of N-methyl-N-trimethylsilyl-trifluoroacetamide at room temperature for 1 h, after which 15 μl of heptane (containing 0·5 μg of methyl stearate as injection standard) was added.
GC-time-of-flight/MS analysis
Using a CTC Combi Pal autosampler (CTC Analytics AG), 1 μl aliquot of derivatised sample was injected (splitless mode) into an Agilent 6980 GC equipped with a 10 m × 0·18 mm inner diameter fused-silica capillary column chemically bonded with 0·18 μm DB5-MS stationary phase (J&W Scientific). The injector temperature was set at 270°C, and helium was used as the carrier gas at a constant flow rate of 1 ml/min. In each analysis, the purge time was set to 60 s at a purge flow rate of 20 ml/min and equilibration time of 1 min. The column temperature was initially kept at 70°C for 2 min and then increased by 30°C/min to 320°C, and held at that temperature for 2 min. The column effluent was introduced into the ion source of a Pegasus III TOF/MS instrument (Leco Corporation). The temperature was set at 250°C for the transfer line and at 200°C for the ion source. Ions were generated by a 70 eV electron beam at a current of 2·0 mA. Masses were acquired from m/z 50 to 800 at a rate of 30 spectra/s, and the acceleration voltage was turned on after a solvent delay of 165 s. Files of acquired samples were exported to MATLAB 7.11.0.584 (R2010b) (Mathworks) in NetCDF (Network Common Data Form) format for further data processing and analysis.
Hierarchical multivariate curve resolution
All data pre-treatment procedures, including baseline correction, chromatogram alignment, setting of time windows and hierarchical multivariate curve resolution (HMCR), were performed in MATLAB (Mathworks) using in-house scripts. All samples (including repeated extractions) were subjected to HMCR. Alignment and smoothing using a moving average were carried out before HMCR was used to resolve pure chromatographic and spectral profiles. Before multivariate modelling, all peak areas were normalised to peak areas of eleven internal standards eluting over the entire chromatographic time range. Resolved mass spectral profiles were subjected to spectral database search by means of NIST library 2.0 (as of 31 January 2001), using the in-house mass spectra library database established by Umeå Plant Science Center or the mass spectra library maintained by the Max Planck Institute in Golm (http://csbdb.mpimp-golm.mpg.de/csbdb/gmd/msri/gmd_contributions.html). Match values ranking the spectra were calculated using the dot product of the two spectra (i.e. the resolved spectrum and the database spectrum), with higher m/z peaks having more weight than lower m/z peaks, as higher m/z values are considered to be more compound specific. The match values range from 0 to 999, where 999 indicates an identical match. Positive identification was performed by combining match values with retention time index, calculated from the analytically characterised alkane series (C10–C40). Further, all metabolites were classified as amino acids, amines, alcohol/polyol, carbohydrates, fatty acids, carboxylic acids, hydroxyl acids, sterols, non-classified or unidentified. Assignments into different compound classes were based on the criteria from the human metabolome database(Reference Wishart, Tzur and Knox26).
Statistical analysis
For analysis of demographic characteristics, χ2 tests for categorical data and Student's t test for numerical data were used. Student's t test was used to compare the two treatment groups. ANCOVA was used to assess serum lipid and apo levels with breastfeeding duration until commencement of the intervention and sex as covariates. Anthropometric data were analysed by longitudinal repeated measures of variance, adjusted for measurements at 4 months (entry) as a covariate. Only infants with measures from all six measurements were included. These statistical analyses were performed with SPSS software (version 18.0; SPSS, Inc.). Differences were considered significant at the level of P< 0·05. The HMCR-processed GC-time-of-flight/MS data were mean-centred and scaled to unit variance prior to any multivariate data analysis. Principal component analysis was utilised for data overview and to detect clusters or outliers. Orthogonal partial least squares discriminant analysis (OPLS-DA) was performed to model the systematic variation in the metabolomics data related and orthogonal to pre-defined sample classes among the plasma samples here, considering, placebo v. LF19 treatment and 5·5 v. 13 months of age. Cross-validation was used to determine the predictive ability of the models, and ANOVA based on the cross-validated OPLS-DA score vectors (CV-ANOVA) was employed to calculate P values for the differences between the pre-defined sample classes in the respective models. In the case of modelling the differences between samples collected at 5·5 v. 13 months of age, including both treatment groups, a test set of eight samples (four from each group) was selected to test the predictive ability of the model. The OPLS-DA model loadings, combined with univariate P values (Mann–Whitney), were used to highlight significant metabolites associated with detected class differences. All multivariate analyses were carried out using the SIMCA-P+ software (version 12.0.1, Umetrics AB) and Mann–Whitney test was performed using R software (version 2.11.1, R Foundation for Statistical Computing).
Results
Study population
There was no difference between the two groups in distribution of boys and girls; 39 and 45 % boys were included in the LF19 and placebo groups, respectively (P>0·05). Mean gestational age was 40·3 (sd 1·1) and 39·9 (sd 1·3) weeks in the LF19 and placebo groups, respectively (P>0·05). Mean exclusive breastfeeding duration was 3·8 (sd 1·2) months in both groups and mean total breastfeeding duration was 8·2 (sd 3·0) and 7·9 (sd 3·3) months in the LF19 and placebo groups, respectively (P>0·05). There were no differences between the two groups in these variables when the statistical analysis was restricted to the subgroup of infants included in plasma metabolome analysis (data not shown).
Infant anthropometrics
There was no difference in length, weight or skinfold thickness between the two groups at any age (Table 2).
Anthropometrics and measurements of skinfold thickness (Unadjusted means and standard deviations)
Serum lipids
There were no differences in TAG, TC, HDL-cholesterol, LDL-cholesterol, apoA1 and apoB concentrations or apoA1:apoB ratio between the two groups at 5·5 months of age (P>0·05) (Table 3). Adjusting for breastfeeding duration and sex did not affect the outcome (data not shown). At 13 months of age, there was a trend towards lower TC, LDL and apoA1 levels in the probiotic group, but these differences did not reach statistical significance (Table 3). Adjusting for breastfeeding duration and sex did not significantly affect the outcome (data not shown).
Serum lipid and apolipoprotein levels in infants at 5·5 and 13 months of age (Mean values and standard deviations)

TC, total cholesterol; HDL-C, HDL-cholesterol; LDL-C, LDL-cholesterol.
* Data missing from one individual.
Plasma metabolome
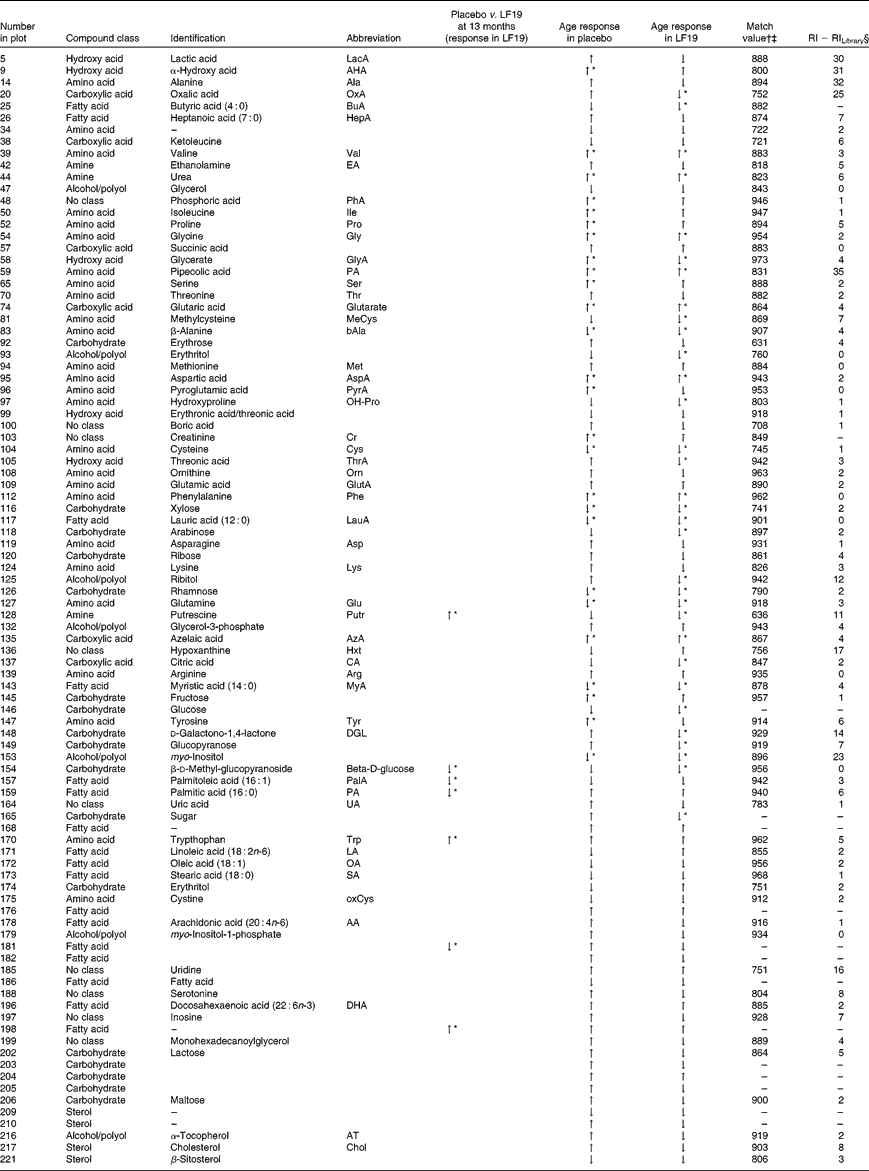
In total, plasma samples from thirty-seven infants (nineteen from the LF19 and eighteen from the placebo group) from two different time points, 5·5 and 13 months of age, were metabolically characterised using GC/time-of-flight-MS. From these, three samples were excluded due to low analytical quality. The collected GC/time-of-flight-MS data from the remaining seventy-one samples were subjected to HMCR for data processing. This resulted in 304 potential compound peaks. After excluding peaks originating from internal standards, contaminations and low quality spectra, 228 putative metabolites remained from which ninety-nine were successfully identified or classified (Table 4). The rest of the compounds were not identified with enough certainty, using mass spectral library search, but still retained information regarding retention time index and fragmentation patterns.
Identified and classified metabolites
LF19, Lactobacillus paracasei ssp. paracasei F19; RI, retention index; ↑ , increase; ↓ , decrease.
* Significant change (P< 0·05) comparing sample taken at 5·5 months of age with those taken at 13 months of age.
† Mass spectra match values according to NIST MS-Search 2·0.
‡ Mass spectra searches were done with in-house libraries and the Max Planck Institute library in Golm (http://csbdb.mpimp-golm.mpg.de/csbdb/gmd/gmd.html).
§ RI calculated from analytically characterised alkane series (C10-C40). RI Library from mass spectra library database.
Effects of Lactobacillus paracasei ssp. paracasei F19
No significant difference was found in plasma metabolite profile between 5·5-month-old infants in relation to LF19 treatment. Furthermore, we could not obtain a significant multivariate model for the difference in plasma metabolite profiles between 13-month-old infants in relation to LF19 treatment, i.e. comparing infants fed LF19 with placebo-fed infants. However, there were still unique metabolites revealing significant differences between the two groups.
Compared with the placebo, the LF19 group had significantly lower levels (P< 0·04) of the SFA, palmitic acid (16 : 0) and the MUFA palmitoleic acid (16 : 1). Additionally, we observed significantly higher levels (P< 0·01) of tryptophan, a branched-chain amino acid, and putrescine, a growth factor polyamine important for cell division, in the LF19 compared with the placebo group at 13 months of age. There were also significantly higher levels (P= 0·02) of d-methyl-glucopyranoside (β-d-glucose) in the LF19 compared with the placebo group.
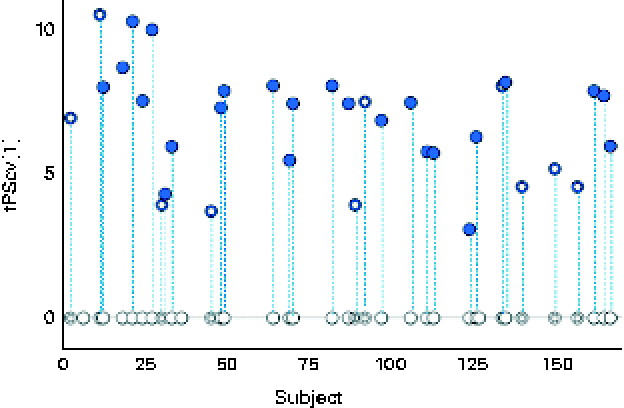
A robust and significant metabolite pattern (P< 0·001) was obtained for the difference in plasma profiles between infants at 5·5 and 13 months of age in both treatment groups. The OPLS-DA model, including samples from both treatment groups, revealed a classification accuracy of 96 % based on the model fit and 95 % based on independent sample predictions (Fig. 1).
Cross-validated orthogonal partial least squares discriminant analysis scores (tPScv[1]) revealing a clear difference in samples related to age. ![]() , Model samples;
, Model samples; ![]() independent samples predicted into the model.
independent samples predicted into the model.
To further investigate the influence of LF19 treatment on metabolic response during the second half of infancy, separate OPLS-DA models were calculated for each treatment group in relation to age. Both groups revealed a significant separation (P< 0·001) of plasma profiles comparing samples collected at 5·5 months with those collected at 13 months of age (Fig. 2). Since no independent sample prediction could be made due to a too low number of samples, the validation of class separations was made using cross-validation.
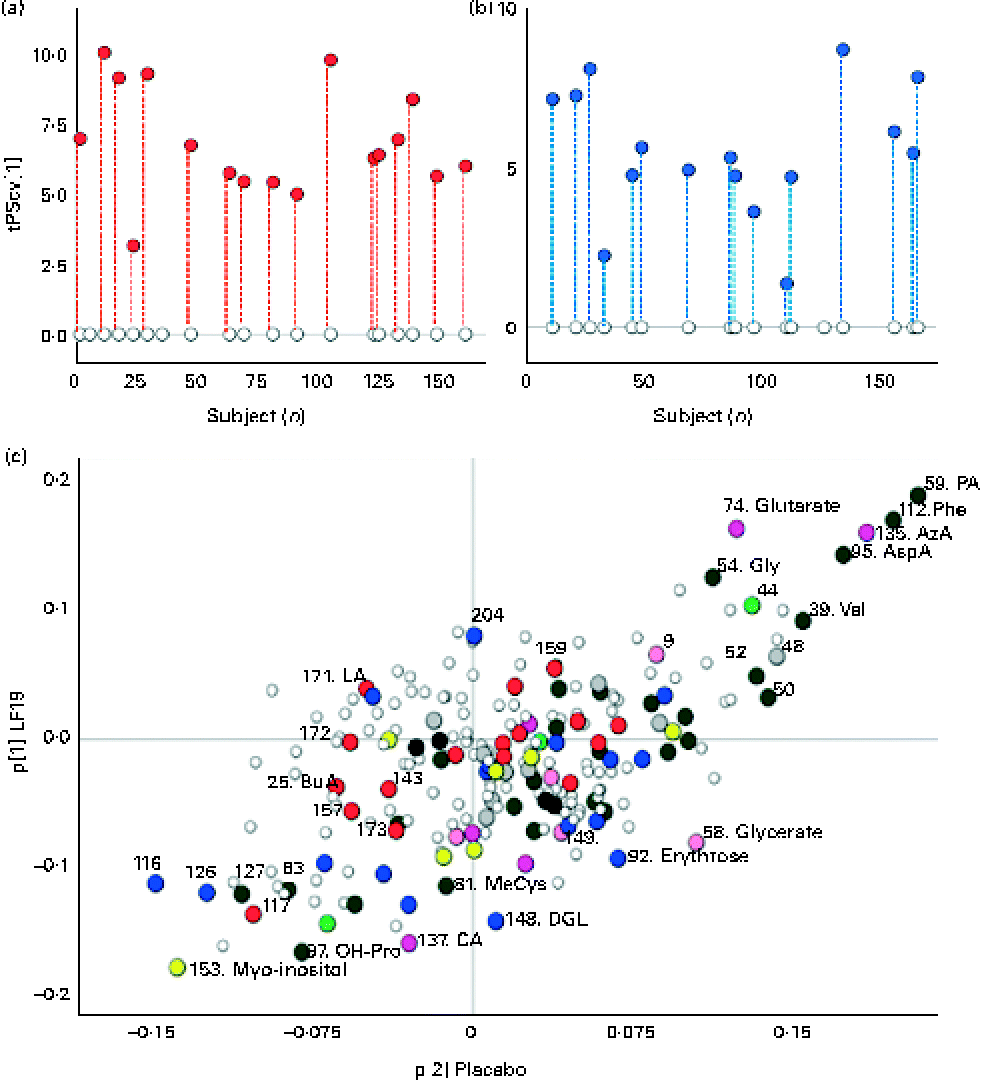
Separate orthogonal partial least squares discriminant analysis (OPLS-DA) models for the Lactobacillus paracasei ssp. paracasei F19 (LF19) and placebo groups, comparing samples at 5·5 and 13 months of age. (a) Cross-validated scores describing a clear response with age for all samples in the LF19-treated infants. ○, Samples collected at 5·5 months of age; ![]() , samples collected at 13 months; each subject's corresponding samples are connected with
, samples collected at 13 months; each subject's corresponding samples are connected with ![]() . (b) Cross-validated scores describing a clear separation of samples related to age in the placebo group. ○, Samples collected at 5·5 months of age;
. (b) Cross-validated scores describing a clear separation of samples related to age in the placebo group. ○, Samples collected at 5·5 months of age; ![]() , samples collected at 13 months; each subject's corresponding samples are connected with
, samples collected at 13 months; each subject's corresponding samples are connected with ![]() . (c) Loadings (p[1]) from the two OPLS-DA models, LF19 or placebo, discriminating between samples taken at 5·5 and 13 months of age plotted against each other in a shared and unique structure plot. Joint and opposite metabolite changes for both groups are displayed along the diagonals, while group-specific changes are seen along the x- (placebo) and y-axis (LF19).
. (c) Loadings (p[1]) from the two OPLS-DA models, LF19 or placebo, discriminating between samples taken at 5·5 and 13 months of age plotted against each other in a shared and unique structure plot. Joint and opposite metabolite changes for both groups are displayed along the diagonals, while group-specific changes are seen along the x- (placebo) and y-axis (LF19). ![]() , Identified metabolite;
, Identified metabolite; ![]() , sterol;
, sterol; ![]() , amino acid;
, amino acid; ![]() , amine;
, amine; ![]() , alcohol/polyol;
, alcohol/polyol; ![]() , carbohydrate;
, carbohydrate; ![]() , fatty acid;
, fatty acid; ![]() , carboxylic acid;
, carboxylic acid; ![]() , hydroxyl acid and ○, unidentified metabolite. PA, pipecolic acid; Phe, phenylalanine; AzA, azelaic acid; AspA, aspartic acid; Gly, glycine; Val, valine; MeCys, methylcysteine; DGL, d-galaculono-1,4-lactone; OH-Pro, hydroxyproline.
, hydroxyl acid and ○, unidentified metabolite. PA, pipecolic acid; Phe, phenylalanine; AzA, azelaic acid; AspA, aspartic acid; Gly, glycine; Val, valine; MeCys, methylcysteine; DGL, d-galaculono-1,4-lactone; OH-Pro, hydroxyproline.
In both treatment groups, we observed a general change in amino acid profile during the second half of infancy. More specifically, there was a significant increase (P< 0·05) of pipecolic acid (PA), phenylalanine, aspartic acid, valine and glycine, while cysteine, glutamine and β-alanine decreased with age. Additionally, we detected a significant decrease (P< 0·001) in myo-inositol levels as well as in the SFA, lauric acid (12 : 0) and myristic acid (14 : 0) (P< 0·04), with age (Fig. 2(c)).
By plotting the OPLS-DA correlation loadings for each treatment group against each other in a so-called shared and unique structure plot(Reference Wiklund, Johansson and Sjöström27), we could interpret the joint and opposite responses between the treatment groups (along the diagonals) as well as the unique response for each treatment group (along the axes) in relation to age (Fig. 2(c)).
Unique age-related metabolite changes in the LF19 group were seen, as a significant decrease in the levels of the SCFA butyric acid (4 : 0) (P= 0·02) and of methylcysteine (P= 0·01), in combination with a trend of decreased cholesterol, was detected in the model loadings. No such change was detected in the placebo group.
Another trend indicating differences between LF19 and placebo was an increase in the n-6 PUFA linoleic acid (18 : 2n-6) in the LF19 group, whereas a reversed pattern was observed in the placebo group. In addition, we detected a decrease with age in metabolites linked to the pentose phosphate pathway in the LF19 group. This decrease was seen in erythrose, glycerate, d-galaculono-1,4-lactone and glucopyranose (β-d-glucose). Again, a reverse response was seen in the placebo group (Fig. 2(c)).
We could also detect individual differences in metabolic response from 5·5 to 13 months of age in both treatment groups. By subtracting the model score value for the 5·5-month sample from the corresponding 13-month sample, it became evident in the score plots (Fig. 2(a) and (b)) that individual development varied among subjects irrespective of LF19 treatment.
Discussion
The aim of the present study was to elucidate whether feeding the probiotic LF19 during weaning would affect the lipid profile and global metabolome. The main findings of this study were significantly lower levels of the fatty acids palmitic (16 : 0) and palmitoleic acid (16 : 1) and significantly higher levels of tryptophan and putrescine in the LF19 compared with the placebo group at 13 months of age, while no significant effect by LF19 on the serum lipid profile was observed. Further, robust age-related metabolic patterns were observed in both treatment groups, with an increase in PA, phenylalanine, aspartic acid, valine and glycine, and a significant decrease in cysteine, glutamine and β-alanine during the second half of infancy.
Palmitoleic acid (16 : 1), one of the MUFA and an important product of endogenous lipogenesis, decreased in the LF19 group. In adults, plasma palmitoleic acid levels correlate strongly with weight, BMI, visceral adiposity, skinfold thickness(Reference Kunesova, Hainer and Tvrzicka28), hypertriacylglycerolaemia(Reference Paillard, Catheline and Le Duff29) and have a significant relation to visceral adiposity in children(Reference Okada, Furuhashi and Kuromori30). The mechanisms linking MUFA content and visceral obesity need further clarification, but serum palmitoleic acid (16 : 1) levels reflect the hepatic lipid pool. It is proposed that elevated palmitoleic levels represent a shift of carbon from carbohydrates to fatty acids that may be linked to visceral obesity(Reference Lands31). Previously, LF19 decreased fat storage in the abdominal and visceral regions in mice(Reference Aronsson, Huang and Parini18). We observed no differences between the treatment groups in anthropometrics. Possibly, differences might have been detectable by the use of more sensitive measurements of visceral adiposity(Reference Sen, Bose and Shaikh32). Alternatively, the observed effects in the murine model are not applicable to the more complex human setting.
Following 9 months of probiotic intake, there was a trend towards lower cholesterol levels compared with the placebo, but the difference was not statistically significant. A recent meta-analysis indicated that probiotics decrease TC and LDL levels in adults with both high and normal cholesterol levels(Reference Guo, Liu and Zhang33). The hypocholesterolaemic effects of probiotics have been attributed to deconjugation of bile acids, binding of cholesterol to cellular surfaces and production of SCFA(Reference Ooi and Liong16). As butyric acid was lower in the LF19 group, this cannot explain the trend towards lower cholesterol levels. The faecal pattern of SCFA reflects the functional status of the gut microbiota. Acetic, propionic and butyric acids are important for gut epithelial cell proliferation and differentiation(Reference Norin, Midtvedt, Ouwehand and Vaughan34). In early infancy, production of acetic acid is predominant, followed by propionic and butyric acid. With age, acetic acid decreases while the other SCFA increase, reflecting the development of a more complex anaerobic microbiota(Reference Edwards and Parrett35). All SCFA were not detected in plasma, but effects of LF19 on the faecal pattern of SCFA in the present study population will be reported elsewhere (CE West, E Norin, ML Hammarström, O Hernell, unpublished results). To the best of our knowledge, the present study is the first on probiotic effects on lipid profiles in infants. For comparison, there was no effect of galacto-oligosaccharides and long-chain fructo-oligosaccharides in infant formula on serum TC or TAG levels, compared with the control formula(Reference Alliet, Scholtens and Raes36). As lipids are fundamental for infant growth and development(Reference Uauy and Dangour37), a major decrease in blood lipids could have been harmful. It is to be noted that including LF19 in the weaning diet posed no safety issues. In relation to long-term lipid-lowering effects of breastfeeding, adult TC and LDL concentrations are marginally lower(Reference Owen, Whincup and Kaye5). No study has thus far been able to convincingly explain the mechanisms behind this. One plausible factor may be via long-lasting effects on gut microbiota establishment and composition in breastfed infants.
We found significantly higher levels of putrescine in the LF19 compared with the placebo group. Putrescine is a polyamine involved in cell growth and differentiation(Reference McCormack and Johnson38, Reference Pegg39). Dietary and gut bacteria-derived polyamines contribute to the total polyamine body pool(Reference Löser40). Polyamines are present in breast milk and have been proposed to be important in neonatal gut maturation(Reference Larqué, Sabater-Molina and Zamora41). Some probiotic strains increase gut integrity(Reference Rosenfeldt, Benfeldt and Valerius42) and the present findings suggest that one possible mechanism might be through increased polyamine levels.
The model loadings revealed a decreased pattern of metabolites linked to the pentose phosphate pathway in the LF19 group, with the opposite trend in the placebo group. The pentose phosphate pathway has mainly two metabolic functions: to meet the need of NADPH for reductive biosynthesis, such as fatty acids, cholesterol, neurotransmitters and nucleotides and in formation of ribose, a component of essential biomolecules such as ATP, DNA and RNA(Reference Berg, Tymoczko, Stryer and Moran43). The decreased pattern could be a result of lower demand for reductive agents and/or nucleotides. In fact, some lactobacilli possess antioxidative qualities and are able to decrease accumulation of reactive oxygen species(Reference Kullisaar, Zilmer and Mikelsaar44, Reference van de Guchte, Penaud and Grimaldi45). In combination with the increase in putrescine, which also protects cells from oxidative stress(Reference Chattopadhyay, Tabor and Tabor46), this might imply antioxidative qualities of LF19, but needs further validation.
We observed age-related changes, with a significant increase in PA from 5·5 to 13 months of age. PA is most likely a metabolite of lysine catabolism. It has an important depressive role in the central nervous system(Reference Fujita, Fujita and Kodama47) and acts as a precursor of microbial secondary metabolites(Reference He48). It is suggested to be a derivate from intestinal bacteria rather than from diet(Reference Fujita, Fujita and Kodama47), and we speculate that the increase in PA reflects increasing gut microbial diversity during weaning(Reference Eckburg, Bik and Bernstein49). Several amino acids increased during the second half of infancy, possibly reflecting a higher dietary protein intake, as complementary foods were successively introduced(Reference Lind, Hernell and Lönnerdal50). Studies on plasma amino acid patterns during weaning are sparse, but data suggest an increase with age(Reference Hammarqvist, Angsten and Meurling51, Reference Lepage, McDonald and Dallaire52).
The combined metabolomics and chemometric bioinformatics approach allowed us to model and interpret the complex metabolic interactions with and without the influence of LF19, and with increasing age. The benefit of the methodology was clearly highlighted when studying age-related changes in treatment groups, where we could extract differentiating metabolite patterns by making comparisons of calculated model loadings (variable weights). Differences in individual metabolites were not detected when comparing treatment groups in a separate model, but were detected using univariate statistics. This highlights the importance of using multivariate and univariate statistics in concert not to miss relevant metabolic changes. In addition, the multivariate models helped to reveal individual (low-to-intermediate or high) metabolic responses, irrespective of LF19 treatment. This underlines that effects of probiotics vary. The presented approach could be valuable in dose–response studies, and ultimately in tailoring effective treatment and prevention strategies with probiotics.
A limitation of the present study is that we only recorded daily intake of weaning cereals and breastfeeding, while other food intakes were not registered. However, as the two compared groups were randomly chosen and showed no differences in growth, we assume that the influence of possible differences in dietary intakes were not substantial at the group level.
In summary, we show that feeding LF19 during weaning affects the metabolic profile. We observed a significant decrease of palmitic (c16 : 0) and palmitoleic acid (c16 : 1) and an increase in the polyamine putrescine in the LF19 compared with the placebo group. Whether the observed decrease of palmitoleic acid (c16 : 1), a major MUFA which was previously shown to be strongly linked to visceral obesity, and the increase of putrescine, a polyamine with importance for gut integrity, will be associated with long-term health consequences are being followed.
Acknowledgements
We acknowledge the participating families; Margareta Henriksson, RuthGerd Larsson and Margareta Bäckman for invaluable contact with parents, and their infants and excellent assistance with the administration of trial products and blood samplings; and associate professor Hans Stenlund for invaluable advice on statistical procedures. C. E. W. has received funding and speaker honorarium from Arla Foods. O. H. has received funding from Semper AB and Arla Foods. The other authors declare no conflict of interest. The present study was supported by Semper AB, Sweden, Swedish Research Council for Environment, Agricultural Sciences and Spatial Planning (FORMAS); Swedish Agency for Innovation Systems (VINNOVA); Västerbotten county council (ALF); Ronald McDonald Fund; Swedish Nutrition Foundation and Oskar-fonden; and European Union's Seventh Framework Programme under grant agreement no. 222720. C. E. W. is sponsored by a fellowship from the Swedish Society of Medical Research. Semper AB personnel were involved in discussions regarding study design. Sponsors had no involvement in the collection, analysis and interpretation of data, in writing the report or in the decision to submit the paper for publication. E. C. and H. A. performed all metabolomics and multivaraiate analysis. F. K. V. and C. E. W. performed some statistical analysis. E. C., F. K. V., H. A. and C. E. W. wrote the manuscript. O. H. contributed to the discussions. C. E. W. and O. H. were responsible for the design of the project.