

Introduction
Since the pioneering work of Reference MeierMeier (1984), the contribution of mountain glaciers to sea-level rise has been a key issue for understanding the effects of global warming. of particular importance is the mass balance of the huge temperate glaciers in Alaska and Patagonia (Reference Houghton, Filho, Callander, Harris, Kattenberg and MaskellHoughtonandothers,1996) because the sensitivity of equilibrium-line altitude to temperature change is more pronounced at high precipitation rates (Reference Oerlemans and FortuinOerlemans and Fortuin, 1992). the glaciers in Patagonia are maritime; furthermore, Campo de Hielo Patagόnico Norte (HPN; northern Patagonia icefield) at 4200 km2 and Campo de Hielo Patagόnico Sur (HPS; southern Patagonia icefield) at 13 000 km2 together constitute the world’s largest ice mass outside the polar regions (Reference Warren and SugdenWarren and Sugden, 1993; Reference Aniya, Sato, Naruse, Skvarca and CasassaAniya and others, 1996). Accordingly, changes in their mass balances are closely related to world sea level.
Mass-balance estimates have been made using ice cores recovered from the icefields. Three ice-core drillings have been performed so far; these yielded estimated net accumulation rates of 3.45 ma–1 at the Glaciar San Rafael drilling site (HPN, 46˚44’ S, 73˚32’W; 1296ma.s.l.) (Reference YamadaYamada, 1987), 1.2 ma–1 at Glaciar Perito Moreno (HPS, 50˚38’ S, 73˚15’W; 2680ma.s.l.) (Reference Aristarain and DelmasAristarain and Delmas, 1993) and 2.2 ma–1 at Glaciar Nef (HPN, 45˚56’ S, 73˚19’W; 1500ma.s.l.) (Reference Matsuoka and NaruseMatsuoka and Naruse, 1999). Reference Aristarain and DelmasAristarain and Delmas (1993) suggested that the 1.2 ma–1 value might have been influenced by wind scouring and surface melting. Surface melting could be more critical for ice cores at lower altitudes. It is therefore necessary to obtain ice cores from a site where there is minimal influence on mass balance from meltwater discharge and wind scouring.
This paper presents a new estimate of net accumulation rates at HPS, based on analyses of δ18O and δD as well as major ions and algal biomass along a 45.97 m long ice core. the high values calculated are considered to be typical of this glacier in the light of synoptic-scale climate analyses of the region. Glaciar Tyndall can therefore be classed as one of the most extreme maritime glaciers in the world.
Geographical Setting
The drilling site is located at 500 meast of a divide between Glaciar Tyndall to the east and Glaciar Amaria to the west in the southernmost part of HPS (50˚59’05’’ S, 73˚31’12’’W; 1756 ma.s.l.). A map of the region is shown in Figure 1. Glaciar Tyndall flows southwards for 32 km, covering a total area of about 331 km2, and eventually calves into a proglacial lake (Reference Aniya, Sato, Naruse, Skvarca and CasassaAniya and others, 1996).
Location of the drilling site. Previous drilling sites and the location of Punta Arenas are also shown.

The glacier surface at the drilling site is inclined by 1˚ to the east. There are nunataks approximately 2 km south of the drilling site (Fig. 2), but the underlying surface is otherwise flat for at least 2 km in the other directions. Preliminary radio-echo soundings suggest that the glacier might be >600m thick (personal communication from A. Rivera and G. Casassa. 1999), although its exact thickness at the drilling site is unknown.
Landscape near the drilling site on Glaciar Tyndall.

According to our meteorological observations during the 24 day drilling campaign, weather conditions in this region are extreme: we recorded an average hourly wind speed of 13.6ms–1 and a snow accumulation of approximately 3.5m (about 1.75mw.e.) from 30 November to 23 December 1999. Visibility exceeded 50 m on only 4 days out of 24. Air temperature varied from 3.3˚ to –8.2˚C, with an average of –3.5˚C during the campaign.
Ice-Core Drilling and Analysis
Because of the harsh environment, we drilled the ice core from a snow cave located below the glacier surface. the tents (see Fig. 2) were finally abandoneddue to difficulties in maintaining them in the heavy snowfall. Details of the campaign are given in Reference Godoi, Shiraiwa, Kohshima, Kubota, Sepulveda, Casassa and SinclairGodoi and others (in press). Because the air temperature inside the snow cave was nearly 0˚C, the recovered ice cores had to be processed immediately. First, the core stratigraphy was observed with the aid of a fluorescent light; here special attention was paid to a distinction between firn and melt layers. Thenthe bulk density of the core was determined. for analysis, the core was sliced into 25 cm sections, each of which was vertically cut into three pieces (one half and two quarters). the half-section was packed in a sealed plastic bag and left untouched. External parts of the two other pieces were removed using a pre-cleaned ceramic knife, and the samples were packed in separate, sealed plastic bags. Unfortunately, weather conditions enforced an emergency evacuation with limited samples; hence, only one set of samples (i.e. one-quarter of the core) could be saved for laboratory analyses. These samples were kept frozen until their arrival at the Institute of Low Temperature Science in Japan, where they were analyzed.
Measurement of the borehole temperature after drilling was planned, but was prevented by meltwater inflow into the borehole from the top while the last sections were being drilled. the borehole was dry down to 42.55 m depth, where the firn became soaked with meltwater. the glacier is thus classified as temperate. Further details of the drilling procedure are given in Reference Kohshima, Shiraiwa, Godoi, Kubota, Takeuchi and ShinboriKohshima and others (2002).
The 25 cm long samples were melted, heated to +3˚C, and immediately analyzed for major ions, water isotopes and algal biomass. Major ions were analyzed with an ion chromatography system (Dionex model 500x with AS-12A and CS12-A separate columns and 500 μL sample loops) at the clean laboratory of the Institute of Low Temperature Science. Blank values were measured and the detection limit for the major ions was found to be 10 ppb or less. Stable oxygen and hydrogen isotopes were measured by a mass spectrometer (Finnigan model MAT delta 252) at the Department of Environmental Science and Technology, Tokyo Institute of Technology. the measurement errors for δ18O and δD are ±0.05‰ and ±1‰, respectively. from the errors measured in this analysis, we can determine D-excess to an accuracy of ±1.4‰.
Algal biomass in each sample was observed and measured at the Faculty of Bioscience and Biotechnology, Tokyo Institute of Technology, and they are expressed as total algal volume (μm3 mL–1). Several algal species were found in the ice-core samples, but Chloromonas sp. of unicellular green algae was the most abundant. the volume was determined by quantifying the number of cells and their volume with the aid of a microscope. Further details of the method are given inReference Yoshimura, Kohshima, Takeuchi, Seko and FujitaYoshimura and others (2000).
Physical Properties of The Ice Core
The core consisted of layers of firn and melt features that varied in thickness between 1 and 50 mm down to 42.55 m depth, below which water-soaked firn–ice layers continued to 45.97m depth. Neither dirt layers nor ash layers were found throughout the profile. Snow grains were mostly coarse granules.
The bulk density ρ gradually increases with depth d and attains the firn/ice transition (~830 kg m–3) at 42.5 m depth (Fig. 3). the best fit by a quadratic equation is ρd = –0.147δ2 + 14.66d + 459.91 (r2 = 0.94). the depth of pore close-off, 42.5 m, is greater than the depths of 20–30m recorded in other temperate glaciers (Reference Kawashima and YamadaKawashima and Yamada, 1997). This may be due to the abnormally high accumulation rate mentioned below.
Profile of the ice-core bulk density (solid dots). Ordinate is the measured core depth d (m). for comparison, profiles of bulk densities from other glaciers on the Patagonia icefields are given: Glaciares San Rafael (Reference YamadaYamada, 1987), Perito Moreno (Reference Aristarain and DelmasAristarain and Delmas, 1993) and Nef(Reference Matsuoka and NaruseMatsuoka and Naruse, 1999). Arrows indicate depths at which water-saturated firn first appeared.
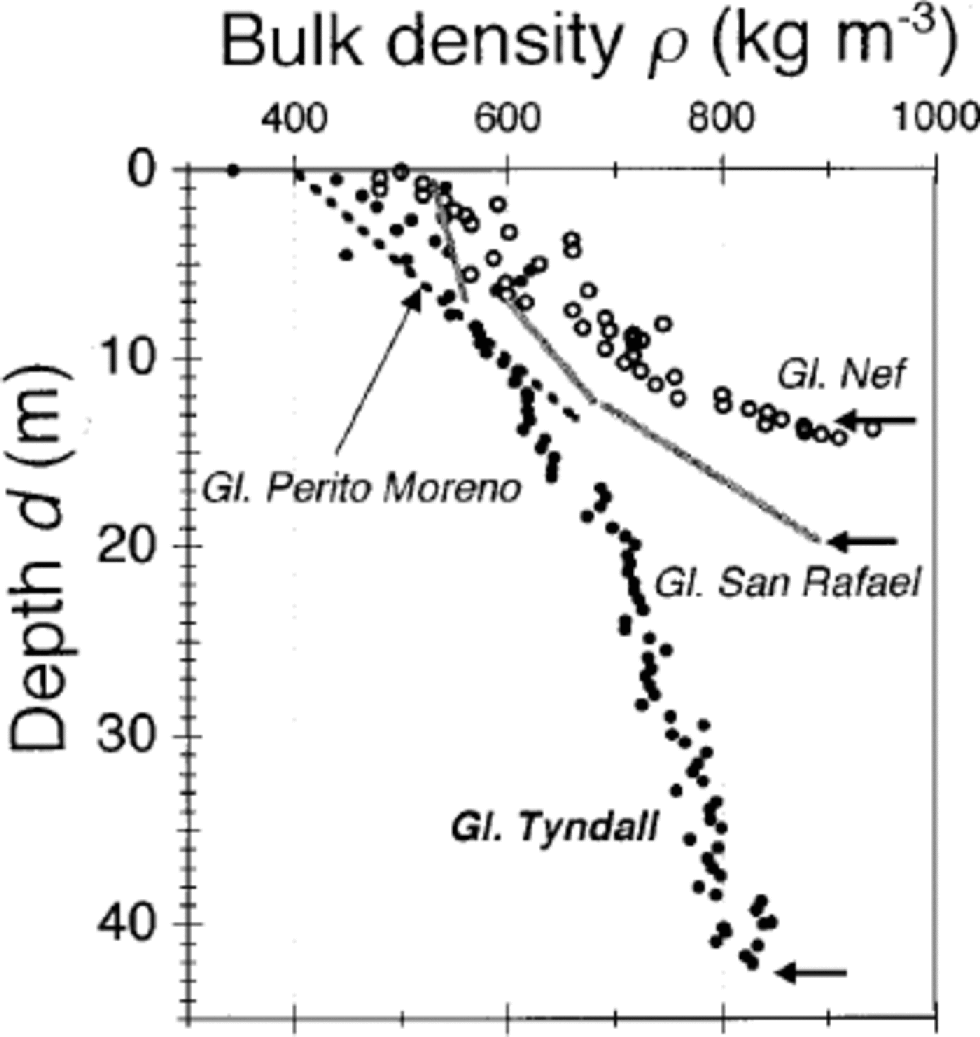
Figure 3 also compares the depth–density curve of Glaciar Tyndall with those from previous measurements on other Patagonian glaciers.The curve of Glaciar Tyndall (1756m) is similar to that from Glaciar Perito Moreno (2680m at HPS; Reference Aristarain and DelmasAristarain and Delmas, 1993), despite the 924m difference in elevation. Altitudes of the drilling sites at Glaciares San Rafael (1296m at HPN; Reference YamadaYamada, 1987) and Nef (1500m at HPN; Reference Matsuoka and NaruseMatsuoka and Naruse, 1999) are much closer to that of Glaciar Tyndall (1756m). At a given depth, however, the firn densities of Glaciares San Rafael and Nef are much higher than those of Glaciares Tyndall and Perito Moreno.
Another important point is the occurrence of water-saturated firn–ice layers at 42.5 m on Glaciar Tyndall, 19.7m on Glaciar San Rafael and 13.3m on Glaciar Nef. This suggests that below these depths any chemical and isotopic signals in the ice cores may have been eliminated by the meltwater, as already found at the two glaciers in HPN.
Water-Isotope, Ion-Chemistry and Biomass Analyses
δ18O, δD and D-excess
Average values and the standard deviations of all 183 samples of δ18O, δD and D-excess (d = δD– 8δ18O; Reference DansgaardDansgaard, 1964) measured from the surface to the bottom of the ice core are –11.9±1.5‰, –84±12‰ and 10±2‰, respectively. In order to check the dependence of water isotopes on altitude, the averaged value of the δ18O is compared with those obtained for Glaciares San Rafael (Reference YamadaYamada, 1987), Perito Moreno (Reference Aristarain and DelmasAristarain and Delmas, 1993) and Nef (Reference Matsuoka and NaruseMatsuoka and Naruse, 1999) and for Punta Arenas (53.00˚S, 70.51˚W; 37 ma.s.l.) (Fig.4). Average values were obtained for Glaciares San Rafael and Nef by averaging all of the δ18O values appearing in each report. Theaveraged δ18O of Glaciar Perito Moreno was calculated and converted from the reported δD values by assuming a meteoric water relationship. the averaged δ18O for Punta Arenas was obtained from the International Atomic Energy Agency/World Meteorological Organization global network of isotopes in precipitation (GNIP) database, Release 3 October 1999 (http://www.iaea.org/programs/ri/gnip/gnipmain.htm) for the period 1996–97.
Relationship between averaged values of δ18O and altitudes in the two Patagonia icefields and the nearest meteorological station. Original data for Glaciar San Rafael are from Reference YamadaYamada (1987); for Glaciar Perito Moreno from Reference Aristarain and DelmasAristarain and Delmas (1993); and for Glaciar Nef from Reference Matsuoka and NaruseMatsuoka and Naruse (1999). Data for Punta Arenas were obtained from the GNIP database (http://www.iaea.org/programs/ri/gnip/gnipmain. htm). Solid dots and bars are the average value and the standard deviation of each dataset used for analyses. See text for further explanation.
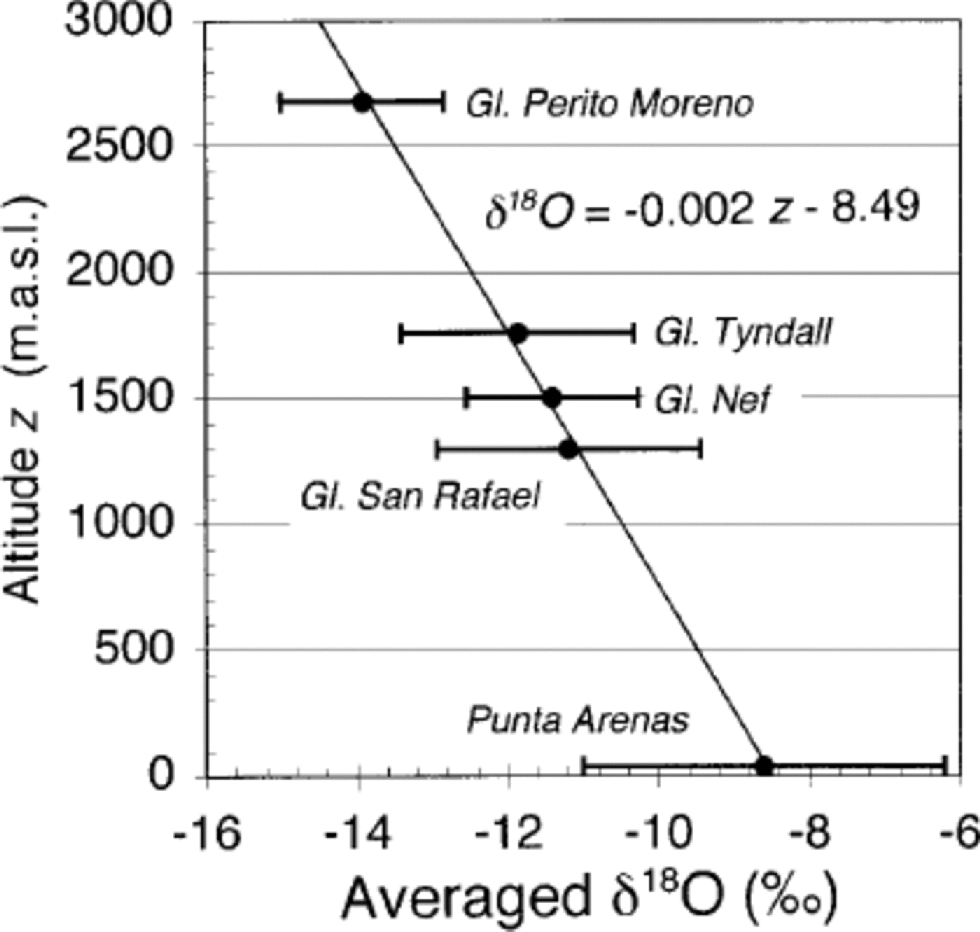
The four average values of δ18O are linearly related to altitude z (m a.s.l.); the best-fit equation is δ18O –= 0.002z – 8.49. the δ18O/altitude effect is –0.2‰ for each 100 m, which is the same as for the Swiss Alps (Reference Schotterer, Fröhlich, Gäggeler, Sandjordj and StichlerSchotterer and others, 1997). Although the data used are variable in both quality and quantity and may lack statistical significance, it seems that the water isotopes over the Patagonianicefields are controlled mainly by altitude.
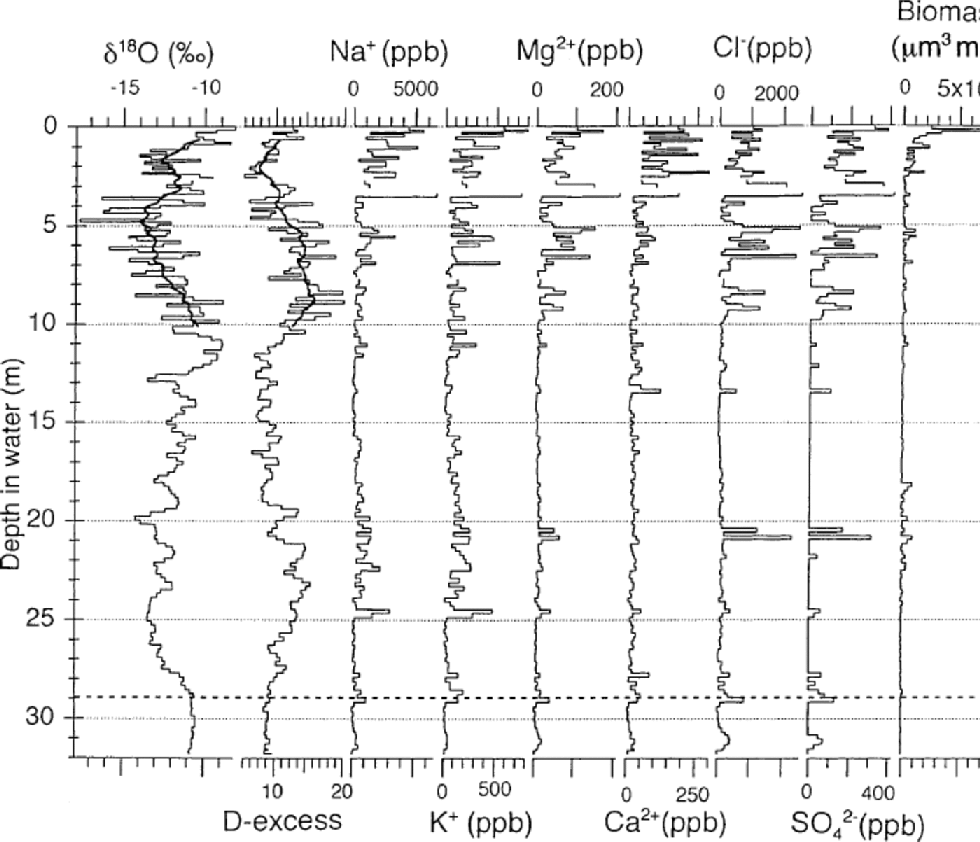
Profiles of δ18O and D-excess in the ice core are given in Figure 5. Hereafter, all depths are given by their water equivalent. the amplitudes of the two signals are relatively large in the upper 10 m, ranging from –8‰ to –17‰ in the case of δ18O, but smaller at greater depths, ranging from –9‰ to –14‰. It is, however, possible to find oscillations whose strongest δ18O peaks are at 11.0 and 28.8m depths if the upper 10m is smoothed by an 11-data running mean (thick line in Fig. 5). D-excess has peaks at 8.6 and 23.3m and shows fluctuations similar to those of δ18O. the difference between the two profiles is that they are slightly shifted in their peaks: D-excess peaks postdate those of δ18O.
Profiles of δ18O (‰), D-excess (‰), major ions (ppb or μg L–1) and algal biomass (μm3 mL–1). Depth is given by the water equivalent value. Thick lines in δ18O and D-excess are 11-data running mean.
To explain why the δ18O peaks predate D-excess peaks in the ice core, we examined seasonal fluctuations in the two signals observed at the nearest meteorological station, Punta Arenas (Fig. 1), where water-isotope data are currently available at the GNIP database mentioned previously. These are plotted in Figure 6 by calculating monthly averages from the dataset during 1990–97. Although the measurement period is not long enough to determine definite statistical relationships, the monthly averages of δ18O and D-excess show slightly shifted seasonal patterns too: the strongest δ18O and D-excess peaks appear in February and April, respectively. This pattern is very similar to what we found in the ice core, where δ18O peaks appeared approximately several meters lower, i.e. earlier, than D-excess peaks. D-excess’s time lag behind δ18O remains unexplained, but it suggests that the fluctuations of both signals found in the ice core would correspond to the annual cycles in water isotopes.
Seasonal changes in δ18O (‰) and D-excess parameter at Punta Arenas (53.00˚ S, 70.51˚W; 37 ma.s.l.). the original data were obtained from the GNIP database, and the monthly average data from 1990 to 1997 were used for this analysis.

Major ions and biomass
Major dissolved ions (Na+, K+, Mg2+, Ca2+, Cl–, SO4 2–) exhibit rapid decreases in the upper 4m (Fig. 5). NO3 – was below the detection limit throughout the profile. Several additional peaks are, however, detectable above the upper level of the water-soaked layer at 28.94 m w.e. These peaks are located at 5–7, 20–21 and 24–25m. the peaks for the dissolved ions correspond to the peaks for the snow algal biomass.
Concentrations of each ion in this ice core are one order of magnitude higher than those reported from Glaciar Perito Moreno (Reference Aristarain and DelmasAristarain and Delmas, 1993) as far as the samples from the surface 4m are concerned. This is not due to contamination during processing of the samples and the analyses: if this were the case, a high concentration of ions would also be found in the lower part, where samples are processed and analyzed in the same way as samples from the upper 4m.
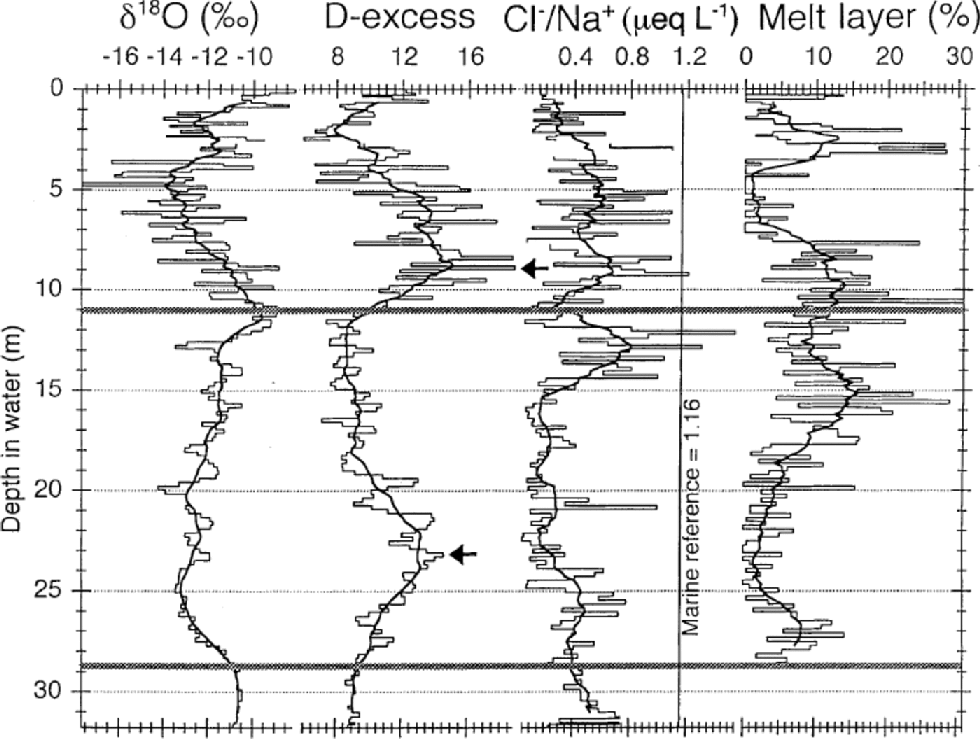
To check whether the major ions are eluted by meltwater, a ratio of Cl– (μeq L–1) and Na+ (μeq L–1) was compared with a typical sea-salt ratio of 1.16 (Reference Wilson, Riley and SkittowWilson, 1975, cited in Reference Keene, Pszenny, Galloway and HawleyKeene and others, 1986) (Fig.7). Original compositions of Cl– and Na+ in precipitation supplied to HPS are known to be close to the marine reference value (Reference Aristarain and DelmasAristarain and Delmas, 1993), and the original ratios can be disturbed by post-depositional elution if ice-core melting is significant (Reference Davies, Vincent and BrimblecombeDavies and others, 1982). the Cl–/Na+ ratio is close to the typical sea-salt ratios of 1.16 at depths of 5–10m and 12–15m where the δ18O is relatively low (Fig.7). At other depths, the ratios are significantly lower than the typical sea-salt ratios. Because the δ18O is supposed to be a seasonal signal having maxima in summer and minima in winter in this ice core, the original sea-water ratio is considered to be maintained in winter depths of the ice core. Therefore, the lower values found for the Cl–/Na+ ratios are probably due to the influence of elution after the deposition of snow.
Profiles of δ18O (‰), D-excess (‰), Cl–/Na+(μeq L–1/μeq L–1) and melt-layer percentage. Thick lines in each profile are 11-data running mean. the two horizontal bands are possible summer (February) horizons; the two arrows in the D-excess profile are possible April horizons.
The profile of algal biomass also shows a rapid decrease in the surface 3m (Fig. 5), and several minor peaks appear at depths where δ18O is relatively low. Reference Yoshimura, Kohshima, Takeuchi, Seko and FujitaYoshimura and others (2000) proposed that high peaks of the algal biomass are markers of summer depths in the Himalayan ice core, but this seems not to be the case for this ice core.
Estimate of Annual Accumulation Rates
Our multi-signal analyses on the ice core suggest that fluctuations of δ18O and D-excess along the ice core are similar to those obtained at the nearest meteorological station, Punta Arenas; thus we may use these signals in the ice core as seasonalmarkers.However, the fluctuations of the signals for the major ions and algal biomass are difficult to interpret since they are considered to have been substantially disturbed by melt water after deposition. Meltwater can also destroy the isotopic signals, as occurred on Glaciares San Rafael and Nef in HPN; nevertheless, the original isotopic profiles can be maintained for at least a few years when the amount of meltwater is not significant (e.g. Reference Krouse, West, Hislop, Brown and SmithKrouse and others, 1977). Therefore, it may be possible to determine net accumulation rates at the drilling site from the δ18O and D-excess in the depth profiles.
The highest peaks in the δ18O profile are located at depths of 11.0 and 28.8m (the two horizontal bands in Fig. 7). the profile suggests that another peak is forming at the surface. Because the δ18O peak appears in February at Punta Arenas, we tentatively assume that δ18O in the ice core also peaks in February. D-excess peaks are located at depths of 8.6 and 23.3m, which could represent April snowfall (arrows in Fig. 7). This seems reasonable since the topmost level of D-excess is still relatively low; thus another peak probably appears much later than our drilling period in December.
Occurrences of melt layers in the ice core support the above-mentioned speculations (Fig. 7). the melt layers are usually formed in summer, when meltwater at the surface percolates to a certain depth of the glacier.* In this ice core, however, one can recognize two horizons where melt layers are almost absent: at 4–7 and 20–25 m. These two depths are also characterized by lower δ18O values, so they would correspond to winter horizons.
As a result, we calculate that the net accumulation rate from the austral summer (February) of 1997/98–1998/99 was 17.8ma–1 w.e., whereas that of 1998/99–1999/2000 is expected to be 11.0ma–1 plus the amount that was supplied until February 2000, as indicated by the two horizontal bands in Figure 7. These values do not include the meltwater discharged from the site, so the calculated values are lower bounds of the actual net balances. However, the amount of meltwater from firn layers is likely insignificant at this altitude since the isotopic profiles would have washed out if the amount were high.
Mass balances of the Patagonian icefields are poorly understood to date. Besides the ice-core data mentioned above, specific mass balances were estimated, for a part of HPS only, by glacial dynamical methods (Reference Skvarca and NaruseSkvarca and Naruse, 1997; Reference Rott, Stuefer, Siegel, Skvarca and EckstallerRott and others, 1998). Annual precipitation over both the HPS and HPN accumulation areas has been estimated either by the hydrological method (Reference Escobar, Vidal, Garín, Naruse, Naruse and AniyaEscobar and others, 1992) or by meteorological observations (Reference Fujiyoshi, Kondo, Inoue and YamadaFujiyoshi and others, 1987). All of the studies estimated a high annual mass input of 5–10 m w.e. on average in the accumulation area. Although our estimates are almost double the above-mentioned estimates, we believe that they are not far from the realistic value if we remember the actual accumulation rate we observed during our drilling operation (3.5m in snow height per 24 days in December 1999).
Finally, we ask whether the calculated high net accumulation rates are normal or abnormal at this location. K.Kubota (unpublished information) analyzed the synoptic-scale weather conditions over Patagonia by using data on geopotential height, wind speed and moisture flux at 850 hPa from 1985 to 1999. He compared the December monthly averages of these parameters from 1999 with those from other years. December 1999 was found to be nearly the average of the 15 year period, so this was not an unusual year. Hence, the extremely high snow accumulation observed for December 1999 is likely typical for this glacier. This means that Glaciar Tyndall must rank as one of the most maritime glaciers in the world.
Conclusions
From our ice coring at GlaciarTyndall onHPSwe found that
-
(1) field campaigns here are very strenuous due to high winds and heavy snowfall;
-
(2) the glacier is temperate even at its highest saddle at 1750ma.s.l.;
-
(3) the seasonal cycles in δ18O, δD and D-excess were more or less preserved for at least 2 years;
-
(4) major ions and algal biomass were substantially eluted by meltwater;
-
(5) the seasonal cycles of δ18O and D-excess together with the melt-layer distribution helped to reconstruct the lower bounds of net accumulation rates for 1997/98–1998/99 (17.8ma–1) and 1998/99–1999/2000 (>11.0ma–1).
Acknowledgements
The authors would like to thank K. Kubota, M. Arevalo, J. Quinteros, N.Takeuchi, R Naruse and M. Aniy. for valuable support during the field campaign. the evacuation operation headed by G. Cassasa and A. River. is highly appreciated. the workshop staff at the Institute of Low Temperature Science provided technical support for developing the drilling system. Comments from B. Stauffer, D. Wagenbach, an anonymous reviewer and K. Matsuok . helped the authors to revise the manuscript. This research was funded by grants-inaid for Basic Research A (No.10041105; principal investigator (PI): M. Aniya) and Basic Research C (No. 11640422; PI: R. Naruse), both from Ministry of Education, Science, Sports and Culture of Japan, and a grant from Fondo Nacional de Ciencias yTecnologia (FONDECYT 1980293) of Chile.


