

1. Introduction
The rapid retreat of mountain cryospheric components around the world during the 20th century (e.g. glaciers and ice caps) has been cited as proxy evidence of global warming of surface air temperatures (Reference Folland and J.T.Folland and others, 2001). During the past 50 years, while the cryosphere in China has retreated (Reference Li, Cheng, Wu and DingLi and others, 2003, Reference Li2008), surface air-temperature data show marked upward trends (Reference Tang and RenTang and Ren, 2005). However, there are few recorded climatic data in extremely cold regions, where cryospheric components are found. This is a barrier to climatological and hydrological investigations in the cryosphere.
The freezing-level height (FLH; the free-air 0˚C isotherm) in the atmosphere is a critical parameter that affects hydrological conditions in high mountains (Reference Harris, Bowman and ShinHarris and others, 2000; Reference HoffmannHoffmann, 2003; Reference Francou, Vuille, Favier and Cá´ceresFrancou and others, 2004; Reference Coudrain, Francou and KundzewiczCoudrain and others, 2005; Reference VuilleVuille and others, 2008). In particular, the mass balance of glaciers is critically dependent on the extent of ice melting and sublimation, and on the balance of snowfall versus rain, which greatly affects albedo and thus net radiation. Reference Diaz and GrahamDiaz and Graham (1996) found that there had been a significant rise in FLHs in the tropics during the period 1958–90, and that this increase was related to sea-surface temperatures (SSTs) in the eastern equatorial Pacific. In the American sector of the tropics, the strongest relationship between FLH and SST occurs when SST precedes FLH by ~3 months (Reference Diaz, Eischeid, Duncan and BradleyDiaz and others, 2003). Other high mountain regions have also exhibited significant warming in the last several decades, with more recent decades displaying the largest FLH changes (Reference Diaz, Eischeid, Duncan and BradleyDiaz and others, 2003).
Turning to free-atmospheric trends and focusing on the tropical belt, Reference Diaz and GrahamDiaz and Graham (1996) examined data from 65 radiosonde stations and found a temporal increase in free-atmospheric FLHs during 1970–86 and, in a ten-station South American network, during 1958–90. These freezing-level changes were corroborated by surface temperature data from tropical stations at elevations above 1000 m. They were also well simulated by an atmospheric general circulation model, driven by observed SSTs. Using a more comprehensive radiosonde station network, Reference Gaffen, Santer, Boyle, Christy, Graham and RossGaffen and others (2000) noted that tropical FLHs abruptly increased in 1976–77 and slightly decreased during 1979–97. During 1979–97, mid-tropospheric temperatures cooled slightly, while surface temperatures increased significantly, in association with an increase in lower-tropospheric lapse rates. Over a longer period, 1960–97, tropical surface and tropospheric temperatures warmed at about the same rate, and freezing levels rose.
To better understand the apparent discrepancies between recent (past 50 years) cryospheric changes and large-scale warming of the lower troposphere in China, we used radiosonde observations to investigate the following questions:
-
1. What were the seasonal, interannual and multi-decadal patterns of atmospheric freezing levels in China?
-
2. How were trends in atmospheric freezing levels related to temperature trends?
-
3. What were the impacts of atmospheric freezing levels on cryosphere?
Here we investigate changes in FLH derived from radiosonde observations in China, and their possible impact on the cryosphere. We compared the climatological features of temperature and freezing levels at 92 radiosonde sites, interannual variability, and trends. We present several examples of FLH impacts on variation in cryospheric components.
2. Data and Methods
2.1. Data preparation
FLH, theoretically, can be deduced from vertical profiles of temperature and geopotential heights in free air. Generally, three data sources can be used for this type of vertical structure analysis in free air: radiosonde, satellite and reanalysis series. However, temperature series from satellite observations can reveal layer-mean values but not individual levels. The reanalysis series is constructed from atmospheric forecasts and data assimilation systems; some authors noted biases from both the US National Centers for Environmental Prediction (NCEP) and European Centre for Medium-Range Weather Forecasts (ECMWF) re-analysis (ERA) models when using it for long-term climatic analysis in China (e.g. Reference Ma, Zhang, Li, Frauenfeld and QinMa and others 2008). Radiosonde data with their vertical resolution, therefore, are more suitable for deducing FLH.
Radiosonde observations, provided by the Chinese National Meteorological Information Center (NMIC)/China Meteorological Administration (CMA), formed the basis for this analysis. Considering the amplitude of FLH variation, we used data for five mandatory pressure levels: ground surface, 850, 700, 500 and 400 hPa, which were observed twice daily at 00 UTC (coordinated universal time) and 12 UTC. The 00 UTC and 12 UTC series were combined into a merged radiosonde time series for the final homogenization procedure; sets of merged series were considered missing if either the 00 UTC or 12 UTC series was missing. Seasonal anomalies were computed with reference to 1971–2000.
The 116 Chinese radiosonde network stations are distributed throughout China (Fig. 1). We examined the data availability for each station and included as many stations as possible. Reference Gaffen, Santer, Boyle, Christy, Graham and RossGaffen and others (2000) demonstrated that the proportion of missing data is a key parameter for determining the reliability of a radiosonde time series. Reference Guo and DingGuo and Ding (2009) found that a 30% proportion of missing data is the critical value to distinguish the usability of a time series from Chinese radiosonde networks. Thus, based on a maximum fraction of missing data of 30%, we selected an optimal network (Fig. 1, open circles). The analysis yielded a nominal radiosonde time-series network of 92 stations for 1958–2005.
Location of radiosonde stations In China.
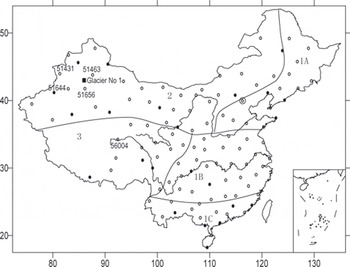
Because of the expansive region and large number of stations, we divided China into five sub-regions according to geographical conditions and atmospheric circulation: regions 1A (northeast China), 1B (east China), 1C (southeast China), 2 (north and west China) and 3 (Tibetan Plateau).
It is well accepted that there is heterogeneity in instrumental climatic records, as well as radiosonde time series; quality control (QC) and homogenization are necessary when using radiosonde data (Reference SolomonSolomon and others, 2007). To detect and correct inconsistencies caused by the vagaries of data collection, many statistical methods (e.g. different instruments and data correction methods) have been developed.We employed a hydrostatic method (Reference CollinsCollins, 2001) for QC, and a two-phase regression method (Reference Easterling and PetersonEasterling and Peterson, 1995) for data homogenization. These methods have proved suitable for Chinese radiosonde networks (Reference GuoGuo and others, 2008; Reference GuoGuo and Ding, 2009).
Equal-Area Scalable Earth Grid (EASE-Grid) weekly snow-cover data were used in this analysis. The Northern Hemisphere 25-km Equal-Area Special Sensor Microwave Imager (SSM/I) Earth (EASE-Grid) Weekly Snow Cover and Sea Ice Extent version 3 database combines extent of snow cover and sea ice at weekly intervals for 23 October 1978 to 5 June 2005 and snow cover alone for 3 October 1966 to 22 October 1978 (R.L. Armstrong and M.J. Brodzik, http://nsidc.org/data/nsidc-0046.html). Each gridcell contains information indicating the absence or presence of snow cover for each week; this information can be obtained from the website of the US National Snow and Ice Data Center (NSIDC; ftp://sidads.colorado.edu/pub/DATASETS/snow_and_sea_ice/nsidc0046v03). Furthermore, glacier mass-balance data and permafrost active layer depths were extracted from reports by Reference Yang, Li, Ye, Jiao and ZhaoYang and others (2005) and Reference Wu and ZhangWu and Zhang (2010), respectively.
2.2. FLH identification
The first five levels of radiosonde time series (corresponding to the ground surface, 850, 700, 500 and 400 hPa) were examined for a transition from a temperature greater than 0˚C to a temperature equal to or less than 0˚C. FLH was estimated for each snapshot by reverse interpolation of the temperature profile at each station to find the geopotential height of the 0˚C isotherm. The algorithm checks for zero crossings in the temperature profile between ground surface and 400 hPa. If a single zero crossing exists, its altitude is taken as the freezing level. Two additional special cases were considered: no zero crossings (T<0˚C throughout the profile) and multiple zero crossings due to temperature inversions. In the case where T<0˚C throughout the column, the freezing level is flagged as missing. In the case of multiple zero crossings, these locations are flagged and only the lowest FLH value is stored. The FLH was then obtained through linear interpolation between the geopotential heights of the transition levels; mean monthly and annual FLH were calculated.
3. Variability of FLH In China
Figure 2 shows seasonal distributions of mean FLH during 1958–2005. White areas in all four panels in the figure were caused by absence of stations (cf. Fig. 1). Generally, FLH exhibited latitudinal zone, and declined from south to north. In winter, air temperatures at the ground surface were <0˚C over nearly two-thirds of China; FLH averaged 500 m in mid-east China and rose steeply to 4000 m at the margins of the tropics. FLH in spring and autumn showed similar distributions, with a minimum of 500 m and a maximum of 5000 m. Spatial variability was minimal in summer, with a range of <2000 m.
Mean FLH distribution for different seasons in China during 1958–2005. DJF: December–February; MAM: March–May; JJA: June– August; SON: September–November.
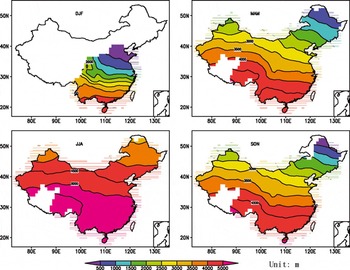
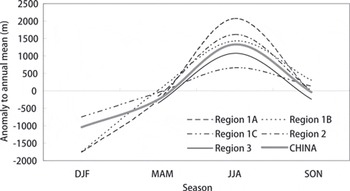
Figure 3 shows mean seasonal curves of FLH for different regions (Fig. 1) in China. FLH showed steep seasonal variation due to continental climatic conditions. Annual ranges of FLH averaged 3829m in region 1A, 3714m in region 1B and 1413 m in region 1C.
Seasonal curves of FLH for different regions in China and for all regions. DJF: December–February; MAM: March–May; JJA: June–August; SON: September–November.
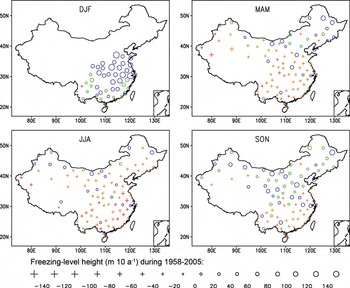
Trends in FLH over the past 48 years (1958–2005) were computed and are shown in Figure 4 (units of m(10 a)–1). Winter FLH trends showed overall FLH increases of 0.2– 18 m(10 a)–1 across southeast China. Autumn FLH in most of China increased; extreme positive and negative trends were 11.8 and 3.1 m(10 a)–1, respectively, implying 45 mincreases and 12 mdecreases during 1958–2005. Positive and negative trends of spring FLH were alternately fluctuating in general. FLH in summer, the most important season for cryospheric fluctuations, also fluctuated. However, in both northwest China and the Tibetan Plateau (regions 2 and 3; Fig. 1), the main locations of the cryosphere in China, summer FLH showed predominantly upward trends, consistent with retreat of the cryosphere, including permafrost and glaciers.
FLH trends during 1958–2005 at selected stations. DJF: December–February; MAM: March–May; JJA: June–August; SON: September– November.
To investigate interannual changes in FLH, we summarized decadal mean changes relative to 1971–2000 during the decades 1958–67, 1968–77, 1978–87, 1988–97 and 1998–2005 (Table 1). There were decreases in FLH during 1958–67 for all regions. During 1968–97, FLH showed significant upward fluctuations in most regions. On the Tibetan Plateau (region 3), the highest cryospheric region in the world, FLH increased during 1968-77 by 203 m, the sharpest increase during the study period for the entire studied region. In region 2, a typical region of valley glaciers and snow cover, FLH maintained increases over two decades. Region 1A, characterized by permafrost and snow cover, exhibited significant increases of 36 and 60m for 1968–77 and 1978–97, respectively. FLH decreased in all regions during 1998–2005, coupled with decreasing air and ground temperatures.
Decadal mean differences (m) compared to 1971–2000 of FLH for different regions
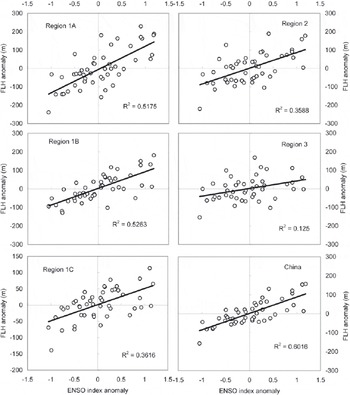
Reference Diaz and GrahamDiaz and Graham (1996) demonstrated that FLHs across the tropics are strongly related to mean tropical SST variations, with the rising SSTs driving freezing levels upward in the atmosphere. El Niño Southern Oscillation (ENSO) variations play a critical role in modulating FLH on an interannual basis across the entire tropical region (Reference Diaz, Eischeid, Duncan and BradleyDiaz and others, 2003). Considering the importance of ENSO to climatic fluctuation in China, especially eastern China, we plotted the November–March FLH versus ENSO index (Fig. 5); the ENSO index was expressed as the Niño 3 SST anomalies in the central and eastern equatorial Pacific Ocean (Niño 3.5N–5S, 90–150W). FLH in regions 1A and 1B showed highly significant correlations (P value) with the ENSO index, where the climatic variation has been shown to be closely related to ENSO. FLH in region 3 (Tibetan Plateau) showed a rather poor correlation with the ENSO index; the climate there has been found to be controlled by a plateau monsoon system (Reference Li, Cheng, Wu and DingLi and others, 2003). FLH in regions 1C and 2 showed a poor correlation with the ENSO index. The latter is more easily understood: the regional climate is dominated by the western jet stream. The poor correlation in region 1C, however, calls for further investigation, because ENSO events would be predicted to prevail.
Variation of FLH during November–March versus ENSO index.
4. Impact of FLH On Cryospheric Changes
4.1. FLH and snow cover
Snow cover suppresses surface heating by acting as a heat sink, in that energy is transferred to the atmosphere during the melting process and the sensible heat flux is greatly reduced. This, combined with the high surface albedo, will create negative changes in air temperatures in most snow-covered areas, even during the day.
Snow cover for each month was assessed from the NSIDC Equal-Area Scalable Earth (EASE) gridded weekly version 3 dataset (Armstrong and Brodzik, http://nsidc.org/data/nsidc-0046.html), which indicates, for each week from 1971 to 2005, the presence or absence of snow cover on a 25 km equal-area grid. The relevant grid pixel was identified for each station, and a snow index approximating the percentage of time with snow cover was calculated for each month by assigning 1 to snow-covered weeks and 0 to snow-free weeks, then averaging four or five weekly values. Individual weeks were assigned to the month with the most days in that week (e.g. The week of 29 January–4 February would be assigned to February).
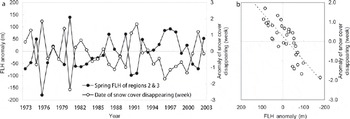
Having checked the variation of snow cover, we found the snow-cover disappearance date was well correlated with the spring FLH in the same area. Figure 6a shows a time series of spring FLH departures from a 1958–2005 reference mean for snow-covered regions, and relative changes in the date of snow-cover disappearance. The negative changes in snow-cover disappearance, indicating an earlier disappearance of snow cover, coincided with increased FLH (Fig. 6b).
Variation of snow-cover disappearance date versus relative FLH during spring. (a) Time series and (b) plots of correlation.
4.2. FLH and glaciers
According to the Concise Chinese Glacier Inventory, there are 46 377 glaciers in China, covering an area of 59 425.18km2, which represents 51.2% and 10.9–11.6% of the mountain glaciated areas in Asia (116.18×10³ km2) and on Earth (excluding the glaciers and ice caps surrounding the Greenland and the Antarctic ice sheets; (512×103)–(546×103) km2), respectively. Recent investigations indicate that glaciated areas in China have shrunk by about 2–10% over the past 45 years. Total glaciated area has receded by ~5.5% (Reference LiLi and others, 2008). Regrettably, because there is no observational network in these high mountains, these changes are occurring without adequate monitoring, yet the consequences of the changes in glacier mass balance will have significant social and economic consequences far downstream, in lowland areas into which the glacier-fed streams and rivers drain (Reference VergaraVergara and others, 2007).
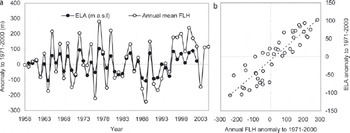
Figure 7 shows an example of the variation of equilibrium-line altitude (ELA) of Ürümqi glacier No 1 versus local FLH; ELA data were obtained from the Reference Zemp, Roer, Kääb, Hoelzle, Paul and HaeberliWorld Glacier Monitoring Service dataset (WGMS, 2008). The ELA of the glacier has been proven to be more sensitive to air temperatures than to precipitation (Reference Zhang, Fujita, Ageta, Nakawo, Yao and PuZhang and others, 1998). The local FLH (Fig. 7), averaged from four radiosonde stations near the glacier (shown in Fig. 1 by stations), has exhibited a clear upward trend since the late 1980s. Variation of the ELA of the glacier showed good correlation with FLH (Fig. 7b). From 1980 to 2002, the mass balance of the glacier decreased by 12 200 mm w.e., in conjunction with an FLH increase of ~300 m.
Variation of ELA on Ürümqi glacier No 1 versus relative FLH. (a) Time series and (b) plots of correlation.
Reference Diaz, Eischeid, Duncan and BradleyDiaz and others (2003) reported that FLHs across the tropics have risen by 45 m, on average, over the past 30 years. If this same relationship prevailed during glacial times, a mean SST cooling of 2–3˚C (as most paleoceanographic proxies now suggest) would have led to a fall in the 0˚C isotherm across the tropics by 500–750 m, with obvious effects on glaciation throughout the mountains of the region. Additional factors, such as an increase in the fraction of precipitation falling as snow (and less as rain) and associated changes in albedo and absorbed solar radiation accompanying the change in FLH, would have reinforced the effects of lower temperatures, leading to more positive mass-balance regimes, and increased glaciation of the high mountains (Reference Wagnon, Ribstein, Francou and SicartWagnon and others, 2001; Reference Favier, Wagnon, Chazarin, Maisincho and CoudrainFavier and others, 2004; Reference VuilleVuille and others, 2008).
4.3. FLH and permafrost
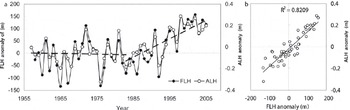
Reference Wu and ZhangWu and Zhang (2010) investigated spatial variations of active layer thickness (ALH) on the Tibetan Plateau. From their work, we provide an example of ALH variation during 1956–2005, that at Wudaoliang station (Fig. 8). ALH showed no or very limited change from 1956 to 1983 and a sharp increase of ~39 cm from 1983 to 2005. Figure 8b reveals a rather close correlation between ALH and local FLH (56004 in Fig. 1). Figure 8b shows that variation of ALH and FLH not only corresponded well in trends but were also synchronized in time.
Variation of ALH at Wudaoliang, Tibetan Plateau, versus relative FLH.
5. Summary
The most recent Intergovernmental Panel on Climate Change (IPCC) late-21st-century climate projections (Reference SolomonSolomon and others, 2007) show that warming of the atmosphere will be enhanced as greenhouse gases increase. Hydrometeorological observations in recent decades, together with geophysical evidence of melting and rapidly receding mountain glaciers, suggest that high-elevation mountain regions are already experiencing the environmental effects of global warming. Previous works have argued that the potential effects of an amplification of the global warming signal in mountain regions need to receive greater attention from researchers and international funding agencies (Reference Bradley, Keimig and DiazBradley and others, 2004; Reference Diaz, Eischeid, Duncan and BradleyDiaz and others, 2003). A resumption of warming will result in even more rapid changes in the cryosphere.
The pattern of evolution of the FLH might be considered a possible indicator of global climate change during the second half of the 20th century. In our study, we have demonstrated that the temporal variability of FLH in eastern China is associated with ENSO events, but the causes of alterations in FLH in western China will require advanced investigations. We used atmospheric air-temperature data from the Chinese radiosonde network to analyze changes in FLH during the past 48 years and examined their impact on the cryosphere. We examined radiosonde time series from 92 stations selected from the entire Chinese network. Generally, FLH exhibited a latitudinal zone and declined from south to north, but amplitudes of spatial variation varied in accordance with the seasons. The FLH trend during 1958–2005 showed spatial heterogeneity, most uniform distribution in autumn, and significant upward trends. Temporal variability of FLH in eastern China was briefly associated with ENSO events, but the cause of FLH changes in western China calls for advanced investigation. FLH in western and northern China has generally increased since 1958 and might be considered a possible indicator of global climate change in the second half of the 20th century. There were significant correlations between FLH and changes in snow cover, glacier and permafrost.
Acknowledgements
This study was funded by the Major State Basic Research Development Program of China (973 Program) under grant Nos. 2010CB951701 and 2010CB428606 and by the Natural Science Foundation of China (No. 595 40775045 and No. 41071042), also supported by the Innovation Project of the Chinese Academy of Sciences (KZCX2-YW-BR-22).


