

Foliages from trees and browses are the important feed resources for small ruminant production(Reference Devendra and Devendra1–Reference Patra3) to enhancing the productivity of animals. Fodder trees are more particularly important in the arid and semi-arid regions because trees can survive harsh climatic conditions compared to grasses, and hence may be more reliable feed resources in these areas. These multipurpose tree foliages contain moderate levels of N, minerals and vitamins(Reference Devendra and Devendra1, Reference Topps2), and have been suggested as a solution to feeding of ruminants in the tropical areas, especially as supplementary feeds to low-quality forages(Reference Patra3–Reference Patra6).
Many models have been published, particularly in recent years, in an effort to reduce N excretion in the environment, to develop prediction equations for N excretion in faeces and urine and to increase the efficiency of utilisation of dietary N in dairy and beef cattle based on the dietary chemical composition(Reference Kebreab, France and Mills7–Reference Huhtanen, Nousiainen and Rinne11), and sheep and goats based on blood urea N levels(Reference Kohn, Dinneen and Russek-Cohen12). Although tree leaves contain moderate level of N, they also contain tannins and other secondary compounds that may influence intake and utilisation of nutrients. In particular, tannins bind dietary protein, which might affect N excretions and retention, thus affecting protein utilisation patterns. For instance, it has been proposed that foliages containing tannins could increase the excretion of metabolic faecal N(Reference Woodward and Reed4), and alter the N partitioning between faecal and urinary excretion(Reference Reed, Soller and Woodward5, Reference Snyder, Luginbuhl and Mueller13–Reference Tiemann, Lascano and Wettstein15). However, there is perhaps no information available in the literature on prediction of N excretion and losses of endogenous N for foliage-based diets in sheep. The model of N excretion and utilisation developed for conventional diets may not be suitable for diets based on foliages in sheep.
The present study was, therefore, conducted to develop prediction equations for N excretion, to examine the effects of dietary and animal factors on N excretion in faeces (FN) and urine (UN) and to determine endogenous N excretion in sheep-fed foliage based-diets. A better understanding of the effects of dietary and animal factors including levels of foliages in diets (FL) on the efficiency of utilisation of dietary N will allow nutritionists to optimise growth performance, and to predict N excretion in faeces and urine in sheep.
Experimental methods
Construction of database
The database analysed in the present study was compiled from forty-four different publications that reported data on animal characteristics, composition of diets, intake, digestibility and N balance. For inclusion in the database, studies needed to meet all of the following criteria: (1) publications were in peer-reviewed journals in the English language; (2) sheep were used as the experimental animals; (3) foliages from tree fodders and shrubs were incorporated in the diets; (4) chemical composition of diets and foliages was reported or was possible to calculate from the reported data; (5) no toxic effects of plant secondary compounds present in foliages were reported; (6) experiments were conducted under confined conditions; (7) data for roughages-only fed groups were considered when foliages were fed in those studies. FN and UN data were derived from total collection of faeces and urine. Overall, there were 218 treatment mean observations representing 1239 sheep of different breeds. This database was split into three subsets: without foliage in the diets (FL-0); FL in between 0 and 310 g/kg (FL-L); FL in between 310 and 800 g/kg (FL-H) of diets for estimation of metabolic faecal N (MFN) and endogenous UN (EUN) in order to study the effect of foliages on basal N excretions. The splitting up of diets containing foliages was based on the mean FL (310 g/kg) in the database to obtain subsets of low FL and high FL with equal interval level data for foliage content in the diets. The database (n 162) for prediction of N excretion and retention did not include the diets, which did not contain foliages. The investigated dietary and animal factors (independent variables) were N intake (NI, g/kg metabolic body weight (BW0·75)), dietary N concentration (g/kg DM), FL (g/kg DM), BW0·75, NI from foliage (g/kg BW0·75) and dietary neutral-detergent fibre (NDF) concentration (g/kg DM), and animal response variables were faecal N, urinary N, total N excretion and retained N scaled to g/kg BW0·75, and ammonia N (mg/l). All variables were not available across all observations in the dataset. Hence, the number of observations used for regression analyses varied between dietary and response variables depending on the regressor variables available. Although it might have been desirable to include tannins concentration of diets or tree foliages in the model, most of the studies did not report concentration of tannins in foliages and there was little consistency among studies in method of tannins estimation.
Foliages were predominantly of leguminous types of different genera and species and they were used mainly as supplements to low-quality forages such as teff straw, maize and sorghum stovers and grasses. For some studies, foliages along with concentrates were provided to sheep as supplementary feeds. The FL-H diets contained the foliages of Acacia cyanophylla, Acacia saligna, Acacia angustissima, Atriplex nummularia, Buddleja skutchii, Chamaecytisus palmensis, Cratylia argentea, Elaeis guineense, Gliricia sepium, Leucaena leucocephala, Leucaena pallida, Leucaena purpureum, Leucaena diversifolia, Morinda lucida, Sesbania sesban and Calliandra calothyrsus. The FL-L diets contained all the above foliages including Acacia seyal, Brosimum alicastrum, Ficus infectoria, Lysiloma latisiliquum, Moringa oleifera, Stylosanthes guinensis and Vernonia amygdalina. A substantial amount of tannins is present in these foliages, which varies depending upon the environmental factors such as species of plants, stages of growth, different parts of the plant, temperature, rainfall, soil type and fertility(Reference Devendra and Devendra1, Reference Norton, Gutteridge and Shelton16). While FL-0 did not contain any foliages, FL-H and FL-L contained most of the foliages in common. Therefore, concentrations of tannins are likely to be greater in FL-H compared with FL-L due to greater levels of foliages in FL-H diets, and FL-0 diets are likely to contain negligible amounts of tannins.
Many studies reported additional outcomes; however, only the outcomes of interest were used in the dataset. Data reported in differing units of measure were transformed to the same units. Some records were incomplete or not reported uniformly, which necessitated the calculations from the reported data. For example, FN excretion was calculated from the reported apparent digestibility of protein and NI. For studies in which mean body weight (BW) was not reported, an average of initial and final BW was used as mean BW. If average daily gain was provided in addition to either initial or final BW, these values and the duration of the experiment were used to estimate mean BW. In some instances, chemical composition of diets was determined from ingredient composition of diets. When a study did not report all possible outcomes and it was not possible to calculate from the reported data, missing variables were considered as missing data.
An approval of institutional and national guidelines for the care and use of animals for the present study was not obtained from the ethics committee or related approving body because the data were obtained from existing data sources, as described earlier.
Statistical analysis
Linear model
Statistical analysis procedure used for meta-analysis of this database has been described elsewhere(Reference Patra3). A brief account of statistical analysis is presented here. All statistical computations were carried out using the PROC MIXED, PROC REG and PROC CORR procedures of the Statistical Analysis System (SAS) software system(Reference Norton, Gutteridge and Shelton16). Data were analysed according to St-Pierre(Reference St-Pierre17) taking into account the random effect of the study, using PROC MIXED(18) with the following model:
where Yij, the expected outcome for the dependent variable Y observed at level j of the continuous variable X in the study i; B 0, the overall intercept across all studies (fixed effect); B 1 and B 2, the overall linear and quadratic regressing coefficient of Y on X, respectively, across all studies (fixed effect); X ij, the synthetic datum value j of the continuous variable X in study i; si, the random effect of study i; b i, the random effect of study i on the regression coefficient of Y on X in study i; and e ij, the unexplained residual error.
The variable study was declared in the CLASS statement. Data were weighted by the number of animals in each study to take into consideration of unequal variance among studies. The slopes and intercepts by study were included as random effects, and an unstructured variance–covariance matrix (type = un) was performed at the random part of the model, as suggested by St-Pierre(Reference St-Pierre17). When random covariance of slopes and intercept was NS (P>0·05), a variance component (type = vc) of variance–covariance structure was performed(Reference St-Pierre17). When squared term of dietary factors was P>0·10, the square term was not included in the model.
All significant dietary factors (P < 0·10) along with quadratic terms and all possible two-way interactions were further tested using the backward elimination multiple regression following the algorithm reported by Oldick et al. (Reference Oldick, Firkins and St-Pierre19). In order to limit the over-parameterisation of the model, a variance inflation factor less than fifty for every independent variable tested was considered. The best-fit model was chosen as the one with the lowest root mean square error (RMSE), higher determination coefficient (R 2) and the lower value of the Bayesian information criteria. The best-fit equations of multiple regression (backward elimination), which further improved the relationship obtained from linear or polynomial regression, are presented in the table.
For proper graphic representation of statistical results from multidimensional space of different studies into two-dimensional space, the Y observation was adjusted to take into account the random effect of study. The coefficient of multiple regression (R 2) calculations also used the adjusted Y observation(Reference St-Pierre17).
Using Lucas test, true digestibility of N was estimated from the slope by regressing apparently digestible N (ADN) amount on amount of N in the diets(Reference Van Soest20). Estimates of MFN and endogenous UN losses (EUN) were obtained from the intercepts by regressing FN output (mg/kg W0·75) on NI (mg/kg W0·75) and UN output (mg/kg W0·75) on apparently digestible NI (mg/kg W0·75), respectively, with PROC MIXED of SAS(18) and following the procedure of St-Pierre(Reference St-Pierre17). Using PROC REG of SAS(18), the differences among diets in intercepts and slopes of regression equations were tested by analysis of covariance(Reference Snedecor and Cochran21) after adjusting study effect. The dummy variables were considered to address the intercept and slope difference.
Non-linear model
Because biological responses are rarely linear over a wide range of values, non-linear relationships between excretion (FN, UN and total N) or retention of N (g/kg BW0·75) and NI (g/kg BW0·75) were also evaluated for prediction of N excretion and retention by sheep fed on tree foliage-based diets. Since NI as sole-dependent variable predicted N excretion and retention with the highest degree of determination in the linear model, the non-linear models were used for these relationships, if they were further improved. These were a relationship exhibiting diminishing returns behaviour (monomolecular) and a relationship exhibiting sigmoidal behaviour (Gompertz)(Reference Thornley and France22). The PROC NLMIXED of SAS was used to parameterise the monomolecular and Gompertz functions with a little modification of the equation used by Schulin-Zeuthen et al. (Reference Schulin-Zeuthen, Kebreab and Gerrits23) and the exponential model in the following forms:
where the parameters a and b represent the upper asymptote and y intercept of the non-linear models, respectively, and c determines the shape of the response curve in the non-linear functions. A non-linear mixed-model procedure based on Schinckel & Craig(Reference Schinckel and Craig24) and Schulin-Zeuthen et al. (Reference Schulin-Zeuthen, Kebreab and Gerrits23) was followed for these analyses. Study including parameters a, b and c was considered random in the models. The lowest value of Akaike's information criteria (a measure of regression fit), greater values of determination (R 2) and biological relevance of the parameters estimated were considered to find out the optimum models(Reference Hristov, Price and Shafii25). Distribution of random effects was assumed to be normal, and the dual quasi-Newton optimisation technique with adaptive Gaussian quadrature as the integration method was used for this analyses. Non-linear mixed-model analysis was also used to determine the MFN and EUN excretion in three types of diets, which were estimated by the intercept on the Y-axis (i.e. b)(Reference Schulin-Zeuthen, Kebreab and Gerrits23).
Results
Description of database
Table 1 provides a summary of the data. The diets that did not incorporate foliages were not included for prediction of N excretion and retention in the database. Some studies did not report all variables of interest in the present study. Therefore, the number of observations varied among variables. Body weight of sheep ranged from 10·5 to 54·8 kg with an average of 24·0 (se 0·71) kg. Dietary N and NDF concentration ranged from 4·69 to 34·6 (15·6, se 0·42) and from 332 to 832 (601, se 8·25) g/kg DM, respectively, which indicate that sheep were fed low- to medium-quality diets. Sheep consumed total DM ranging from 351 to 1531 (722, se 16·7) g/d, and the FL in the diets were from 63 to 800 (310, se 10·2) g/kg of total diets. The total NI by sheep ranged from 2·3 to 36·5 g/d. The faecal and urinary N output ranged from 2·03 to 18·5 g/d and from 0·27 to 14·6 g/d. Although predictive variables in the database ranged widely, the prediction equations presented here should be used with caution when input variables are outside the range of variables in the database.
(Mean values and standard deviations; minimum and maximum values)
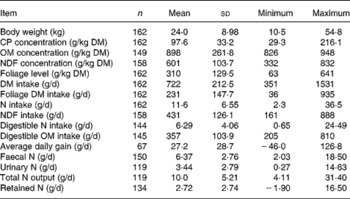
CP, crude protein; OM, organic matter; NDF, neutral-detergent fibre.
Pearson correlation matrices (R) for the datasets are shown in Table 2. The concentrations of CP and FL in the diets correlated positively to faecal, urinary and total N excretion and N retention, whereas NDF and organic matter (OM) concentrations in diets correlated negatively to all these response variables. The intakes of DM, foliage, N, NDF, digestible OM and N were related positively to N excretion and retention. However, these relationships had considerable differences in strength. In general, R values in the relationships of N excretions and N retention were strong with NI, apparently digestible NI and foliage intake, and weak with NDF and OM concentration in the diets.
Correlation coefficient (R) for relationships between animal and dietary variables and nitrogen balance in the databases
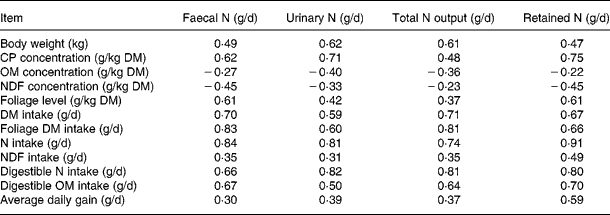
CP, crude protein; OM, organic matter; NDF, neutral-detergent fibre.
Linear model
Faecal nitrogen
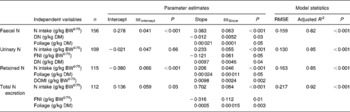
Table 3 shows the results of linear and quadratic prediction equations of N excretion in sheep to different dietary factors (only significant (P < 0·10) relationships are shown). The excretion of FN increased linearly with increasing amount of total NI and foliage NI, concentrations of dietary N, foliages and NDF in the diets. All relationships were significant (P < 0·001), and each predictor had a significant effect on the relationship (P < 0·01). The R 2 value in the linear relationship between NI and FN was highest (0·75), and the lowest R 2 value was observed in the relationship between FN and FL (0·39). The best-fit multiple regression model of FN included the significant predictor variables of NI, dietary N concentration and FL, and the variables were positively related except dietary N concentration (Table 4). Including both variables along with NI, a small improvement on the relationship (R 2 value from 0·75 to 0·82) was noted, and RMSE values decreased from 0·177 to 0·159.
(Estimates with their standard errors)
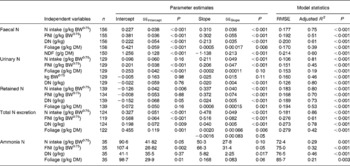
RMSE, root mean square error; BW0·75, metabolic body weight; FNI, N intake from foliage; DN, dietary N concentration; NDF, neutral-detergent fibre.
* Only the significant relationship (P < 0·05) of linear or polynomial regressions is shown.
(Estimates with their standard errors)
BW0·75, metabolic body weight; RMSE, root mean square error; DN, dietary N concentration; FNI, N intake from foliage; DOMI, digestible organic matter intake.
Faecal N (% of NI) decreased quadratically with increasing N concentration in the diets with the following significant relationship:
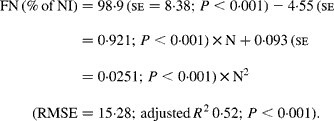
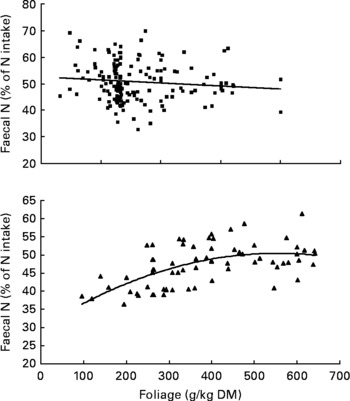
It was observed from this relationship that FN (% of NI) was lowest at N concentration of 25 g/kg DM. The FL in the diets did not affect FN output (% of NI) in the total database, but FN (% of NI) showed a quadratic relationship with FL (Fig. 1), when dietary N concentrations were greater than 15 g/kg (a optimum level of N concentration noted by Patra(Reference Patra6) for growth in sheep-fed low-quality roughages supplemented with tree foliages in tropical countries). Therefore, it was apparent that FN (% of NI) was influenced by FL (g/kg) and N concentrations (g/kg) in the diets, and the relationship was improved slightly (R 2 0·52 v. 0·57):
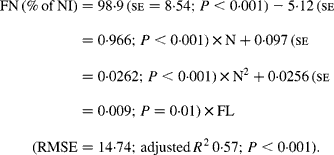
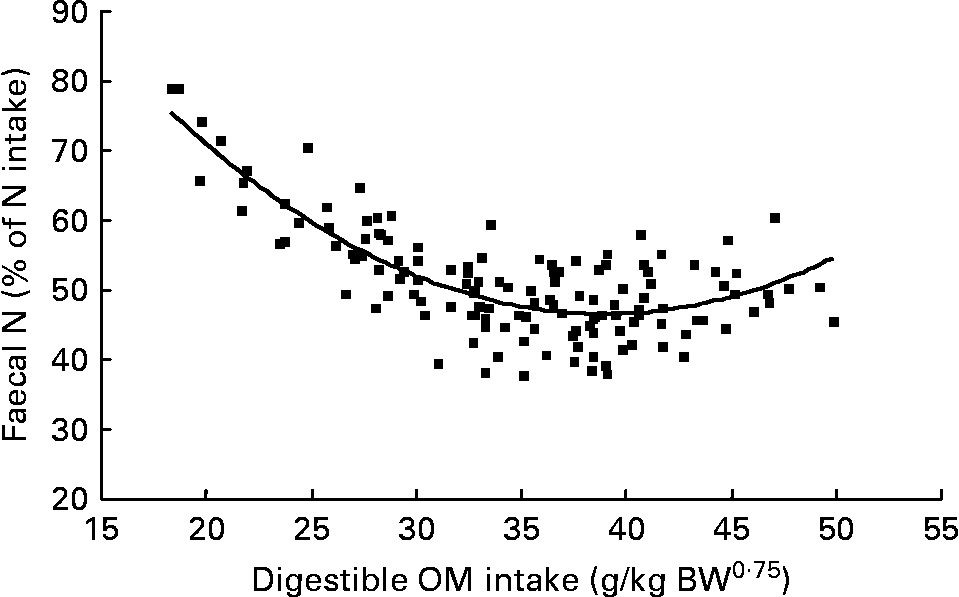
Again, FN (% of NI) decreased with digestible OM intake (DOMI, g/kg BW0·75) and the relationship was (Fig. 2):
The relationships between foliage level (g/kg DM) and faecal N excretion (% of N intake). Symbols represent adjusted values of faecal nitrogen (% of N intake) in whole dataset (■) and diets containing >15 g/kg N (▲), and —, model predictions.
The relationships between digestible organic matter (OM) intake (g/kg body weight (BW0·75)) and faecal nitrogen excretion (% of N intake). (■) Adjusted values of faecal nitrogen (% of N intake); —, model prediction.
Urinary nitrogen
Increasing total NI (R 2 0·81) and foliage NI (R 2 0·45) increased the quantity of N excreted in urine linearly. Similarly, UN excretion increased linearly with increasing concentration of dietary N and foliage, although the relationship for FL was low (P = 0·10; R 2 0·19). Metabolic BW predicted UN excretion linearly with moderate confidence (R 2 0·46), and there was a tendency (P = 0·11) to a positive relationship between metabolic BW and UN. The concentration of NDF in the diets had no effect on the UN excretion. NI (P < 0·001) and dietary N concentration (P = 0·04) linearly and positively, but foliage NI linearly and negatively (P = 0·05), predicted UN excretion in the multiple regression equation with a slight improvement on the relationship (R 2 0·85).
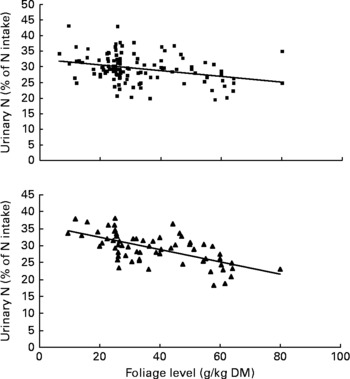
Urinary N output (% of NI) also was not affected by FL and N concentration in this database, but decreased linearly with increasing FL when dietary N concentration was greater than 15 g/kg DM with the following significant relationship (Fig. 3):
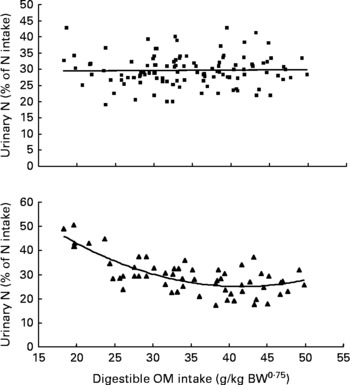
Similarly, UN (% of NI) was not related to DOMI in the whole database, but decreased quadratically with increasing DOMI (g/kg BW0·75) when dietary N concentrations were more than 15 g/kg diet (Fig. 4):
The relationships between foliage level (g/kg DM) and urinary nitrogen excretion (% of N intake). Symbols represent adjusted values of urinary nitrogen (% of N intake) in whole dataset (■) and diets containing >15 g/kg N (▲), and —, model prediction.
The relationships between digestible organic matter (OM) intake (g/kg body weight (BW0·75)) and urinary nitrogen excretion (% of N intake). Symbols represent adjusted values of urinary nitrogen (% of N intake) in whole dataset (■) and diets containing >15 g/kg N (▲), and —, model predictions.
Total nitrogen output
Total N output increased linearly (P < 0·001) with increasing NI, foliage NI and dietary N concentrations, but responded quadratically (P = 0·05) to FL in the diets. The relationships between NI, foliage NI and N concentration in diets were strong (R 2 0·86, 0·61 and 0·78, respectively). Other predictive variables did not show any significant (P>0·10) effect on total N output. The model that best predicted total N output (R 2 0·92) included the significant dietary variables of total NI (positive and linear; P < 0·001), foliage NI (negative and linear; P = 0·01) and FL (positive and linear; P = 0·003). Total N output (% of NI) was not influenced by FL in the present database.
Retained nitrogen
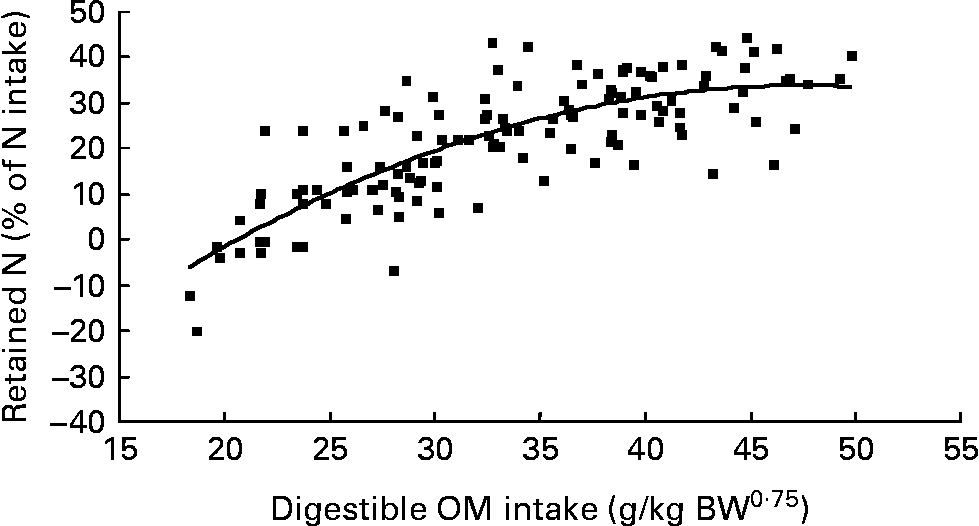
Nitrogen retention increased linearly with increasing total N and foliage NI, concentrations of dietary N and FL in the diets. All relationships were significant (P < 0·001), and each predictor had a significant effect on the relationship (P < 0·01). The R 2 value in the linear relationship between NI and N retention was highest (0·80), and the lowest R 2 value was observed in the relationship between N retention and FL (0·53). With the significant predictive variables of linear regression considered for the analysis, multiple regression model of N retention did not include any significant predictor variables. Because DOMI (energy intake) might affect N retention, this was considered as a predictor variable for N retention in multiple regression model. It was noted that multiple regression model contained significant predictive variables of NI, FL and DOMI. All variables were positively related and the relationship improved slightly (R 2 value from 0·80 to 0·85). The efficiency of N retention i.e. retained N (% of NI) increased quadratically with increasing DOMI (g/kg BW0·75) with the following relationship (Fig. 5):
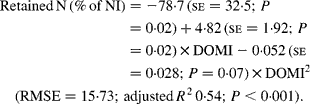
The relationships between digestible organic matter (OM) intake (g/kg body weight (BW0·75)) and retained nitrogn (% of N intake). (■) Adjusted values of digestible OM intake (g/kg BW0·75); —, model prediction.
Ammonia nitrogen concentration in the rumen
The linear regression analysis showed that ammonia N in the rumen increased linearly with increasing total NI (P = 0·001, R 2 0·29), foliage NI (P < 0·001, R 2 0·32), FL (P = 0·003, R 2 0·21) and N concentration in diets (P < 0·001, R 2 0·46). Multiple regression equation did not further improve the relationship compared to linear regressions.
Non-linear models
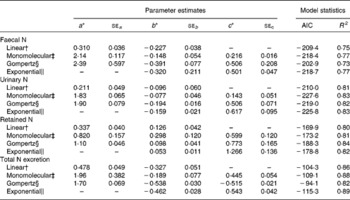
Table 5 represents the parameter estimates and goodness of model fit for the different linear and non-linear models of N excretion and retention (g/kg BW0·75) using NI (g/kg BW0·75) by sheep as a predictable variable. Comparison of models based on Akaike's information criteria and R 2 values showed that the monomolecular model slightly improved the relationships between N excretion (FN, UN and total N output) or N retention and NI compared with the linear and Gompertz functions except N retention. The Gompertz equation increased the accuracy of prediction of N retention with highest degree of determination (R 2) and lowest value of Akaike's information criteria compared with monomolecular and linear functions, and slightly improved the prediction of UN excretion compared with linear models. However, FN and total N output were not better predicted by the Gompertz model compared with any other models tested in the present study. The exponential model did not further improve the relationships between NI and N outputs (faecal and urinary) compared with monomolecular model. However, the exponential model yielded the best relationship between NI and total N output (faeces plus urine) in the present dataset with highest R 2 and lowest Akaike's information criteria values. Nitrogen retention was best predicted by the Gompertz followed by exponential and monomolecular equations.
(Estimates with their standard errors)
BW0·75, metabolic body weight; AIC, Akaike's information criteria.
* Parameters a, b and c describe the upper asymptote, y intercept and shape parameter of the non-linear functions.
† Linear: Y = ax − b.
‡ Monomolecular: Y = a − (a+b) × e− cx.
§ Gompertz: Y = b × exp ((1 − e− cx) × ln (a+2b)/b) − 2b.
∥ Exponential: Y = − becx.
Endogenous nitrogen excretion
To study the effects of foliages on MFN and EUN excretions, the entire database was split into three subsets: FL-0; FL-L; FL-H. For FL-0 (n 56), sheep were offered roughages alone as a sole diet or a mixture of roughages and concentrates. These diets were considered from the studies that also reported the data on diets containing foliages to nullify the effect of study on MFN and EUN excretion. The mean BW, intakes of DM and digestible OM were similar in three subsets (Table 6). The mean FL was 0, 231 and 470 g/kg in FL-0, FL-L and FL-H, respectively. The NDF concentrations were significantly greater (P < 0·05) in FL-0 and FL-L than in FL-H, and NI by sheep was greater in FL-H than in FL-0 and FL-L. The NDF concentration and NI were similar in subsets of FL-0 and FL-L.
(Mean values with their standard errors)
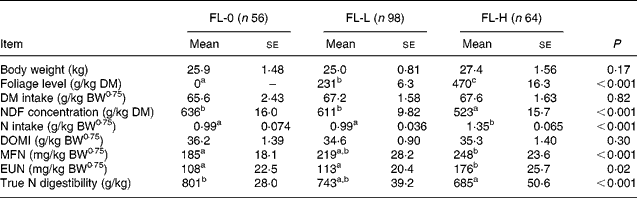
FL-0, without foliage in the diet; FL-L, foliage levels of >0 ≤ 310 g/kg diet; FL-H, foliage levels of >310 g/kg diet; BW0·75, metabolic body weight; NDF, neutral-detergent fibre; DOMI, digestible organic matter intake.
a,b Mean values with unlike superscript letters were significantly different (P < 0·05).
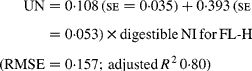
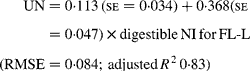
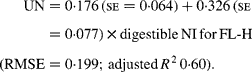
Regressing FN output (mg/kg W0·75) on NI (mg/kg BW0·75) yielded the following significant (P < 0·001) relationships:
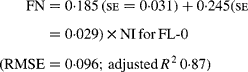
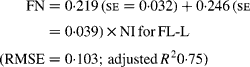
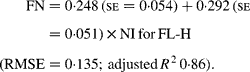
The MFN excretion was significantly greater (P < 0·05) for FL-H (248 mg/kg BW0·75) compared with FL-0 (185 mg/kg BW0·75), but was similar between FL-0 and FL-L (219 mg/kg W0·75), and FL-L and FL-H (Table 5).
Estimates of MFN excretion determined by the monomolecular and Gompertz equations were 165 (se 41) and 220 (se 23), 191 (se 49) and 263 (se 19), and 214 (se 61) and 338 (se 28) mg/kg BW0·75 for FL-0, FL-L and FL-H, respectively. Estimates of MFN determined by the exponential function were 204 (se 19), 272 (se 31) and 356 (se 37) for FL-0, FL-L and FL-H, respectively.
Similarly, regressing UN output (mg/kg W0·75) on digestible NI (mg/kg W0·75) yielded the following significant (P < 0·001) relationships:
The EUN excretion was also significantly greater (P < 0·05) for FL-H (176 mg/kg BW0·75) compared with FL-0 (108 mg/kg BW0·75) and FL-L (113 mg/kg BW0·75), but was similar between FL-0 and FL-L.
Estimates of EUN excretion (mg/kg BW0·75) determined by the monomolecular equation were 94 (se 40), 107 (se 35) and 179 (se 48) for FL-0, FL and FL-H, respectively, which were considerably lower than the values determined by the Gompertz equation (137 (se 47), 196 (se 21) and 262 (se 42) for FL-0, FL and FL-H, respectively) and the values determined by the exponential equation (127 (se 22), 150 (se 17) and 213 (se 35) for FL-0, FL and FL-H, respectively).
Regressing ADN (g/kg DM) concentrations on N concentrations in the diets (N, g/kg DM) resulted in following significant (P < 0·001) relationships:
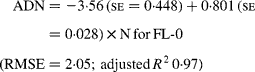
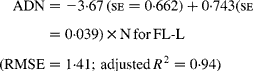
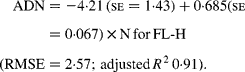
The true digestibility of N was significantly greater (P < 0·05) for FL-0 (801 g/kg N) compared with FL-H (685 g/kg N), and was intermediate for FL-L (743 g/kg N).
Discussion
Nitrogen excretion in faeces and urine
Linear model
The present study evaluated the relationships between N excretion (faecal, urinary or total N) and a number of dietary and animal variables in sheep, and showed that the best-fitting factor was NI. Using NI as a single predictor produced a very high R 2 (0·75, 0·81 and 0·86 for faecal, urinary and total N excretion, respectively). Prediction model for N excretion from dietary variables in sheep is perhaps not available in the literature to compare with the prediction equations developed from the present database containing foliages. Nevertheless, Yan et al. (Reference Yan, Frost and Keady10) also reported that NI as single independent factor is the best-fitting factor predicting N excretion in beef cattle.
The R 2 value in the relationship between total N excretion and NI was 0·86 in the present study, and was 0·90 in beef cattle and 0·78 in lactating dairy cows in the study of Yan et al. (Reference Yan, Frost and Keady10) and Kebreab et al. (Reference Kebreab, France and Beever26), respectively. In the present study, total N excretion was best predicted when foliage content in the diet and foliage NI were included as supporting predictors, and addition of each of these variables had a significant effect on the relationship. The R 2 value slightly increased to 0·92 and se reduced to 0·217 from 0·233, which was similar to the finding of Yan et al. (Reference Yan, Frost and Keady10) in beef cattle using NI, BW and forage proportion as predictors (R 2 0·92), and Wilkerson et al. (Reference Wilkerson, Mertens and Casper27) with growing cattle using DM intake, dietary CP concentration, dietary NDF concentration and live BW as predictors (R 2 0·94) for N excretion.
The FN (% of NI) increased quadratically with increasing FL when N concentrations were greater than 15 g/kg in the diets probably because of the binding of protein with tannins present in foliages, all of which may not dissociate in lower digestive tract and thus excreted in faeces as NDF-N(Reference Woodward and Reed4, Reference Reed, Soller and Woodward5). Decreased UN (% of NI) with increasing FL in the diets may be due to increased FN (% of NI). These observations agree with the findings that foliages in the diets containing tannins may alter N partitioning between faeces and urine(Reference Reed, Soller and Woodward5, Reference Snyder, Luginbuhl and Mueller13–Reference Tiemann, Lascano and Wettstein15, Reference Animut, Goetsch and Puchala28). However, when dietary N content was less than 15 g/kg DM, the FN or UN (% of NI) was not affected, which is not clear. It may be possible that incorporation of foliages in the low-protein diets may increase N digestibility due to improvement in microbial fermentation in the rumen; whereas for high-protein diet (>15 g/kg DM), the microbial fermentation was perhaps optimum and hence foliage inclusion did not further increase the N digestibility(Reference Patra3). Therefore, the general observation that foliages in the diets due to the presence of tannins may alter N excretion pathway is perhaps not true for diets containing N less than 15 g/kg DM. Nonetheless, the present study suggests that inclusion of foliages in high-protein diets may shift N excretion from urine to faeces, which is beneficial for environmentally reducing ammonia emission(Reference Kebreab, France and Mills7, Reference Marini and Van Amburgh29). Urinary urea is rapidly converted to ammonia and nitrous oxide; whereas FN is comparatively stable to volatisation(Reference Petersen, Sommer and Aaes30), which give adequate time before it reaches to storage facilities for the treatment of manure. Again, an increased N content in faeces may increase the value of faeces as fertilisers by slowing down the release of N after application in the soil(Reference Powell, Wattiaux and Broderick31).
The quadratic response of UN (% of NI) as the digestible OM intake by sheep increased was probably due to the increased efficiency of microbial capture of the available N, which decreased N escaping from the rumen as ammonia and the proportion of N excreted in urine(Reference Kebreab, France and Mills7, Reference Rooke, Lee and Armstrong32). The efficiency of N retention was improved with digestible OM intake(Reference Zanton and Heinrichs33) (hence metabolisable energy intake) probably because of improved energy status of sheep, and therefore the amount of N metabolised for energy purpose diminished.
Non-linear models
The non-linearity of regression could be expected for any kind of biological response(Reference Schulin-Zeuthen, Kebreab and Gerrits23). It has been noted that monomolecular model improved the prediction of N excretion compared with either linear or Gompertz model. There appears no direct literature available on prediction of N excretion to compare the linear and non-linear models with other studies. However, a bilinear relationship between NI and FN excretion was observed in other studies in cattle(Reference Kebreab, France and Mills7, Reference Castillo, Kebreab and Beever34). The linear increase of FN in response to NI was expected because dietary indigestible N, which contributes to the FN, increased with the amount of protein consumed(Reference Kebreab, France and Mills7). The bilinear relationship between NI and FN was explained by Kebreab et al. (Reference Kebreab, France and Mills7) that microbial FN increased with increasing available energy for the growth of microbial cells, but as the amount of microbial synthesis approached optimum according to the available energy, the contribution to MFN remained constant so the increase in FN was mostly as indigestible N from the protein consumed. In support of the monomolecular model that predicts N excretion better, Kebreab et al. (Reference Kebreab, Schulin-Zeuthen and Lopez35) noted that the monomolecular equation was best at determining efficiencies of phosphorus utilisation for body weight gain compared with the sigmoidal model. Schulin-Zeuthen et al. (Reference Schulin-Zeuthen, Kebreab and Gerrits23) also showed that the monomolecular model was the best predictor of the relationship between phosphorus retention and available phosphorus intake compared with linear and Gompertz models. In their study(Reference Schulin-Zeuthen, Kebreab and Gerrits23), the Gompertz model was better than the linear one as observed for the relationship between UN excretion and NI in the present study. However, Gompertz model did not improve model fit for FN or total N output v. NI compared with linear model. Conversely, NR was best predicted by Gompertz model. The sigmoidal curve follows through four phases i.e. lag phase, accelerating phase, deceleration phase and stationary phase(Reference Kebreab, Schulin-Zeuthen and Lopez35). This suggests that NR pattern v. NI may remain lag phase at low NI until basal N requirement is fulfilled, followed by accelerating NR starting from the end of lag phase, then NR goes into the decelerating phase and finally NR does not improve with increasing NI when the optimum live weight gain of animals is reached. In lactating dairy cattle-fed diets consisting of grass silages and concentrates, Kebreab et al. (Reference Kebreab, France and Mills7) noted that UN excretion had an exponential response to increased amounts of NI, whereas total N excretion was linearly correlated with NI. However, total N output had an exponential relationship with NI in the present study. This discrepancy might involve a different range of NI compared with its requirement between the studies. The present study suggests that the linear mixed model could reasonably predict N utilisation, while the monomolecular or exponential and Gompertz mixed model could be the best in predicting N excretion and N retention in sheep, respectively.
The present study evaluated the effects of a number of dietary factors on the N excretion and utilisation in sheep. The most effective strategy to reduce N excretion is to manipulate NI and dietary N concentration. For example, from the predicted equations, it has been noted that increasing NI by 1 g/kg BW0·75 and dietary N concentration by 1 g/kg DM could increase the total N excretion by 0·48 and 0·04 g/kg BW0·75, respectively. Yan et al. (Reference Yan, Frost and Keady10) also noted that increasing dietary N concentration by 1 g/kg DM could increase N excretion per kg of live BW by 0·0089 g in beef cattle. The FN and UN (% of NI) could be decreased by increasing the digestible OM in the diet when dietary N concentrations are greater than 15 g/kg diet, while the efficiency of NR (NR, % of NI) could be improved with increasing the feeding of digestible OM matter. Besides, the present study demonstrates that diet-containing foliages could route N excretion from urine to faeces, which will reduce ammonia emission in the environment. These findings clearly suggest that dietary N concentration, dietary foliage levels and digestible OM level could be used to control N pollution from animals.
Endogenous nitrogen losses
The MFN and EUN excretion predicted by the different models varied greatly among the models. The Gompertz model predicted higher MFN and EUN excretion compared with linear or monomolecular models (monomolecular < linear < Gompertz model) irrespective of diets. Schulin-Zeuthen et al. (Reference Schulin-Zeuthen, Kebreab and Gerrits23) determined endogenous phosphorus excretion from meta-analytic study in pig and the estimates of endogenous phosphorus excretion ranged from 23 to 123 mg/kg BW0·75, with values from the monomolecular at the lower end and Gompertz at the higher end in their study.
Nitrogen in faeces is the sum of undigested dietary N and MFN (endogenous N and microbial FN). The endogenous FN is the residues of body secretions and sloughed epithelial tissue caused by the movement of feed through the gastrointestinal tract. Additionally, urea N from the blood as a process of urea recycling can be diffused into the large intestine and sequestered for microbial protein synthesis, increasing FN losses and decreasing UN output(Reference Orskov, Fraser and Mason36, Reference Giraldez, Valdes and Pelaez37). In ruminants, a number of factors such as intakes of N, DM and digestible OM, ammonia concentration in the rumen and dietary NDF concentration influence the extent of urea N recycling to the gastrointestinal tract and MFN excretion. Kennedy & Milligan(Reference Kennedy and Milligan38) proposed that urea recycling to the rumen increases when digestible OM intake increases and/or ruminal ammonia concentration decreases. Giraldez et al. (Reference Giraldez, Valdes and Pelaez37) clearly demonstrated that MFN increased quadratically from 153 to 280 mg/kg W0·75 with increasing levels of digestible OM intake by sheep, which had been explained due to increased N entry to the gastrointestinal tract. Further to that, DM intake(Reference Van Soest20) and the dietary NDF(Reference Giraldez, Valdes and Pelaez37) content might also affect MFN loss. A number of studies have reported that endogenous ileal flow of N increases as NDF content of the feeds increases(Reference Sauer, Stothers and Parker39, Reference Taverner and Farrel40). Likewise, Voigt et al. (Reference Voigt, Van Bruchem and Lammers-Wienhoven41) pointed out a close relationship between endogenous ileal N and NDF flow to the small intestine. It has been suggested that dietary fibre increased excretion of endogenous N resulting from increased mucosal cell turnover when high-fibre diets were fed to rats(Reference Sandaradura, Bender and Grahan42). Besides, a negative relationship exists between urea recycling to the intestine and NI(Reference Marini, Klein and Sands43, Reference Marini and Van Amburgh44). In the present analysis, intakes of DM and digestible OM were similar among FL-0, FL-L and FL-H diets. The concentration of rumen ammonia might be greater in FL-H than in FL-0 (evidenced from relationships between dietary variables and ammonia concentration in the rumen), and dietary NDF was lower in FL-H compared to FL-0 and FL-L. Both these conditions reduce MFN in faeces. Therefore, it seems reasonable that the increased loss of MFN in FL-H compared to FL-0 is attributed to the presence of high levels of tannins in FL-H, which contained an average FL of 470 g/kg diet. It has been reported that, sometimes, consumption of tannins causes a greater total N excretion than the total amount of N ingested(Reference Singleton45). While it is plausible that this extra N was not contributed from N recycling as discussed earlier, whether this N was contributed from an increased cellular turnover or from an increase in digestive secretions is not known. For instance, an increased excretion of mucoprotein, sialic acid and glucosamine in the faeces was noted in rats due to feeding of tannic acid(Reference Mitjavila, Lacombe and Carrera46). Leguminous diets, which contained appreciable amounts of polyphenols, had been shown to increase the rate of mucosal cell turnover in rats(Reference Sandaradura, Bender and Grahan42).
The EUN was greater in FL-H compared with FL-0 and FL-L probably because urea N recycling to the intestine decreased with greater NI in FL-H. It is also possible that tannins might decrease the entry rate of urea through the digestive tract. In conventional diets, EUN follows an opposite behaviour of MFN(Reference Giraldez, Valdes and Pelaez37), which might be attributable to urea recycling to the large intestine being enhanced by increasing hindgut fermentation with increasing NI(Reference Marini, Klein and Sands43, Reference Sunny, Owens and Baldwin47) and increased concentrations of ammonia in the rumen(Reference Kennedy and Milligan38). The metabolisable protein requirement of sheep estimated from total basal N excretion i.e. MFN+EUN(48)was 1·83 and 2·57 g/kg BW0·75 for FL-0 and FL-H diets, respectively, which indicates that protein requirement might increase in sheep-fed foliage-based diets.
The true N digestibility value was lower in FL-0 than the values (about 880 g/kg) reported for conventional feeds(Reference Van Soest20), which was likely due to high content of NDF-N in low-quality roughages used in the present study. It is noteworthy to mention that a wide range of true digestibility of N is found in the literature ranging from 760(Reference Kohn, Dinneen and Russek-Cohen12) to 950 g/kg(Reference Holter and Reid49). However, the true N digestibility decreased in FL-H compared to FL-0, which might be attributed to (1) the binding of protein with tannins present in foliages and thus excreted in faeces as NDF-N(Reference Woodward and Reed4, Reference Reed, Soller and Woodward5); (2) availability of free tannins, which may bind to the gut epithelium(Reference Barry and Duncan50) and then reduce amino acid absorption(Reference Wang, Waghorn and Barry51); and (3) the presence of high content of NDF-N in foliages, which generally have low digestibility(Reference Hindrichsen, Osiji and Odenyo52). The high coefficient of determination (R 2 0·97) for the regression analysis indicates that N in FL-0 behaved as nutritionally uniform fraction in the digestive tract of sheep(Reference Van Soest20). However, the coefficient of determination decreased in FL-L (R 2 0·94) and FL-H (R 2 0·91), which indicates that N behaved as nutritionally non-uniform fraction and was possibly affected by tannins present in foliage-based diets(Reference Reed, Soller and Woodward5, Reference Van Soest20).
Conclusions
The present study demonstrates that N excretion by sheep-offered diets containing tree foliages can be strongly predicted from NI alone. Addition of other dietary variables as supporting predictors slightly increases predictability of N excretion. In general, the monomolecular or exponential mixed models were the best for the prediction of N excretion compared with the linear and Gompertz mixed models; whereas Gompertz model was the best at predicting N retention using NI as a predictor in sheep. The excretion of FN and UN (% of NI) was not affected by FL in whole database. However, FN (% of NI) increased quadratically, and UN output (% of NI) decreased linearly with increasing FL when dietary N concentrations were greater than 15 g/kg DM. This signifies that inclusion foliages in the diets containing over 15 g/kg N may shift N excretion from urine to faeces probably because of the presence of tannins in foliages, and suggests a dietary manipulation strategy to reduce ammonia emission in the environment. Furthermore, FN and UN (% of NI) decreases, whereas efficiency of N retention increases with increasing digestible OM intake. Thus, dietary manipulation by increasing digestible OM intake by sheep may result in reduced N excretion in the environment. The increased excretion of basal N in high-foliage-based diets indicates that protein requirement may increase in ruminants-fed foliages.
Acknowledgements
The present research received no specific grant from any funding agency in the public, commercial or not-for-profit sectors, and the author trusts that there is no conflict of interest that could be perceived to bias the present work.
The author would like to thank an anonymous referee and an associate editor for their valuable comments, which helped to improve this paper.


