







1. Introduction
A pycnocline is a layer of fluid whose density changes rapidly with depth and so does the stratification described by the buoyancy frequency ( $N$), where $N^2 = - (g/\rho _0) \partial \rho /\partial z$ (here, g is the acceleration due to gravity, $\rho_0$ is the constant reference density, and $\partial \rho / \partial z $ is the background density gradient in the vertical coordinate). Such layers in the ocean or atmosphere affect environmental turbulence and waves, the transport of tracers (nutrients, pollutants, etc.) and the interaction of the environment with engineered structures. The upper-ocean pycnocline is flanked by a mixed layer on the top and a deeper layer at the bottom. The mixed layer and the deep layer can also be stratified but their stratification levels are typically lower than that in the pycnocline. Since much of our knowledge of turbulence in stratified wakes is derived from canonical wakes in uniform stratification, it is useful to study the wake of a canonical body inside and near a pycnocline where the change in stratification is rapid and nonlinear.
Most of the past work on the flow features of bodies moving through a pycnocline has involved the internal wave structure. Robey (Reference Robey1997) studied internal waves generated by a sphere moving below a pycnocline using experimental and numerical techniques for a wide range of body based Reynolds numbers (Re) and Froude numbers (Fr). Nicolaou, Garman & Stevenson (Reference Nicolaou, Garman and Stevenson1995) experimentally studied the waves of an accelerating sphere in a thermocline (a pycnocline where density gradients are a result of temperature gradients).
The phase configuration for two-dimensional trapped internal waves was theoretically and experimentally studied by Stevenson, Kanellopulos & Constantinides (Reference Stevenson, Kanellopulos and Constantinides1986) for a cylinder moving in a thermocline generated using salt brine. Often, these experimental observations of wave patterns are compared with the theoretical results of earlier studies, e.g. Barber (Reference Barber1993) and Keller & Munk (Reference Keller and Munk1970), where analytical results involving the dispersion relation of internal waves and their modal wave forms for nonlinear stratification profiles are provided.
A hyperbolic tangent profile bridging two regions with different values of  $N$ has been often used to model nonlinear density variation within and density jump across a pycnocline. Ermanyuk & Gavrilov (Reference Ermanyuk and Gavrilov2002, Reference Ermanyuk and Gavrilov2003) used a hyperbolic tangent profile to study forces on an oscillating cylinder and sphere, while Grisouard, Staquet & Gerkema (Reference Grisouard, Staquet and Gerkema2011) used a hyperbolic tangent profile with a constant bottom $N$ to study internal solitary waves in a pycnocline using direct numerical simulation. A hyperbolic profile of $N$ has been used for studying a weakly stratified shear layer adjacent to a uniformly stratified region (Pham, Sarkar & Brucker Reference Pham, Sarkar and Brucker2009) as well as an asymmetrically stratified jet (Pham & Sarkar Reference Pham and Sarkar2010).
There have been numerous studies on the evolution of turbulent wakes under stratification. An early study of Froude number  $O(10\unicode{x2013}1000)$ wakes by Lin & Pao (Reference Lin and Pao1979) showed that stratification starts to affect the wake at a buoyancy time scale ( $Nt$) of $O(1)$ resulting in a non-axisymmetric evolution. The multistage wake decay was later characterized by Spedding (Reference Spedding1997) into three separate regimes, namely three-dimensional (3-D), non-equilibrium (NEQ), and quasi-two-dimensional (Q2-D) and quantitative turbulence measurements were obtained in this and following laboratory studies.
Temporal simulations have enabled longer simulations in terms of evolved time ( $T$) or streamwise distance ( $x$) using the transformation $T = x/U_{\infty }$, where $U_{\infty }$ is the free-stream velocity. Gourlay et al. (Reference Gourlay, Arendt, Fritts and Werne2001) found the appearance of pancake vortices in the Q2-D regime in their temporal direct numerical simulation (DNS) of a wake at ${\it Re} = 10^4$ and $Fr = 10$. Spedding (Reference Spedding2001), through laboratory measurements on horizontal and vertical centre planes, showed that vertical fluctuations in the stratified wake decay faster than the horizontal fluctuations, a result that was later used by Meunier, Diamessis & Spedding (Reference Meunier, Diamessis and Spedding2006) to predict the wake velocity, width and height of stratified momentum wakes far from the body. Brucker & Sarkar (Reference Brucker and Sarkar2010) performed a full turbulence analysis, including quantification of mean and turbulent kinetic energy balances, of the DNS of towed and self-propelled wakes and showed that this anisotropy is linked to the decreased turbulent production in the wake. The net result is a longer lifetime of the stratified wake, also verified later by Redford, Lund & Coleman (Reference Redford, Lund and Coleman2015) in their DNS of a weakly stratified turbulent wake. Redford et al. (Reference Redford, Lund and Coleman2015) also found that the horizontal nature of the wake in the Q2-D regime resulted in the dominance of the lateral Reynolds shear stress so that the decay of the mean wake velocity was faster (compared with the NEQ regime) and was accompanied by an increase in the turbulent kinetic energy. Other studies that use temporal wake models include Dommermuth et al. (Reference Dommermuth, Rottman, Innis and Novikov2002), Diamessis, Domaradzki & Hesthaven (Reference Diamessis, Domaradzki and Hesthaven2005), de Stadler & Sarkar (Reference de Stadler and Sarkar2012) and Abdilghanie & Diamessis (Reference Abdilghanie and Diamessis2013).
Temporal simulations have been shown to be sensitive to the choice of initial conditions (Redford, Castro & Coleman Reference Redford, Castro and Coleman2012). Besides, inclusion of vortex shedding at the body and lee wave generation presents a challenge to temporal models. In recent work on stratified wakes, these limitations have been overcome by body-inclusive simulations. Orr et al. (Reference Orr, Domaradzki, Spedding and Constantinescu2015) conducted a numerical study of a sphere wake at  ${\it Re} = 200$ and $1000$ where they identified vortex shedding and lee waves. Pal et al. (Reference Pal, Sarkar, Posa and Balaras2016) simulated the wake of a sphere at ${\it Re} = 3700$ using DNS and found that there is a resurgence of turbulent fluctuations below a critical $Fr$ instead of a monotone suppression. This observation was further examined by Chongsiripinyo, Pal & Sarkar (Reference Chongsiripinyo, Pal and Sarkar2017) who found that, despite the low $Fr$, vortex stretching was dominant in the near wake, resulting in small-scale 3-D turbulence. The decay of a disk wake at ${\it Re} = 5\times 10^4$ was examined by Chongsiripinyo & Sarkar (Reference Chongsiripinyo and Sarkar2020) who decomposed its evolution into three regimes based on buoyancy time scale and horizontal Froude number of the fluctuations (instead of the mean wake): weakly stratified, intermediately stratified and strongly stratified turbulence. Turbulence scales were also used to characterize wake transitions by Zhou & Diamessis (Reference Zhou and Diamessis2019). Ortiz-Tarin, Chongsiripinyo & Sarkar (Reference Ortiz-Tarin, Chongsiripinyo and Sarkar2019) performed large eddy simulation (LES) of flow past a prolate spheroid with laminar boundary layer separation into the near and intermediate wake and found that at $Fr \sim O(1)$, buoyancy effects are stronger for slender bodies as compared with bluff bodies. Nidhan et al. (Reference Nidhan, Chongsiripinyo, Schmidt and Sarkar2020) analysed the unstratified disk wake dataset of Chongsiripinyo & Sarkar (Reference Chongsiripinyo and Sarkar2020) using spectral proper orthogonal decomposition (POD) and showed that the vortex shedding mode, originating near the body, can persist for $O(100D)$ distance downstream. Recently, Ortiz-Tarin, Nidhan & Sarkar (Reference Ortiz-Tarin, Nidhan and Sarkar2021) found that the wake defect for a slender body wake at high Reynolds number deviates from that of bluff-body wakes.
Interaction of the turbulent wake with the stratified background leads to the generation of unsteady internal waves. Abdilghanie & Diamessis (Reference Abdilghanie and Diamessis2013) found that the NEQ regime is prolonged at high  ${\it Re} $, resulting in internal wave radiation that persists up to $Nt \approx 100$. Brucker & Sarkar (Reference Brucker and Sarkar2010) showed that internal wave flux dominates the turbulent dissipation during $20 < Nt < 75$ for a wake at ${\it Re} = 5\times 10^4$ and $Fr = 4$. In contrast, Redford et al. (Reference Redford, Lund and Coleman2015) showed that, for very high Fr, the internal wave activity, although still more pronounced at the start of the NEQ regime, makes a negligible contribution to the turbulent energy budget. Rowe, Diamessis & Zhou (Reference Rowe, Diamessis and Zhou2020) characterized the angles for the strongest internal waves and found that, after $Nt = 10$, internal wave radiation is an important sink for wake kinetic energy. Nidhan, Schmidt & Sarkar (Reference Nidhan, Schmidt and Sarkar2022) used spectral proper orthogonal decomposition and connected the leading wake eigenmodes to the wave field. Besides numerical techniques, many experimental (Gilreath & Brandt Reference Gilreath and Brandt1985; Hopfinger et al. Reference Hopfinger, Flor, Chomaz and Bonneton1991; Chomaz, Bonneton & Hopfinger Reference Chomaz, Bonneton and Hopfinger1993; Bonneton, Chomaz & Hopfinger Reference Bonneton, Chomaz and Hopfinger1993; Brandt & Rottier Reference Brandt and Rottier2015; Meunier et al. Reference Meunier, Le Dizès, Redekopp and Spedding2018) as well as theoretical (Sturova Reference Sturova1974; Voisin Reference Voisin1991, Reference Voisin1994, Reference Voisin2003, Reference Voisin2007) studies have been done to analyse the internal wave field in a stratified flow.
Study of the wake in the vicinity of a pycnocline with a characterization of turbulence and its interaction with trapped internal waves is limited. Pham & Sarkar (Reference Pham and Sarkar2010) studied the interaction between internal waves from a shear layer and an adjacent stratified jet, and classified waves that are trapped/reflected by the jet and waves that transmit through the jet. Sutherland & Yewchuk (Reference Sutherland and Yewchuk2004) and Sutherland (Reference Sutherland2016) calculated analytical expressions for internal wave transmission through density staircases for a stationary, 2-D Boussinesq fluid. Voropayeva & Chernykh (Reference Voropayeva and Chernykh1997) simulated a temporally evolving wake in a nonlinear stratification using a Reynolds-averaged turbulence model. To the best of the authors’ knowledge, the present study is the first body-inclusive wake LES for a nonlinearly stratified fluid. We aim to assess the effect of nonlinear stratification on wake turbulence, its interaction with trapped waves as well as characterize the far-field lee waves. The disk is chosen as a canonical generator of a bluff-body wake to avoid the computational expense incurred in resolving the boundary layer that develops on a long body.
Section 2 describes the numerical set-up and the simulation parameters. The results are divided into two sections. The basic differences between linear and nonlinear stratification when the disk is centred in the pycnocline layer are studied in § 3. The effect of relative shift between the density profile and the disk, so that the disk is partially/completely outside the pycnocline layer, is discussed in § 4. We summarize and conclude the study in § 5.
2. Methodology
2.1. Governing equations and numerical scheme
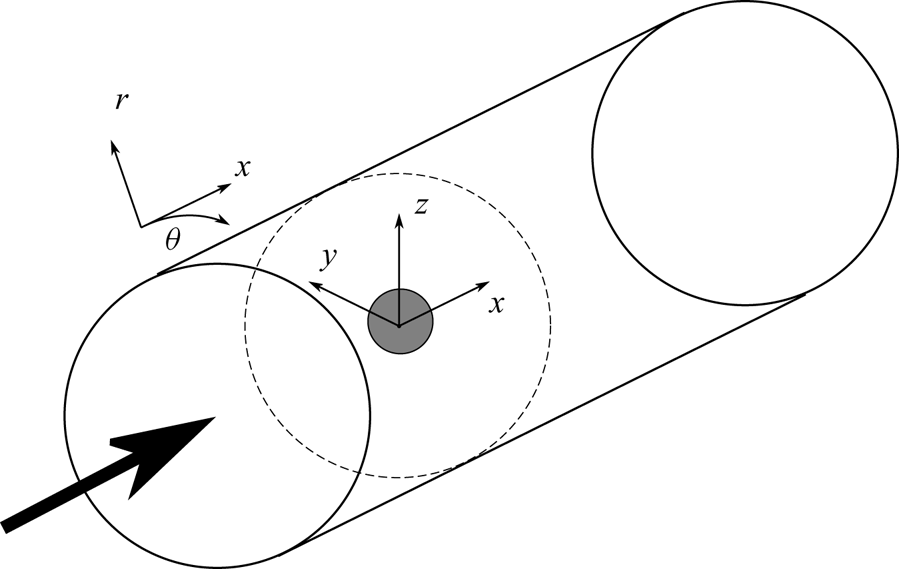
The wake of a disk is simulated by solving the 3-D incompressible unsteady form of the conservation equations for mass, momentum and density. A high-resolution LES with the Boussinesq approximation for density effects is used. The disk, with diameter  $D$ and thickness $0.01D$, is immersed perpendicular to a flow with velocity $U_{\infty }$. The equations are numerically solved in cylindrical coordinates but both Cartesian $(x,y,z)$ and cylindrical $(r,\theta,x)$ coordinates are appropriately used in the discussion. Here, $x$ is streamwise, $y$ is spanwise and positive along $\theta =0^{\circ }$ and $z$ is vertical and positive along $\theta =90^{\circ }$ (figure 1). The density field $(\rho (\boldsymbol {x},t))$ is split into a constant reference density $(\rho _{0})$, the variation of the background $(\Delta \rho _{b}(z))$, and the flow induced deviation, $(\rho _{d}(\boldsymbol {x},t))$ so that $\rho (\boldsymbol {x},t)=\rho _{0}+\Delta \rho _{b}(z)+\rho _{d}(\boldsymbol {x},t)$. The Reynolds number of the flow, defined as ${\it Re} = U_{\infty } D/\nu$ (where $\nu$ is the kinematic viscosity) is $5000$. Since the stratification is non-uniform, the Froude number defined by $Fr (z) = U_{\infty }/N(z) D$ is variable and its case-dependent behaviour is described in § 2.2. The minimum value of the Froude number ( $Fr_{min}$) is set to $1$ for all the cases.
Schematic showing the simulation set-up and domain.
The filtered non-dimensional equations are as follows:
 \begin{gather} \frac{\partial u_{i}}{\partial x_{i}} = 0, \end{gather}
 \begin{gather} \frac{\partial u_{i}}{\partial t} + u_{j}\frac{\partial u_{i}}{\partial x_{j}} ={-}\frac{\partial p}{\partial x_{i}} + \frac{1}{{\it Re} } \frac{\partial}{\partial x_{j}}\left[\left(1 + \frac{\nu_{sgs}}{\nu}\right) \frac{\partial u_{i}}{\partial x_{j}}\right] - \frac{\rho_{d}}{Fr_{min}^{2}} \delta_{i3}, \end{gather}
 \begin{gather} \frac{\partial \rho}{\partial t} + u_{j}\frac{\partial \rho}{\partial x_{j}} = \frac{1}{{\it Re} Pr} \frac{\partial}{\partial x_{j}}\left[\left(1 + \frac{\kappa_{sgs}}{\kappa}\right)\frac{\partial \rho}{\partial x_{j}}\right], \end{gather}
where  $u_{i}$ refers to the filtered velocities in the $x$,
$x$,  $y$ and $z$ directions for $i = 1, 2$ and $3$, respectively, $\nu _{sgs}$ and $\nu$ in (2.2) are the subgrid-scale kinematic viscosity and the kinematic viscosity, respectively, while $\kappa _{sgs}$ and $\kappa$ in (2.3) are the subgrid-scale diffusion coefficient and the diffusion coefficient, respectively. The Prandtl number defined by $Pr=\nu / \kappa$ is set to one. No major qualitative influence of $Pr$ was found in the wake study by de Stadler, Sarkar & Brucker (Reference de Stadler, Sarkar and Brucker2010) who varied $Pr$ between 0.2 and 7. The dynamic eddy viscosity model (Germano et al. Reference Germano, Piomelli, Moin and Cabot1991) is employed to obtain $\nu _{sgs}$, following the implementation of Chongsiripinyo & Sarkar (Reference Chongsiripinyo and Sarkar2020), and the subgrid Prandtl number is also set to unity to obtain $\kappa _{sgs}$. The eddy viscosity model calculates the values of eddy viscosity in the vicinity of the solid boundary by following a similar procedure as used for the velocity field, i.e. by enforcing Dirichlet boundary conditions on virtual points on the solid boundary and then using a linear reconstruction scheme to modify the value at the forcing points near the solid boundary (Balaras Reference Balaras2004). The parameters used for non-dimensionalization are as follows: free-stream velocity ( $U_{\infty }$) for velocity, disk diameter ( $D$) for length, advection time ( $D/U_{\infty }$) for time, dynamic pressure ( $\rho U_{\infty }^{2}$) for pressure and characteristic change in background density ( $-D (\partial \Delta \rho _{b} / \partial z) |_{max}$) for the flow induced density deviation.
The periodicity in the azimuthal direction is leveraged in solving the discretized pressure Poisson equation in the predictor step, reducing it to a pentadiagonal system of linear equations, which is then solved using a direct solver (Rossi & Toivanen Reference Rossi and Toivanen1999). The disk is represented by the immersed body method of Balaras (Reference Balaras2004) and Yang & Balaras (Reference Yang and Balaras2006). At the inlet boundary, a uniform stream of velocity ( $U_{\infty }$) is imposed while an Orlanski-type convective boundary condition is used for the outflow (Orlanski Reference Orlanski1976). A Neumann boundary condition is imposed at the radial boundary of the domain for density as well as the three velocity components. To prevent spurious reflection of waves back into the domain, sponge layers are used at the inlet (streamwise length $10D$), outlet (streamwise length $10D$) and the cylindrical walls (radial length $15D$) of the domain to gradually relax the velocities and the density to their respective background values at the boundaries.
2.2. Density profiles
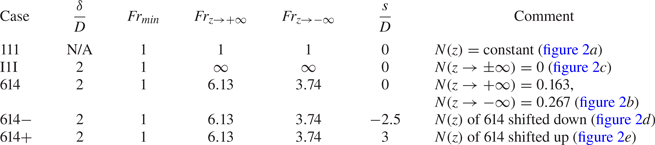
The profiles chosen for the variation of background density in the five cases are shown in figure 2. Except for the benchmark 111 case, the profiles have non-uniform  $N(z)$ and $Fr(z) = U/N(z)D$. Profile 111 with linear stratification has a constant $Fr (z)$, which is the conventional body-based Froude number of $Fr = U_{\infty }/ND = 1$. The maximum value of the density gradient is the same for all four nonlinear profiles and corresponds to $Fr_{min} =1$. In profile 614 (figure 2b), a hyperbolic tangent function is used to bridge two linearly stratified regions (6 and 4 represent the value, rounded to an integer, of the local $Fr$ in the linearly stratified regions). Profile I1I (I standing for ‘Infinity’) is a complete hyperbolic tangent profile between two constant-density regions, therefore having infinite Froude number far above and below the body.
Variation of background density for (a) 111, (b) 614, (c) I1I, (d)  $614-$, (e) $614+$, along with ( f) respective buoyancy frequency profiles. Solid black line at the centre of (a–e) represents the disk (not to scale). Profiles are summarized in table 1 and also discussed in text. For $614-$, the upper half of the disk is in a constant- $N$ region and the lower is in the pycnocline. For $614+$, the disk is in the bottom constant- $N$ region with its upper edge $0.5D$ below the pycnocline.
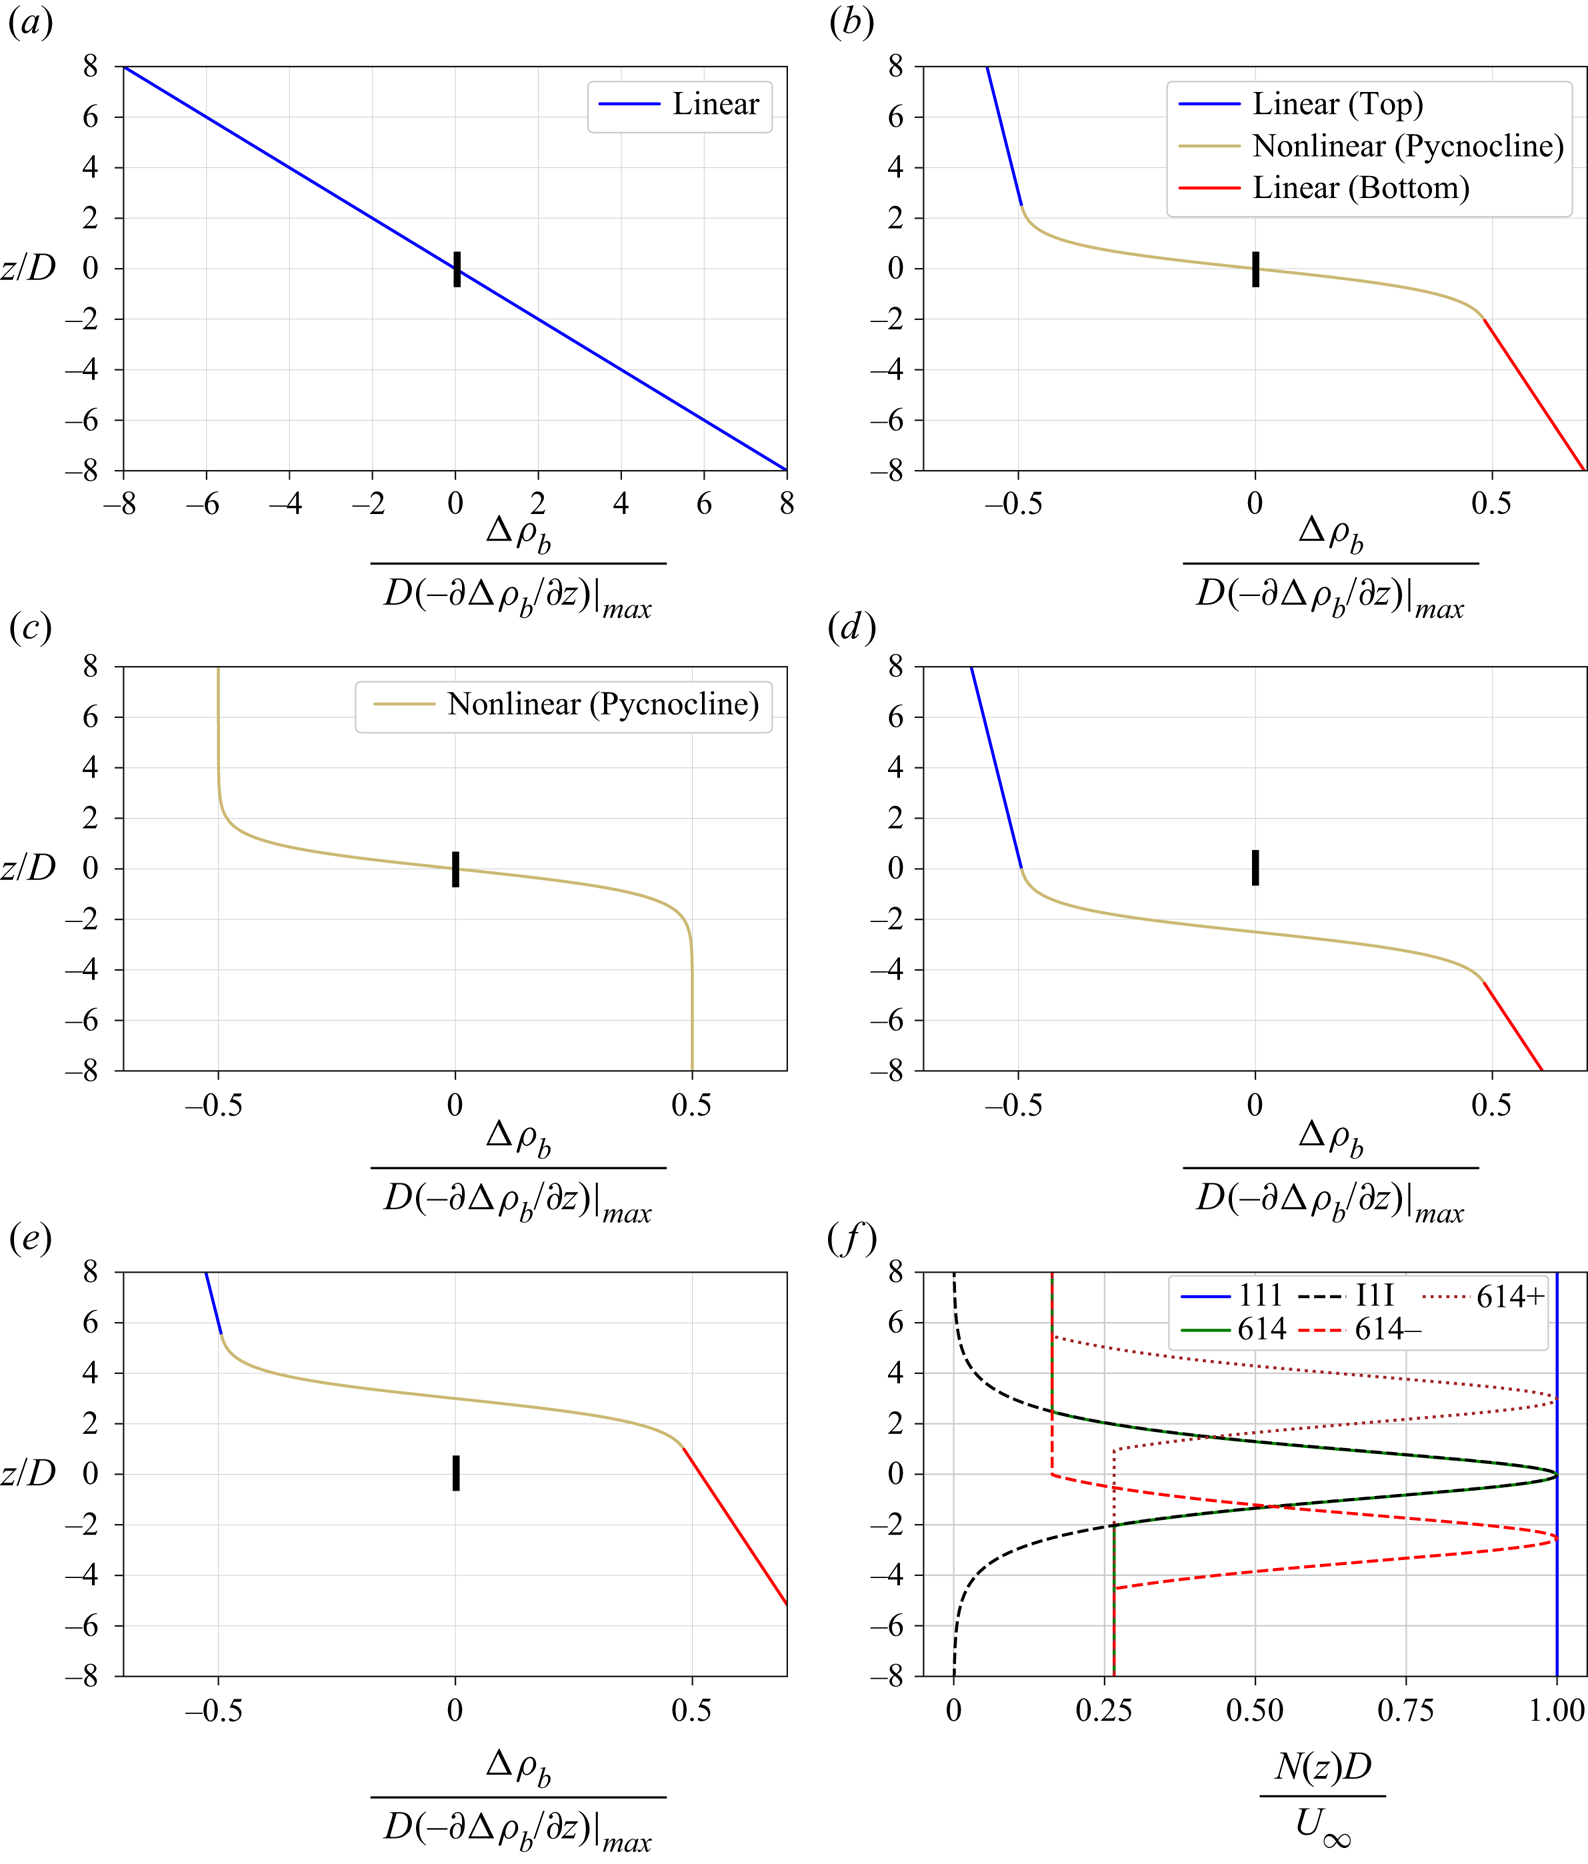
For the I1I and 614 profiles, the disk centre coincides with the centre of the density profile and, furthermore, the disk lies entirely within the nonlinearly stratified region. Profiles  $614-$ and $614+$ are obtained after shifting profile 614 (and not the disk) vertically by $-2.5D$ and $3D$, respectively. The disk centre is located at $z = 0$ for all five profiles and the negative and positive signs in the names $614-$ and $614+$ indicate whether the profile is shifted downwards or upwards, respectively. The vertical shift in $614-$ (figure 2d) is chosen so that the upper half of the disk lies in the linearly stratified region with $Fr = 6$ and the lower half in the pycnocline. The vertical shift in $614+$ (figure 2e) is chosen so that the disk lies entirely in the linearly stratified region with $Fr = 4$ while being very close to the pycnocline, specifically, its upper edge is $0.5D$ below the pycnocline.
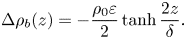
The profile I1I is given by the following function, which was also used by Ermanyuk & Gavrilov (Reference Ermanyuk and Gavrilov2002, Reference Ermanyuk and Gavrilov2003) and Nicolaou et al. (Reference Nicolaou, Garman and Stevenson1995) in their studies:
 \begin{equation} \Delta \rho_{b}(z)={-}\frac{\rho_{0} \varepsilon}{2} \tanh{\frac{2z}{\delta}} . \end{equation}
 The central nonlinear region of the 614 profile is obtained from the I1I profile. The linearly stratified regions of profile 614 are added by matching the slopes at  $z=1.25\delta$ and $z=-\delta$ so that the density profile is continuously differentiable in $z$. This results in Froude numbers of $6.13$ and $3.74$ above and below the pycnocline layer respectively, for profile 614.
The profiles  $614-$ and $614+$ are shifted with respect to 614 and their central nonlinear region is as follows:
 \begin{equation} \Delta \rho_{b}(z)={-}\frac{\rho_{0} \varepsilon}{2} \tanh{\frac{2(z - s)}{\delta}} , \end{equation}
where  $s$ denotes the shift and takes values $-2.5D$ and $3D$ for $614-$ and $614+$, respectively.
The local Froude number corresponding to this pycnocline region can be calculated using the local background buoyancy frequency
 \begin{equation} Fr(z) = \frac{U_{\infty}}{\sqrt{\varepsilon gD}} \sqrt{\frac{\delta}{D}} \left|\cosh{\frac{2(z-s)}{\delta}}\right| . \end{equation}
The minimum value of  $Fr(z)$ occurs at $z=s$. Thus, the minimum Froude number for profiles 614 and I1I is
 \begin{equation} Fr_{min} = Fr(z=s=0) = \frac{U_{\infty}}{\sqrt{\varepsilon gD}} \sqrt{\frac{\delta}{D}} . \end{equation}
 Equation (2.7) highlights two important non-dimensional parameters for a body moving through a pycnocline:  $U_{\infty }/\sqrt {\varepsilon gD}$, which is the conventional Froude number defined using reduced gravity $\varepsilon g$, and $\delta / D$, which is the non-dimensional thickness of the pycnocline. In the simulations, $U_{\infty }/\sqrt {\varepsilon gD} = 1/\sqrt {2}$ and $\delta / D = 2$ for profiles 614 and I1I to obtain $Fr_{min} = 1$. Note that for 111, which has constant linear stratification throughout, $Fr_{min}=1$ still holds. Parameters for each case are given in table 1.
Physical parameters of the simulated cases. For each case,  ${\it Re} = 5000$ and $Pr = 1$. The domain with $L_{r} = 60$, $L_{\theta } = 2{\rm \pi}$, $L_{x}^{-} = 30$ and $L_{x+} = 102$ is discretized using $N_{r} = 479$, $N_{\theta } = 128$ and $N_{x} = 2176$ points.
2.3. Domain and grid
The domain extends from  $x/D = -L_{x}^{-} = -30$ to $x/D = L_{x}^{+} =102$ in the streamwise direction and from $r/D = 0$ to $r/D = L_{r} =60$ in the radial direction. The number of grid points employed for discretizing the domain is $N_{x}=2176$, $N_{\theta }=128$ and $N_{r}=479$ in the streamwise, azimuthal and radial directions, respectively, resulting in approximately $130$ million grid points. The disk is resolved into 47 312 triangles. The LES grid is non-uniform in the streamwise and radial directions and is designed to have high resolution. In terms of the Kolmogorov length ( $\eta =(\nu ^{3} / \epsilon _{k}^{T})^{1/4}$), the maximum value of $\Delta x / \eta$ is $4.39$ and that of $\Delta r / \eta$ is $5.03$. Also, the turbulent dissipation rate used for the calculation of $\eta$ includes the resolved-scale dissipation ( $\epsilon = 2\nu \langle s_{ij}' s_{ij}' \rangle$) as well as the subgrid-scale dissipation ( $\epsilon _{sgs} = - \langle \tau _{sgs_{ij}}' s_{ij}' \rangle$ with $\tau _{sgs_{ij}}= -2 \nu _{sgs} S_{ij}$), where $s_{ij}'$ and $S_{ij}$ are the fluctuating and mean strain rates, respectively. See § 2.4 for averaging details. Most of the turbulent dissipation resides in the resolved scales.
2.4. Statistics
Each of the simulations is approximately  $260$ non-dimensional time units ( $D / U_{\infty }$) long, which is approximately $2.5$ flow throughs. Statistics are collected after the initial transience has subsided and statistical steady state is reached (which takes approximately 120 non-dimensional time units). Averaging is done over a total of $140$ non-dimensional time units after statistical steady state is reached. For any dependent variable in the simulation, $\langle {\cdot } \rangle$ is used to represent the time average and $'$ is used to represent the fluctuation about that average, over the multiple ensembles collected during the statistical steady state.
3. Linear vs nonlinear stratification
3.1. Steady lee waves
Disturbances in stratified environments generate internal waves. These can be steady lee waves generated by the body or unsteady internal waves generated by turbulence in the wake of body. In this section, the characteristics of the body generated lee waves on the vertical centre plane for 111 and 614 will be analysed using linear asymptotic theory. Note that since I1I is essentially unstratified away from the pycnocline layer, it does not show any lee waves.
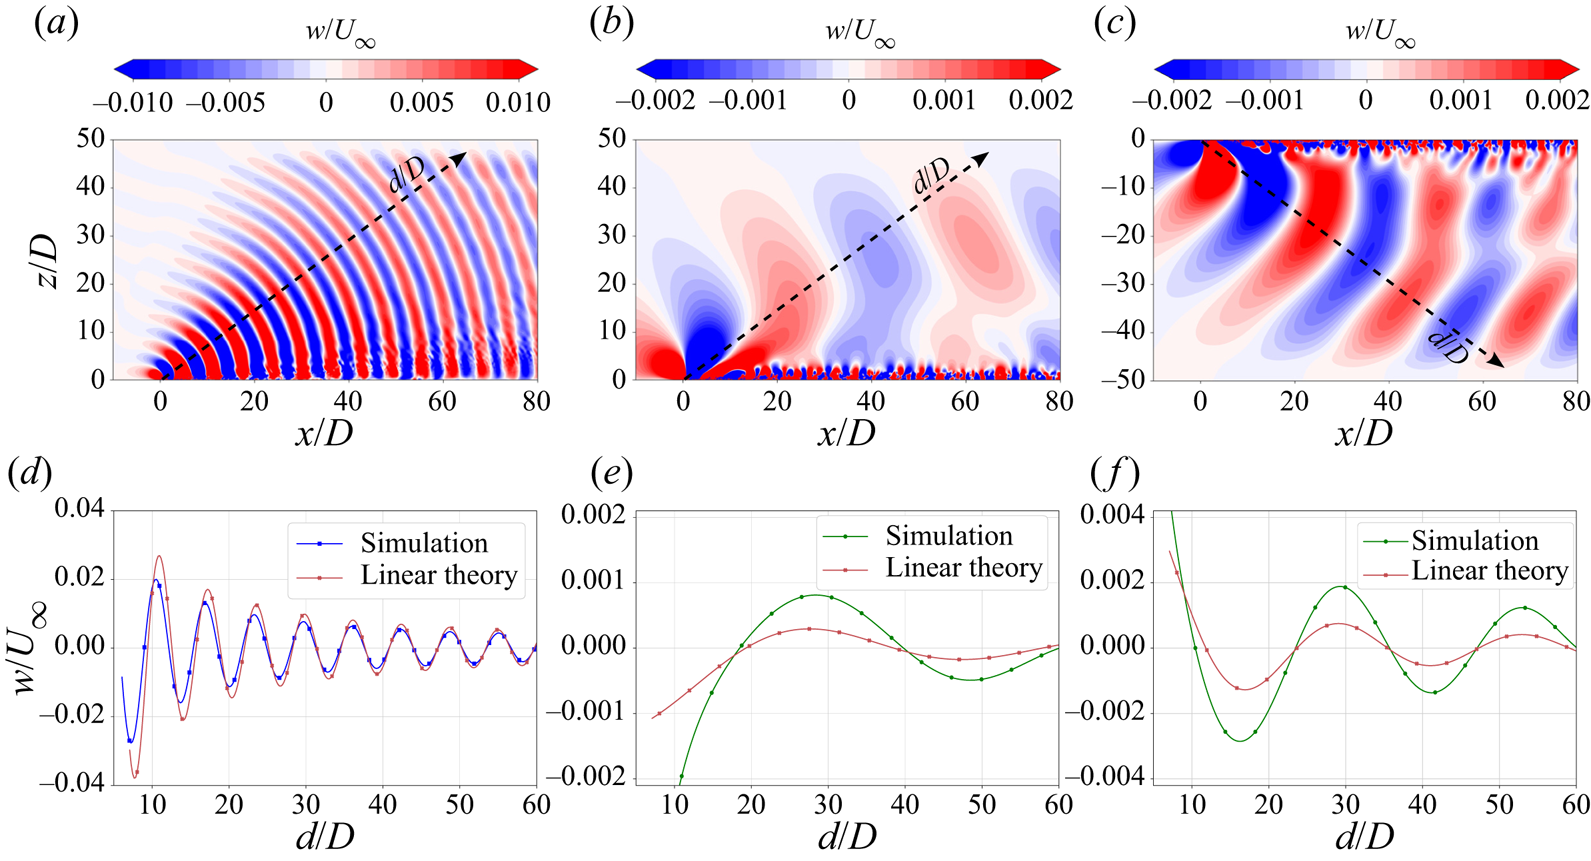
Instantaneous contours of vertical velocity ( $w$) for 111 (top half) and 614 (top and bottom halves) on a vertical plane passing through the centreline are plotted in figure 3(a–c). The amplitude of steady lee waves decays moving away from the body. The lee waves observed in 111 are symmetric with respect to $z =0$ while 614 has two different sets of lee waves (top and bottom) owing to the two different local values of $Fr(z)$ ( $6.13$ above and $3.74$ below) in the linearly stratified regions above and below the pycnocline layer. The waves in the 614 case have a much smaller amplitude than in the 111 case and a larger wavelength. (Note that we use $w$ instead of $\langle w \rangle$ to visualize the steady lee waves to give a complete picture of the flow field. Unsteady internal waves, that are discussed in § 4.3 can be seen in figure 3(a–c) as distortions in the wave field near the wake that grow as $x/D$ increases.)
Instantaneous vertical velocity at  $T = 200 D/U_{\infty }$ showing internal waves (a–c) and their amplitudes (d–f) along the dashed arrow labelled by $d/D$. (a,d) – 111 ( $90^{\circ }$ plane); (b,e) – 614 ( $90^{\circ }$ plane); (c, f) – 614 ( $270^{\circ }$ plane). The instantaneous velocity contains both the steady lee wave, which is dominant in the far field, and the unsteady wake generated waves.
Linear theory, given by Voisin (Reference Voisin1991, Reference Voisin2003, Reference Voisin2007) is used to analytically predict the wavelength and amplitude of the lee waves. The theory computes a wave function,  $\chi$ from a linearized set of inviscid equations involving a source term $q$ on the right-hand side of the continuity equation to model the moving body using a Green's function approach for large times ( $Nt\gg 1$), which in our case translates to $x/D \gg Fr$. Once $\chi$ is known, $w$ is calculated. The expression for $w$ for the case of a Rankine ovoid as derived by Ortiz-Tarin et al. (Reference Ortiz-Tarin, Chongsiripinyo and Sarkar2019) and employed for a $4:1$ spheroid wake can be reduced to give the wave pattern on the vertical centreline plane as
 \begin{equation} w(x,y=0,z) \sim{-}\frac{mN}{{\rm \pi} U_{\infty} r_{xz}} \cos{\psi} \sin{\left(\frac{Na}{U_{\infty}} \cos{\psi}\right)} \sin{\left(\frac{N}{U_{\infty}} r_{xz}\right)} , \end{equation}
where  $r_{xz}=\sqrt {x^{2}+z^{2}}$ and $\psi = \arctan (z/x)$. Also, $m$ and $a$ are calculated from the potential flow stagnation point solution for a Rankine ovoid of length $L_{ro}$ and cross-sectional diameter $D_{ro}$
 \begin{equation} (L_{ro}^2 - 4a^2 )^2 = \left( \frac{8ma}{{\rm \pi} U_{\infty}} \right) L_{ro}, \quad D_{ro}^2 = \left( \frac{8ma}{{\rm \pi} U_{\infty}} \right) \frac{1}{\sqrt{4a^2 + D_{ro}^2}}. \end{equation}
Note that Ortiz-Tarin et al. (Reference Ortiz-Tarin, Chongsiripinyo and Sarkar2019) calculated  $m$ and $a$ using the potential flow solution of a Rankine oval, which is a 2-D solution. Equation (3.2a,b) is based on the solution for a Rankine ovoid (which is three-dimensional), and serves as a correction to Ortiz-Tarin et al. (Reference Ortiz-Tarin, Chongsiripinyo and Sarkar2019). Note that, as per (3.1), the wave amplitude decreases with decreasing $N$ or increasing $Fr$.
$Fr$.
The Rankine ovoid was chosen since it is close to the observed shape of the disk plus separation bubble and it has a simple potential flow solution – a 3-D source and a 3-D sink – needed for the linear theory of wave generation. The ovoid dimensions are based on the observed dimensions of the separation bubble. To apply linear theory to a bluff body such as a disk, the separation bubble created by the disk should also be included as a part of the extended body involved in wave generation. The complete extended body for 111, I1I and 614 cases resembles an ovoid with  $L_{ro} \approx 2.5D$ and $D_{ro} \approx 1.5D$. It should be noted that the exact body shape is insignificant as far as the wavelength of the waves is considered, but the wave amplitude depends on the body shape.
Figure 3(d) compares the wave amplitude between simulation and the theoretical estimate of (3.1). The comparison is along the dashed line with an arrow in figure 3(a), which is at an angle of  $45^{\circ }$ to the $x$-axis. The theory, when used with the Rankine ovoid approximation for the disk and the separated flow behind it, is able to accurately capture the amplitude variation specially moving away from the body for the 111 case which has linear stratification with constant $N$.
$N$.
A similar analysis is performed for the lee waves of 614 after taking the Froude number in the analysis to be that of the linearly stratified region, i.e.  $Fr = 6.13$ for figure 3(e) and $Fr = 3.74$ for figure 3( f). This procedure results in the correct prediction of the wavelength of the propagating lee waves. Theory is able to capture the order of magnitude of the significantly reduced (relative to 111) wave amplitude but the theoretical estimate of the wave amplitude is an under-prediction. The disk moves through a local stratification corresponding to $Fr = 1$ but the lee waves form and propagate in the linearly stratified regions where the Froude number is larger ( $Fr = 6.13$ and $Fr = 3.74$). Therefore, the true wave amplitude corresponds to $Fr$ somewhat lower than that used in the theory and, thus, larger than the theoretical estimate. Since the wavelength is comparable to the variability scale of $N(z)$, Wentzel–Kramers–Brillouin (WKB) theory cannot be used and we do not proceed further with linear analysis.
3.2. Mean defect velocity
All cases show a strong effect of buoyancy on the wake since  $Fr = 1$ at the disk is common to them but there are differences among the cases as elaborated below. Figure 4(a) shows the mean centreline defect velocity for the three cases plotted against the streamwise distance. The 111 case shows strong oscillatory modulation of the wake and its defect velocity, similar to the sphere wake (Pal et al. Reference Pal, Sarkar, Posa and Balaras2017). In contrast to 111, the modulation in 614 and I1I, although present, is small. The wavelength of modulation for 111 is $2 {\rm \pi}D Fr$ as in the linear theory result (3.1), and as noted in previous work.
(a) Mean defect velocity at centreline. (b) Mean streamwise velocity contours on vertical plane passing through centreline. Dashed yellow line represents the separation bubble ( $U=0$).
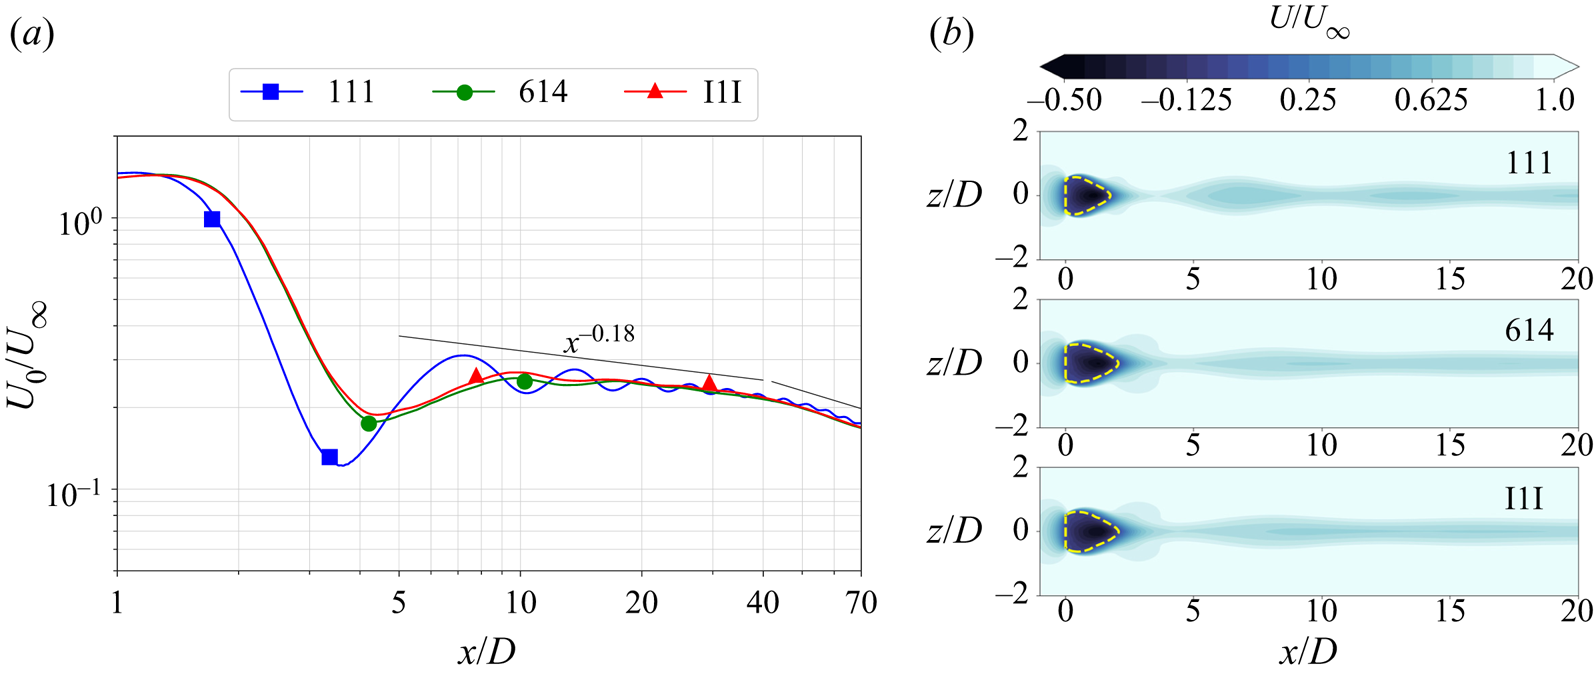
All cases show a similar decay law of  $U_0 \propto x^{-0.18}$ in the NEQ regime, which was also observed by Chongsiripinyo & Sarkar (Reference Chongsiripinyo and Sarkar2020) for a disk at a higher Reynolds number of $5 \times 10^{4}$. Around $x/D = 45 (Nt = 45)$, the decay law transitions to a faster decay rate, signalling the beginning of the Q2-D regime. A notable difference in the defect velocity profiles occurs at $x/D \sim 4$, where the initial dip in the profile for 111 is larger in magnitude and occurs earlier than that of 614 and I1I, owing to the stronger lee wave in 111 as compared with 614 and I1I. The mean velocity contours on a vertical streamwise cut (figure 4b) show that the lee wave modulation in the wake for 111 is stronger and its separation bubble is smaller, which is consistent with the earlier dip in the profile of defect velocity (figure 4a).
3.3. Turbulent kinetic energy
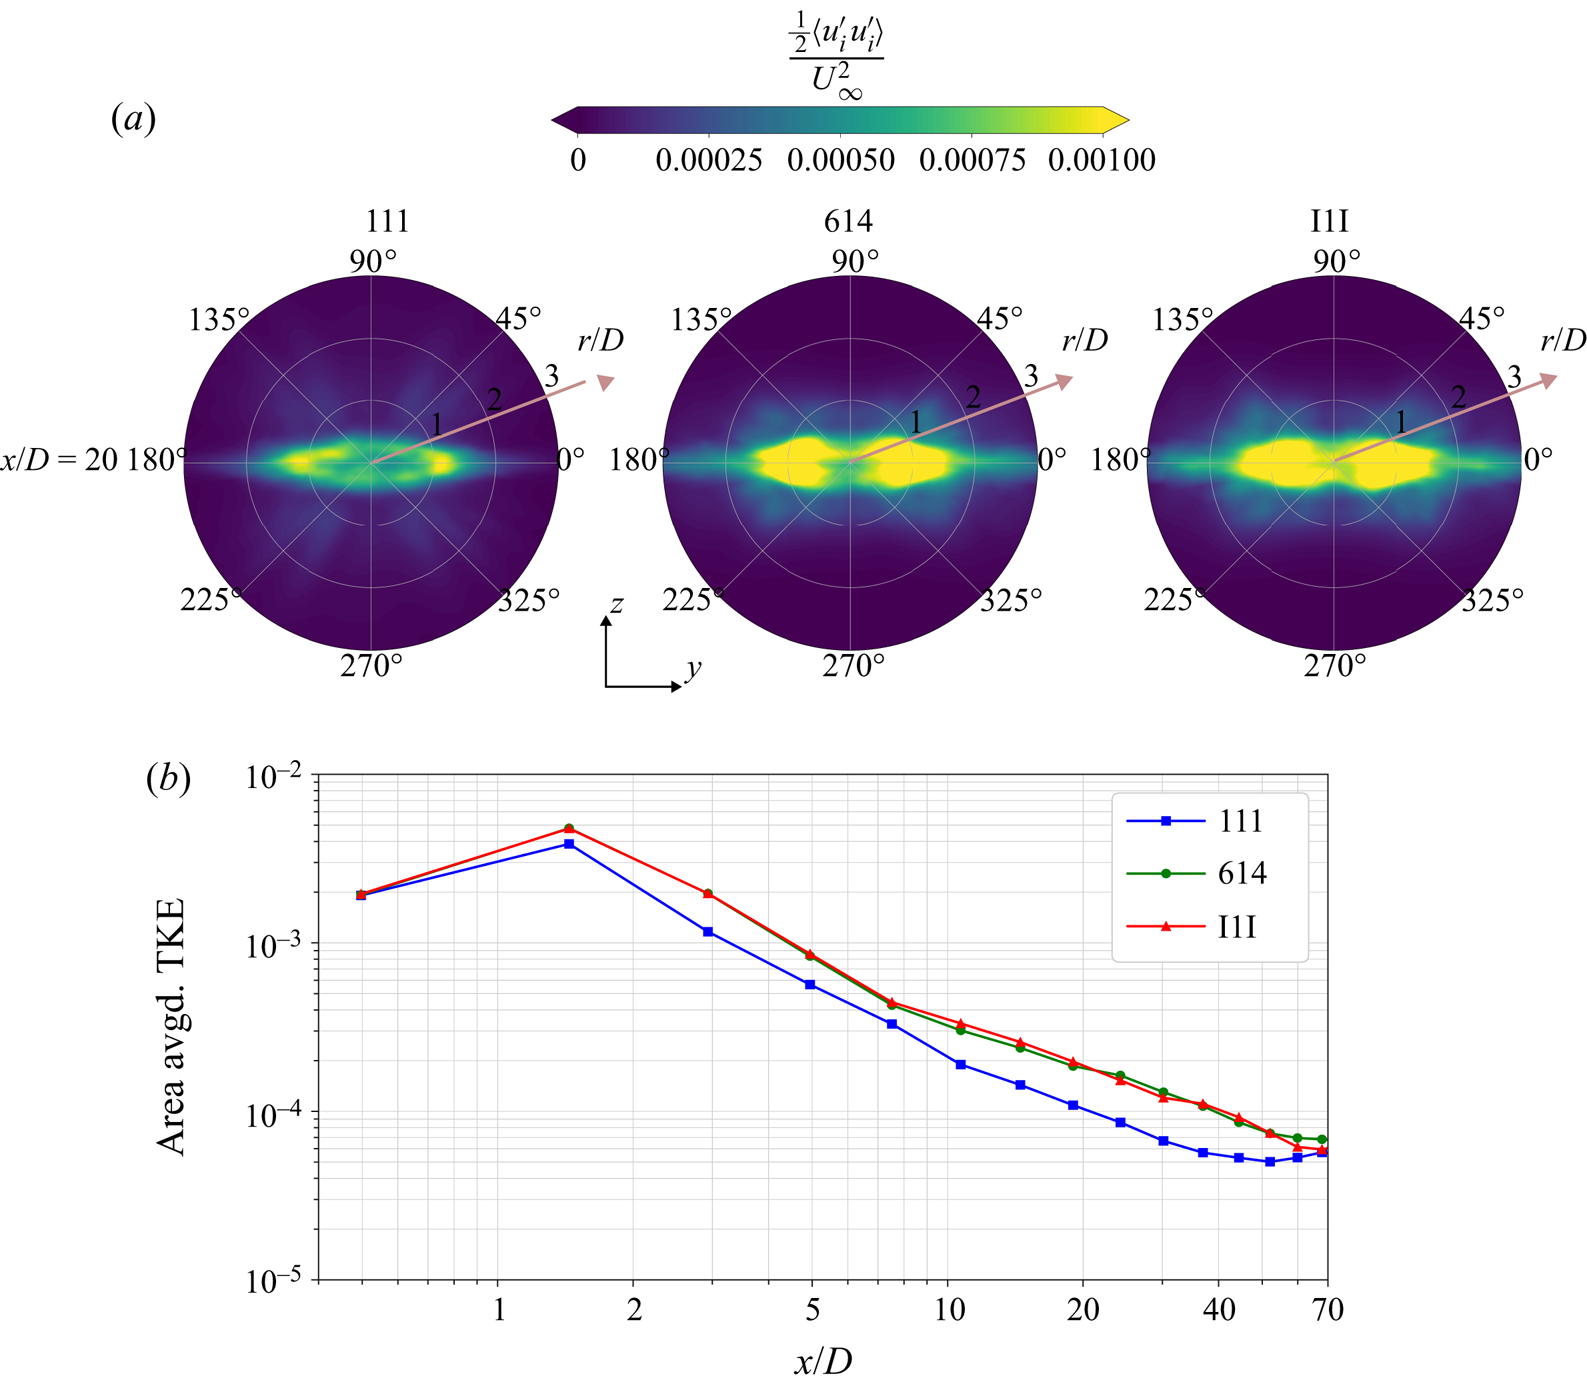
The nonlinearly stratified cases exhibit stronger levels of turbulent kinetic energy (TKE). This difference is illustrated by the contours of TKE at  $x/D = 20$ in figure 5(a), plotted for the three stratification profiles. The pycnocline cases have a higher TKE (by 50 %–100 %) relative to the 111 case over the entire wake length as shown by the area-averaged values of TKE plotted in figure 5(b). The area averaging at any streamwise location is done in the region covered by a circle of radius $3D$, therefore containing most of the turbulent zone. The TKE is substantially larger in I1I and 614 relative to 111, especially in the NEQ regime. For example, I1I has almost twice the TKE of 111 at $x/D = 45$. It is worth noting the slight increase in TKE for the case 111 at $x/D \approx 50$ which is where the decay law for the mean defect velocity changes (§ 3.2), again pointing towards the transition to Q2-D regime.
(a) The TKE contours at  $x/D = 20$. (b) Area-averaged values of TKE as a function of streamwise distance.
To explain the relatively high turbulence, we inspect the terms in the TKE budget, especially the lateral production (the production by vertical Reynolds shear stress is small) and the wave flux. Although the hyperbolic tangent profile is close to a linear profile near the centreline, the weaker stratification regions above and below are not as effective in suppressing near-wake turbulence stresses, which results in higher TKE production further downstream. Also, the weaker far-field stratification in 614 and I1I relative to 111 does not allow the full frequency range of waves generated in the  $Fr = 1$ central region to escape into the far field. The reduction of wave energy flux traps fluctuations in the wake and results in a TKE increase. The two quantities, lateral TKE production and wave flux, are diagnosed in the following subsections. Although both contribute, it is found that the increase in TKE production is somewhat larger than the decrease in wave flux.
3.3.1. The TKE production
Contours of lateral production  $P_{xy}$, which is the dominant component of TKE production for all three cases, are plotted in figure 6(a) at $x/D = 20$. The increased $P_{xy}$ in 614 and I1I is partly a result of the higher lateral Reynolds shear stress $\langle -u'v'\rangle$.
(a) Lateral production contours at  ${x}/{D} = 20$. (b) Area-averaged values of lateral production as a function of streamwise distance.
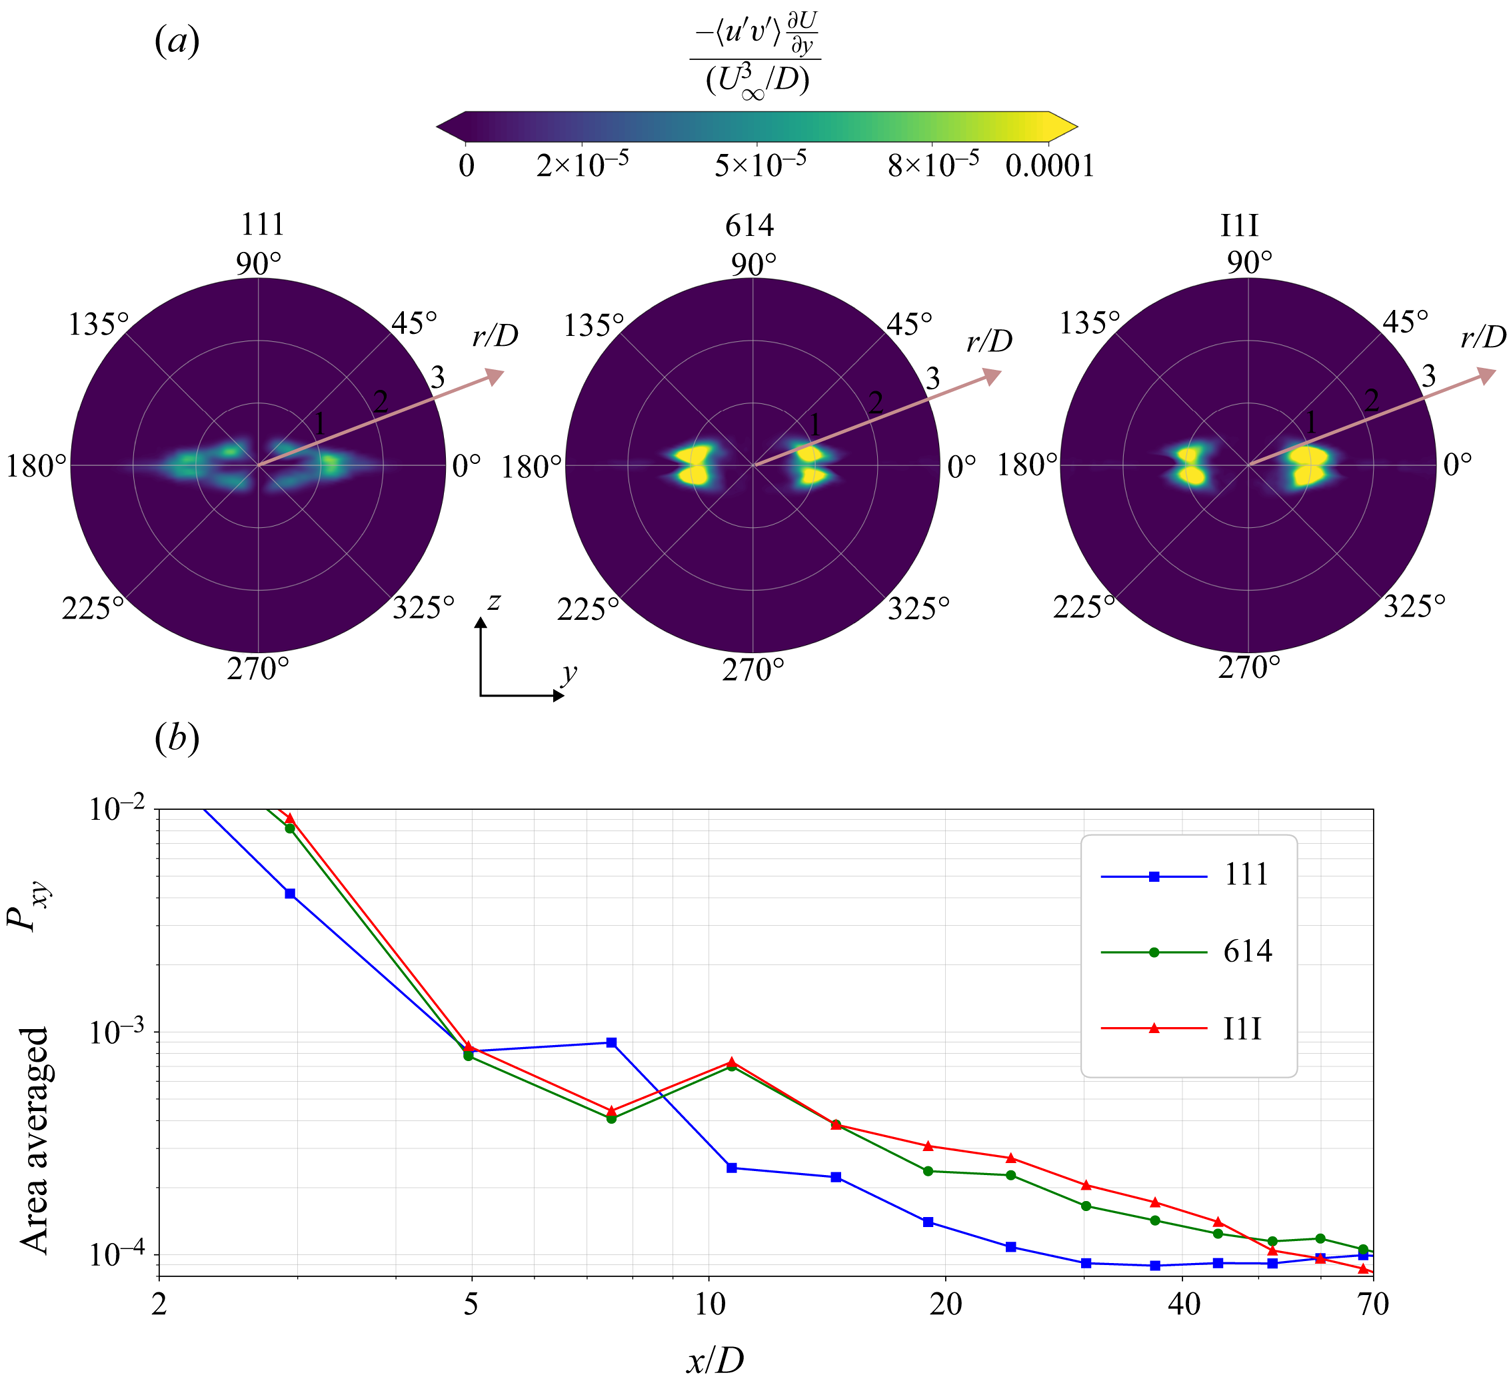
Area-averaged values of the lateral production over a circle of radius  $3D$ are shown in figure 6(b). The lateral production is consistently larger in the 614 and I1I cases over $10 < x/D < 50$ and is as much as twice at some locations.
3.3.2. Energy flux of wake generated unsteady waves
The dispersion relation for internal gravity waves in a stratified non-rotating medium
 \begin{equation} \varOmega = N \cos {\varTheta} , \end{equation}
where  $\varTheta$ is the angle of the phase line with the vertical, limits the maximum allowable frequency to $N$. Since weaker stratification supports a narrower frequency band of wave propagation, 614 and I1I can be expected to allow a smaller wave energy flux to radiate through the pycnocline layer as compared with 111. This is indeed the case as can be seen by the contours of the radial wave flux $\langle p' u_{r} ' \rangle$ in figure 7(a), where it is evident that the wave flux is restricted within the pycnocline layer ( $-2 < z/D < 2$) instead of being radiated away as in 111. Note that the means of the radial velocity and pressure are subtracted when computing the flux so as to discard the component from the steady lee waves.
(a) Radial waveflux contours at  ${x}/{D} = 20$. (b) Total waveflux integrated over rectangular perimeter outside the turbulent wake as a function of streamwise distance.
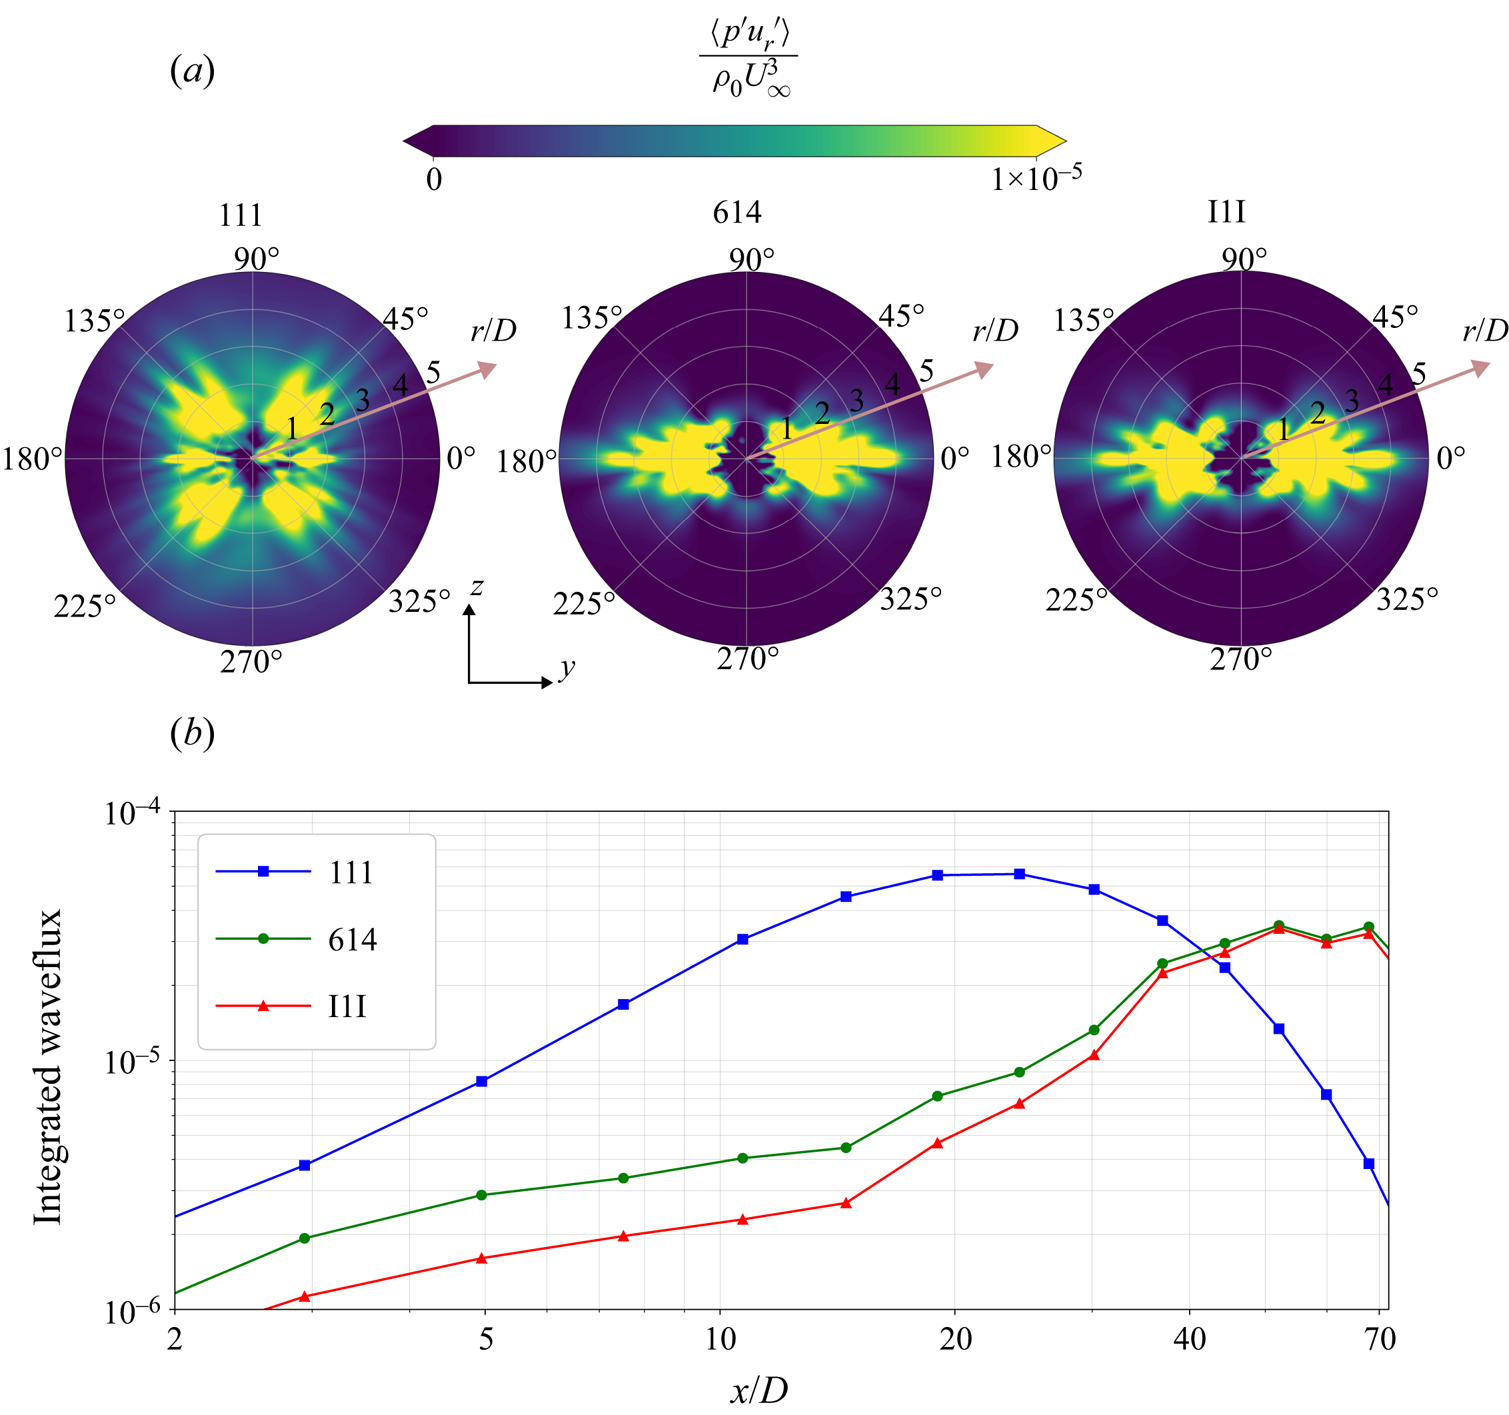
A quantitative comparison among the cases is performed by computing the line integral of the internal wave flux over a rectangular perimeter. Specifically, the integral
 \begin{equation} \oint_{C} \frac{1}{\rho_{0}} \langle {\boldsymbol u}' p' \rangle \boldsymbol{\cdot} {\boldsymbol n} \, {\rm d}l , \end{equation}
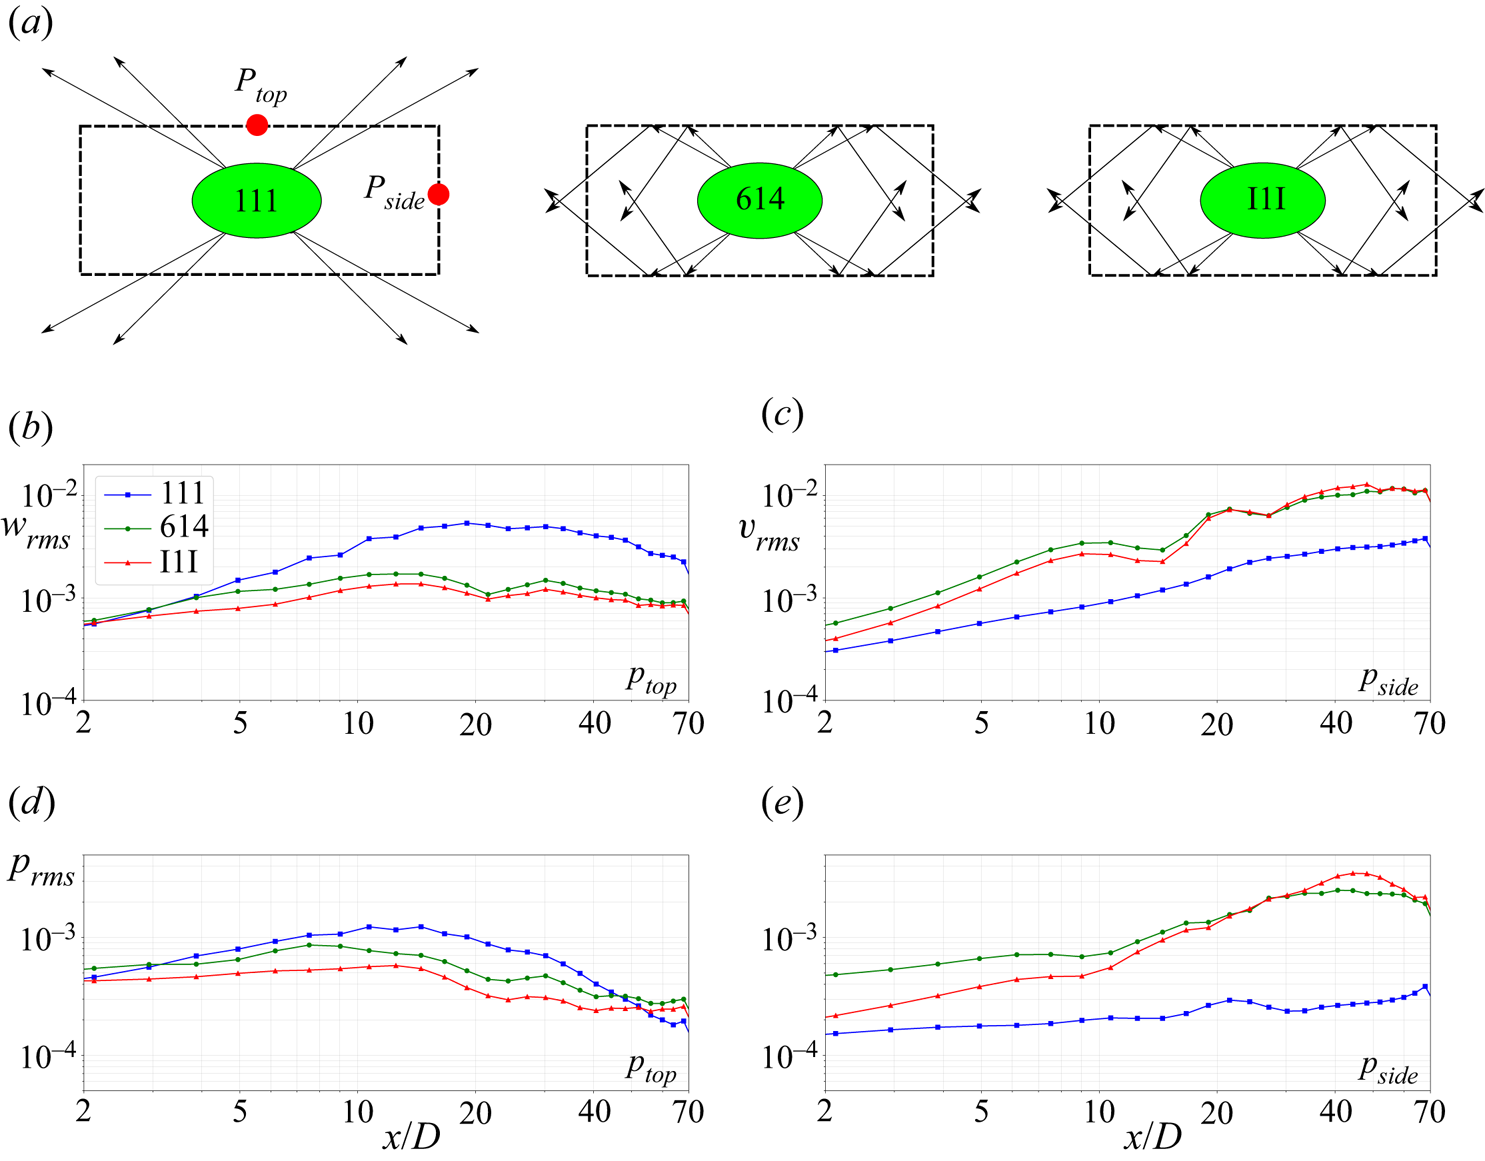
which is a function of  $x/D$, is calculated using a rectangle $C$ with vertical sides at $y/D = \pm 4$ and top/bottom sides at $z/D = \pm 2.5$ (thereby containing the pycnocline layer). Figure 7(b) shows that the flux of wave energy radiated away from the wake of 111 is much larger than 614 and I1I in the early part of the NEQ regime. However, at $x/D = 40$ in the late NEQ stage, the fluxes for 614 and I1I overtake the flux of 111. Both of these trends can be explained by the schematic shown in figure 8(a). The wake generated internal waves that are trapped inside undergo complex wave–wave interaction after getting vertically restricted, resulting in sideward escape of the wave flux. The sideward escape can be verified by using an appropriate scaling argument for the vertical as well as lateral wave flux at the top and side boundaries of the rectangle, respectively,
 \begin{equation} \langle p'w' \rangle \sim p_{rms} w_{rms},\quad \langle p'v' \rangle \sim p_{rms} v_{rms}. \end{equation}
Here, the subscript rms stands for the root mean square value. The values of  $w_{rms}$ at the point $P_{top}$, $v_{rms}$ at the point $P_{side}$ and $p_{rms}$ at $P_{top}$ and $P_{side}$ are shown in figure 8(b–e), respectively. Comparison of figures 8(d) and 8(e) shows that, although pressure fluctuations at the top boundary are highest initially for 111 among all cases and boundaries, the pressure fluctuations for 614 and I1I increase with time at the side boundaries because of the wave trapping and the resulting sideward escape. The velocity fluctuations at the boundaries also show similar trends. The sideward escape of the wave energy takes some time to manifest which, in the simulation frame, translates to streamwise distance, hence causing the slight delay in the increase of integrated wave flux for 614 and I1I. Figure 8(b–e) is consistent with the following result: most of the wave flux for 614 and I1I that escapes the wake core does so in the form of lateral wave flux $\langle p'v' \rangle$ unlike 111 where the vertical wave flux $\langle p'w' \rangle$ is the major contributor.
(a) Schematic showing trapping of internal waves for 614 and I1I compared with 111, (b)  $w_{rms}$ at $P_{top}$, (c) $v_{rms}$ at $P_{side}$, (d) $p_{rms}$ at $P_{top}$, (e) $p_{rms}$ at $P_{side}$.
4. Centred vs shifted nonlinear stratifications
4.1. Taylor–Goldstein equation and Kelvin wake waves
In cases involving pycnoclines, there is a family of steady waves which resemble a Kelvin ship wave pattern, on horizontal planes inside the pycnocline layer. Intuitively, a stratification profile with a large central value of buoyancy frequency ( $Fr \leq O(1)$) that changes rapidly in the vertical (over $\delta /D \leq O(1)$) to a small value at the edges can be thought of as a smoothed density jump and thus one can expect a pattern resembling that generated on the air–water interface by a moving ship. Both centred and shifted stratification profiles show Kelvin wake wave patterns. However, as demonstrated here, the wake wave structure differs qualitatively from the centred 614 wake when the stratification profile is shifted with respect to the disk centre, as in $614-$ and $614+$ .
The dispersion relation of air–water surface gravity waves leads to the waveforms of air–water Kelvin ship waves. To obtain an appropriate dispersion relation for the nonlinear continuously stratified profiles, the Taylor–Goldstein equation is numerically solved
 \begin{equation} \frac{{\rm d}^{2} \phi (z)}{{\rm d} z^{2}} + k^{2} \left(\frac{N^{2}(z)}{\varOmega^{2}} - 1\right)\phi (z) = 0. \end{equation}
Here,  $\phi (z)$ is the vertical displacement eigenfunction, and $k$ and $\varOmega (k)$ are the wavenumber and angular frequency corresponding to the dispersion relation. The Taylor–Goldstein equation is numerically solved as an eigenvalue problem for $\phi (z)$ by treating $\varOmega$ as an eigenvalue and $k$ as a parameter, e.g. Robey (Reference Robey1997). The boundary conditions used are
 \begin{equation} \phi(z={-}L_{r}) = \phi(z=L_{r}) = 0. \end{equation}
Also, based on Sturm–Liouville theory, the eigenfunctions are normalized using
 \begin{equation} \int_{z={-}L_{r}}^{z=L_{r}} \phi_{m} N^{2}(z) \phi_{n} \,{\rm d}z = \delta_{mn}. \end{equation}
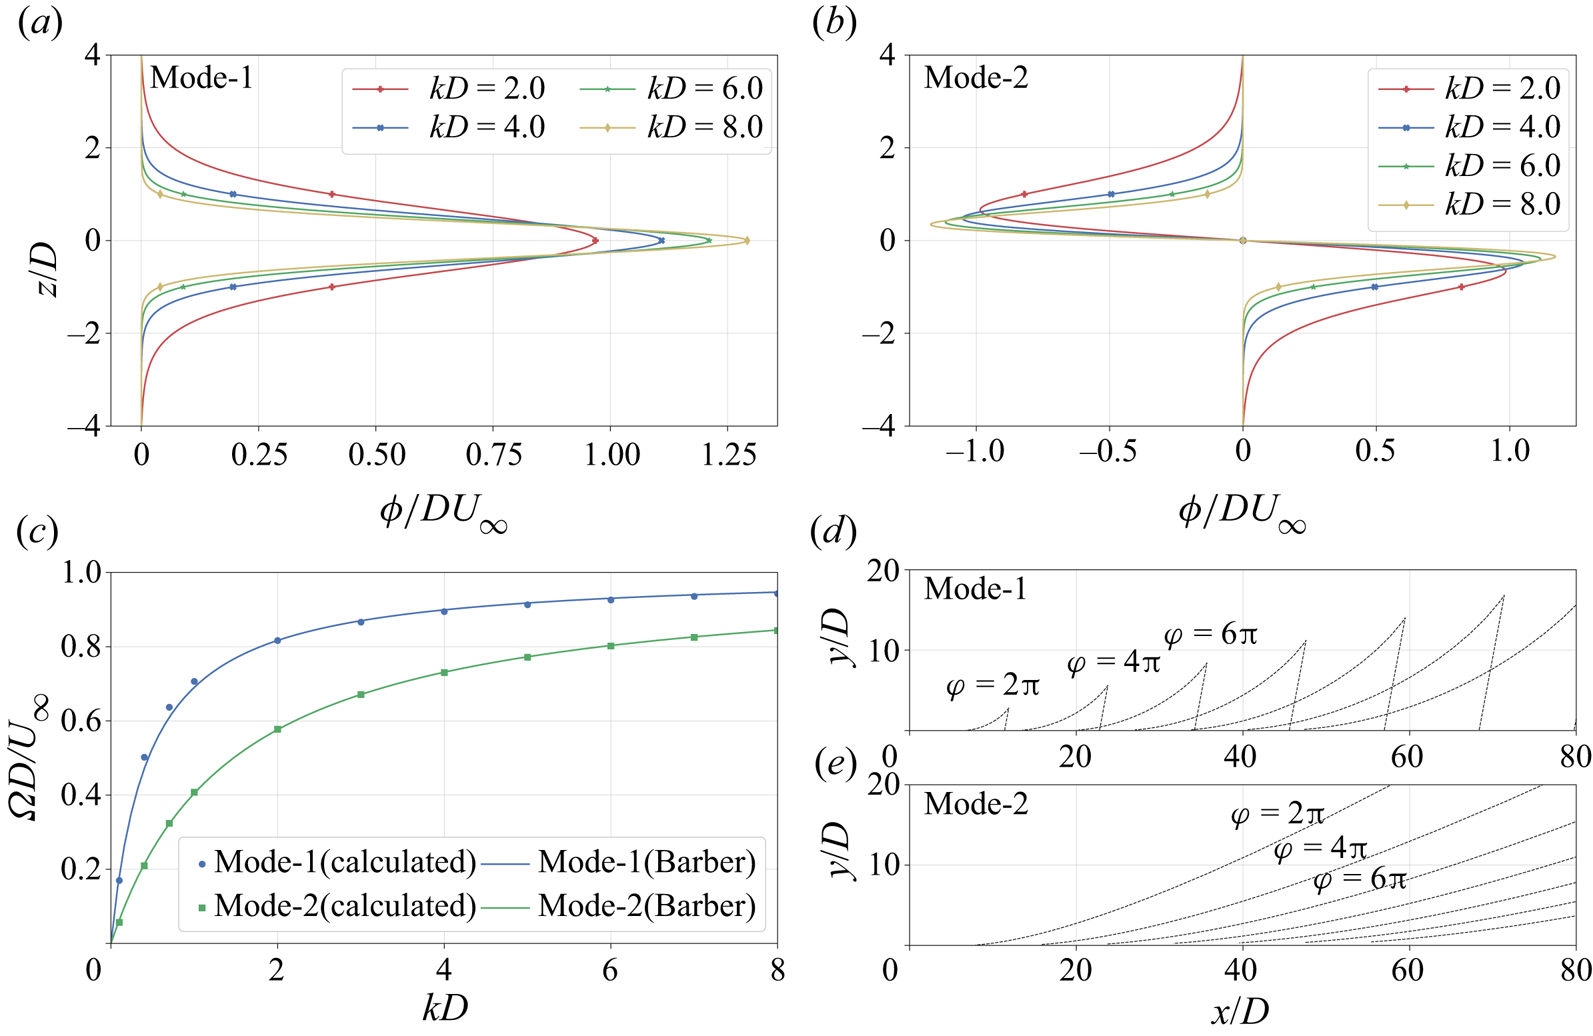
 Figures 9(a) and 9(b), respectively, show the mode 1 and mode 2 eigenfunctions for different values of  $k$. The numerically calculated dispersion relation is also compared in figure 9(c) with the approximation given by Barber (Reference Barber1993)
 \begin{equation} \varOmega(k) = \frac{c_{p_{0}}k}{1 + \dfrac{c_{p_{0}}k}{N_{max}}}. \end{equation}
Here,  $c_{p_{0}}$ is the limiting long-wave phase speed of a given mode at $k=0$, which is obtained by extrapolation, i.e. $c_{p_{0}}$ is the slope at the origin of the mode-specific curve in figure 9(c). For the chosen profiles, $c_{p_{0}}/U_{\infty }$ for mode 1 and mode 2 are $2.23$ and $0.68$, respectively. Since (4.4) provides a very good approximation to the dispersion relation, it will be used for the remaining analysis of this section.
(a) Mode 1 and (b) mode 2 eigenfunctions for different values of wavenumber in (4.1). (c) Numerically calculated dispersion relation compared with approximation given by Barber (Reference Barber1993). (d) Mode 1 and (e) mode 2 waveforms as calculated using (4.5a,b).
Using the dispersion relation, phase and group velocities associated with each mode can be calculated using  $c_{p} = \varOmega / k$ and $c_{g} = {\rm d}\varOmega / {\rm d}k$, and then substituted in the expressions given by Keller & Munk (Reference Keller and Munk1970) to obtain the modal wave patterns corresponding to each eigenfunction
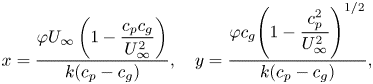 \begin{equation} x = \dfrac{\varphi U_{\infty} \left(1 - \dfrac{c_{p} c_{g}}{U_{\infty}^{2}}\right)}{k(c_{p}-c_{g})},\quad y = \dfrac{\varphi c_{g} \Bigg(1 - \dfrac{c_{p}^{2}}{U_{\infty}^{2}}\Bigg)^{{1}/{2}}}{k(c_{p}-c_{g})} , \end{equation}
where  $(x,y)$ corresponds to a locus of points on the horizontal plane parametrically given in terms of $k$ for a constant value of phase, $\varphi$. Figures 9(d) and 9(e) respectively show mode 1 and mode 2 wave patterns, plotted using (4.5a,b).
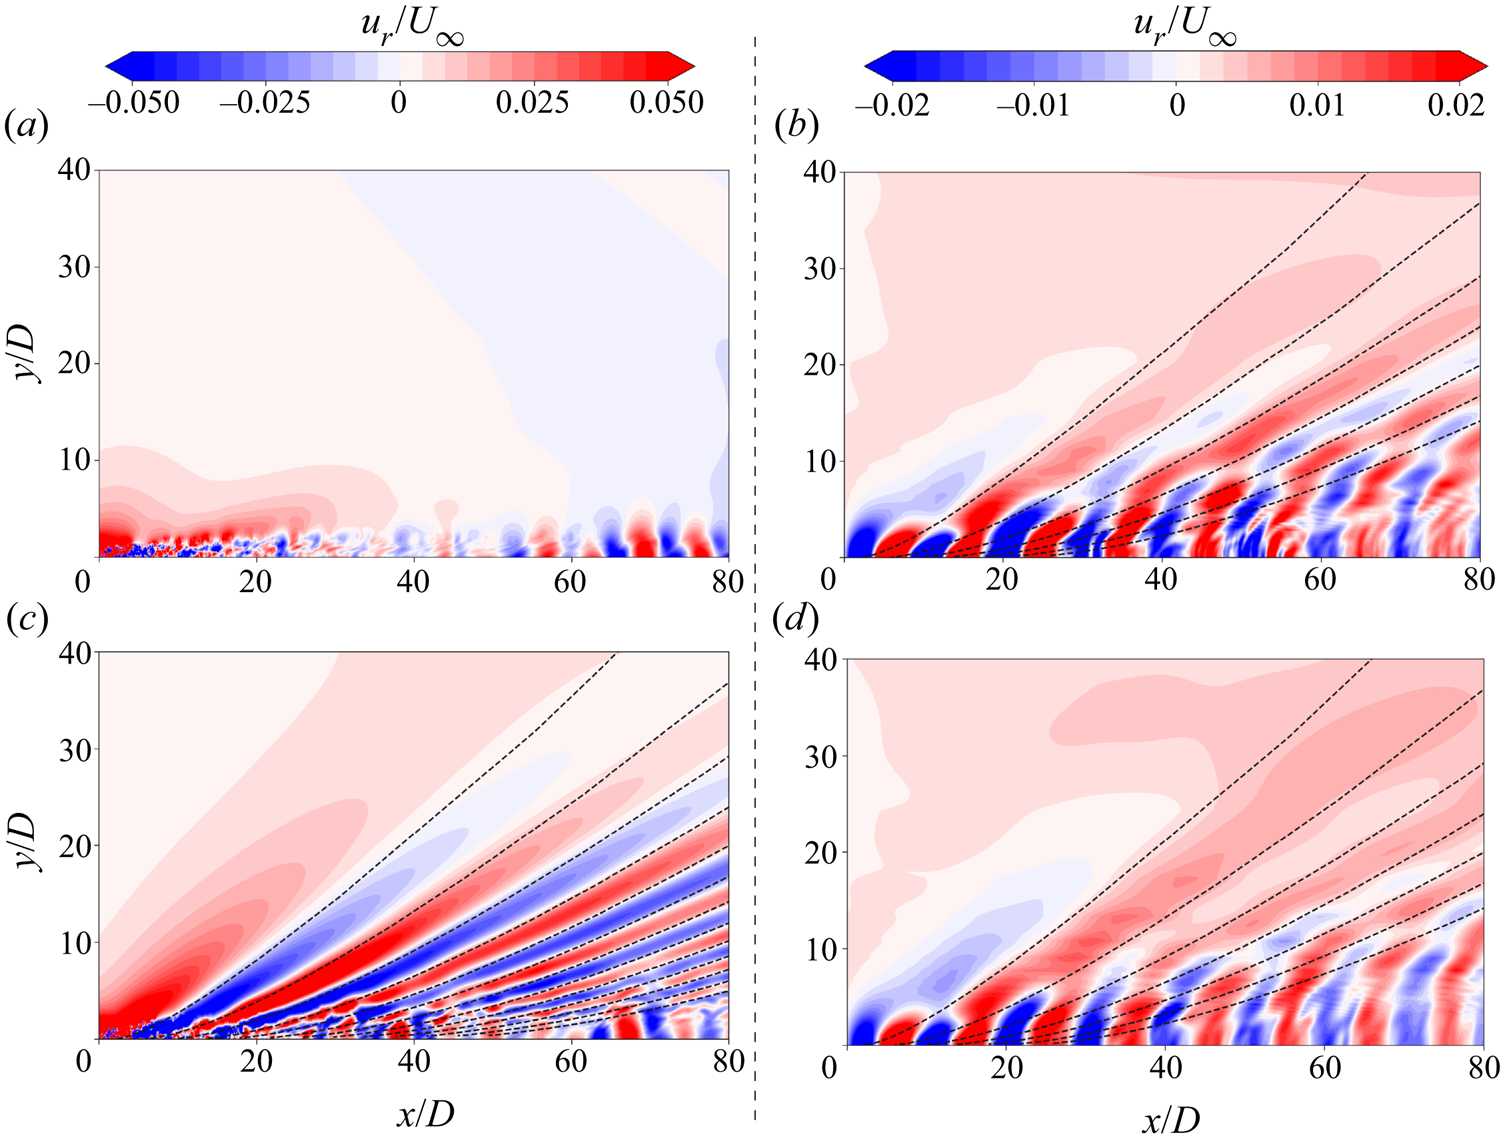
Figure 10 shows the instantaneous radial velocity contours for 111, 614,  $614-$ and $614+$ plotted on a half-horizontal plane passing through the respective pycnocline centre. (For 111, the plot is on $\theta = 0^{\circ }$ plane.) The waves in 614 have constant-phase lines which resemble mode 2 (shown earlier in figure 9e) but not mode 1. In contrast, the phase lines for $614-$ and $614+$ are more complex. In the region $0 < y/D < 10$ they resemble the mode 1 pattern of figure 9(d) but, for $y/D > 10$, they resemble the mode 2 pattern. The manifestation of any mode by a disturbance in the pycnocline layer depends on the location of the disturbance with respect to the pycnocline layer. In 614, the disk centre travels along the centre of the pycnocline layer to displace fluid symmetrically in the upward and downward directions, corresponding to the antisymmetric mode 2 eigenfunction for displacement and therefore generates mode 2 waves. Any vertical offset from the pycnocline centre modifies the antisymmetric pattern of the displacement so as to also involve some contribution from the mode 1 waveform. The presence of a mode 2 wave pattern in the central region of the lateral plane and a mode 1 pattern otherwise is in agreement with the visualizations in the experiment of Robey (Reference Robey1997). For profile $614+$, the contours look similar to that of $614-$ but with slightly lower intensity because of the disk being further away from the centre of the pycnocline. (Note that the wave pattern for I1I is the same as that of 614 because they have the same hyperbolic tangent function modelling the nonlinearity.)
Instantaneous contours of radial velocity on a half-pycnocline-centre plane at  $T = 200 D/U_{\infty }$: (a) 111, (b) $614-$, (c) 614 and (d) $614+$. Dashed lines correspond to mode 2 waves which were shown in figure 9(e).
4.2. Distinction between lee waves and Kelvin wake waves
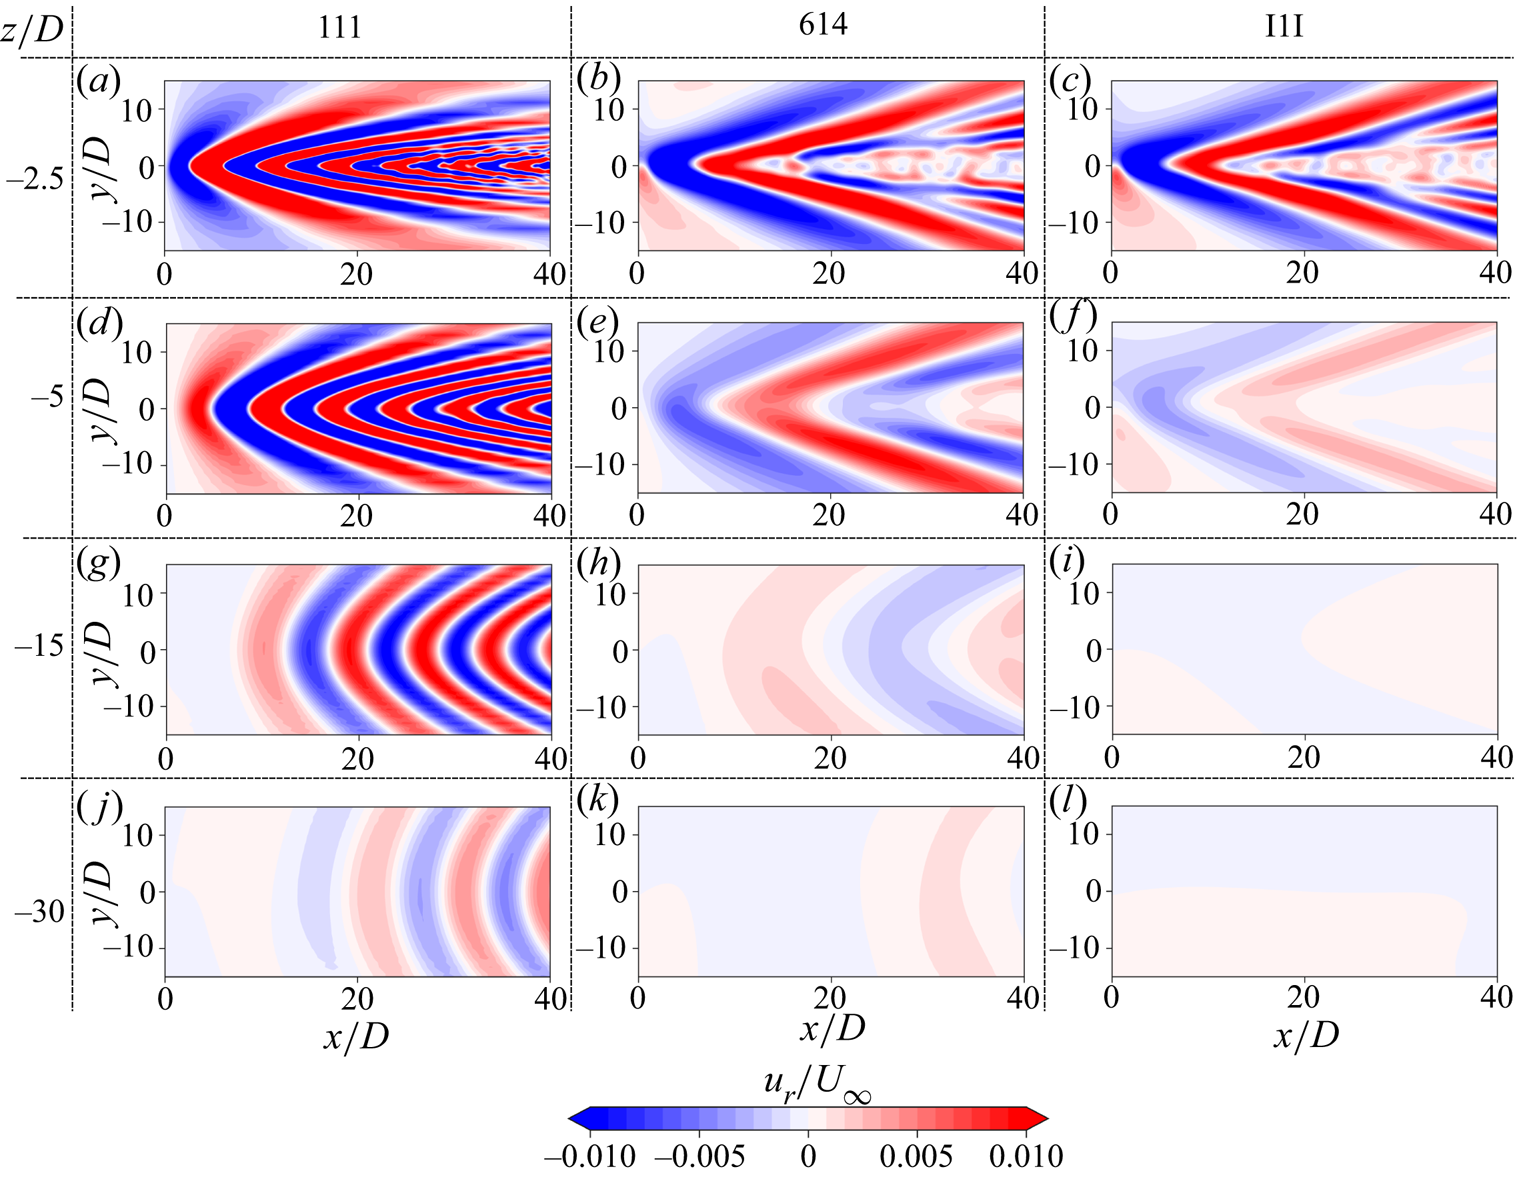
Kelvin wake waves are steady in the frame of reference of the moving body like the lee waves but constitute a new family of waves in terms of their distinct features and appear only when the stratification is non-uniform. Figure 11 shows instantaneous contours of radial velocity on horizontal planes for the centred profiles 111, 614 and I1I at different vertical locations. At  $z/D=-2.5$ (figure 11a–c), the contours have superficial resemblance but they represent fundamentally different waves. For 111, since there is no nonlinear gradient, Kelvin wake waves are not formed on the horizontal plane passing through the domain centreline at $z/D=0$, (e.g. the previously shown figure 10a), and so figure 11(a) has the horizontal imprint of only lee waves. However, for 614 and I1I, the contours at $z/D=-2.5$ in figure 11(b,c) are mostly the imprints of the Kelvin wake waves in figure 10(c). For 614, Kelvin wake waves disappear farther away from the region of nonlinear stratification and the contours transition to those of lee waves corresponding to $Fr=3.74$ (figure 11e,h,k). For I1I, once the Kelvin wake waves disappear, lee waves are not observed since the profile is unstratified outside the pycnocline region (figure 11f,i,l). Turning back to case 111, we see the lee waves weakening as $z/D$ is increased (figure 11d,g,j) but their pattern is still clear at $z/D = -30$.
Instantaneous contours of radial velocity for the centred cases on vertically offset horizontal planes at  $T = 200 D/U_{\infty }$ for 111 (a,d,g,j), 614 (b,e,h,k) and I1I (c, f,i,l). The vertical offset of each plane increases from (a–c) to (j–l).
4.3. Wake generated internal gravity waves
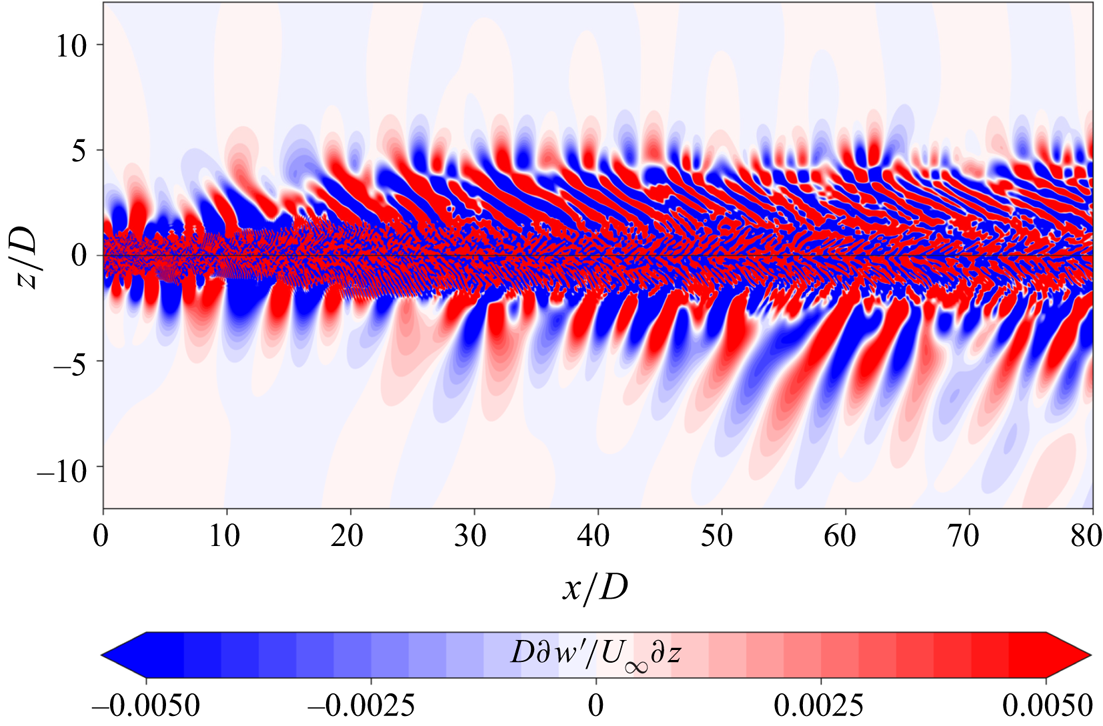
The internal gravity waves generated by the turbulent wake are unsteady. These waves are visualized in figure 12 for case 111 by contours of  $\partial w' / \partial z$ on the $\theta = 90^{\circ }$ vertical plane. The phase lines of the radiated waves in the far field are seen to cluster around a characteristic inclination angle, which suggests a narrow frequency band in the far field according to the dispersion relationship, (3.3), for the intrinsic (in a frame where the background has zero velocity) wave frequency.
Instantaneous contours of vertical derivative of vertical velocity fluctuation at  $T = 200 D/U_{\infty }$ showing wake generated internal gravity waves on the $\theta = 90^{\circ }$ plane for 111. Black lines are inclined at an angle of $39^{\circ }$ with the vertical.
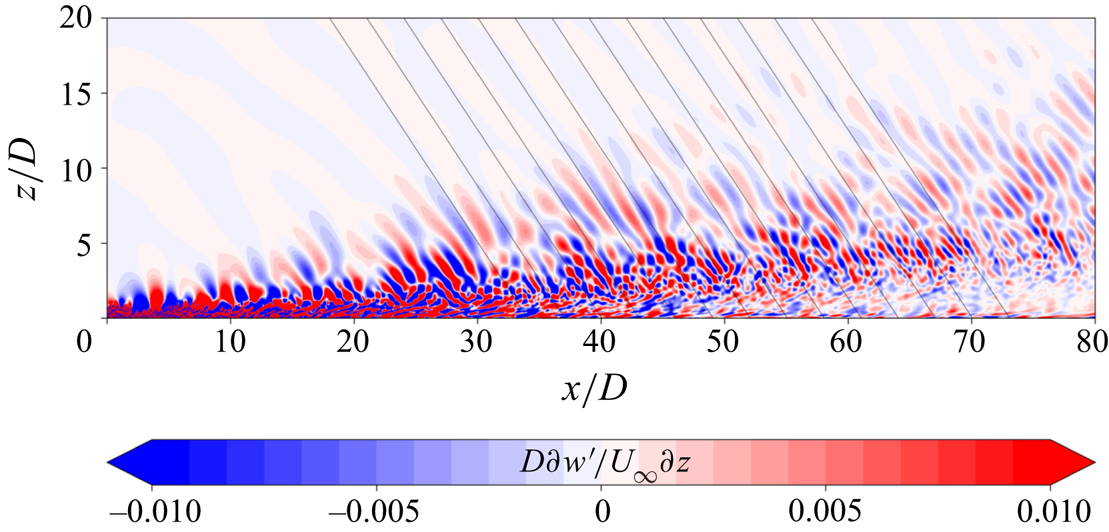
Figure 12 also shows solid black lines plotted at an angle of  $39^{\circ }$ from the vertical, which also seems to be the angle for the waves ( $39^{\circ } \pm 2^{\circ }$). This gives $\varOmega / N = 0.78 \pm 0.03$.
For profile  $614+$, the $\partial w' / \partial z$ contours on the entire vertical plane ( $\theta = 90^{\circ }$ and $270^{\circ }$) are plotted in figure 13. Phase lines with a dominant inclination angle are seen in the negative $z/D$ region where the waves with downward group velocity travel in an entirely linear stratification ( $Fr = 3.74$). The inclination angles in this region of $z/D < 0$ cluster around $\varTheta = 44^{\circ }$, which gives $\varOmega / N \approx 0.72$ (note that $N$ here corresponds to the local $Fr = 3.74$). The upward moving waves generated by the disk enter a region of nonlinear stratification where there is significant small-scale variability. As the waves exit the pycnocline layer from the top, they have near-zero inclination with respect to the vertical, i.e. $\varTheta \approx 0^{\circ }$, which implies that only the high-frequency near- $N$ (
$N$ ( $N$ here again corresponds to the local $Fr = 6.13$) part of the wake generated waves escapes into the upper region of weak stratification. Thus, a significant portion of the wake generated waves is trapped within the pycnocline leading to the small-scale variability in that region.
Instantaneous contours of vertical derivative of vertical velocity fluctuation at  $T = 200 D/U_{\infty }$ showing wake generated internal gravity waves on the $\theta = 90^{\circ }$ and $180^{\circ }$ planes for $614+$.
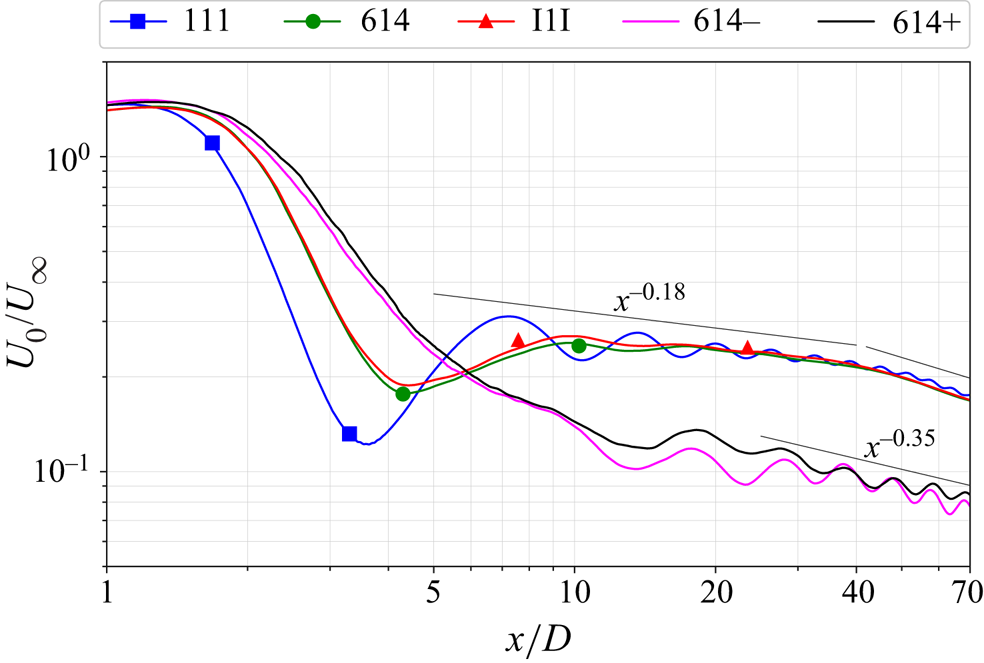
4.4. Wake characteristics
Wake characteristics, namely, the mean defect velocity and TKE, show qualitatively different behaviour for the shifted pycnocline cases  $614-$ and $614+$ relative to the centred 614 profile. Figure 14 compares the streamwise evolution of centreline mean defect velocity ( $U_0/U_\infty$) among all five simulated cases. Recall that, for $614+$, the disk is entirely in the $Fr = 3.74$ region with its upper edge in the pycnocline and, for $614-$, half of the disk is in the $Fr = 6.13$ region and half in the pycnocline. Since, for both $614-$ and $614+$, the disk wake evolves in relatively weaker stratification relative to the $Fr =1$ stratification seen by the disk in 614, there is a faster rate of decay of $U_0$ ( $\propto x^{-0.35}$) in these cases (figure 14). $614-$ has a weaker effective stratification relative to $614+$ and, therefore, has a somewhat lower $U_0$. It is also worth mentioning that, since the simulation domain is not long enough in the streamwise direction, the limited data prevent discerning of the $x^{-0.76}$ decay law in the late Q2-D regime, which is otherwise observed in Spedding (Reference Spedding1997) and can also be deduced from the drag coefficient as shown by Meunier & Spedding (Reference Meunier and Spedding2004).
Evolution of centreline mean defect velocity for the five simulated cases.
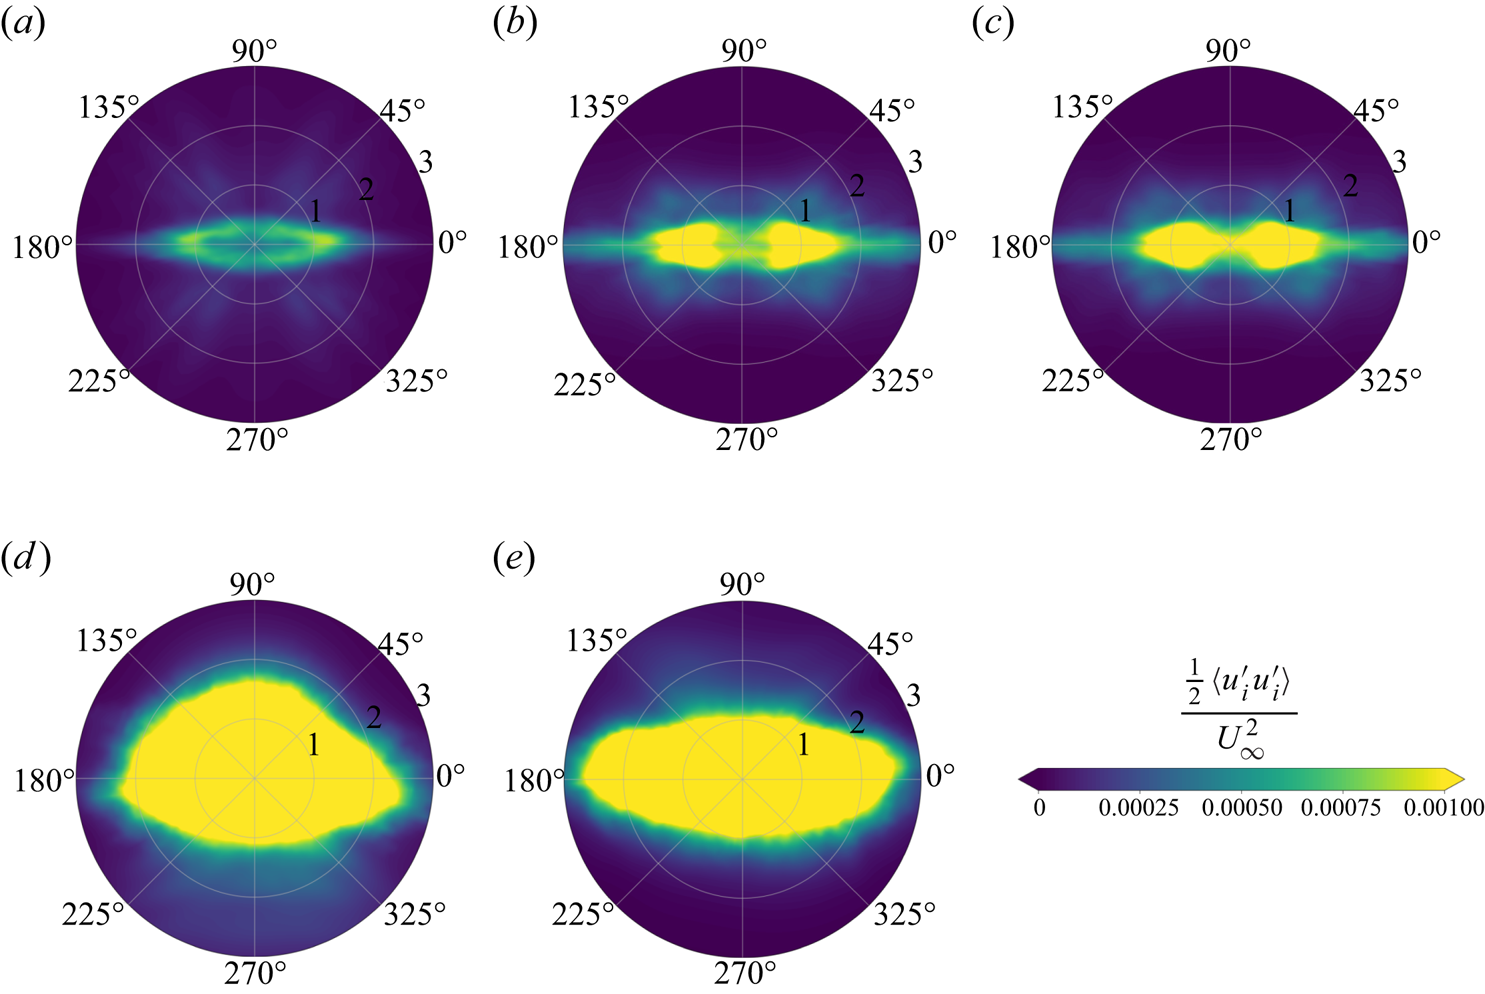
The TKE contours plotted in figure 15 also show that the buoyancy effect is weaker for the shifted profiles;  $614-$ and $614+$ show far higher TKE than the other three cases that have $Fr = 1$ at the disk centre. Since the bottom half of the disk of $614-$ is inside the pycnocline layer, the wake core is not symmetric about the horizontal axis and appears to be somewhat compressed from the bottom where the effective stratification is higher. The TKE profile at $x/D = 20$ is more symmetric for $614+$.
The TKE contours at  $x/D = 20$ for all five cases; (a) 111, (b) 614, (c) I1I, (d) 614−, (e) 614+.
5. Summary and conclusions
We present results from a body-inclusive LES of turbulent wakes in a background stratification which is nonlinear instead of the linear stratification that is typically considered. A disk of diameter  $D$ is chosen as the canonical bluff body, the relative velocity is $U_{\infty }$ and the Reynolds number is $5000$. Four density profiles with a hyperbolic tangent pycnocline are selected along with a standard constant linear stratification profile. The nonlinear profiles are 614 (weak upper stratification with $Fr \approx 6$ and weak lower stratification with $Fr \approx 4$ bounding the pycnocline), I1I (no stratification surrounding pycnocline), $614-$ (614 density profile vertically shifted by $-2.5D$) and $614+$ (614 density profile vertically shifted by $3D$). The thickness of the hyperbolic tangent profile is fixed at $\delta = 2D$. The Froude number $Fr (z) = U_{\infty } /N(z) D$, which is based on local value of buoyancy frequency $N(z)$, varies and takes a minimum value of $1$ for the cases with non-uniform $N(z)$ and is set to 1 in the benchmark constant- $N$ case. The inverse of $Fr(z)$ can be viewed as the local buoyancy frequency, non-dimensionalized with the flow scales, so that non-dimensional $N_{max}$ is the same among all cases. The pycnocline thickness normalized by $D$ is also held constant.
Our main conclusion is that the non-constant  $N$ profile studied here substantially alters both the turbulent wake and the internal wave field. In the first part of the study, results with the centred nonlinear profiles 614 and I1I are compared with the linear profile 111. The mean defect velocity ( $U_0/U_\infty$) in the near wake ( $x/D < 8$) is quite different for 111, which shows an initial oscillation with stronger amplitude than 614 and I1I. This initial oscillation of the defect velocity is the oscillatory modulation of the wake, which has been shown to be an imprint of the steady lee wave field in linear stratification (Pal et al. Reference Pal, Sarkar, Posa and Balaras2017) cases. The I1I case, which is unstratified outside the pycnocline, does not support a steady lee wave in the far field. Nevertheless, its near wake exhibits oscillatory modulation (wavelength is slightly larger than that for 111) because of an evanescent steady wave. In the NEQ regime, which follows the initial oscillation, $U_0/U_\infty$ in all three cases was found to decay as $x^{-0.18}$. Chongsiripinyo & Sarkar (Reference Chongsiripinyo and Sarkar2020) found the same power-law exponent of $-0.18$ in their disk wake, which had an order of magnitude larger ${\it Re} = 5\times 10^4$. It is worth noting that the power-law exponent of $-0.18$ for the disk wake is somewhat lower in magnitude than that the nominal value of $-0.25$ for the NEQ stage of the stratified sphere wake.
The decay law transitions to a faster decay rate at around  $x/D = 45$, suggesting the end of the NEQ regime and beginning of the regime with Q2-D power law. The Q2-D regime was not found by Chongsiripinyo & Sarkar (Reference Chongsiripinyo and Sarkar2020) at their lowest Froude number, $Fr = 2$.
Wakes formed within a pycnocline layer are found here to be more turbulent than in linear stratification given the same value of  $N(z)$ at the disk centre. The TKE for cases 614 and I1I exceeds that for 111 even though $N(z)$ is very similar in the wake core among the three cases. The difference is specially large in the NEQ regime where I1I has approximately twice the TKE of 111. The reasons are as follows. First, the most dominant production term, $P_{xy}$, is higher for 614 and I1I. The turbulent momentum flux is sensitive to the weak stratification, even though the weakening occurs away from and not in the wake core and, therefore, the suppression of the turbulent flux by stabilizing buoyancy is weaker in 614 and I1I. Second, the internal wave energy flux out of the wake, $\langle p'u_{r} ' \rangle$ is smaller for 614 and I1I because there is a range of internal waves that is generated but cannot propagate out vertically since their frequency exceeds the smaller $N$ outside the pycnocline. This wave energy is trapped inside the pycnocline layer. Both of these effects dominate at the beginning of the NEQ regime, resulting in a more turbulent wake. It is worth noting that a side lobe of wave radiation forms in 614 and I1I (centre and left panels of figure 7a), but the overall integrated wave flux in the NEQ regime is still smaller than 111.
Based on the theoretical asymptotic analysis for steady lee waves by Voisin (Reference Voisin2007), the potential flow solution for an oval was used by Ortiz-Tarin et al. (Reference Ortiz-Tarin, Chongsiripinyo and Sarkar2019) to develop an expression for the lee wave field of a spheroid in linear stratification. We find that the disk, along with its separation bubble, can be approximated as a Rankine ovoid and have used the ovoid shape for the potential flow solution instead of an oval. There is excellent agreement between the 111 simulation and the analytical expression with regards to both wavelength and wave amplitude. The 614 simulation has a lee wave field whose wavelength is well predicted by constant- $N$ linear theory upon using $Fr = 6.13$ above and $Fr =3.74$ below the pycnocline to approximate the steady lee wave in those regions. However, the simulation amplitude for 614 is higher than that given by this approximation since the wave-generation region, which includes the pycnocline, has an effective $N$ that is larger than the constant far-field $N$ and, therefore, a stronger wave field.
In the second part of the study, the influence of shifting the pycnocline layer relative to the disk centre is found to be strong. In  $614-$, the upper half of the disk lies in the upper region of weak ( $Fr = 6.13$) linear stratification and, in $614+$, the disk lies entirely in the lower linearly stratified region ( $Fr =3.74$) but still very close to the non-uniform- $N$ region. Overall, the relative shift between pycnocline and disk weakens the buoyancy effect on the mean wake, since the wake feels a weaker effective stratification. Thus, different from the 614 centred case, the defect velocity in the shifted cases does not show an oscillation in $x/D < 8$ and also decays more quickly ( $U_0 \sim x ^{-0.35}$ instead of $x^{-0.18}$) in the NEQ stage. The wakes are also more turbulent in $614-$ and $614+$, as shown by the TKE. The asymmetric placement (with respect to the profile) of the disk in $614-$ is also clearly manifested in its TKE contour where the lower half, which is inside the pycnocline layer, is vertically compressed relative to the upper half.
With regards to the wave field, in addition to the usual steady far-field lee waves and unsteady wake generated waves, the pycnocline also supports the steady Kelvin wake waves. The Kelvin wake waves can be analytically described by solving the Taylor–Goldstein equation as an eigenvalue problem and they take a different form than the lee waves as visualized by figure 11. Furthermore, shifting the disk alters the modal wave form. The dominant waveform in  $614$ corresponds to the mode 2 eigenfunction while $614-$ and $614+$ exhibit a mix of two waveforms, corresponding to mode 1 and mode 2 eigenfunctions. In 614, the disk moves right at the centre of the pycnocline layer, leading to the symmetry property of the mode 2 wave. Any vertical offset from the centre leads to the appearance of mode 1 waves. These modal waveforms are well corroborated by the experiments of Robey (Reference Robey1997) as well as Nicolaou et al. (Reference Nicolaou, Garman and Stevenson1995).
Phase lines of unsteady internal gravity waves in the linearly stratified far field are found to cluster around a characteristic inclination angle which takes the value of  $\theta \approx 39^\circ$ in 111. This result of phase-angle clustering is consistent with several previous studies of wave radiation from a turbulent flow (Sutherland & Linden Reference Sutherland and Linden1998; Dohan & Sutherland Reference Dohan and Sutherland2003; Taylor & Sarkar Reference Taylor and Sarkar2007; Pham et al. Reference Pham, Sarkar and Brucker2009) but it is also worth noting that, as ${\it Re} $ increases, Abdilghanie & Diamessis (Reference Abdilghanie and Diamessis2013) find a broader range of wave phase angles. In case $614+$, the wake generated waves that propagate downward do so in a linear stratification and cluster around $\theta \approx 44^\circ$. The upward propagating waves have to go through the pycnocline layer and only the near- $N$ waves are able to propagate in the weak linear stratification above the pycnocline. Some of the wave energy that reflects off the pycnocline boundaries is trapped and leads to small-scale variability while a fraction escapes through the sides of the wake.
We have explored a limited portion of the parameter space applicable to turbulent wakes in nonlinear background stratification. Depending on the application and the environmental setting, there can be wide variability in the non-dimensional pycnocline thickness ( $\delta /D$), the shape of the non-uniform stratification and the variability of $N(z)$. For pycnoclines with weaker stratification in the centre ( $Fr_{min} > 1$), one can expect a more turbulent wake, stronger wake generated unsteady waves that interact with the non-uniform stratification and an expanded region of fluctuations whose turbulence/wave properties remains to be characterized.
Note that  $Fr_{min}$ can be changed by either changing the conventional Froude number defined using reduced gravity ( $U_{\infty } / \sqrt {\varepsilon g D}$), or by changing the thickness of the pycnocline ( $\delta / D$), as seen from (2.7). For the shifted pycnoclines, the effect of the pycnocline layer on the unsteady internal gravity waves will become less significant as the disk is moved further away from the pycnocline layer, however, the steady lee waves might still be able to interact with the pycnocline layer depending on the local stratification strength. Future examination of this wide parameter space in laboratory experiments as well as simulations (body-inclusive hybrid spatial or temporal as well as the cheaper body-exclusive temporal with a good choice for initial conditions) are required.
Funding
The authors gratefully acknowledge the support of the Office of Naval Research Grant N00014-20-1-2253.
Declaration of interests
The authors report no conflict of interest.


 Open access

